central petroleum limited (asx ctp)
TRANSCRIPT

June 2021 Mike Harrowell |Senior Research Analyst
www.breakawayresearch.com
Company Information
Directors
Significant Shareholders 21 Sep 20
Source: Company 19 May 2019
Company Details
Price Chart to 2 June 2021
Source: ASX
CENTRAL PETROLEUM LIMITED (ASX CTP)
Exploration Momentum to Increase Dramatically
Recommendation: BUY Key Points
• Central Petroleum is selling 50% of its producing assets for A$85M, payable as A$29M cash, which will immediately repay debt, A$21M liabilities assumed by the buyers, NZ Oil and Gas/Cue Petroleum, and A$35M in carried exploration costs. Central retains operatorship, and is able to drive investment spending with a free carried war chest of A$100M on a joint venture basis. NZOG is a substantial company that is highly likely to be supportive and sufficiently liquid.
• The sale is almost value neutral with the loss of future cash flow offset by improved balance sheet and free carried exploration. The exploration plans have been public since 2019, but will be rapidly actioned with funding unlocked by the sell down.
• Base Case Net Present Value is A$0.35/sh: o Existing balance sheet and operations A$0.15/sh o Exploration Projects A$0.20/sh
Exploration news flow from three significant Amadeus wells (Palm Valley Deep, and two Mereenie wells) and the Range production test/BFS will be delivered by December 2021, with the strong likelihood that one or more of these events will significantly impact Central’s share price positively, with the high potential impact Dingo Deep, Dukas and Orange 3 to follow in CY2022. The potential of Central’s portfolio has always been present, but the lack of funding has encouraged the market to ignore it. That will change in the next six months.
Hence, Breakaway Research has a BUY recommendation on CENTRAL PETROLEUM LIMITED with a 12 month price target of A$0.35/sh.
Disclaimer: This Report has been prepared Michael Harrowell who is an authorised representative of Breakaway Research Pty Ltd and issued by Breakaway Research Pty Ltd and the Breakaway Investment Group (AFSL 503622) and remains the property of Breakaway Research Pty Ltd (AFSL 503622). No material contained in this Research may be reproduced or distributed without prior written approval of Breakaway Research Pty Ltd, except as allowed by the Copyright Act. This Research is current at the date of publishing. For updates or further information regarding this research, please contact your advisor. Breakaway Research Pty Ltd (AFSL 503622) has been paid for this research and therefore, Investors should consider this report as only a single factor in making their investment decisions. Please refer to the disclosure section at the end of this document.
ASX Code CTP Share Price (2 June 2021) A$0.115 Ord Shares 724.1m Market Cap A$83.3m Options/Performance Rights 47.7m Market Cap (fully diluted) A$88.8m Cash (31 Mar 2021) A$37.7m Total Debt (31 Mar 2021) A$67.8m Enterprise Value A$118.8m
Chairman Mick McCormack M.D & CEO Leon Devaney Director (Non-Exec) Katherine Hirschfeld Director (Non-Exec) Stuart Baker Director (Non-Exec) Dr Agu Kantsler
Top 20 Shareholders own 30.7% Troy Harry 7.6%
Address Level 7, 369 Ann Street Brisbane, Queensland
Phone +61 7 3181 3800 Web www.centralpetroleum.com.au

Page 2 of 34 Breakaway Research Pty Ltd, ABN: 39 602 490 906 AFSL 503622, 169 Blues Point Road, McMahons Point NSW 2060,
Australia t +61 2 9392 8011
CENTRAL PETROLEUM LIMITED CTP-ASX Share Price A$/sh 0.115 CASH FLOW YE June FY20F FY21F FY22F FY23F Price Target A$/sh 0.350 Revenue from P&L 65.0 59.0 34.2 35.2 Profit and Loss A$M FY20F FY21F FY22F FY23F Add Dingo ToP 3.4 2.5 1.4 0.0 Operating Revenue 73.5 59.0 34.2 35.2 Less MBL Prepay -7.7 -7.7 -5.8 0.0 COGS -61.7 -62.7 -30.3 -31.2 Receipts From Customers 62.9 53.8 32.0 35.2 Corporate -4.8 -4.8 -6.4 -2.5 Payments to Suppliers -39.0 -37.2 -23.0 -19.5 Share Based Payments -1.9 0.0 -1.1 -1.1 Cash Flow from Operations 23.9 16.6 9.0 15.8 EBITDAX 33.4 21.8 11.2 15.8 Exploration -3.3 -9.0 -7.0 -15.0 Exploration -5.3 -9.0 -22.0 -18.0 Interest Received 0.2 0.0 0.0 0.0 D&A -16.3 -15.4 -8.6 -9.2 Financing Costs -5.1 -4.8 -1.4 -0.8 EBIT - Reported 11.7 -2.6 -19.4 -11.4 Taxes Paid 0.0 0.0 0.0 0.0 Total Financial Income -5.8 -4.8 -1.4 -0.8 Net Cash from Operations 15.7 2.8 0.6 -0.1 PBT 5.9 -7.4 20.2 -12.3 PP&E -3.2 -6.0 -3.0 -3.0 Tax Expense 0.0 0.0 0.0 0.0 Investing Activity 4.7 -6.0 26.0 -3.0 NPAT 5.9 -7.4 20.2 -12.3 Free Cash Flow 20.4 -3.2 26.6 -3.1 Minorities 0.0 0.0 0.0 0.0 Issues 0.0 0.0 2.1 5.7 Earned for Ordinary 5.9 -7.4 20.2 -12.3 Dividends 0.0 0.0 0.0 0.0 EPS A cps 0.8 -1.0 -2.8 -1.6 Net Borrowings -11.5 -4.0 -37.0 -1.8 Ordinary shares M 723 724 733 759 Financing Activity -12.3 9.0 -34.9 4.0 Dividend A cps 0.0 0.0 0.0 0.0 FX Difference 0.0 0.0 0.0 0.0 EBITDAX Margin % 45.4% 37.0% 32.7% 44.8% Net Increase in Cash 8.1 5.8 -8.3 0.9 Div Yield 0.0% 0.0% 0.0% 0.0% YE Cash on Hand 25.9 31.7 23.4 24.3 ROIC -5.2% 1.1% 9.2% 5.1% BALANCE SHEET YE June FY20F FY21F FY22F FY23F PER 14.18 -11.27 -4.06 -7.12 Cash 25.9 31.7 23.4 24.3 VALUATION (NPV) FY20F FY21F FY22F FY23F Receivables 6.8 6.8 2.8 2.8 Op. Cash Flow Post Tax 119.0 123.3 67.6 62.8 Inventories 2.6 2.6 2.6 2.6 Exploration 144.2 144.2 144.2 144.2 Prepaid Exploration 0.0 0.0 20.0 17.0 Exploration Asset 0.0 0.0 16.3 14.2 Current Tax Assets 0.0 0.0 0.0 0.0 Tax Benefit 41.7 43.9 37.9 41.6 PP&E 107.8 98.4 36.8 30.6 Cash on hand 25.9 31.7 23.4 24.3 Intangibles 5.3 5.3 5.3 5.3 Debt -70.8 -66.8 -29.8 -28.0 Expln & Mine Devt 8.7 6.7 6.7 6.7 Net Working Capital 4.1 4.1 0.1 0.1 Total Non Current Assets 124.5 113.0 51.4 45.3 Valuation A$M 264.1 280.5 259.8 259.1 Total Assets 159.8 154.1 100.2 91.9 Valuation A$/sh 0.37 0.39 0.35 0.34 Trade Payables 5.3 5.3 5.3 5.3 OPERATING DATA FY20F FY21F FY22F FY23F Prepaid & Other 33.9 39.6 15.0 15.0 Sales by Field TJ/d Borrowings 70.8 66.8 29.8 28.0 Mereenie 50% 16.64 16.50 20.00 22.50 Provisions 47.1 46.9 32.3 32.3 Overlift 0.00 0.00 0.00 0.00 Total Liabilities 158.2 159.9 83.7 81.9 Palm Valley TJ/d 10.90 8.00 8.18 7.44 Net Assets 1.6 -5.8 16.6 10.1 Dingo 2.90 3.32 3.73 4.38 Issued Capital 197.8 197.8 199.9 205.7 Sales by Contract PJ Reserves 27.2 27.2 27.2 27.2 Mereenie (PAWA) 1.40 1.40 0.00 0.00 Retained Profits -223.4 -230.8 -210.6 -222.9 Palm Valley (PAWA) 1.51 1.51 1.51 1.51 Shareholder Equity 1.6 -5.8 16.6 10.0 Dingo 1.06 1.21 1.36 1.60 ASSUMPTIONS FY20F FY21F FY22F FY23F EDL NGD (NT) PL 1.97 1.97 1.97 0.91 Sydney Gas Price A$/GJ 6.48 9.12 11.45 9.58 Macquarie Prepay 1.73 1.73 1.30 0.00 Oil Price US$/bbl 66.37 64.16 63.58 64.48 IPL/AGL 3.65 1.83 3.65 1.46 AUDUSD 0.67 0.75 0.77 0.77 Makeup -0.13 -0.22 0.68 4.93 Tariff to Sydney A$/GJ 4.53 4.59 4.63 4.68 Total 11.82 10.15 11.65 12.53 NT Pipeline Tariff A$/GJ 0.56 0.57 0.57 0.58 Dingo Take or Pay 0.49 0.34 0.19 0.00 Netback to Central A$/GJ 1.95 4.53 6.82 4.90 Sales Volumes Average Realized Prices Oil Sales MMbbl 0.09 0.06 0.07 0.07 Ave Gas Price A$/GL 4.99 5.31 5.38 5.18 Total Gas Sales PJ 11.82 10.15 11.65 12.53 Oil Price A$/bbl 98.93 86.11 82.42 83.38 Revenue A$M Inflation 1.90% 1.30% 0.85% 1.00% Oil Sales 6.1 5.2 5.8 5.6 Tax Rate 30% 30% 30% 30% Gas Sales 59.0 53.9 62.6 64.9 Macquarie Rate 6.10% 5.60% 5.60% 5.60%
Page 3 of 34 Breakaway Research Pty Ltd, ABN: 39 602 490 906 AFSL 503622, 169 Blues Point Road, McMahons Point NSW 2060, Australia t +61 2 9392 8011
What is new since initiation? Plenty!
Overview: Growth driving exploration programs create funding load
Central is seeking dramatically increase the size of the Amadeus operations to support and exploit the development of a gas pipeline from Amadeus to Moomba by
1. Returning Mereenie to its existing full production capacity of 45TJ/d by work-overs at four wells (completed) and drilling two new production wells, one of which should be completed by sell down completion, and the other post completion by the end of the September 2021 quarter.
2. Potentially increasing Amadeus reserves by 344PJ (100% Central) at a combined cost of around A$50M, through drilling Palm Valley Deep, Dingo Deep and Orange 3.
3. Drill the potentially very large Dukas target in 2022 at a 100% JV cost of at least $10M, and probably more, which may or may not be carried by Santos (Santos to decide by 31 July 2021).
Central and Incitec are also seeking to get the Range Project to Final Investment Decision by December 2021, and an estimated cost of A$5-10M (Central share).
To fund this activity, Central has:
1. Been paid A$7.7M from Incitec in January 2020, in compensation for not completing earn-in work by the due date.
2. Presale of 3.5PJ of gas to MBL raising around $13M (Breakaway estimate) in November 2020
3. Sale of 50% of Amadeus production assets (ie Mereenie, Palm Valley and Dingo) for A$85M.
Shrinking to Grow – The Selldown of Existing Production
Shrinking to grow is a strategy is a well accepted strategy for junior resources companies, but one that may seem counterintuitive to some investors. By selling 50% of its Amadeus production assets, Central receives:
1. A$29M on cash, which it intends to use to reduce its debt. On the existing repayment schedule, the debt of A$67.8 M at 30 March 2021 will be A$65.8M by 30 September 2021, and the A$29M will reduce that further to A$36.8M at that time.
2. A$21M in take or pay gas supply obligations assumed by the buyer (NZOG, Cue)
3. A$35M is carried exploration spend, and represents 50% of a total of A$70M to be spent by Central/NZOG, and when grossed for the Macquarie interest in Mereenie, would total A$100M in the Joint Venture tenement spend, covering the second new Mereenie production Well ($10M), Palm Valley Deep (A$20M) and Dingo Deep (A$12M). Within the Central/NZOG JV, the balance remaining would be A$33M more JV drilling before Central has to contribute. Items 1-3 total the A$85M announced sale price.
4. The balance sheet is also improved by the removal of half of the rehabilitation liability (A$16M). This does not form part of the payment calculation but is netted against the A$56M of fixed assets sold.
5. While the interest in operations is halved, taking the FY23 EBITDAX from our estimated A$34M down to A$17M, that fall is partly offset by the Management fee paid by the JV to Central (say A$1Mpa net cash to Central, and the reduces sustaining capex due to the $35M free carry. That means that Central has its cash balance at 30 June 2021 of an estimated A$30M, plus almost A$17M pa of operating cash flow, to chase additional growth opportunities, such as Orange 3.

Page 3 of 34 Breakaway Research Pty Ltd, ABN: 39 602 490 906 AFSL 503622, 169 Blues Point Road, McMahons Point NSW 2060, Australia t +61 2 9392 8011
How the selldown and reinvestment might work…
In this case, Central is selling its 2P Reserves down from 205.4PJ to 100.5PJ, reducing liabilities by A$60M, and having A$35M in drilling free carry withing the JV. The $35M of free carry will more than cover the drilling of the new Mereenie production wells, targeting 40PJ of sales gas (Central share 10PJ which is in current Reserves), and Palm Valley Deep and Dingo Deep, targeting P50 Prospective Resources of 62PJ Central’s share (not currently in Reserves). If these wells are successful, Central share of Reserves would be around 163PJ vs 205PJ before sale.
The company is intending to drill Orange 3 (Central 100%), which has a P50 prospective target of 284PJ. An Orange 3 well is likely to cost $15M if Central pays for 100%, and this would come from the company’s cash resources. If successful, and the P50 is converted into Reserves, Central would have Reserves of 447PJ, more than double its pre-sell down Reserves, and with balance sheet debt and other liabilities halved.
Looking at the sell down through the valuation lens…
If the planned drilling by the JV and on Central’s 100% owned tenements delivers these new reserves, which are all in close proximity to existing production assets and infrastructure, the value of the new Reserves should be the same on a unit basis as the existing Reserves.
Table 1 Scenario describing the transition of valuation based on market value of historical Central Reserves
Pre Sell Down
Post Sell Down
Post Sell Down and Discovery
Issued Shares m 724.1 724.1 724.1 Share Price A$/sh (ave July 2020-May 2021) 0.119 0.127 0.351 Market Cap A$M 86.1 92.0 254.2 Cash A$M 31 March 2021 -37.7 -37.7 -22.7 Debt A$M 67.8 38.8 38.8 Exploration Asset (Farm in Spend) -0.0 -35.0 -16.5 Enterprise Value A$M 116.2 58.1 253.8 Reserves 3P in PJ 205.4 102.7 448.7 Enterprise Value/Reserves A$/GJ 0.57 0.57 0.57 Memo: NPV of Post Tax of Operations A$M 117.1 64.7
Source: Breakaway estimates
The Central share price has been relatively stable over the last six months, averaging A$0.119/sh, +/-2cps.
Before Sell Down
At A$0.119/sh average, Central at March 2021 before selling down had an Enterprise Value of A$116.2M, valuing its 3P Reserves at A$0.57/GJ. If we hold that value constant as the asset base, the balance sheet and the Reserve base changes, we see the generation of value of A$0.35/sh.
Immediately Post Sell Down
Post Sell Down, the Operating Assets and Reserves are halved, as is the Enterprise Value, at A$58.1M, but the improved balance sheet means that the company is worth a cent more that it was pre sale on this analysis. As it happens, the share price rose to A$0.12/sh on the announcement, consistent with these metrics.
We include the Exploration asset of A$35M in the balance sheet, because it represents the discounted value of the future exploration that Central will not have to pay.
Post Sell Down and Discovery (ie P50 Prospective Resources convert to 3P Reserves)
The last column is Post Sell Down and Discovery, assuming discovery of (Central share) an additional 62PJ at Palm Valley/Dingo, and 284PJ at Orange 3. If we value that gas at the same A$0.57/GJ, we get an Enterprise Value of A$253.8M. The Cash has been reduced by the A$15M for the Orange 3 well, and the Exploration Asset has been reduced by the costs of the Mereenie, Palm Valley and Dingo drilling. The result is a market value of A$254M or A$0.351/sh. Clearly this valuation changes if the quantum of the gas discovered is different.

Page 4 of 34 Breakaway Research Pty Ltd, ABN: 39 602 490 906 AFSL 503622, 169 Blues Point Road, McMahons Point NSW 2060, Australia t +61 2 9392 8011
Note that our NPV of the existing operations before sell down was A$117.1M, ie very close to the valuation of the asset in the selldown.
All these valuations ignore the Range Project, which we believe is worth A$90M or A$0.12/sh, and other targets such as the Mamlambo oil target, and Dukas and Zevon gas targets.
Valuation of Central Petroleum – A$0.35/sh up from our previous A$0.34/sh
Table 1 included the valuation of some of the exploration assets assuming all the P50 Prospective Resources were converted to P3 Reserves. That was a scenario, and as stated above, excluded a number of other projects. Our formal valuation of Central is based on the risked valuation of the most prominent projects withing the Central portfolio. Note that there are some projects missing from this list (Ooramina, Zevon).
Table 2 Base case valuation of Central Petroleum at A$0.35/sh, up from our previous estimate of A$0.34/sh
Jun-21 Jun-22 Chg Comment Op. Cash Flow Post Tax 123.3 67.6 -55.7 Sale of 50% of operations Exploration 144.2 144.2 0.0 See Table 3 Exploration Asset (Free Carry) 0.0 16.3 16.3 $35M carry less Tax Benefit 43.9 37.9 -6.1 Reduced by Tax on Asset Sale Cash on hand 31.7 23.4 -8.3 Debt -66.8 -29.8 37.0 Reduced by asset sale, scheduled repayments Net Working Capital 4.1 0.1 -4.0 Valuation A$M 280.5 259.8 -20.7 Valuation A$/sh 0.39 0.35 -0.03 Discount Rate Issued Shares m 724.1 732.5
Source: Breakaway estimates
The valuation assumed the sell down is completed in August 2021, which we believe is highly likely. If the sale is not completed the NPV actually rises, but in our view the likelihood of the market recognising that value falls.
The exciting feature of the sell down is that it provides funding clarity for the drilling of a series of very significant wells that will determine the real value of a number projects in Central’s exploration portfolio. It is the proximity of those significant items of news flow that we expect to drive the market to our price target over the next 12 to 18 months (see Figure 1).
Table 3 Risked valuation of exploration projects
Mereenie Palm
Valley Palm Valley
Deep Dingo Deep
Orange 3
Range Dukas Total
Category 2C 2C P50 P50 P50 2C P50 Reserve/Resource PJ 91 14 75 49 284 270 1315 Central Share 25% 50% 50% 50% 100% 50% 30% Central Share PJ 22.8 6.9 37.5 24.5 284.0 135.0 394.5 905.2 Assessed Risk 50% 70% 30% 30% 30% 80% 10% 30% Risked Share PJ 11.4 4.8 11.3 7.4 85.2 108.0 39.5 267.4 Value A$/GJ 0.50 0.50 0.50 0.50 0.50 0.67 0.30 0.54 Risked Valuation A$M 5.7 2.4 5.6 3.7 42.6 72.4 11.8 144.2
Source: Breakaway estimates of value based on Reserve/Resource estimates sourced from CTP presentation 25 May 2021 for Palm Valley Deep, Dingo Deep, and Orange 3, CTP reserve release24 July 2021 for Mereenie and Palm Valley 2C, CTP release of 12 August 2019 for Range, and the April 2017 RISC expert report included in the Scheme information Memorandum of 5 May 2017 for Dukas
The sources for the Reserve/Resource data in Table 3 are detailed in the source note. The valuation of A$0.50/GJ is based on the implied market value for Central of A$0.57/GJ in Table 1, less an adjustment for the additional capital required to bring the wells on line.
For Range we believe the value should be close to A$90M (see Table 5) and then applied a risk factor to that valuation. The A$0.67/GJ would generate an unrisked valuation of A$90M from 135PJ.
We have used a lower valuation 0f A$0.30/GJ for Dukas, because of its depth, and technical difficulty of drilling wells into the formation, the presence of helium and nitrogen that may require additional processing

Page 5 of 34 Breakaway Research Pty Ltd, ABN: 39 602 490 906 AFSL 503622, 169 Blues Point Road, McMahons Point NSW 2060, Australia t +61 2 9392 8011
plant, and the likelihood it will stand on its own rather than be integrated into Central’s existing Amadeus operation.
Timing of Exploration and Potential Exploration Success
Figure 1 Central Petroleum’s Activity Schedule for the Next Two Years – Dukas is expected in CY2022
Source: CTP presentation 25 May 2021
Returning Mereenie to 45TJ/d is well in hand and will be completed in the September 2021 quarter.
Palm Valley Deep and Dingo Deep wells are approved, subject to the sell down being completed, and are expected to be completed by June 2022.
The Orange 3 well is yet to be sanctioned, and is presently dependent on the sell down completing. If the selldown completes, Central expect to drill the well in the second half of CY2022.
Returning Mereenie JV to 45TJ/day
The program detailed in a release of 22 October 2020 to return Mereenie to 45TJ/d, and is heading towards completion. The program is expected to add 40PJ to reserves at a total cost of A$28M (100% basis). Part of this program will be funded by the 3.5PJ MBL contract prepayment plus sell down carry, and includes:
1. Recompletion of four existing wells has been finished at a cost of around A$8M ($2M CTP share)
2. Drilling of two new crestal wells at A$10M each, the first of which started in the June 2021 quarter
Amadeus Growth Program – Proposed in 2019, now partly funded by sell down
Table 4 Aggregate prospective Resources contained in the drilling prospects
Target Unit Permit Interest Low
(P90) Best (P50)
High (P10) Mean
Mamlambo MM bbl L6 100% 7.0 24.0 60.0 29.0 Dingo Deep - Pioneer Formation PJ L7 50% 2.5 8.5 27.5 13.0 Dingo Deep - Areyonga Formation PJ L7 50% 5.0 16.0 44.0 21.5 Palm Valley Deep - Arumbera Form. PJ OL3 50% 13.0 37.5 140.0 61.5 Within the New JV 50% 20.5 62.0 211.5 96.0 Orange 3 - Arumbera Formation PJ EP82 100% 14.0 49.0 148.0 71.0 Orange 3 - Pioneer Formation PJ EP82 100% 15.0 67.0 233.0 107.0 Orange 3 - Areyonga Formation PJ EP82 100% 49.0 168.0 456.0 223.0 Total Orange 3 78.0 284.0 837.0 401.0 Total Gas (100% owned) PJ 98.5 346.0 1048.5 497.0 Contingent 2C Resources PJ Mereenie Stairway (CTP share) PJ OL4/5 25% 54.0
Source: CTP presentation 25 May 2021

Page 6 of 34 Breakaway Research Pty Ltd, ABN: 39 602 490 906 AFSL 503622, 169 Blues Point Road, McMahons Point NSW 2060, Australia t +61 2 9392 8011
Central detailed an invigorated drill program in releases dated 11 and 21 October 2019. COVID 19 and the related gas demand downturn in 2020 resulted in the deferral of some of this program, but it appears to be back on track now. Total program cost is A$51M (CTP presentation 21 October 2019). We expect the Mamlambo oil program is on hold pending a recovery in the oil price, and the focus is on the three more prospective gas targets, namely Dingo Deep, Palm Valley Deep, and Orange 3.
As a result of the asset sale, Dingo Deep and Palm Valley Deep are funded and committed, subject to completion of the selldown, with drilling scheduled to start in October 2021.
Figure 2 Location of Resource growth program drilling
Source: CTP release 21 October 2019
Planned wells in the 2019 program included:
1. Dingo Deep to test the Pioneer reservoir below the currently producing Arumbera reservoir, as well as providing an opportunity to increase production from Arumbera (50% CTP post sell down).
2. Orange 3 targeting Arumbera and Pioneer Formations on a 112Km2 anticline, 30Km northwest of Dingo (100% CTP). Orange 2 was drilled with mud and flowed gas to surface at 0.4mmscfd from the Arumbera Formation. Orange 3 will be drilled with air to reduce the risk of formation damage.
3. Palm Valley Deep is targeting the Arumbera within the existing production licence. The well offers the possibility of accelerating existing Palm Valley production from the Pacoota Formation. (50% CTP post sell down).
4. Mamlambo is a slim hole targeting a large(6.5Km2) oil prospect in licence L6, 8Km northeast of the Surprise oil field in the Pacoota Sandstone, with a secondary objective in the Lower Stairway Sandstone. (100% CTP).
5. Mereenie Stairway Appraisal will look for gas by perforating up to two existing wells previously used for oil and gas production from other formations. The Stairway Formation has a 2C Resource of 108PJ and this is in addition to the target in Table 1. (25% CTP post sell down).

Page 7 of 34 Breakaway Research Pty Ltd, ABN: 39 602 490 906 AFSL 503622, 169 Blues Point Road, McMahons Point NSW 2060, Australia t +61 2 9392 8011
I
Palm Valley and Dingo Growth Targets
Figure 3 Conceptual targets at Palm Valley and Dingo. Stepout targets combined with low risk production options
Source: CTP presentation 25 May 2021
These are very smart wells with primary targets in deeper, potentially high reward targets, but with low risk secondary targets in higher formations. The combination mean that the wells have a high likelihood of generating a positive return on investment.
Figure 4 Historical success or failure of wells in the respective target formations
Source: CTP 2020 annual report
Both Ooramina 1 and 2 flowed gas, but at uneconomic rates due to low density of fracturing. Gas is present but the key issue is whether the target has sufficient fracturing to create the required permeability.
Page 8 of 34 Breakaway Research Pty Ltd, ABN: 39 602 490 906 AFSL 503622, 169 Blues Point Road, McMahons Point NSW 2060, Australia t +61 2 9392 8011
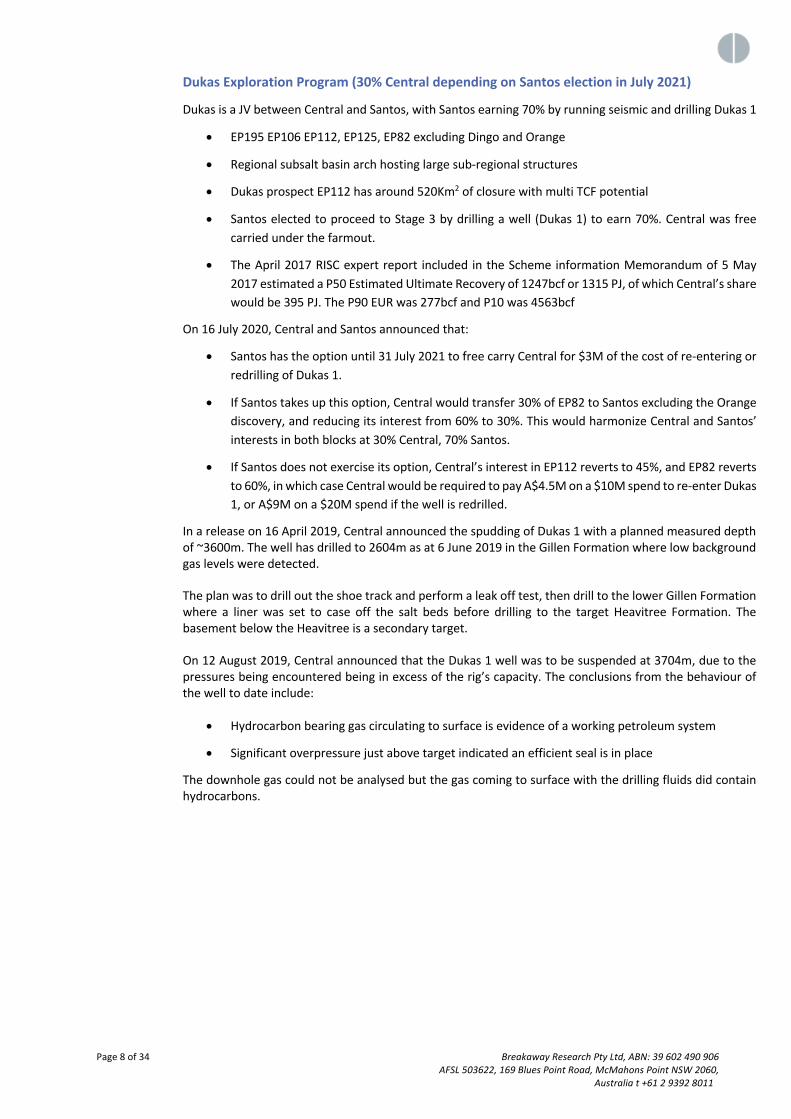
Dukas Exploration Program (30% Central depending on Santos election in July 2021)
Dukas is a JV between Central and Santos, with Santos earning 70% by running seismic and drilling Dukas 1
• EP195 EP106 EP112, EP125, EP82 excluding Dingo and Orange
• Regional subsalt basin arch hosting large sub-regional structures
• Dukas prospect EP112 has around 520Km2 of closure with multi TCF potential
• Santos elected to proceed to Stage 3 by drilling a well (Dukas 1) to earn 70%. Central was free carried under the farmout.
• The April 2017 RISC expert report included in the Scheme information Memorandum of 5 May 2017 estimated a P50 Estimated Ultimate Recovery of 1247bcf or 1315 PJ, of which Central’s share would be 395 PJ. The P90 EUR was 277bcf and P10 was 4563bcf
On 16 July 2020, Central and Santos announced that:
• Santos has the option until 31 July 2021 to free carry Central for $3M of the cost of re-entering or redrilling of Dukas 1.
• If Santos takes up this option, Central would transfer 30% of EP82 to Santos excluding the Orange discovery, and reducing its interest from 60% to 30%. This would harmonize Central and Santos’ interests in both blocks at 30% Central, 70% Santos.
• If Santos does not exercise its option, Central’s interest in EP112 reverts to 45%, and EP82 reverts to 60%, in which case Central would be required to pay A$4.5M on a $10M spend to re-enter Dukas 1, or A$9M on a $20M spend if the well is redrilled.
In a release on 16 April 2019, Central announced the spudding of Dukas 1 with a planned measured depth of ~3600m. The well has drilled to 2604m as at 6 June 2019 in the Gillen Formation where low background gas levels were detected.
The plan was to drill out the shoe track and perform a leak off test, then drill to the lower Gillen Formation where a liner was set to case off the salt beds before drilling to the target Heavitree Formation. The basement below the Heavitree is a secondary target.
On 12 August 2019, Central announced that the Dukas 1 well was to be suspended at 3704m, due to the pressures being encountered being in excess of the rig’s capacity. The conclusions from the behaviour of the well to date include:
• Hydrocarbon bearing gas circulating to surface is evidence of a working petroleum system
• Significant overpressure just above target indicated an efficient seal is in place
The downhole gas could not be analysed but the gas coming to surface with the drilling fluids did contain hydrocarbons.
Page 9 of 34 Breakaway Research Pty Ltd, ABN: 39 602 490 906 AFSL 503622, 169 Blues Point Road, McMahons Point NSW 2060, Australia t +61 2 9392 8011
Figure 5 Southern Amadeus JV with Santos (Dukas is the large structure in EP112)
Source: Scheme IM p246, RISC expert report 17 April 2017
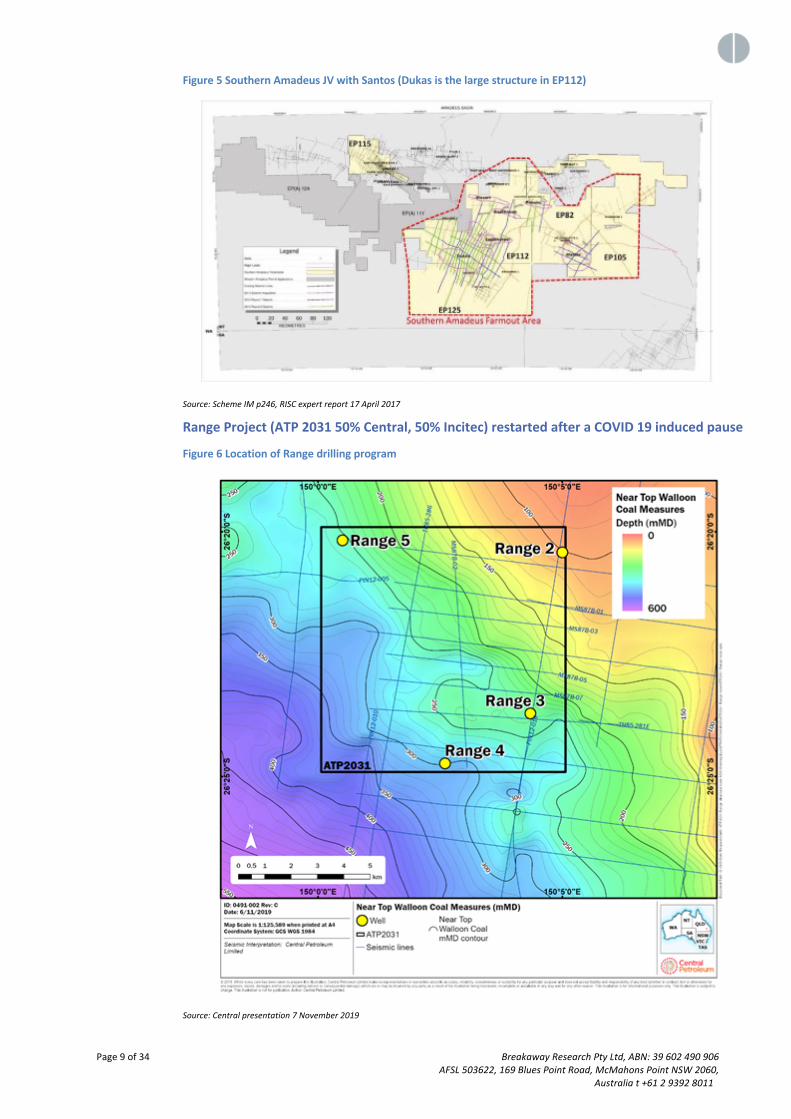
Range Project (ATP 2031 50% Central, 50% Incitec) restarted after a COVID 19 induced pause
Figure 6 Location of Range drilling program
Source: Central presentation 7 November 2019

Page 10 of 34 Breakaway Research Pty Ltd, ABN: 39 602 490 906 AFSL 503622, 169 Blues Point Road, McMahons Point NSW 2060, Australia t +61 2 9392 8011
• Central 50% Incitec Pivot 50%
• Incitec farm in plan comprised nine test wells and one production test for a total of A$20M funded by Incitec, of which 4-5 wells were committed (release 21 June 2019) to be complete 8 weeks from the end of June 2019.
• 2C Resources of 270PJ (Central share 135PJ) reported in August 2019 on completion of a 4 well program (Range 2-5), using slim core drilling with holed being plugged and abandoned after testing. These wells would be too small to be production wells.
• Granted 29 Aug 2018
• 77Km2 acreage
• Surrounded by QGC, Arrow, Australia Pacific LNG
A production pilot well was planned for early 2020 to demonstrate gas flows to surface and accelerate a decision to invest in a production facility and infrastructure. The well was delayed due to COVID 19.
On 3 November 2020, Central and IPL announced that they would restart activities required to reach Final Investment Decision (FID) by December 2021, and delivery of gas to market in 2023, subject to ongoing evaluation outcomes. This requires:
• Completion of a 3 well appraisal program with wells 200m apart to convert the existing 270PJ of 2C Resources announced in August 2019 into Reserves. Breakaway estimated this program will cost $10M (Central share A$5M).
• Obtaining necessary approvals and permits for the project to proceed with a pilot plant
• Completion of initial production infrastructure (possibly supplied by a utility or offtaker)
The original proposal in 2018 was targeting 15-20PJ/yr production requiring 143 wells over the life of the field, delivering gas into the Roma-Brisbane Gas Pipeline. The Wallumbilla Hub is 100Km from Range, and the nearest pipeline to Wallumbilla is around 30Km.
The project is likely to need additional funds for connecting infrastructure, and it may be that these funds are provided by offtake or infrastructure partners, similar to the approach taken by Senex.
On 1 January 2020, Central received A$7.7M from Incitec. Incitec had an obligation to spend A$20M on the Range project by 31 December 2019, and had fallen short by that amount, hence the make up payment to Central. These funds will be used to pay for Central’s share of the Range spend. We expect those funds will be sufficient to cover Central’s costs to completion of the pilot plant.
On 25 January 2021, Central announced that Silver City Drilling had been contracted to drill three appraisal wells starting in April 2021. These pilot wells run test over a number of months which will feed into the Bankable Feasibility Study and Final Investment Decision.
By 13 May 2021, Range 6 (drilling time 10 days), Range 7 (drilling time 6 days), and Range 8 (drilling time 15 days) had been completed. Once the surface works are completed the three will operate for three months, generating test data for the Bankable Feasibility Study and the Final Investment Decision.

Page 11 of 34 Breakaway Research Pty Ltd, ABN: 39 602 490 906 AFSL 503622, 169 Blues Point Road, McMahons Point NSW 2060, Australia t +61 2 9392 8011
Figure 7 Location of pilot program wells
Source: CTP release 12 April 2021
Valuation of Range appears to be around A$90M
Two close comparables to the Range project are two specialist companies, State Gas (ASX:GAS) and Senex (ASX:SXY) whose only projects are gas developments in Queensland
Senex only assets are cash and its 100% interest in Atlas, Roma North, and Roma North West.
State Gas’ sole asset is the PL231 exploration project, which is likely to report a Resource in 2021, but has no Reserves or Resources at present.
Ironbark was traded in May 2019 for A$231M between related companies (Origin and APLNG, in which Origin is part shareholder and operator). Origin paid A$660M in May 2009 for what it thought was 1150PJ of 3P Reserves. On those reserves, Origin was paying A$0.57/GJ undeveloped, which is more consistent with our preferred price of A$0.67/GJ. The 2019 price of A$231M for the current 129PJ of 2P Reserves is A$1.79/GJ.

Page 12 of 34 Breakaway Research Pty Ltd, ABN: 39 602 490 906 AFSL 503622, 169 Blues Point Road, McMahons Point NSW 2060, Australia t +61 2 9392 8011
Figure 8 Location of Range vs comparisons Atlas and Ironbark
Source: Central release 21 August 2019
In Table 5, we start the valuation process with the reported sale price of Ironbark of A$231M, setting a price on 2P Reserves of A$1.79/GJ. However, given the price was set on at A$0.57/GJ on expectations of a Reserve of 1150PJ, we believe the lower number is closer to the mark.
The market valuation of Senex is closer to A$0.67/GJ and would generate a value of Centrals share of A$90M.
While a Resource or Reserve has not been released by State Gas, it is trading at around that A$90M.
Table 5 Valuation of Project Range 2C Resources at A$90M or A$0.12/sh unrisked
Range (CTP
Share) Senex State Gas Ironbark
Pre-
development Expanding Pre-
development Pre-
development ASX Code CTP SXY GAS ORG Issued Shares m 1464.2 173.0 Share Price A$/sh 0.36 0.62 Market Cap A$M 527.1 107.3 Cash A$M 58.0 14.4 Other Assets A$M 87.5 Debt A$M 110.0 EV A$M 90-242 491.6 92.9 231 Current Prodn Cap PJ/yr 20.4 EV A$/GJ 2P or 2C 0.67-1.79 0.67 1.79 Gas Reserves PJ 2P 739.0 129 2C (CTP share) 135.00
Source: Project Range data from Central release 12 August 2019, Atlas data excluding valuation from Senex reserve release 31 July 2018, Ironbark data from AFR article on sale to Australia Pacific LNG on 20 Feb 2019.

Page 13 of 34 Breakaway Research Pty Ltd, ABN: 39 602 490 906 AFSL 503622, 169 Blues Point Road, McMahons Point NSW 2060, Australia t +61 2 9392 8011
Financial Model
Our East Coast Gas price formation model assumes that LNG and crude oil prices move in tandem longer term, so the forecast earnings are sensitive to changes in the long term oil price and AUDUSD once the existing contracts roll off.
However, Central is in the process of setting its new contracts, and over the next 12 months, will lock in more of its 2P Reserve. Once the current round of contracting is completed, the company will have less exposure to US$ oil prices, US$ LNG prices or AUDUSD movements. In addition, Central has a number of low priced contracts, and prepaid contracts where gas sales generate zero additional cash. Those contracts will roll off over the next two years, and recontracting which will generate additional growth in cash flow, even in a flat price environment.
At present, +US$10/bbl increase in crude oil adds A$0.045/sh and a 0.10 increase in the AUDUSD decreases NPV by A$0.035/sh.
Table 6 Existing operating earnings support A$0.16/sh of our A$0.35/sh valuation, with exploration projects the rest
Final A$/sh Jun-20 Jun-21 Jun-22 Jun-23 Jun-24 Jun-25 Jun-26 Jun-27 EPS A$/sh 0.008 -0.010 -0.028 -0.016 0.007 0.009 0.009 0.011 PER at A$0.115/sh 14.18 -11.27 -4.06 -7.12 15.45 13.38 12.15 10.19 PER at A$0.35/sh 44.39 -35.28 -12.70 -22.28 48.37 41.90 38.05 31.91 Free Cash Flow A$/sh 0.028 -0.004 0.036 -0.004 0.020 0.021 0.022 0.020 CF/sh at A$0.115/sh 4.08 -25.83 3.17 -28.31 5.85 5.49 5.20 5.64 CF/sh at A$0.35/sh 12.76 -80.84 9.92 -88.63 18.31 17.18 16.27 17.65
Source: Breakaway estimates
With the sell down, and with the fully expensing of a large and volatile exploration spend, the PER does not provide a convincing buy signal. We tend to disregard this as relevant because Central is more of an exploration story, given the significant amount of exploration news to be delivered over the next 18 months.
Table 7 Calculation of WACC – We use the 5.6% WACC. The very low actual beta suggests a WACC of 3.2%
Cost of Equity Central Actual Beta Beta Range 1.60 0.42 Risk free rate (Rf) 1.5% 1.5% Market Risk over Rf 3.6% 3.6% Market premium (Rm) 5.1% 5.1% Cost of Equity 7.3% 3.0% Gearing Gearing D/(D+E) 50.0% 15.0% Gearing E/(D+E) 50.0% 85.0% Nominal WACC Cost of Equity Ke 7.3% 3.0% Cost of Debt Kd 5.6% 5.6% Tax Rate 30.0% 30.0% Weighted Average Cost of Capital 5.61% 3.17% Real WACC Expected Inflation 1.2% 1.2% (1+real) = (1+Ke)*(1+I) 1.04 1.02 Therefore Real WACC 4.3% 1.9% Inflation linked Bond 0.3% 0.3%
Source: Breakaway estimates
Our discount rate in our valuation model is 5.61%. The availability of debt at such a low interest rate (ie 5.6%) is a reflection of how the banks see the gas business, and if Central continues to demonstrate its operation capability, and if the City Gas Prices hold at around current levels, we would expect that the

Page 14 of 34 Breakaway Research Pty Ltd, ABN: 39 602 490 906 AFSL 503622, 169 Blues Point Road, McMahons Point NSW 2060, Australia t +61 2 9392 8011
company would be able to access main street bank debt at lower rates, and the company beta would fall to something closer to other gas and oil producers, ie close to 1.0.
Table 8 Assumptions: Volumes are 100% of the Joint Venture with NZOG (see Central revenue share in last line)
ASSUMPTIONS Jun-20 Jun-21 Jun-22 Jun-23 Jun-24 Jun-25 Jun-26 Jun-27 Sydney Gas Price A$/GJ 6.48 9.12 11.45 9.58 10.61 10.72 10.82 10.91 Sydney Prem to LNG 1.47 1.80 0.00 2.50 2.50 2.50 2.50 2.50 LNG Netback Price A$/GJ 5.01 7.32 11.45 7.08 8.11 8.22 8.32 8.41 Oil Price A$/bbl 98.93 86.11 82.42 83.38 84.33 85.51 86.56 87.49 Oil Price US$/bbl 66.37 64.16 63.58 64.48 65.25 66.02 66.81 67.45 AUDUSD 0.67 0.75 0.77 0.77 0.77 0.77 0.77 0.77 Amadeus to Sydney TariffA$/GJ 4.53 4.59 4.63 4.68 4.73 4.77 4.82 4.87 NT Pipeline Tariff A$/GJ 0.56 0.57 0.57 0.58 0.58 0.59 0.60 0.60 Sydney Price net.to Amadeus A$/GJ 1.95 4.53 6.82 4.90 5.88 5.95 6.00 6.04 Oil Sales MMbbl 0.09 0.06 0.07 0.07 0.06 0.06 0.06 0.05 Total Gas Sales PJ 11.82 10.15 11.65 12.53 12.31 12.06 11.85 11.13 Ave Gas Price A$/GL 4.99 5.31 5.38 5.18 5.83 6.16 6.22 6.28 Revenue A$M Oil Sales 6.09 5.17 5.77 5.56 5.35 5.17 4.99 4.80 Gas Sales 58.96 53.87 62.64 64.90 71.80 74.28 73.73 69.91 Other Customer 0.00 0.00 0.00 0.00 0.00 0.00 0.00 0.00 Total Revenue 65.05 59.04 68.41 70.45 77.15 79.45 78.72 74.71 Central Share 65.05 59.04 34.20 35.23 38.58 39.73 39.36 37.35
Source: Consensus Economics for forecast AUDUSD and oil price, Breakaway estimates
Table 9 Profit and Loss
Accounts in A$M Jun-20 Jun-21 Jun-22 Jun-23 Jun-24 Jun-25 Jun-26 Jun-27 Operating Revenue 65.05 59.04 34.20 35.23 38.58 39.73 39.36 37.35 Other Income 8.46 0.00 0.00 0.00 0.00 0.00 0.00 0.00 Site Opex -25.29 -29.22 -13.18 -13.90 -13.90 -13.87 -13.87 -13.52 Transport Cost -1.10 -1.12 -0.56 -0.26 0.00 0.00 0.00 0.00 Gas Purchases -1.17 0.00 0.00 0.00 0.00 0.00 0.00 0.00 Operating Costs -30.48 -30.34 -13.74 -14.16 -13.90 -13.87 -13.87 -13.52 Corporate OH -4.78 -4.84 -6.44 -2.47 -2.49 -2.51 -2.54 -2.57 Share Based Payments -1.94 -0.04 -1.06 -1.06 -1.06 -1.06 0.00 0.00 Royalty -2.91 -1.99 -1.78 -1.78 -2.29 -2.43 -2.34 -2.51 Palm Valley Bonus 0.00 0.00 0.00 0.00 0.00 0.00 0.00 0.00 EBITDAX 33.40 21.83 11.18 15.77 18.85 19.86 20.61 18.76 Exploration -5.28 -9.00 -15.00 -3.00 -3.00 -3.03 -3.06 -3.09 Orange 3 0.00 0.00 -7.00 -15.00 0.00 0.00 0.00 0.00 EBITDA 28.13 12.83 -10.82 -2.23 15.85 16.83 17.55 15.67 Depreciation -16.26 -15.44 -8.58 -9.21 -9.44 -9.65 -9.89 -7.13 EBIT 11.69 -2.61 -19.40 -11.45 6.41 7.17 7.66 8.54 Interest Costs -4.93 -3.88 -1.37 -0.82 -0.70 -0.51 -0.32 0.22 Financing Costs -0.90 -0.90 0.00 0.00 0.00 0.00 0.00 0.00 PBT 5.87 -7.39 20.23 -12.27 5.71 6.67 7.34 8.76 Tax Expense 0.00 0.00 0.00 0.00 0.00 0.00 0.00 0.00 Earned for Ordinary 5.87 -7.39 20.23 -12.27 5.71 6.67 7.34 8.76 EPS A$/sh 0.01 -0.01 -0.03 -0.02 0.01 0.01 0.01 0.01 Dividend $M 0.00 0.00 0.00 0.00 0.00 0.00 0.00 0.00 Dividend A$/sh 0.000 0.000 0.000 0.000 0.000 0.000 0.000 0.000 Franking 0.0% 0.0% 0.0% 0.0% 0.0% 0.0% 0.0% 0.0% Payout Ratio 0% 0% 0% 0% 0% 0% 0% 0% Shares on Issue 723.3 724.1 732.5 759.1 767.6 776.0 776.0 776.0 Options on Issue M 18.15 18.15 18.15 0.00 0.00 0.00 0.00 0.00
Source: Breakaway estimates
The major driver of improving profits is improving revenues. These are driven by the replacement of low priced historical contracts with higher priced contracts, and some improvement in gas pricing generally.

Page 15 of 34 Breakaway Research Pty Ltd, ABN: 39 602 490 906 AFSL 503622, 169 Blues Point Road, McMahons Point NSW 2060, Australia t +61 2 9392 8011
Table 10 Cash Flow
CASH FLOW Jun-20 Jun-21 Jun-22 Jun-23 Jun-24 Jun-25 Jun-26 Jun-27 Revenue from P&L 65.05 59.04 34.20 35.23 38.58 39.73 39.36 37.35 Add Dingo ToP 3.42 2.47 1.39 0.00 0.00 0.00 0.00 0.00 Less MBL Prepay -7.74 -7.74 -5.82 0.00 0.00 0.00 0.00 0.00 Receipts From Customers 62.95 53.76 31.99 35.23 38.58 39.73 39.36 37.35 Payments to Suppliers -39.03 -37.20 -23.02 -19.46 -19.73 -19.87 -18.75 -18.59 Cash Flow from Operations 23.91 16.55 8.96 15.77 18.85 19.86 20.61 18.76 Exploration -3.28 -9.00 -7.00 -15.00 0.00 0.00 0.00 0.00 Interest Received 0.17 -0.03 -0.02 -0.01 -0.01 -0.02 -0.02 0.34 Financing Costs -5.09 -4.75 -1.35 -0.81 -0.69 -0.49 -0.29 -0.12 Net Cash from Operations 15.73 2.78 0.60 -0.05 18.15 19.35 20.29 18.98 PP&E -3.22 -6.00 -3.00 -3.03 -3.06 -3.09 -3.12 -3.15 Other 0.00 0.00 0.00 0.00 0.00 0.00 0.00 0.00 Sale of Assets 7.79 0.00 29.00 0.00 0.00 0.00 0.00 0.00 Investing Activity 4.68 -6.00 26.00 -3.03 -3.06 -3.09 -3.12 -3.15 Free Cash Flow 20.41 -3.22 26.60 -3.08 15.09 16.26 17.17 15.83 Issues 0.00 0.04 2.11 5.74 2.11 2.11 0.00 0.00 Presales 0.00 13.00 0.00 0.00 0.00 0.00 0.00 0.00 Net Borrowings -11.50 -4.00 -37.00 -1.77 -7.00 -7.00 -7.00 -7.00 Financing Costs -0.79 0.00 0.00 0.00 0.00 0.00 0.00 0.00 Financing Activity -12.30 9.04 -34.89 3.97 -4.89 -4.89 -7.00 -7.00 Net Increase in Cash 8.11 5.81 -8.29 0.88 10.20 11.37 10.17 8.83 YE Cash on Hand 25.92 31.73 23.44 24.32 34.52 45.90 56.06 64.89
Source: Breakaway estimates
The Profit and Loss revenue has to be adjusted for the extra cash from the Dingo contract which includes a Take or Pay provision (ToP), and for the delivery of gas under the Macquarie Bank (MBL) prepayment. Sustaining expenditure spend in the period paid for by the Prepaid Exploration arising from the selldown.
Table 11 Balance Sheet
BALANCE SHEET Jun-20 Jun-21 Jun-22 Jun-23 Jun-24 Jun-25 Jun-26 Jun-27 Cash 25.92 31.73 23.44 24.32 34.52 45.90 56.06 64.89 Receivables 6.77 6.77 2.77 2.77 2.77 2.77 2.77 2.77 Inventories 2.58 2.58 2.58 2.58 2.58 2.58 2.58 2.58 Prepaid Exploration 0.00 0.00 20.00 17.00 14.00 10.97 7.91 4.82 Other 0.00 0.00 0.00 0.00 0.00 0.00 0.00 0.00 Total Current Assets 35.27 41.09 48.79 46.68 53.88 62.22 69.33 75.06 Financial Assets 2.66 2.66 2.66 2.66 2.66 2.66 2.66 2.66 PP&E 107.85 98.40 36.82 30.64 24.26 17.69 10.93 6.95 Intangibles 5.28 5.28 5.28 5.28 5.28 5.28 5.28 5.28 Expln & Mine Devt 8.72 6.69 6.69 6.69 6.69 6.69 6.69 6.69 Total Non Current Assets 124.50 113.02 51.44 45.25 38.88 32.31 25.55 21.57 Total Assets 159.77 154.11 100.23 91.93 92.76 94.53 94.88 96.63 Trade Payables 5.29 5.29 5.29 5.29 5.29 5.29 5.29 5.29 Prepaid & Other 33.86 39.65 15.04 15.04 15.04 15.04 15.04 15.04 Borrowings 70.77 66.77 29.77 28.00 21.00 14.00 7.00 0.00 Leveraged Leases 1.23 1.23 1.23 1.23 1.23 1.23 1.23 1.23 Provisions 47.05 46.94 32.33 32.33 32.33 32.33 32.33 32.33 Total Liabilities 158.19 159.87 83.65 81.88 74.88 67.88 60.88 53.88 Net Assets 1.58 -5.77 16.58 10.05 17.87 26.65 33.99 42.75 Issued Capital 197.78 197.81 199.92 205.67 207.78 209.89 209.89 209.89 Reserves 27.24 27.24 27.24 27.24 27.24 27.24 27.24 27.24 Retained Profits -223.43 -230.82 -210.59 -222.86 -217.14 -210.48 -203.13 -194.38 Shareholder Equity 1.58 -5.77 16.57 10.05 17.87 26.65 33.99 42.75
Source: Breakaway estimates
In FY23, the balance of all the company’s debt falls due. We assume it is refinanced and repaid over 6 year. The Prepaid Costs relate to the Exploration Asset of A$35M generated as part of the sell down, of which $15M is expected to be spent in FY22, so by June 2022, only A$20M remains.
Page 16 of 34 Breakaway Research Pty Ltd, ABN: 39 602 490 906 AFSL 503622, 169 Blues Point Road, McMahons Point NSW 2060, Australia t +61 2 9392 8011
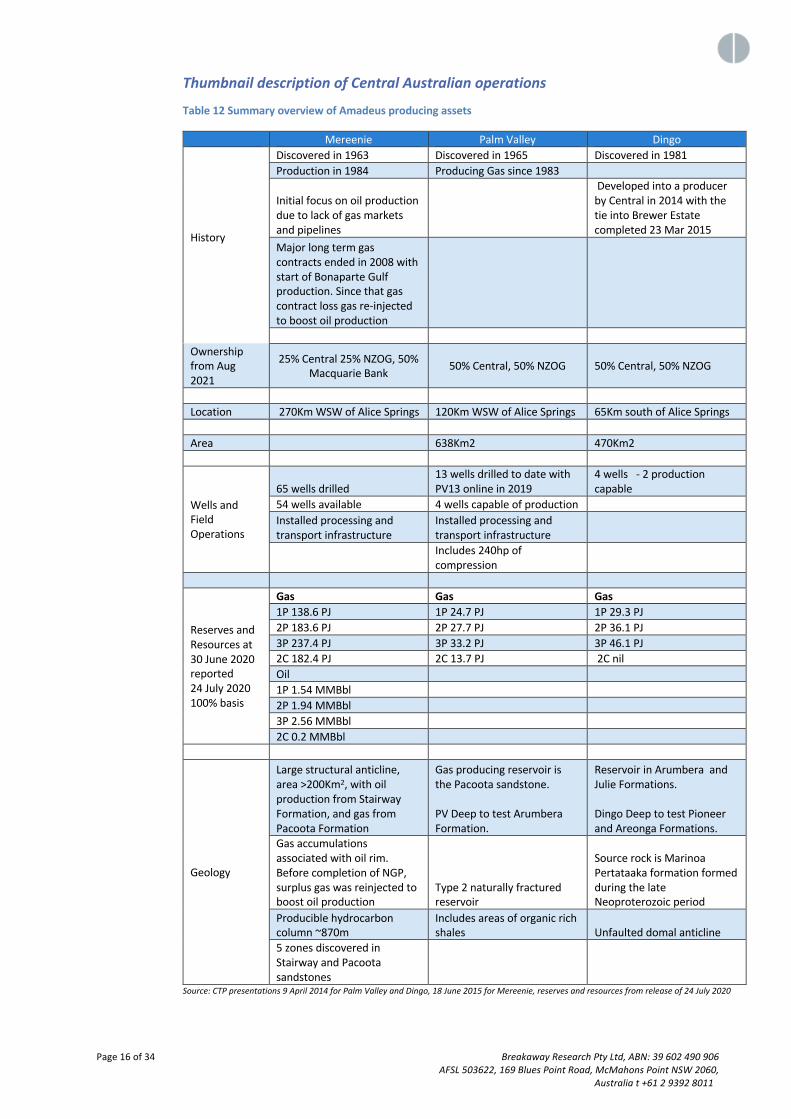
Thumbnail description of Central Australian operations
Table 12 Summary overview of Amadeus producing assets
Mereenie Palm Valley Dingo
History
Discovered in 1963 Discovered in 1965 Discovered in 1981 Production in 1984 Producing Gas since 1983
Initial focus on oil production due to lack of gas markets and pipelines
Developed into a producer by Central in 2014 with the tie into Brewer Estate completed 23 Mar 2015
Major long term gas contracts ended in 2008 with start of Bonaparte Gulf production. Since that gas contract loss gas re-injected to boost oil production
Ownership from Aug 2021
25% Central 25% NZOG, 50% Macquarie Bank 50% Central, 50% NZOG 50% Central, 50% NZOG
Location 270Km WSW of Alice Springs 120Km WSW of Alice Springs 65Km south of Alice Springs Area 638Km2 470Km2
Wells and Field Operations
65 wells drilled 13 wells drilled to date with PV13 online in 2019
4 wells - 2 production capable
54 wells available 4 wells capable of production Installed processing and transport infrastructure
Installed processing and transport infrastructure
Includes 240hp of compression
Reserves and Resources at 30 June 2020 reported 24 July 2020 100% basis
Gas Gas Gas 1P 138.6 PJ 1P 24.7 PJ 1P 29.3 PJ 2P 183.6 PJ 2P 27.7 PJ 2P 36.1 PJ 3P 237.4 PJ 3P 33.2 PJ 3P 46.1 PJ 2C 182.4 PJ 2C 13.7 PJ 2C nil Oil 1P 1.54 MMBbl 2P 1.94 MMBbl 3P 2.56 MMBbl 2C 0.2 MMBbl
Geology
Large structural anticline, area >200Km2, with oil production from Stairway Formation, and gas from Pacoota Formation
Gas producing reservoir is the Pacoota sandstone. PV Deep to test Arumbera Formation.
Reservoir in Arumbera and Julie Formations. Dingo Deep to test Pioneer and Areonga Formations.
Gas accumulations associated with oil rim. Before completion of NGP, surplus gas was reinjected to boost oil production
Type 2 naturally fractured reservoir
Source rock is Marinoa Pertataaka formation formed during the late Neoproterozoic period
Producible hydrocarbon column ~870m
Includes areas of organic rich shales Unfaulted domal anticline
5 zones discovered in Stairway and Pacoota sandstones
Source: CTP presentations 9 April 2014 for Palm Valley and Dingo, 18 June 2015 for Mereenie, reserves and resources from release of 24 July 2020

Page 17 of 34 Breakaway Research Pty Ltd, ABN: 39 602 490 906 AFSL 503622, 169 Blues Point Road, McMahons Point NSW 2060, Australia t +61 2 9392 8011
Gas Sales Agreements
Table 13 Central’s existing gas sales contracts
Annual CY Totals PJ TJ/d 2020 2021 2022 2023 2024 2025 Old Contracts PAWA (NT Generation) 2.68 1.95 1.87 1.85 1.89 Dingo TOP 4.2 1.61 1.61 1.61 1.61 1.61 1.61 New Contracts EDL NGD (NT) 5.4 1.97 1.97 0.81 0.00 0.00 0.00 Macquarie Prepay 4.7 1.73 1.73 0.00 0.00 0.00 0.00 Macquarie Extension 4.7 0.00 0.00 1.75 1.75 0.00 0.00 Macquarie Overlift Recovery 2.2 1.00 0.73 0.73 0.00 0.00 0.00 Incitec 20.0 0.00 0.00 0.00 0.00 0.00 0.00 AGL 2019 Minimum Offtake 10.0 1.83 1.83 0.73 0.00 0.00 0.00 Total CY 10.80 9.80 7.50 5.20 3.50 1.61 AGL 2019 Variable Component 10.0 1.83 1.83 0.73 0.00 0.00 0.00 Total Contracted excl spot sales 12.63 11.63 8.23 5.20 3.50 1.61
Source: Breakaway estimates, based on data sources in commentary below
The table above has been constructed on a calendar year basis to line up with the figure below. The NT Power and Water Authority (PAWA) contract is the difference between the known volumes of the other contracts and volumes in the figure below. To make the table balance, we have had to assume that the AGL 20TJ/day contract announced in December 2019 has a firm commitment of 10TJ/day with the remainder being at AGL’s discretion (ie not firm). That means that in say CY2021, Central has 9.8PJ sales on firm contracts, and 11.6PJ of maximum contracted offtake. In addition, Central has, and is likely to continue to make spot sales for the balance of their offtake.
The major growth driver of Central’s average selling price is the roll off of the low priced contracts (Incitec, and Macquarie’s Prepay, Extension, and Overlift Recovery contracts. We believe all these contracts were priced below market because of the related funding benefits. The Incitec benefit was the free carry exploration at Range, the Macquarie Prepay and Extension provided major funding support, and the Overlift Recovery is at cost of production. As these contracts disappear, we expect Central will have less recourse to that kind of funding, and average selling prices will revert to market levels.
Figure 9 Central’s existing firm gas sales volumes
Source: Central release 22 October 2020. The new gas sales refer to the Macquarie overlift recovery contract

Page 18 of 34 Breakaway Research Pty Ltd, ABN: 39 602 490 906 AFSL 503622, 169 Blues Point Road, McMahons Point NSW 2060, Australia t +61 2 9392 8011
Joint Marketing Agreement
On 29 March 2018, the ACCC approved the joint marketing of Mereenie gas by Central and Macquarie Mereenie (part of the Macquarie Bank Group). This means that the JV can function as a unified production and marketing organization if required, but does not have to do so. That is, both parties can and do still contract to sell gas independently.
Gas Balancing Agreement (Over-lifting)
There is a Gas Implementation Agreement between the two JV partners which allows one partner to sell more than the other capped by the total capacity equity share. Central has been doing this for the last few years. We expect the June 2019 quarter will be the last quarter of material over-lifting by Central under this arrangement. The repayment of the gas over-lifted relative to Central’s JV share has been formalised into a sales contract which we price at cost of production (Macquarie Overlift Recovery Contract). There is no interest charge.
Gas Sales Agreements
Table 14 Gas Sales Agreements documented in various company releases
Start Life Total PJ PJ/yr TJ/d Original Contracts Mereenie on Acquisition (PAWA) 30-Jun-15 Dec-24 0.77 2.1 Palm Valley Contract (PAWA) 9-Apr-14 17.0 25.7 1.51 4.1 Dingo 1-Apr-15 20.0 31.0 1.55 4.2 Contracted at June 2015 (Pres 18 Jun 2015) 3.83 10.5 New Contracts EDL NGD (NT) PL 26 April 2017 1-Jun-17 5 9.85 1.97 5.4 Macquarie Prepay 3-Jan-19 3.0 5.2 1.73 4.7 Macquarie Extension 3-Jan-21 2.0 3.5 1.75 4.8 IPL 3-Jan-19 1.0 7.3 7.30 20.0 AGL 2019 (ACQ) 1-Jan-20 3 21.9 7.30 20.0 Macquarie Overlift Recovery 1-Jan-20 3 2.4 0.80 2.2 Total (no double counting) 15.65 42.88
Sources: Palm Valley/Dingo contracts from presentation 10 March 2014, Mereenie contract per presentation 18 June 2015, EDL per release 26 April 2017, Incitec Pivot contract per release 25 June 2018, Macquarie prepay per release 26 May 2016.Macquarie Prepay Extension 22 October 2020, AGL contract and Macquarie Overlift Recovery contract from release 11 Dec 2019
Palm Valley Gas Sales Agreement
The Palm Valley contract is to deliver 25.65PJ over 17 years or 1.51PJ/yr, according to a Central presentation 9 April 2014, and was originally with Santos, but was converted into a contract with the end user probably around the time Santos sold out of Mereenie.
Under the Share Sale and Purchase Agreement with Magellan Petroleum Pty Limited in February 2014 for the purchase of Palm Valley, Central is obliged to pay Magellan a Gas Price Bonus where the gas price received exceeds certain price hurdles over a period of 15 years following completion (ie to February 2029). The formula relates to gas from Palm Valley only.
Gas Price Bonus = 25% x (CPI adjusted hurdle price – weighted average sales price) X gas volume.
According to the Magellan 8K release below, the hurdle price is A$5/GJ presumably ex field for the first 10 years (ie to 2024) and A$6/GJ between 2025-2029, escalated by the Australian CPI. The CPI is up 8.3% since March 2014, so today those hurdle prices are A$5.41/GJ and A$6.50/GJ respectively.
The opportunity for Magellan to seek a one off bonus discharge appears to have passed, with the last exercise date being the fifth year anniversary or March 2019.
Central has made no provision for payment of this bonus in the accounts, and will seek to minimise it. In our modelling, we assume the price of the contract allocated to Palm Valley is $5/GJ in FY18 escalating, and therefore below the hurdle. We assume that when the contract ends, we have entered the higher hurdle price period post 2024, and our base case gas price remains below the hurdle.

Page 19 of 34 Breakaway Research Pty Ltd, ABN: 39 602 490 906 AFSL 503622, 169 Blues Point Road, McMahons Point NSW 2060, Australia t +61 2 9392 8011
Per the Magellan 8K 18 Feb 2014
“Bonus consideration. The Company will be entitled to receive 25% of the revenues generated at the Palm Valley gas field from gas sales when the volume-weighted gas price realized at Palm Valley exceeds AUD $5.00/Gigajoule ("GJ") and AUD $6.00/GJ for the first 10 years following Completion and for the following 5 years, respectively, with such prices to be escalated in accordance with the Australian CPI. Between the third and fifth anniversaries of Completion, inclusive, the Company may seek from Central a one-time payment (the "Bonus Discharge Amount") corresponding to the present value, assuming an annual discount rate of 10%, of any expected remaining bonus payments in exchange for foregoing future bonus payments. If the Company receives the Bonus Discharge Amount, bonus payments and the Bonus Discharge Amount shall not exceed AUD $7.0 million.”
Dingo Gas Sales Agreement (Including Take or Pay Receipts)
The Dingo contract is with Power and Water Corporation to deliver 31PJ over 20 years (1.6PJ/yr) to Brewster Estate to supply the NT Generation owned Owens Springs Power Station. Central owns the delivery pipeline. The contract was predicated of the closure of the Ron Goodin Power Station, which has not yet happened, hence the under-lifting, but the actual off take is now close to the contracted offtake.
The Dingo gas project was commissioned on 23 March 2015 and was tied into the Owen Springs Power Station occurred on 17 December 2015.
The Take or Pay provision requires that the off-taker pays the difference between actual offtake and the Average Contract Quality, and make a cash payment in January for the difference in the proceeding calendar year. The cash payment is not included in revenue until the earlier of the gas being physically lifted or the forfeiture of right to gas under the contract. That lifting must be at a rate above the Maximum Contract Quantity. Any volume up to MCQ is regarded as being within contract.
From an investors point of view, the Take or Pay provides a guaranteed cash flow. If the gas is delivered, there will be revenue recognition but no extra cash flow. The undelivered gas is not an issue for Central until the end of the contract in 2035.
Our forecast revenue includes delivered gas only. Our Cash Flow also includes the Take or Pay component as well.
The issue with the Owen Springs Power Station is discussed in the 2020 NT Generation Ltd annual report. Post expansion, the Alice Springs area suffered a power blackout in October 2019, due to the unreliability of Owen Springs. That unreliability was due to the use of mineralized town water in the Owen Springs evaporators causing scaling. As a result, NT Generation is installing a reverse osmosis water treatment system to eliminate this problem. In the meantime, the 1973 vintage Ron Goodin Power Station has been refurbished to supply reliability. We expect that once the reverse osmosis plant is running, Ron Goodin will be ramped down and Owen Springs ramped up, and physical offtake will be close to contracted offtake.
Incitec Pivot Gas Sales Agreement
On 28 June 2018, Central announced the Incitec Pivot Gas Sales Agreement from Palm Valley and Mereenie at a rate of at least 20TJ/d from 3 January 2019 to 31 December 2019. IPL has the option to increase that volume subject to the upgrading by APA of the Mereenie to Amadeus Pipeline lateral pipeline. The gas contract was described as necessary to keep the Gibson Island Fertilizer plant in Brisbane in operation.
The contract has been completed, and has been replaced by the AGL contract (see below).
This contract was part of a larger agreement to fund the exploration program at Range, where Central was free carried. Incitec did not fulfil all its spending obligations but the end of the spending period and Central received a cash payment from Incitec of A$7.7M on 1 January 2021.

Page 20 of 34 Breakaway Research Pty Ltd, ABN: 39 602 490 906 AFSL 503622, 169 Blues Point Road, McMahons Point NSW 2060, Australia t +61 2 9392 8011
EDL Gas Sales Agreement
On 26 April 2017 Central entered into a Gas Sales agreement with EDL NGD (NT) Pty Ltd, the owners of the Pine Creek Power Station, with gas deliveries commencing 1 June 2017. The GSA is for the supply of 9.85PJ over 5 years ie 1.97PJ/y or 5.39TJ/d.
Central also announced a related Gas Transmission Agreement, which means this gas is sold at the power station, rather than ex field, and the revenue includes transport costs.
Macquarie Bank Limited (MBL) Gas Sales Prepayment Contract (GSPA)
The contract was announced 26 May 2016. The prepayment cash was advanced to Central on in June 2016 with $11.725M recorded in the Central June quarter 2016 5B. The funds were used to pay A$10.305M to Santos for the purchase of the Mereenie asset. The balance sheet at June 2016 recorded a liability of A$11.765M under “Other Financial Liabilities” because the default repayment method was by cash settlement, hence it was a financial instrument.
The offtake contract is 5.2PJ over 3 years and delivery started 3 January 2019 with the opening of the Northern Gas Pipeline connection NT gas to the Australian East Coast, which means the initial 3 years runs until 2 January 2022, at an average of 1.73PJ/y or 4.74TJ/d.
Under the GSPA, Macquarie Bank had a quarterly option to take a financial settlement in lieu of taking the physical delivery of the gas. Macquarie has novated the contract which is now firm offtake, and the financial option no longer applies. This is good for Central in that it does not have uncertainty over the destination of the gas.
The Prepay Agreement required that the notional delivery price is set at the average of new contracts based on Mereenie supplied gas. In 2017, the announcement of the EDL contract reset the Prepay Contract price to the ex-field EDL price. While this has a revenue impact in the P&L, it has no cash impact.
Macquarie Bank Limited Prepay Extension
On 22 October 2020, Central announced that Macquarie had elected to take up to an additional 3.5PJ over 2 years ie 1.75PJ/y starting at the conclusion of the existing prepay contract on 3 January 2022. Central received an undisclosed cash lump sum in the December 2020 quarter, which we believe is between A$13M and A$15M, based on the difference between the December 2020 quarter reported revenue and cash receipts from customers, adjusting for existing prepayment revenues, and the notes to the 5B report item 5.1 regarding joint venture cash.
Macquarie Overlift Recovery Contract
For some time, Central has been taking more gas from Mereenie that its 50% share. It has begun the return of that gas, and has formalized the return in the form of a contract with its JV partner, Macquarie. Having a contract provides certainty to all parties. However, the nature of such a contract means that the gas is being sold at cost, with no cash flow benefit to Central. The return is 2.4PJ in total, starting with 0.45PJ in the March 2020 quarter, and is expected to be at the rate of 0.18PJ/quarter, for 11 quarters concluding in the December quarter 2022. This was announced on 1 January 2020.
AGL Gas Sales Agreement
Also on 1 January 2020, the AGL contract between AGL and the Mereenie JV was announced. The contract is for 21.9PJ of firm and “as-available” supply over three years, or 20TJ/d, the same as the now completed Incitec contract. However, the Incitec offtake was 100% firm. We estimate that the AGL contract is 50% firm on the basis of reconciling with the firm contract volumes in Figure 3. The Incitec contract was with Central, whereas the AGL contract is with the Mereenie JV. The release also indicated that Central will receive the majority of the revenue in the first two contract years, due to gas rebalancing arrangements, so we have assumed that Central sells into 100% of the contract in years one and two and 40% in year three. Delivery started on 1 January 2020.
Page 21 of 34 Breakaway Research Pty Ltd, ABN: 39 602 490 906 AFSL 503622, 169 Blues Point Road, McMahons Point NSW 2060, Australia t +61 2 9392 8011
Debt A$68.8M to Macquarie at 31 December 2020
Since the end of 2019, the debt structure of Central has simplified with the repayment of the Incitec and Macquarie Tranche E and F loans. What remains is the Macquarie Tranche D $60M bullet repayment, and the Macquarie Tranches A and B, which at 31 December 2020, amounted to A$8.8M.
A new repayment schedule was announced on 22 October 2020. Central will pay principal of $1M per quarter in the March to September 2021 quarters, then $2M per quarter from the December 2021 quarter until the end of June 2022.
The sell down will result in the reduction of the A$60M bullet payment by A$29M in the September 2021 quarter. We expect the quarterly payments to continue to schedule.
Once the bullet repayment date is reached, we assume that the debt is refinanced, and is repaid over a further 5 years
Table 15 Debt drawdown and repayment history and forecast based on existing debt facilities
Debt Jun-17 Jun-18 Jun-19 Jun-20 Jun-21 Jun-22 Jun-23 Balance per Accounts 81.92 78.33 81.73 70.81 66.81 30.81 0.00 Debt Interest Rate Note 33 7.4% 7.7% 6.8% 5.6% 5.6% 5.6% 5.6% BBWS Base Rate (RBA) 1.1% 1.5% 1.5% 0.6% 0.1% 0.1% 0.1% Premium 6.2% 5.3% 5.0% 5.5% 5.5% 5.5% Interest Paid A$M 6.35 5.99 6.45 5.09 4.67 3.55 1.54 Debt Repaid A$M -4.00 -4.00 3.50 -11.50 4.00 36.00 30.81
Source: Annual reports (Note that FY16 Debt Drawn per cash flow statement has been reduced by $11m which was related to the Macquarie Bank Prepayment, which is treated separately to debt, and the repayment in FY22 relates to the application of the A$29M sell down cash
The drop in interest rate between FY15 and FY16 related to the Tranche B A$30M tied to developing the Dingo field and infrastructure, with a drop down in rate on project tie in. In addition, the BBSW has been falling until very recently.
Australian East Coast Gas Pricing & Netback to Amadeus/Central
Spot city gate prices hit by COVID have rebounded with strong outlook
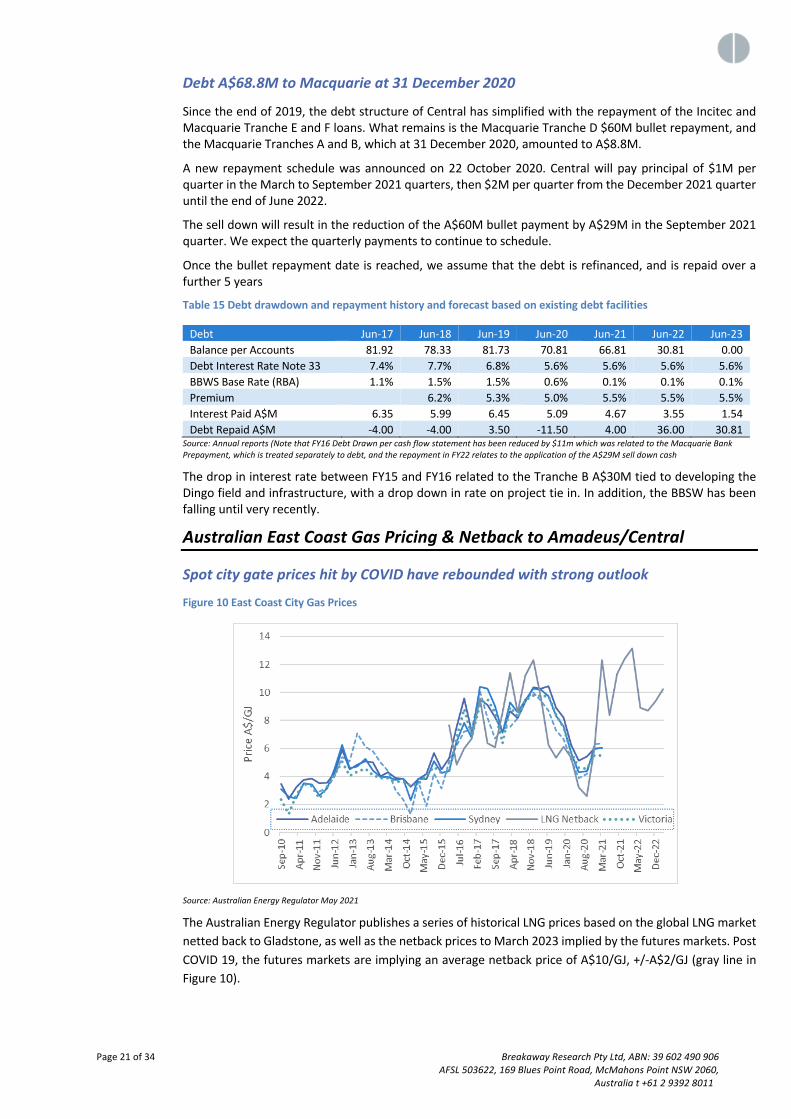
Figure 10 East Coast City Gas Prices
Source: Australian Energy Regulator May 2021
The Australian Energy Regulator publishes a series of historical LNG prices based on the global LNG market netted back to Gladstone, as well as the netback prices to March 2023 implied by the futures markets. Post COVID 19, the futures markets are implying an average netback price of A$10/GJ, +/-A$2/GJ (gray line in Figure 10).

Page 22 of 34 Breakaway Research Pty Ltd, ABN: 39 602 490 906 AFSL 503622, 169 Blues Point Road, McMahons Point NSW 2060, Australia t +61 2 9392 8011
Table 16 Capital City Gate Spot or Marginal Clearing Prices vs the LNG Netback to Wallumbilla
Quarter Ending
Victoria (A$/GJ)
Adelaide (A$/GL)
Brisbane (A$/GJ)
Sydney (A$/GJ)
LNG Netback (A$/GJ)
Adelaide - Brisbane
Sydney - Brisbane
Mar-11 2.70 3.24 2.44 3.24 2.44 Jun-11 3.48 3.78 3.51 3.78 3.51 Sep-11 3.31 3.84 3.44 3.84 3.44 Dec-11 2.43 3.52 2.93 2.65 0.59 -0.28 Mar-12 3.26 3.57 3.2 3.13 0.37 -0.07 Jun-12 4.12 4.24 4.01 4.57 0.23 0.56 Sep-12 5.03 5.92 5.39 6.25 0.53 0.86 Dec-12 4.04 4.52 5.08 4.58 -0.56 -0.50 Mar-13 4.35 4.83 7.09 4.7 -2.26 -2.39 Jun-13 4.53 5.07 6.13 5.26 -1.06 -0.87 Sep-13 4.08 5.01 5.78 4.42 -0.77 -1.36 Dec-13 3.87 4.02 5.02 3.95 -1.00 -1.07 Mar-14 3.90 4.32 4.38 3.97 -0.06 -0.41 Jun-14 3.65 3.89 3 3.76 0.89 0.76 Sep-14 3.64 3.84 2.34 3.85 1.50 1.51 Dec-14 3.33 3.25 1.3 2.3 1.95 1.00 Mar-15 3.48 3.82 3.62 3.83 0.20 0.21 Jun-15 4.08 4.16 1.89 3.81 2.27 1.92 Sep-15 4.68 5.67 4.23 5.07 1.44 0.84 Dec-15 4.25 4.49 3.13 4.26 1.36 1.13 Mar-16 4.31 5.28 5.06 4.39 7.68 0.22 -0.67 Jun-16 6.74 7.55 6.23 6.5 4.83 1.32 0.27 Sep-16 8.83 9.57 7.22 7.85 6.00 2.35 0.63 Dec-16 6.86 7.17 7.37 6.77 6.72 -0.20 -0.60 Mar-17 9.11 9.48 10.1 10.39 9.57 -0.62 0.29 Jun-17 9.55 9.11 8.2 10.29 6.36 0.91 2.09 Sep-17 8.57 8.25 6.72 9.03 6.09 1.53 2.31 Dec-17 6.36 7.19 7.41 7.12 8.57 -0.22 -0.29 Mar-18 8.94 8.65 7.54 9.3 11.42 1.11 1.76 Jun-18 8.29 8.16 8.18 8.56 8.58 -0.02 0.38 Sep-18 9.43 9.33 9.49 9.44 11.21 -0.16 -0.05 Dec-18 9.80 10.37 10.01 10.29 12.30 0.36 0.28 Mar-19 9.74 10.26 9.42 10.21 9.60 0.84 0.79 Jun-19 9.72 10.45 8.72 9.75 6.24 1.73 1.03 Sep-19 8.43 8.89 7.28 8.34 5.33 1.61 1.06 Dec-19 7.50 8.2 6.68 7.59 6.15 1.52 0.91 Mar-20 5.72 6.27 5.2 5.68 5.33 1.07 0.48 Jun-20 4.65 5.13 3.89 4.31 3.22 1.24 0.42 Sep-20 4.56 5.41 4.17 4.37 2.60 1.24 0.20 Dec-20 5.52 6 6.28 5.96 6.01 -0.28 -0.32 Mar-21 5.52 6.06 6.37 6.06 12.30 -0.31 -0.31 Jun-21 8.38 Sep-21 11.32 Dec-21 12.42 Mar-22 13.16 Jun-22 8.91 Sep-22 8.71 Dec-22 9.35 Mar-23 10.25
Source: Australian Energy Regulator May 2021

Page 23 of 34 Breakaway Research Pty Ltd, ABN: 39 602 490 906 AFSL 503622, 169 Blues Point Road, McMahons Point NSW 2060, Australia t +61 2 9392 8011
The spot gas prices at major city gates are currently averaging around A$6/GJ, and have a close correlation with the historical LNG spot netback price. The LNG netback futures price is forecasting a strong pickup over the period to March 2023, and there is a strong likelihood that the city gate spot prices will also move to up to the A$10/GJ region.
The strength of the LNG market is consistent with the strength we are seeing in the physical exports of LNG, which is also evidence that gas supply is being removed from the domestic market into the export market, tightening the physical supply demand balance locally.
Figure 11 LNG shipments in Mt per month from Gladstone region ports
Source: Gladstone Port Authority – Santos and Origin Energy LNG plants ship through Gladstone
Much of the volatility in the LNG futures price is driven by seasonal volatility, and the long term contracts will look through that. In long term contracts, seasonal volatility is handled by adjusting volume, at a stable price.
Outlook for East Coast Australian Gas Pricing – Contract Prices A$8-9/GJ at City Gate
Figure 12 LNG contract and spot prices vs domestic contract pricing (showing initial impact of COVID)
Source: Grattan Institute

Page 24 of 34 Breakaway Research Pty Ltd, ABN: 39 602 490 906 AFSL 503622, 169 Blues Point Road, McMahons Point NSW 2060, Australia t +61 2 9392 8011
Structurally, the inevitable phasing out of coal fired power stations on the Australian East Coast will require replacement by alternative energy sources, and while renewables and batteries will be in the forefront, gas is likely to be the on demand energy source of choice for some time, hence the recent Federal Government commitment to a A$600M gas fired replacement for the Liddel coal fired plant in the Hunter Valley north of Sydney.
Over the last two years, new gas contracts have been generally priced at around $8.50-9.50/GJ at City Gate, as indicated in the Grattan Institute figure below. We believe that at least this level of pricing will be sustained in the long term because that is the price required to bring on the capacity to infill to supply demand deficit that will emerge in the mid 2020’s. Higher price levels may be required long term.
The caveat to this is that LNG exports continue to consume their allocation of current supply. LNG exports are generally sold at long term contract prices, so LNG export volumes are likely to be sustained in the medium term.
The figure below shows the Grattan Institute calculation of the breakeven cost of producing gas from the current reserve base, ie the economics know projects in the supply pipeline. It indicates a breakeven cost of over A$7/GJ, which would become $8-9/GJ when combined with the capital return required to pay for the development.
Figure 13 Estimated cash cost of production for known undeveloped gas reserves
Source Grattan Institute

Page 25 of 34 Breakaway Research Pty Ltd, ABN: 39 602 490 906 AFSL 503622, 169 Blues Point Road, McMahons Point NSW 2060, Australia t +61 2 9392 8011
The latest AEMO forecast of supply demand shows a relatively flat demand profile, but a falling away of production from developed fields plus production from fields committed to being developed. That means that ongoing capital investment will be required, with gas pricing that includes return on investment.
Figure 14 East and South East Coast Gas supply forecast by AEMO in March 2020
Source: AEMO Gas Statement of Opportunities March 2020
Developed and undeveloped 2P Reserves are almost a match for forecast demand to the end of 2021, but beyond that timeframe, the market will require additional production from anticipated but uncommitted projects, and those anticipated projects will require long term contracts in the $8-9/GJ range.
City gate prices have to be adjusted for transport costs
Table 17 Impact of pipeline tariffs on gas prices at different locations
City Gate: Sydney Adelaide Brisbane Easthaul
Brisbane Westhaul
If Delivering gas to City Gate Gas Price December 2020 8.50 8.50 8.50 8.50 Less Moomba Sydney Pipeline 1.10 Less Moomba Adelaide Pipeline 0.80 Less Roma Brisbane Pipeline 0.71 0.71 Less Moomba Wallumbilla (Roma) Pipeline 1.40 -1.30 Netback to Moomba 7.40 7.70 6.39 9.09 Less Carpentaria Pipeline Southhaul 0.51 0.51 0.51 0.51 Less Northern Gas Pipeline 1.50 1.50 1.50 1.50 Less Amadeus Pipeline 0.57 0.57 0.57 0.57 Netback to Amadeus Gas Fields 4.82 5.12 3.81 6.51 Less Nitrogen Removal if required 0.77 0.77 0.77 0.77 Adjusted Netback to Amadeus 4.05 4.35 3.04 5.74 If buying gas at Moomba Netback to Moomba 7.40 7.70 6.39 9.09 Add Carpentaria Pipeline Northhaul 1.20 1.20 1.20 1.20 Gas Cost at Mt Isa 8.60 8.90 7.59 10.29 Less Northern Gas Pipeline 1.50 1.50 1.50 1.50 Less Amadeus Pipeline 0.57 0.57 0.57 0.57 Netback to Amadeus Gas Fields 6.53 6.83 5.52 8.22 Less Nitrogen Removal if required 0.77 0.77 0.77 0.77 Adjusted Netback to Amadeus Fields 5.76 6.06 4.75 7.45
Source: APA Group, EPIC Energy, Jemena tariff websites, AER for City Gate gas prices

Page 26 of 34 Breakaway Research Pty Ltd, ABN: 39 602 490 906 AFSL 503622, 169 Blues Point Road, McMahons Point NSW 2060, Australia t +61 2 9392 8011
Amadeus natural market is Northern Territory and the Mt Isa region
There are two approaches to calculation the netback of city gate prices back to the Central Australian gas fields. The first assumes that the Central Australian gas is delivered to the Capital Cities, and the second is to assume the gas is delivered to industries in the Mt Isa region, which is the natural market for the gas in the Northern Gas Pipeline.
A$8-9/GJ at City Gate nets back to A$5.26-6.85/GL for Sales to Mt Isa
Mt Isa is served by either the Northern Gas Pipeline from Amadeus or the Carpentaria Gas Pipeline from near Moomba. Moomba serves the coastal cities so Mt Isa has to compete for gas, hence the coastal cities set the Mt Isa price levels. The netback prices on this basis are shown in bottom line of Table 17, assuming a mid-range A$8.50/GJ.
Table 18 Major gas users in the Mt Isa region and estimated gas demand
Power Stations Owner MW Utilization Gas Demand PJ/y Mica Creek Stanwell 392 30% 3.7 X41 APA 33 70% 0.7 Phosphate Hill Incitec Pivot 30 100% 1.3 Diamantina APA 242 70% 5.3 Leichhardt APA 60 70% 1.3 Cannington EDL 34 70% 0.8 Chemical Industries Phosphate Hill Fert Incitec Pivot 6.0 Total 19.2
Source: Northern Gas Pipeline - Opportunity/Impact Study Report September 2016 -by GHD
In the table above we have made some estimates regarding utilization and gas consumption. In the GHD report cited, Incitec Pivot was identified as having 10.9PJ/y of consumption in the region, where we have identified only 7.3PJ/y. The table should be seen as a guide, but the point stands that there is significant demand in the region, and the presence of reliable reasonably prices gas could improve demand growth.
$8-9/GJ at City Gate nets back to $3.55-4.85/GJ at Amadeus
Taking the lower end of the A$8-9/GJ contract range for gas landed at the various city gates served by the East Australian gas pipeline system, and adjusting for the various transportation and processing tariffs, the netback to the Amadeus Gas Field will be A$3.55/GJ (at $8/GJ City) to A$4.85/GJ (at A$9/GJ City). Central is contracting between $5.50/GJ to A$6.00/GJ on long term contracts currently.
The two major supply sources that compete with the Amadeus Gas Fields are Moomba and the Surat (Roma). The proximity of Brisbane to the Surat results in lower Brisbane City Gate prices than the other capital cities. In fact, the South West Queensland Pipeline (Moomba to Wallumbilla) often flows west to Moomba, then into the deficit Sydney and Adelaide markets. As a result, the Moomba netback price from Sydney and Adelaide is often similar to the average of Brisbane Westhaul netback.
The Netback Price at Moomba represents the base price from which to value ex field gas prices for all the fields connected to Moomba, which now includes the Amadeus Fields of Central Petroleum.
The netback is calculated by taking the City Gate prices, and deducting the pipeline tariffs to transport Moomba gas to Sydney, Adelaide and Brisbane Easthaul. In the case of Brisbane Westhaul, the Roma netback is calculated by deducting the cost of transport from Roma to Brisbane, then adding the pipeline costs to transport the Roma gas to Moomba. Note the Easthaul and Westhaul tariffs are different.

Page 27 of 34 Breakaway Research Pty Ltd, ABN: 39 602 490 906 AFSL 503622, 169 Blues Point Road, McMahons Point NSW 2060, Australia t +61 2 9392 8011
Figure 15 Eastern Australian Gas Pipelines (Northern Gas Pipeline is dotted line from Tennant Ck to Mt Isa)
Source: AEMC https://www.aemc.gov.au/sites/default/files/content/f017d30c-d7bb-4e80-a8af-c05c7bf1baf3/Australia-with-gas-pipelines-A3-with-scheme-register-links.pdf
East Coast Gas Market – LNG netback pricing mainly relevant to Brisbane prices
What the LNG Netback Price Means
The LNG netback is calculated for the ACCC and provided on its website, providing an export parity price as a guide to what is effectively the Queensland gas market. The LNG import parity price is a spot market measure for LNG export or notional import, and given there are no LNG import facilities on the Eastern seaboard, it is an indicative price, rather than a price at which gas is physically available. It is also a price at which the three Queensland LNG exporters are indifferent between spot sales to either the LNG export market or the domestic gas market. The price is calculated on the basis of delivery at Wallumbilla, Queensland.
LNG Netback Relates to Brisbane City Prices, and Sydney and Adelaide are at a premium to Brisbane
For gas at Wallumbilla to reach the deficit gas markets of Sydney or Adelaide, there is around A$2.50/GJ of pipeline tariffs. This is a major reason why the Sydney or Adelaide City Gate gas prices were significantly higher than the netback.
If the Netback Futures remain at the current A$10/GJ +/- A$2/GJ, Sydney/Adelaide prices should trade at a premium. Over the last decade, Adelaide has traded at a premium of $0.87/GJ and Sydney at A$0.64/GJ.

Page 28 of 34 Breakaway Research Pty Ltd, ABN: 39 602 490 906 AFSL 503622, 169 Blues Point Road, McMahons Point NSW 2060, Australia t +61 2 9392 8011
Impact of Proposed Amadeus Moonie Gas Pipeline (AMGP) will allow City Sales
Figure 16 Proposed Amadeus to Moomba gas pipeline
Source: Central 2020 annual report
The proposed Amadeus to Moomba pipeline was described in a release by Central on 18 August 2020. The capacity of the 16 inch line is planned to be 124TJ/d or 45PJ/yr, and would be expandable with compression. The project is subject to a firm offer by Australian Gas Infrastructure Group (AGIG) targeting a Final Investment Decision by the second half of 2021. That time frame requires delivery of exploration success from Central’s drilling program, and the likelihood is that proving up the required Reserves will take longer.
The proposed AMGP would replace the 2200Km of Amadeus, Northern and Carpentaria pipelines with a single line of 950Km length. The combined tariff of those three pipelines is A$2.57/GJ per Table 17. The 622Km Northern Gas Pipeline (NGP) is the most recently constructed, and has a tariff of A$1.50/GJ. We estimate that the tariff on the AMGP will be in around A$1.70/GJ, saving around A$0.87/GJ.
Table 19 Capital City prices netted back to Amadeus via the Amadeus Moomba Gas Pipeline
City Gate: Sydney Adelaide Brisbane Easthaul
Brisbane Westhaul
If Delivering gas to City Gate Gas Price December 2020 8.50 8.50 8.50 8.50 Less Moomba Sydney Pipeline 1.10 Less Moomba Adelaide Pipeline 0.80 Less Roma Brisbane Pipeline 0.71 0.71 Less Moomba Wallumbilla (Roma) Pipeline 1.40 -1.30 Netback to Moomba 7.40 7.70 6.39 9.09 Less Amadeus Moomba Pipeline (Est) 1.70 1.70 1.70 1.70 Less Nitrogen Removal (Nil if blended) 0.00 0.00 0.00 0.00 Netback to Amadeus Gas Fields 5.70 6.00 4.69 7.39
Source: APA Group, EPIC Energy, Jemena tariff websites, AER for City Gate gas prices
By blending with gas at Moomba, the nitrogen extraction cost of A$0.77/GJ may be avoidable, adding to a combined cost reduction of A$1.64/GJ. This would lift the A$3.55-4.85/GJ netback discussed earlier to A$5.20-6.50/GJ. Table 19 provides a direct calculation, suggesting a netback of A$5.70-6.00/GJ.

Page 29 of 34 Breakaway Research Pty Ltd, ABN: 39 602 490 906 AFSL 503622, 169 Blues Point Road, McMahons Point NSW 2060, Australia t +61 2 9392 8011
Central’s Existing Producing Assets
Figure 17 Asset locations and pipelines to market
Source: CTP presentation 26 March 2019
Central Petroleum has gas production capacity at Mereenie, Palm Valley and Dingo, and existing oil production capacity at Mereenie (in production) and Surprise (shut in and recharging). It has a portfolio of exploration targets which could significantly re-rate the company. The gas assets were connected to the Australian East Coast gas market on 3 January 2019, with the commercial start of the Northern Gas Pipeline. This access would be enhanced if the Amadeus Moomba Gas Pipeline was built.
Figure 18 Central Australian production tenements (the coloured areas excluding Sunrise are the sale assets)
Source: CTP 2017 annual report p6 – Central retains 100% of Sunrise, 25% of Mereenie, and 50% of Palm Valley and Dingo post the sell down transaction of 2021

Page 30 of 34 Breakaway Research Pty Ltd, ABN: 39 602 490 906 AFSL 503622, 169 Blues Point Road, McMahons Point NSW 2060, Australia t +61 2 9392 8011
The Northern Gas Pipeline connects the Darwin gas line with the East Coast gas market
The 622Km 12 inch Northern Gas Pipeline (NGP) became operational in January 2019 with the initial capacity of 90TJ/day (33PJpa) of which approximately 90% is contracted, leaving about 10TJ/d spare. The pipeline could be expanded to 160TJ/day with compression. Incitec Pivot has contracted with NT Power and Water Corporation has contracted to supply 30TJ/day for 10 years to 30 June 2028, and be a foundation customer of the NGP (Incitec release 17 November 2015)
Gas pipelines typically run a t 110% of nameplate capacity, and it can be expanded incrementally with compression. We do not see the capacity of the NGP as a constraint on Central’s business for some time.
Mereenie Field (OL4, OL 5 – Central 25%)
General Background
The Mereenie oil and gas field is located in OL4 and OL 5, approximately 270 km west of Alice Springs, producing a light sweet crude with an API gravity of 49o. and Pacoota Formation gas with a nitrogen content of 2% to 15% increasing with depth and managed by blending gas to achieve the Amadeus Gas Pipeline specification of 11%.
The nitrogen content of the Mereenie Stairway Sandstone may be lower with Mereenie 15 reportedly flowing at 1.1TJ/d at a nitrogen content of 2.6% (2016 Annual Report p 7).
Twenty separate reservoir sands have been identified in the Pacoota Sandstone and four within the Stairway Sandstone. These formations are separated stratigraphically by the Horn Valley Siltstone. The Pacoota Sandstone is subdivided into four subunits from top to base: Pacoota P1, Pacoota P2, Pacoota P3 and Pacoota P4.
Currently, a total of sixty five wells had been drilled, predominantly targeting the Pacoota reservoir oil legs for production and gas reinjection. A smaller portion of the wells were drilled high on structure targeting production from the Pacoota P1 gas cap. Two new crestal production wells are to be drilled in mid 2021, targeting the gas cap. The majority of the oil produced to-date has been sourced from the P3 oil wells in the eastern region of the field.
Operating Assets
The Eastern Satellite Station (ESS) was commissioned and oil production commenced in 1984 at a rate of 1,500 bbl/d. Oil was initially trucked to Alice Springs. The 270 km, 200mm oil pipeline to Brewer Estate was built in 1985.
A gas contract with the Northern Territory Power and Water Authority (PAWA) was executed in 1985, the 1,500 km Amadeus to Darwin gas pipeline was built in 1986, followed by first gas sales in 1987. The Central Treatment Plant (Central) was also commissioned in 1986 (and expanded in 1995) to allow for gathering and processing of gas and oil from the central and western parts of the field.
The reservoir pressure has declined significantly (approximately 800-1,400 psi c.f. virgin pressure of 1,870 psi). Thedevelopment strategy has been to provide (partial) pressure maintenance to the P3 reservoir through gas re-injection to enhance recovery of the oil. More recently, the focus has turned to gas production as the oil is depleted.
Liquids (oil and condensate) are currently trucked to Port Bonython for storage prior to export. Gas is sold into the Northern Territory market. With the completion of the Northern Gas Pipeline, the field now has access to the Eastern Australian gas market.
The main processing facilities are the Central and the ESS which are equipped for gas, oil and water separation, gas conditioning, dehydration and compression, oil pumping and water disposal. The combined facilities have the capacity to handle approximately 5,000 bbl/d of oil and 50 MMscf/d (53PJ) gas.
Produced water is disposed of by evaporation in dedicated interceptor/evaporation ponds located at the Central and ESS processing facilities.
Gas reinjection was initiated in 1987 to increase oil production rates and to increase reserves by improving oil reservoir sweep efficiency.

Page 31 of 34 Breakaway Research Pty Ltd, ABN: 39 602 490 906 AFSL 503622, 169 Blues Point Road, McMahons Point NSW 2060, Australia t +61 2 9392 8011
2018 Asset Upgrade to lift sales capacity to 44-58TJ/d
On 12 March 2018, the company announced a Phase 1 spend of A$12M to refurbish and upgrade capacity from 25TJ/day to 63TJ/day, and sales gas capacity from 15TJ/day to 58TJ/day, with internal energy consumption and reinjection of gas to maintain oil production falling from 10TJ/day to 5TJ/day.
The target capacity comprises 44TJ/d of firm capacity from Phase 1, which has been achieved, and Phase 2 delivering a further 14TJ/d from mitigating lateral pipeline constraints.
As part of Phase 2, West Mereenie WM26 started drilling 23 May 2018, planned to be 36 days, 2915m hole length, 1242m vertical depth, and capturing a reservoir section of 1481m. While the Lower Stairway reservoir was intersected, and the zone was in a region of high natural fracturing, the fractures were interpreted to be mineralized, and the gas flow was uneconomic.
Currently the plan is to return Mereenie to 45TJ/day, and that is expected to be achieved during the September 2021 quarter, and the re-completions and new production wells come on line. There may be potential to reconsider the Phase 2 plan in the future.
UPSIDE: 2C DEVELOPMENT HAS UNRISKED VALUE OF A$31M to A$85M DEPENDING ON TIMING
In our valuation Table 3, we have assumed the top end of the valuation range, before applying a risk factor of 50%. Because Central’s interest is reduced to 25%, this development is not longer material to our valuation, but we repeat the information here as a matter of record.
Based on the plans detailed by RISC below, and assuming the same prices as used in our model, the unrisked Net Present Value of the 2C development of Central’s share at Mereenie is A$85M the year before start up, or A$31M today assuming the 2C development starts in FY2035 as the 2P production ends. Our NPVs assume the higher cost 48 well program is used, as opposed to the lower cost 20 well program (see below).
RISC (April 2017) has reviewed Central’s concept for the development of the Lower Stairway contingent resource in the Mereenie field. The following table represents the scope and capital cost required to develop the Lower Stairway contingent resources. This information is potentially outdated, post additional drilling, but is included for completeness.
Table 20 Capex to develop the Lower Stairway
A$M Facility to 50TJ/d 68.0 48 gas wells $3m/well to 1000m (could be replaced by 20 Hi Angle wells see below) 144.0 Other 0.5 Total 212.5 Additional Opex A$M/TJpd 0.15 Abandonment Cost for 2P and 2C developments 80.0 20 Hi Angle wells (subject to two trial well results) 94.0
Source: Scheme Document 2 May 2017 RISC Expert Report p226
Should the successful development of the Lower Stairway resources occur, it is also estimated that three additional wells are drilled to target the acceleration of 2P gas reserves.
Central’s original development concept calls for the Lower Stairway wells to be a slim hole design to enable the utilisation of smaller, lower cost rigs as the wells are shallow at less than 1000 m depth. However recent work by Central has indicated the potential to drill high angle wells drilled underbalanced and/or with air oriented to maximise the intersection with natural fractures. In this scenario, the laterals are anticipated to be in the order of 500-700m requiring a two well proof of concept well program prior to development. The high angle well option has the potential to significantly reduce the well count to in the order of 20 albeit more expensive wells. If pursued, this option could potentially reduce capital costs by approximately $50 million.
The facility cost estimate is preliminary in nature and has been prepared with little engineering definition.

Page 32 of 34 Breakaway Research Pty Ltd, ABN: 39 602 490 906 AFSL 503622, 169 Blues Point Road, McMahons Point NSW 2060, Australia t +61 2 9392 8011
The facility scope required to increase production to 50 TJ/d is:
• two new field boost compressors at 2.5 MW each;
• two new export compressors at 1 MW each;
• slug catcher installation;
• additional infield pipelines and flowlines;
• installation of integrated control system;
• upgrade of PLCs, safety shutdown, SCADA and individual control systems to enable better reliability at higher production rates;
• installation of a more effective produced water management system;
• installation of export metering and plant air.
It is estimated that operating costs increase from $14.7 million in FY2017 when production rates are approximately 15 TJ/d, to $20.3 million p.a. as production increases to 50 TJ/d.
Decommissioning and abandonment of the Mereenie 2P and 2C resource development scope is estimated at $80 million.
Palm Valley Field (OL 3 – Central 50%)
Palm Valley and Dingo were purchased from Magellan on 19 February 2014. At the time, Dingo was undeveloped. Consideration was A$20M cash funded by a loan from Macquarie Bank, 39.5M shares and a gas price bonus which we do not expect Central will have to pay.
Figure 19 Palm Valley Field (11 wells drilled, 4 capable of production at time of acquisition)
Source: Central presentation 10 March 2014
Palm Valley Well 13 was spudded on 21 August 2018 with 46 days to total length of 3476m and vertical depth of 2102m, to intersect 1040m of reservoir. On 5 October 2018 the company reported strong gas flows at 1888m down hole, and at 2020m tested 13.6mmscf/day through a 3.5 inch choke. PV13 was tied in on 17 May 2019.
According to the announcement on 31 May 2019, PV 13 has been ramped up to 6.3TJ/d, lifting the field production to 12.4TJ/d. This is limited by the currently installed production skid capacity at the well, and engineering was underway to determine the maximum capacity of the skid. However, in a disappointing release of 12 June 2019, Central indicated that the sustainability of production on the current wells, including PV13, is likely to decline to 5-7TJ/d in 2 years.
In that release, Central reduced the 3P Reserve from 58.4PJ to 32.6PJ, and increased 2C Contingent Resources from zero to 13.6PJ. Returning that 2C into 2P is a major exploration focus for Central.
The Palm Valley Deep exploration well, planned for Q4 2021 will target a mean recoverable resource of 123PJ (61.5PJ net to Central) from the deeper Arumbera Sandstone, which is the productive interval at the

Page 33 of 34 Breakaway Research Pty Ltd, ABN: 39 602 490 906 AFSL 503622, 169 Blues Point Road, McMahons Point NSW 2060, Australia t +61 2 9392 8011
Dingo gas field. If unsuccessful at that level, a lateral production well will be drilled into the shallower Pacoota level and completed for immediate production.
Dingo Field (Production Licence L7, Pipeline Licence PL 30 – Central 50%)
The Dingo gas field is located in Production Licence L7 (formerly RL 2) in the northeast Amadeus Basin, approximately 60 km south of Alice Springs. The gas field was discovered in 1981 when the Dingo 1 exploration well tested 1.45 MMscf/d gas from the Neoproterozoic lower Arumbera Sandstone (Unit 1).
Figure 20 Dingo Field (4 wells drilled, 2 capable of production)
Source: Central presentation 10 March 2014
The Dingo structure is mapped as a slightly elongate west-northwest trending, simple unfaulted domal anticline. The structure is 11 km by 5.6 km, and the productive reservoir is at a depth of approximately 3,000m deep.
Macquarie Bank provided A$30M to fund the development of the Dingo field.
The Dingo gas field development comprised the construction of wellhead facilities, gathering pipelines, gas conditioning facilities, a 50 km gas pipeline (Pipeline Licence PL30) to Brewer Estate in Alice Springs, compression and custody transfer metering facilities. The Brewer Estate Export Facility was designed to service a gas sale contract with Territory Generation. All gas production comes from Dingo 2 and Dingo 3.
The Dingo gas project was commissioned on 23 March 2015 and tie in to Owen Springs Power Station occurred on 17 December 2015. Under the contract, the Take or Pay provision was triggered on 1 April 2015, and over A$24.7M has been paid (or is payable) up to 31 December 2020 (2020 half year report).

Page 34 of 34 Breakaway Research Pty Ltd, ABN: 39 602 490 906 AFSL 503622, 169 Blues Point Road, McMahons Point NSW 2060, Australia t +61 2 9392 8011
Company Share Structure & Major Shareholders
Table 21 Shares, options and performance shares at 4 March 2021
Shares and Options on Issue Million Ordinary Shares 724.09 Options $0.20/sh to 30/06/23 18.15 Share Rights 29.54
Source: Central 2A release 4 March 2021
Share register is fragmented with no major shareholder blocks
Table 22 Major shareholders
Shareholder Holding Share Norfolk Enchants Pty Ltd 35,791,682 4.95% UBS Nominees Pty Ltd 29,906,170 4.13% Fanchel Pty Ltd 19,000,000 2.63% Mr Christopher Ian Wallin + Ms Fiona Kay McLoughlin + Mrs Sylvia Fay Bhatia 17,571,648 2.43% Macquarie Bank Limited 14,166,667 1.96% Citicorp Nominees Pty Limited 13,961,704 1.93% Brazil Farming Pty Ltd 13,500,000 1.87% Mr Raymond Driscoll + Mrs Karyn Driscoll + Mr Jarrod Driscol 8,936,608 1.24% Kensington Capital Partners Pty Ltd 7,923,341 1.10% Chembank Pty Limited 7,000,000 0.97% JH Nominees Australia Pty Ltd 6,700,000 0.93% Mr Philip Gasteen 6,501,255 0.90% Mr William Bambling + Mrs Joyce Bambling 6,300,000 0.87% Mr Donald Leonard Cottee 5,581,344 0.77% Mr Stuart Francis Howes 5,501,001 0.71% Mr James Donald Bruce Cochrane + Mrs Joan Elizabeth Cochrane 5,000,001 0.69% Chembank Pty Limited 5,000,000 0.69% Dynasty Peak Pty Ltd 5,000,000 0.69% Justwright Investments Pty Ltd 5,000,000 0.69% Garmi Holdings Pty Ltd 4,000,000 0.55%
Source: CTP website 21 September 2020
The only substantial shareholder on the register at 3 June 2021 was Troy Harry with 55M shares.
Board & Management
Mick McCormack - Non-Executive Chairman | BSurv Grad Dip Eng MBA FAICD, appointed to the board 1 September 2020 and to the role of Chairman 24 November 2020
Mr McCormack has over 35 years’ experience in the energy infrastructure sector in Australia and is recognised as a visionary, thought-leader and proven corporate leader, as demonstrated through his 14-year tenure as CEO of APA Group.
As CEO for APA Mr McCormack transformed the gas delivery system in Australia with the development of a pipeline grid system, introducing world leading innovative technologies such as bi-directional flows and gas storage flexibility.
Mr McCormack led $12 billion in investment within energy infrastructure developments across the country which includes gas fired power generation, gas processing, LNG processing, electricity transmission, and large scale renewables (wind and solar), all building our nation’s energy security.
Page 35 of 34 Breakaway Research Pty Ltd, ABN: 39 602 490 906 AFSL 503622, 169 Blues Point Road, McMahons Point NSW 2060, Australia t +61 2 9392 8011
On becoming CEO of APA in 2005, there were 30 employees, with assets of $1.3bn. On his retirement in July 2019, APA had over 3,000 employees and assets of $24bn. Over the 14 years he led APA, the company delivered a compound rate of return to securityholders of over 17% per annum, making it one of the ASX’s top performing companies.
The growth and development of the APA Group demonstrates the success of Mr McCormack’s vision and determination. Renowned as an outstanding CEO, Mr McCormack has a proven and recognised ability to deliver for all stakeholders in an issue-laden sector during challenging corporate cycles.
In 2016 Mr McCormack was recognised through the ‘Australian Pipeline and Gas Association Outstanding Contribution Award’ and in 2019 was awarded Australian Pipeline and Gas Association Honorary Life membership. In addition to his leadership at APA Group, he formerly held senior roles at AGL, and is a former Director of Envestra (now Australian Gas Infrastructure Group) and the Australian Pipeline Industry Association (now Australian Pipelines and Gas Association).
Mr McCormack is a non-executive director at Origin Energy and a non-executive director at Austal Limited and a director of the Clontarf Foundation and the Australian Brandenburg Orchestra Foundation.
Mr McCormack has been a director of Central Petroleum Limited since 1 September 2020.
Leon Devaney - Managing Director & Chief Executive Officer, appointed 21 February 2019
Mr Leon Devaney (BSc MBA) has over 15 years of commercial and finance experience within the Australian oil and gas sector and holds an MBA and BSc (Finance) from the University of Southern California, USA.
Leon joined Central Petroleum in 2012 as Chief Commercial Officer, making the transition to CFO in November 2014. Leon was instrumental in negotiating the Mereenie acquisition from Santos in 2015, as well as the Palm Valley and Dingo Gas Field acquisition from Magellan Petroleum in 2014.
Leon was appointed Chief Executive Officer, effective 21 February 2019, after serving as Acting CEO since July 2018.
Prior to joining Central Petroleum, Leon worked at QGC and played a pivotal role in its growth from a small cap gas exploration company into a multi-billion dollar takeover target by the BG Group in 2008. Leon continued with BG following the QGC takeover, where he served as General Manager, Gas and Power, responsible for the domestic gas and electricity portfolio.
Prior to QGC, Leon held senior roles at Deloitte in the Corporate Finance Advisory group where he was active in structuring and implementing commercial and financing transactions for major energy and infrastructure projects throughout Australia.
Katherine Hirschfeld - Non-Executive Director, appointed 7 December 2018
Ms Hirschfeld (BE(Chem) UQ, HonFIEAust FTSE FIChemE CEng FAICD) is a highly regarded non-executive director, having served on the Boards of a number of companies listed on the ASX, NZX and NYSE, as well as Government and private company boards.
She is currently the Chairman of Powerlink, and a Board member of Qld Urban Utilities and Tellus Holdings Ltd.
Kathy has also been a Non-Executive Director of Energy Queensland, Tox Free Solutions, InterOil Corporation, Broadspectrum, Snowy Hydro.

Page 36 of 34 Breakaway Research Pty Ltd, ABN: 39 602 490 906 AFSL 503622, 169 Blues Point Road, McMahons Point NSW 2060, Australia t +61 2 9392 8011
Previously she had leadership roles with BP in oil refining, logistics, exploration and production located in Australia, UK and Turkey.
Kathy was recognised in the AFR/Westpac 100 Women of Influence 2015, by Engineers Australia as one of Australia’s Top 100 Most Influential Engineers 2015 and as an Honorary Fellow in 2014. She is a member of Chief Executive Women and a Fellow of the Australian Institute of Company Directors and the Academy of Engineering and Technology.
In 2019 Ms Hirschfeld was appointed a Member of the Order of Australia (AM) for significant service to engineering, to women and to business.
Stuart Baker - Non-Executive Director, appointed 7 December 2018
Mr Baker (BE(Elec), MBA. Member, AICD) has more than four decades of experience in the oil and gas sector and currently provides independent advice to corporates and investors in the Australian oil and gas industry.
Previously he was Executive Director, Morgan Stanley with dual roles as Co-Head Asia Oil, Gas and Chemicals Research and team leader, Australian energy, mining and utility research, with positions held over a 13-year period.
He also held senior positions with research teams at Macquarie Bank and Bankers Trust and as a Petrophysical Engineer at Schlumberger Inc., rising to General Field Engineer.
Mr Baker is currently a member of the investment committee of resource focused ASX listed Lowell Resources Fund, and is a strategic advisor to Karoon Gas.
Dr Agu Kantsler – Non Executive Director, appointed 15 June 2020
Dr Agu Kantsler has some 45 years of experience in the international and Australian upstream oil and gas industry and has spent over 20 years in senior leadership positions and 10 years serving on the boards of several listed and private companies.
He is currently a Non-Executive Director of Oil Search Limited and the Managing Director of Transform Exploration Pty Ltd. He is a former President of the Chamber of Commerce and Industry Western Australia, a former Director of the Australian Chamber of Commerce and Industry and a former Chairman and Director of the Australian Petroleum Production and Exploration Association (APPEA).
Agu spent 15 years working for Shell International Petroleum in various international exploration assignments and his final position was Exploration Manager for the Shell Group of Companies in Indonesia. He then spent 13 years as Executive Vice President for Exploration and New Ventures with Woodside Petroleum Limited where he led teams credited with numerous oil and gas discoveries including the giant Pluto and Calliance gas fields. Agu then spent two years as the Executive Vice President for Health, Safety and Security at Woodside where he restructured the team of HSS professionals providing management advice on safety, welfare and security for over 16,000 construction workers in Southeast Asia and Australia as well as operations at Woodside’s nine major production facilities.
Dr Kantsler was awarded APPEA’s Reg Sprigg gold medal for service to the industry in 2005 and in 2006 was elected to Fellowship of the Australian Academy of Technological Sciences and Engineering.
Page 37 of 34 Breakaway Research Pty Ltd, ABN: 39 602 490 906 AFSL 503622, 169 Blues Point Road, McMahons Point NSW 2060,
Australia t +61 2 9392 8011
Analyst Verification
I, Michael Harrowell, as the Research Analyst, hereby certify that the views expressed in this research accurately reflect our personal views about the subject securities or issuers and no part of analyst compensation is directly or indirectly related to the inclusion of specific recommendations or views in this research.
Disclosure
Breakaway Research Pty Ltd (AFSL 503622) and its associates, or consultants may receive corporate advisory fees, consultancy fees and commissions on sale and purchase of the shares of Central Petroleum Limited and may hold direct and indirect shares in the company. It has also received a commission on the preparation of this research note.
We acknowledge that Senior Resource Analyst, Michael Harrowell, holds no shares in Central Petroleum Limited.
Disclaimer
Any observations, conclusions, deductions, or estimates of figures that have been made by Breakaway Research in this report should not be relied upon for investment purposes and the reader should make his or her own investigations. This publication has been issued on the basis that it is only for the information and exclusive use of the particular person to whom it is provided. Any recommendations contained herein are based on a consideration of the securities alone. In preparing such general advice no account was taken of the investment objectives, financial situation and particular needs of a particular person. Before making an investment decision on the basis of this advice, investors and prospective investors need to consider, with or without the assistance of a securities adviser, whether the advice is appropriate in light of the particular investment needs, objectives and financial circumstances of the investor or the prospective investor. Although the information contained in this publication has been obtained from sources considered and believed to be both reliable and accurate, no responsibility is accepted for any opinion expressed or for any error or omission that may have occurred therein.
Breakaway Research Pty Ltd AFSL 503622 ABN: 39 602 490 906,
T+61293928011 169 Blues Point Road
McMahons Point NSW 2060