central bank of nigeria annual report—2011
TRANSCRIPT

Central Bank of Nigeria Annual Report—2011
1
he Bank sustained its effort at improving efficiency of its business processes through the
implementation of strategic initiatives. In order to expand banking infrastructure and
ensure easy access to banking services nationwide, the development and renovation of
branch buildings and currency centres continued. Furthermore, the overall strategy for the use
of information technology (IT) in the Bank was reviewed, in line with enterprise imperatives. To
deliver on the new IT Strategy, the CBN approved a Technology Refresh Project, with the broad
objective of replacing ageing IT infrastructure with systems capable of meeting the present and
future IT demands of the Bank. The CBN continued to perform its corporate social responsibility
functions by promoting knowledge through capacity building, youth development, provision of
financial assistance to professional associations for the hosting of conferences, seminars and
workshops which were of strategic national interest, and provided financial assistance to the
less privileged in society, under the Alms Collection Scheme.
1.1 ADMINISTRATION
1.1.1 Board of Directors and Board Committees
The structure of the Board of Directors of the Central Bank of Nigeria (CBN)
remained unchanged. Consequently, the Board of Directors comprised the
Governor, Sanusi Lamido Sanusi (Chairman); four Deputy Governors, namely:
Suleiman A. Barau (Corporate Services), Sarah O. Alade (Economic Policy),
Kingsley C. Moghalu (Financial System Stability) and Tunde O. Lemo
(Operations); and six non-executive Directors. The non-executive Directors
were: Dahiru Muhammad, Samuel O. Olofin, Joshua O. Omuya, Stephen O.
Oronsaye, Danladi I. Kifasi (Permanent Secretary, Federal Ministry of Finance)
and Jonah O. Otunla (Accountant-General of the Federation) who joined the
Board on June 30, 2011 following the retirement of Aderemi B. Ogunsanya.
The Board held six (6) regular and one (1) emergency meetings in 2011. The
Committee of Governors held thirty (30) regular meetings, while the Governors‘
Consultative Committee held four (4) regular meetings. The Committee of
T
CHAPTER ONE
CORPORATE ACTIVITIES OF THE
CENTRAL BANK OF NIGERIA

Central Bank of Nigeria Annual Report—2011
2
Departmental Directors held eight (8) regular meetings and six (6) extraordinary
meetings, while the Pension Fund Management, the Establishment as well as
Audit and Risk Management Committees held three (3) meetings each. The
Financial System Stability, the Corporate Strategy, the Investment as well as the
Remuneration Ethics and Anti-Corruption Committees held two (2) meetings
each. The Financial and General Purpose Committee held one (1) meeting
during the year under review.
N/S NameNumber of Board Meetings
Attended
1 Sanusi Lamido Sanusi 6
2 Dahiru Muhammad 5
3 Danladi I . Kifasi 2
4 Jonah O. Otunla 2*
5 Joshua O. Omuya 6
6 Kingsley C. Moghalu 5
7 Sarah O. Alade 5
8 Samuel O. Olofin 6
9 Stephen O. Oronsaye 6
10 Suleiman A. Barau 6
11 Tunde O. Lemo 6
Table 1.1: Membership of the Board of Directors and Attendance of
Board Meetings in 2011
*Mr. Jonah Otunla joined the Board of the Bank in June, 2011
N/S Name Number of IC Meetings Attended
1 Sanusi Lamido Sanusi 2
2 Dahiru Muhammad 2
3 Danladi I . Kifasi 0
4 Jonah O. Otunla 2
5 Kingsley C. Moghalu 2
6 Sarah O. Alade 2
7 Suleiman A. Barau 2
8 Tunde O. Lemo 2
Table 1.2: List of Investment Committee (IC) Members and the
Number of Times Members Attended Meetings in 2011
1

Central Bank of Nigeria Annual Report—2011
3
N/S Name Number of FSSC Meetings Attended
1 Sanusi Lamido Sanusi 1
2 Suleiman A. Barau 2
3 Dahiru Muhammad 1
4 Danladi I . Kifasi 1
5 Kingsley C. Moghalu 2
6 Sarah O. Alade 2
7 Stephen O. Oronsaye 1
8 Tunde O. Lemo 2
Table 1.3: List of Financial System Stability Committee (FSSC) Members
and the Number of Times Members Attended Meetings in 2011
N/S Name Number of PFMC Meetings Attended
1 Suleiman A. Barau 3
2 Joshua O. Omuya 2
3 Kingsley C. Moghalu 3
4 Samuel O. Olofin 2
5 Sarah O. Alade 3
6 Tunde O. Lemo 3
Table 1.4: List of Pension Fund Management Committee (PFMC)
Members and the Number of Times Members Attended Meetings in
2011
N/S NameNumber of F&GPC Meetings
Attended
1 Suleiman A. Barau 1
2 Dahiru Muhammad 1
3 Jonah O. Otunla 1
4 Stephen O. Oronsaye 1
5 Tunde O. Lemo 1
Table 1.5: List of Finance & General Purpose Committee (F&GPC)
Members and the Number of Times Members Attended Meetings in
2011
1

Central Bank of Nigeria Annual Report—2011
4
N/S Name Number of CSC Meetings Attended
1 Sanusi Lamido Sanusi 2
2 Dahiru Muhammad 2
3 Jonah O. Otunla 0
4 Sarah O. Alade 2
5 Stephen O. Oronsaye 2
6 Suleiman A. Barau 2
7 Tunde O. Lemo 2
Table 1.6: List of Corporate Strategy Committee (CSC) Members and
the Number of Times Members Attended Meetings in 2011
*Mr. Jonah Otunla joined the Board of the Bank in June, 2011
N/S Name Number of EST Meetings Attended
1 Suleiman A. Barau 3
2 Samuel O. Olofin 2
3 Stephen O. Oronsaye 3
4 Tunde O. Lemo 3
Table 1.7: List of Establishment Committee (EST) Members and the
Number of Times Members Attended Meetings in 2011
N/S NameNumber of A&RM Meetings
Attended
1 Joshua O. Omuya 3
2 Dahiru Muhammad 3
3 Jonah O. Otunla 3
4 Samuel O. Olofin 3
5 Suleiman A. Barau 3
6 Tunde O. Lemo 3
Table 1.8: List of Audit & Risk Management Committee (A&RM)
Members and the Number of Times Members Attended Meetings in
2011
1

Central Bank of Nigeria Annual Report—2011
5
N/S Name Number of REAC Meetings Attended
1 Stephen O. Oronsaye 2
2 Danladi I . Kifasi 0
3 Joshua O. Omuya 2
4 Sarah O. Alade 2
5 Suleiman A. Barau 1
Table 1.9: List of Remuneration Ethics and Anti Corruption Committee
(REAC) Members and the Number of Times Members Attended
Meetings in 2011
1.1.2 The Monetary Policy Committee (MPC)
The Monetary Policy Committee (MPC) held six (6) regular and one (1) extra-
ordinary meetings at which major domestic and international economic
developments were reviewed and appropriate monetary policy decisions
taken. The Monetary Policy Rate (MPR) was reviewed upward six (6) times, in
line with the prevailing macroeconomic conditions. The decisions of the
Committee were promptly communicated to the public through press briefing
by the Governor and a communiqué issued at the end of each meeting.
N/S Name Number of MPC Meetings Attended
1 Sanusi Lamido Sanusi 7
2 Suleiman Barau 7
3 Sarah O. Alade 7
4 Kingsley Moghalu 7
5 Tunde Lemo 7
6 Sam O. Olofin 7
7 Danladi I . Kifasi 4
8 Adedoyin Salami 7
9 John Oshilaja 6
10 Chibuike C. Uche 6
11 Shehu Yahaya 5
12 Abdul-Ganiyu Garba 7
Table 1.10: List of Monetary Policy Committee (MPC) Members and
the Number of Times Members Attended Meetings in 2011
1

Central Bank of Nigeria Annual Report—2011
6
Table 1.11: MPC Decisions in 2011 Date Rate
(%)
Decision
January 24 – 25,
2011
Communiqué No.
74
6.50 Raised the MPR by 25 basis points from 6.25 to 6.50 per cent,
with immediate effect, with a majority vote of 11:1.
Raised the Cash Reserve Requirement (CRR) ratio by 100 basis
points from 1.0 to 2.0 per cent, with effect from February 1,
2011, with a majority vote of 11:1.
With effect from March 1, 2011, raised the Liquidity Ratio (LR) by
500 basis points from 25.0 to 30.0 per cent, with a majority vote
of 11:1.
Corridor
+/-200
March 21 – 22,
2011
Communiqué No.
75
7.50 A majority of 9:3 members voted for an increase in MPR by 100
basis points from 6.50 to 7.50 per cent; 3 members voted for a
50 basis points increase.
Unanimous decision to:
o Retain the current CRR of 2.0 per cent and the liquidity
ratio of 30.0 per cent; and
o Extend the CBN guarantee on interbank transactions and
guarantee of foreign credit lines by three months from
June 30, 2011 to September 30, 2011.
Corridor
+/-200
May 23 – 24, 2011
Communiqué No.
76
8.00 A majority of 9:1 members voted in favour of further tightening
of monetary policy. Nine members were in favour of tightening
and an increase in CRR from 2.0 per cent to 4.0 per cent, with
effect from June 8, 2011, to align with the next reserve
averaging maintenance period; 6 members voted for a 50
basis points increase in MPR from 7.5 per cent to 8.0 per cent,
while 3 voted for a 25 basis points increase and 1 member
voted for no change.
Corridor
+/-200
July 25 – 26, 2011
Communiqué No.
77
8.75 A majority of 10:2 members voted for tightening of monetary
policy.
Raised the MPR by 75 basis points from 8.0 to 8.75 per cent by a
vote of 8 in favour; 1 for a 50 basis points increase and 3 for
retention at 8.0 per cent.
Corridor
+/-200
September 19,
2011
Communiqué No.
78
9.25 A majority of 8:3 members voted for tightening of monetary
policy.
Seven members voted for a 50 basis points increase in MPR
from 8.75 to 9.25 per cent; 1 voted for a 100 basis points
increase, while 3 voted for no change.
Retained the CRR at 4.0 per cent by a unanimous decision.
Corridor
+/-200
October 10, 2011
Communiqué No.
79
12.00 Raised the MPR by 275 basis points from 9.25 per cent to 12.00
per cent with a majority vote of 8:1;
Increased CRR from 4.0 to 8.0 per cent from the maintenance
period beginning from October 11, 2011 by a majority vote of
7:2 (2 members voted for an increase of CRR to 6.0 per cent);
Reduced the net open position (NOP) from 5.0 per cent to 1.0
per cent of shareholders funds with immediate effect and with
full compliance by October 14, 2011; and
Suspended the reserve averaging method of computation in
favour of daily maintenance until further notice.
Corridor
+/-200
November 21,
2011
Communiqué No.
80
12.00 Retained the MPR at 12.0 per cent by a unanimous vote;
Retained the CRR at 8.0 per cent by unanimous vote;
Adjusted the mid-point of target official exchange rate from
N150.00/US$1.00 to N155.00/US$1.00 and maintained the band
of +/-3.0 per cent;
Encouraged the Management of the Bank to continue to seek
convergence between wDAS and interbank rates to reduce
arbitrage opportunities, avoid speculative attacks, and the
emergence of a multiple-exchange rate environment.
Corridor
+/-200
1

Central Bank of Nigeria Annual Report—2011
7
1.1.3 Development of CBN Branch Offices and Other Projects
The CBN sustained the development and renovation of its branches and
currency centres in order to expand banking infrastructure and ensure easy
access to banking services nationwide. The construction of nine (9) new
currency centres at Abakaliki, Ado Ekiti, Birnin-Kebbi, Damaturu, Dutse, Gusau,
Jalingo, Lafia and Yenagoa, as well as four (4) new branches at Asaba, Lokoja,
Umuahia and Uyo was completed. The Port Harcourt branch building was
formally commissioned on November 18, 2011 by the President of the Federal
Republic of Nigeria. The renovation of Ibadan and Benin Branch buildings was
completed. The refurbishment projects of branches in Abeokuta, Abuja,
Bauchi, Calabar, Ilorin, Jos and Sokoto, as well as the Lagos Office, the Abuja
International Training Institute and Kano Learning Centre progressed. Contracts
for the refurbishment of branches in Akure, Makurdi, Minna and Yola were
awarded. The CBN Governor‘s new official residence was completed during
the year.
1.1.4 Technology Transformation
The overall strategy for the use of information technology (IT) in the Bank was
reviewed, in line with enterprise imperatives. In order to deliver on the new IT
Strategy, the Bank approved a Technology Refresh Project, with the broad
objective of replacing ageing IT infrastructure with systems capable of meeting
present and future demands on IT resources. The approved roadmap/strategy
implementation plan would guide IT investment for the next five (5) years.
The network connection in the Bank was improved, leading to increased and
optimised internet bandwidth and convergence of voice and data networks.
Thus, internet communication between CBN locations and external
stakeholders was enhanced, thereby reducing operational cost and improving
service delivery. In order to manage the growing cyber security threats, various
projects to provide security-in-depth for the Bank‘s information assets were
initiated.
1

Central Bank of Nigeria Annual Report—2011
8
Furthermore, as part of the Payments System Vision 2020, the Bank acquired a
new Real Time Gross Settlement (RTGS) System consistent with international best
practice. The system would provide robust capabilities to handle multiple and
concurrent large-value transactions and support various streams of payments
including net settlement positions from various netting schemes, securities and
foreign exchange settlement transactions. The new system would be seamlessly
integrated into the Bank‘s Temenos 24 (T24) and back office (Oracle enterprise
resource planning (ERP)) applications. The Bank created a Treasury Single
Account on T24 to consolidate all government accounts for easy management
and disbursement of funds.
The electronic-Financial Analysis and Surveillance System (e-FASS) was being
enhanced, and all silo applications used to capture returns from the banks and
other financial institutions (OFIs) were being reviewed to enhance data integrity
and timeliness, as well as to support the risk-based, consolidated and cross-
border supervisory framework.
1.1.5 Library Operations
The volume of books in the Bank‘s library system was 97,627, compared with
95,236 in 2010. The books, journals and periodicals consulted by staff increased
by 10.0 per cent to 7,689 from 6,990 in 2010. The Library continued to subscribe
to electronic journals through SWETS and IPI. Of the 184 periodicals supplied, 70
were accessible on-line. Subscriptions were made to four (4) other electronic
journal databases (JSTOR, EBSCOHost, AGORA and OARE) and IMF statistical
database. The process of implementing an electronic Library System was
initiated.
1.1.6 Legal Services
The Bank sustained its effort at strengthening its legal and regulatory framework,
as well as enhancing the overall effectiveness of the financial system. Activities
in this regard included: the sustained push for the re-enactment of the BOFI Act;
1

Central Bank of Nigeria Annual Report—2011
9
the collaboration with stakeholders for the passage of some ―Quick-win-Bills‖ to
actualise the Financial System Strategy (FSS) 2020 initiatives and management
of cases involving the Bank. Others included publication in the Federal
Government Gazette of the expanded definition of ―Other Financial
Institutions‖ under section 66 of the BOFIA to include ―Financial Holding
Company‖ and capacity building.‖
The Bank was inundated with many cases of litigation out of which 28 were
decided in favour of the Bank, 2 against and one settled out of court. Most of
the decisions in favour of the Bank endorsed its statutory powers to take
corrective measures in furtherance of its mandate. The Bank also executed
agreements with point of sale (POS) terminal manufacturers in furtherance of
the cash-less policy. It pursued the passage of the Asset Management
Corporation of Nigeria (AMCON) Bill and was awaiting the passage of bills for
the establishment of the Office of the Nigerian Financial Ombudsman, the
Nigeria International Financial Centre and the National Alternative Dispute
Resolution Regulatory Commission.
1.1.7 Security Services
The Bank enhanced and sustained corporate security in its workplace,
particularly in the areas of asset protection, personnel safety and operational
resilience. The Security Committee, under the Chairmanship of the Deputy
Governor (Corporate Services), comprised two other deputy governors and
some departmental directors as members, and was established with the aim of
providing an overall security policy and a strategic management framework for
the Bank. The Bank upgraded its security equipment and collaborated with the
Office of the National Security Adviser to determine the appropriate security
measures to be adopted for the Bank‘s critical assets. In the face of emerging
security challenges, the Bank collaborated with other security agencies and
reinforced its security apparatus around the Head Office and the branches.
Other activities carried out included: security assessment and safety audit of
1
Central Bank of Nigeria Annual Report—2011
10
the Bank‘s facilities to determine their compliance with best practice and
ensure the enforcement of the provisions of the CBN Act 2007 on the abuse of
the Naira.
1.1.8 Internal Audit
One hundred and five (105) routine audits of the identified forty-seven (47)
processes across business units, fifty-four (54) departmental (Administrators‘
Offices) audits, one hundred and eleven (111) routine branch audits, and
eighteen (18) IT audits were carried out. Twelve (12) critical investigations and
other ad-hoc activities were conducted. Two hundred and eighty-two (282)
currency disposal operations requiring audit witnesses were completed. In the
absence of any material or significant irregularities or cases of fraud uncovered,
a reasonable assurance opinion was expressed by the internal auditors to the
effect that no major weakness in the overall governance, risk and control
system was observed.
1.1.9 Risk Management
The Bank strengthened its Enterprise Risk Management system by designing
initiatives to protect and reinforce the Bank‘s control system. In line with best
practice, the Bank commenced the Risk Control Self-Assessment (RCSA) project
in three phases. The first and second phases, which lasted from May - June and
July - October, 2011 respectively were completed and signed-off for Finance
and Information Technology Departments as well as five branches – Abuja,
Enugu, Lagos, Kano and Port Harcourt. In the third phase (October-December,
2011), the project was initiated for two departments (Governors‘ and Reserve
Management Departments) and four branches – Benin, Ibadan, Kaduna and
Yola.
The Bank reinforced its Information Risk Management system with a view to
delivering enhanced confidentiality, integrity and availability of information
resources. The Bank commenced an initial gap analysis on its IT infrastructure
and processes benchmarked to the International Standard on Information
1

Central Bank of Nigeria Annual Report—2011
11
Security Management System (ISMS) for this purpose. In addition, the internal risk
framework was being reviewed to provide guidelines for identification and
mitigation of information risks.
1.1.10 Strategic Initiatives and Business Process Management
The Bank sustained its effort at improving the efficiency of its business processes
through the implementation of strategic initiatives. The initiatives included
among others: improving the quality of banks; redefining the Financial System
Strategy framework; developing an exit strategy for the Asset Management
Corporation of Nigeria (AMCON); developing an enterprise-wide risk
management framework; deepening economic growth through a Financial
Inclusion Strategy and developing a cash holding model under the cash-less
programme. In addition, the Bank approved the appointment of a consulting
firm to implement the balanced scorecard to drive Corporate Performance
Management and Strategy.
1.1.11 Communications
The Bank‘s effort at improving transparency in the conduct of monetary policy,
through regular interactions with stakeholders and the general public, were
sustained. These activities involved briefings and luncheons with media
executives, publicising the decisions of the MPC and the Bankers‘ Committee.
Similarly, the Management of the Bank briefed the Presidency, the National
Assembly, the Federal Executive Council, the National Economic Council and
committees of the two chambers of the National Assembly on the new policies
of non-interest banking, the cash-less project and banking reforms and
provided information on the performance of the economy.
In line with the Bank‘s determination to foster learning and strengthen the
capacity of media practitioners to ensure accurate and objective reporting of
the Bank‘s policies and programmes, a seminar for Finance Correspondents
and Business Editors was held in Yola, Adamawa State, from September 28 to
1

Central Bank of Nigeria Annual Report—2011
12
30, 2011with the theme, ―Non-Interest Banking in Nigeria: Issues, Challenges and
Prospects‖.
1.1.12 Anti-Corruption and Ethical Issues
The Bank developed a Code of Business Ethics and Compliance (COBEC), and
a Strategic Ethics and Compliance Framework (SECF) for 2011-2014, which was
validated by the World Bank to ensure compliance with best practice. It
conducted seminars on ―Enhanced Productivity for Effective Service Delivery‖
for various grades of staff. It also organised workshops for its drivers and service
coordinators in three zones – Kaduna, Enugu, Lagos and Ibadan with the
theme; ―Ethical Conduct in Service Delivery in CBN‖ to entrench zero-tolerance
to corruption among staff.
The Bank received and processed 10,845 e-mails on various financial crimes,
particularly advance fee fraud. The issues were promptly reported to the law
enforcement agencies in order to protect potential victims from scammers. It
received and investigated 33 complaints against deposit money banks (DMBs);
and collaborated with various institutions, such as the Independent Corrupt
Practices and Other Related Offences Commission (ICPC), the Economic and
Financial Crimes Commission (EFCC) and the Nigerian Postal Services (NIPOST)
in the fight against financial crimes. The Bank participated in the review of the
draft of the National Strategy for Anti-Corruption at the Inter-Agency Task Team
(IATT), in collaboration with the Office of the Attorney-General of the
Federation. It also worked with the ‗Justice for All‘ initiative and the United
Kingdom‘s Department for International Development (DFID) to develop a
Corruption Prevention Strategy Framework for Nigeria.
The CBN published ―Transparency Magazine‖ for distribution to staff and the
public and carried out mandatory ethical compliance visits to strategic
business units, based on set criteria. It collaborated with the Office of the
Special Adviser to the President on Ethics and Values to contribute to the
1

Central Bank of Nigeria Annual Report—2011
13
achievement of the Transformation Agenda of the Federal Government. The
Bank also worked with the Code of Conduct Bureau on a Memorandum of
Understanding (MoU) that would help facilitate the achievement of its
mandate.
1.1.13 Financial System Strategy (FSS) 20: 2020
The CBN initiated a system-wide mobilization programme to transit the country
to the International Financial Reporting Standard (IFRS) and concluded work on
the FSS20: 2020 portal/website www.fss2020.gov.ng. It entered into a technical
assistance agreement with the German Development Agency (GTZ) to
develop the FSS 2020 Reform Tool Kit and conduct due diligence on
implementing institutions.
1.1.14 Staff
The Bank recruited eight hundred and twenty-seven (827) personnel, including
staff of the defunct National Board for Community Banks (NBCB). The new staff
comprised eleven (11) executives, six hundred and thirty-one (631) senior, one
hundred and eighty-three (183) junior and two (2) contract staff. All the new
hires, except ten (10), attended induction programmes to apprise them on the
activities of the Bank. The Bank, however, lost the services of twenty-five (25)
staff through death, four hundred and twenty-nine (429) voluntary retirements,
thirty-seven (37) mandatory retirements, two (2) compulsory retirements and
three (3) resignations. Furthermore, one (1) staff withdrew his service and one
(1) was dismissed.
The staff strength at end-December, 2011 stood at 5,844, compared with 5,568
in the previous year. As part of the incentives to boost morale and enhance
performance, the Bank promoted one thousand, nine hundred and thirty-one
(1,931) staff in 2011. The promoted staff comprised seventy one (71) executives,
one thousand, one hundred and sixty (1,160) senior and seven hundred (700)
junior staff. Seventeen (17) approvals for study leave were granted, while seven
1

Central Bank of Nigeria Annual Report—2011
14
hundred and ninety-two (792) appointments were confirmed, which comprised
five hundred and twenty five (525) senior and two hundred and sixty-seven
(267) junior. The Bank honoured four hundred and fifty-three (453) staff with
Long Service Awards. The Bank also conducted recruitment exercises for the
African Central Bank Steering and Non-Interest Banking Committees.
The Bank approved, during the year, a gender-affirmation policy that provides
for 35 per cent of all positions in CBN for women.
The number of pensioners in the Bank increased from 5,095 in 2010 to 5,553,
while the lingering face-off between the Bank and its pensioners was resolved
by a ruling of the Supreme Court.
Figure 1.1: Recruitment of New Employees in 2011
Executive, 11
Senior, 631
Junior, 183
Contract, 2
1

Central Bank of Nigeria Annual Report—2011
15
Figure 1.2: Staff Strength by Gender as at December, 2011
1.1.15 Medical Services
In order to sustain a healthy workforce, the CBN undertook various medical
interventions. Seventy four thousand, two hundred and seventy (74,270) cases
involving staff and their dependants were attended to at the Staff Clinic.
Eleven thousand, and twenty-seven (11,027) cases were referred to various
stand-by hospitals, while seventy-seven (77) staff and dependants were sent on
overseas medical treatment. Seven thousand and eighty-six (7,086) persons
were vaccinated. Other interventions included: corporate disease prevention
screening of three thousand, five hundred and eighty-one (3,581) staff and pre-
employment screening of eight hundred and twenty-six new staff. A ―Healthy
Lifestyle Seminar‖ was conducted, and one thousand, one hundred and four
(1,104) executives and senior managers, as well as two thousand, five hundred
and four managers (2,504) and below attended. Health Education series on
topical health issues were delivered to staff during the year. Specialist clinics in
Ophthalmology, Nutrition, Physiotherapy, and ENT were opened in Abuja and
Lagos clinics. Side Laboratory services commenced in the Zonal Clinics (Kano,
Ibadan, Bauchi and Enugu) in addition to the existing ones in Abuja and Lagos.
Furthermore, the Bank sponsored medical screening for four hundred and
eighty-four (484) executives in the year. Overall, a significant cure rate was
achieved for staff, resulting in an improved employees‘ health status.
0
200
400
600
800
1000
1200
1400
Executive Senior Junior
Nu
mb
er
of
Staf
f
Female Male
1

Central Bank of Nigeria Annual Report—2011
16
1.1.16 Training
The efforts at capacity building, through staff competency development and
skills enhancement, were intensified. Consequently, the Bank sponsored staff
training programmes, including workshops, conferences, seminars and courses
within and outside Nigeria. Staff benefited from two thousand, six hundred and
twenty-seven (2,627) training slots involving six hundred and fourteen (614)
executive, one thousand, six hundred and forty-four (1,644) senior staff and
three hundred and sixty-nine (369) junior staff, covering leadership
development, IT/process training, In-Plant courses, organizational development,
specialized skills and general management development. Four hundred and
seventy-seven (477) staff benefited from foreign programmes. Entrepreneurial
development seminars were also organized for members of the National Youth
Service Corps (NYSC) who served in the Bank. It was aimed at preparing the
youth corps members for a productive life after their mandatory service year.
1.1.17 Recreational Activities
The CBN sponsored various competitions to sustain the development of sporting
activities and promote a healthy life style through physical fitness in Nigeria.
These included the lawn tennis, golf and football. The fifth edition of the CBN
Junior Tennis Championship took place at the Lagos Lawn Tennis Club from
February 28 to March 4, 2011. In addition, the thirty-third edition of the CBN
Senior Open Tennis Championship was held at the National Stadium, Lagos
from May 27 to June 4, 2011. With respect to football, the First Bank of Nigeria
Football Club won the final of the All Financial Institutions Football Competition
played at the M. K. O. Abiola Stadium, Abeokuta, Ogun State on November 5,
2011. The final of the thirty-second edition of the Governor‘s Cup Football
Competition for all CBN branches played at the Kwara State Stadium, Ilorin on
September 17, 2011, was won by Sokoto Branch. The Bank also sponsored the
fifth edition of the CBN Governor‘s Golf Tournament, which took place at the
IBB International Golf and Country Club, Abuja, from December 10 - 11, 2011. In
1

Central Bank of Nigeria Annual Report—2011
17
addition, the Bank‘s workplace gymnasium at the Bank‘s Corporate Head
Office continued to be patronised by staff.
1.1.18 Corporate Social Responsibility
The CBN continued to perform its corporate social responsibility functions by
promoting knowledge through capacity building, youth development,
provision of financial and other assistance to organisations/activity groups for
the hosting of conferences, seminars, workshops, etc, which were of strategic
national interest. The Bank intervened in tertiary institutions under the ―Centres
of Excellence‖ projects at the University of Nigeria, Enugu Campus, University of
Ibadan and Ahmadu Bello University, Zaria, as well as in twelve (12) other
institutions. Additional twelve (12) projects in various institutions were awarded.
It also supported physically challenged groups and gender-related issues.
The CBN also purchased Plot 658, Ahmadu Bello Way, Garki, Abuja to be
converted to an International Convention Centre.
1.1.19 Staff Social Responsibility
Staff of the CBN sustained their support for the less privileged in society through
regular contributions to the Alms Collection Scheme of the Bank. The
cumulative contribution at end - December, 2011 stood at N67.49 million.
1.2 RESEARCH AND COLLABORATIVE ACTIVITIES
The CBN undertook research studies, in line with its core mandate/mission and
disseminated information on key issues relating to the economy. The preliminary
draft reports on a Dynamic Stochastic General Equilibrium (DSGE) Model for
Monetary Policy Analysis in Nigeria and Nigeria‟s External and Fiscal Sectors
Models for Policy Analysis were completed.
1

Central Bank of Nigeria Annual Report—2011
18
The regular publications of the Bank during the review period were: the 2010
Annual Report; the 2011 Half-Year Economic Report; the Financial Stability
Report; the CBN Economic and Financial Review; 2010 Statistical Bulletin; the
CBN Journal of Applied Statistics; the Monetary
Policy Review; and the CBN Bullion. Furthermore,
two occasional papers on “Real Exchange Rate
Misalignment: An application of Behavioural
Equilibrium Exchange Rate (BEER) to Nigeria”; and
“An Assessment of the Operations of the Presidential Initiatives on Agriculture in
Nigeria”, as well as a book, on “The Changing Structure of the Nigerian
Economy‖, second edition, and a monograph ―Understanding Monetary Policy
Series” were also published.
An international conference organised by the CBN on ―The Nigerian Incentive-
based Risk Sharing System for Agricultural Lending (NIRSAL)‖ was held at the
Transcorp Hilton Hotel, Abuja, from December 6 to 7, 2011. The Bank continued
to collaborate with the National Bureau of Statistics (NBS) to generate a series
of macroeconomic indicators, through the conduct of the 2010 National
Economic Survey.
In recognition of the existence of a pool of experts and professionals in various
disciplines at the CBN, the Bank received and honoured requests for the
presentation of papers from various institutions, including sub-regional, regional
and global organizations, such as the West African Institute for Financial and
Economic Management (WAIFEM), the African Economic Research Consortium
(AERC) and the International Monetary Fund (IMF). Staff papers were also
presented at international and local professional conferences, including those
of the International Conference on Economic Modelling (ECOMOD) in Istanbul,
Turkey; the African Econometric Society (AES); the Nigerian Economic Society
(NES); the Nigerian Statistical Association (NSA); the Chartered Institute of
Bankers of Nigeria; and the Farm Management Association of Nigeria (FAMAN).
1
The CBN undertook research studies, in line with its core mandate/missions and disseminated information on key issues relating to the
economy.

Central Bank of Nigeria Annual Report—2011
19
Box 1: STRIDES IN MACROECONOMETRIC MODELLING AT THE CBN
The forward-looking nature of monetary policy requires the Bank to have sufficient information
on the dynamics of the economic environment to enable the MPC take informed decisions. In
order to achieve this, the Bank employs a ‗suite of models‘ to facilitate the conduct of
monetary policy. The existing CBN Macroeconometric Model of the Nigerian Economy (MMN)
was refined and updated during the year. In addition, the Bank successfully built the Dynamic
Stochastic General Equilibrium (DSGE) model.
The DSGE model, designed for policy analysis, would enable the Bank to have sufficient
information to determine, among others, its monetary policy rate, the output gap, the
exchange rate pass-through, the sacrifice ratio and the inflation threshold. Consequently, new
features were added to reflect the peculiarities of the Nigerian economy. In addition, the
model was based on microeconomic foundations and followed the new-Keynesian approach,
comprised three rational economic agents -- households, firms and the monetary authority. In
general, the model was found to be suitable for monetary policy analysis in Nigeria.
The Bank also commenced the building of sectoral models (fiscal, external, real and monetary)
to complement the macroeconometric model. The models were designed to forecast key
macroeconomic indicators in various sectors of the Nigerian economy. The sectoral models
were generally disaggregated and played down the feedback effects associated with large-
scale macroeconometric models. The models make use of time series forecasting techniques
for projecting key macroeconomic indicators, through the simulation of policy scenarios. The
preliminary work on the fiscal and external models was successfully completed.
The Bank concluded plans to produce a Quarterly Macroeconomic Outlook of the Nigerian
Economy which would make monetary policy transparent and credible. Thus, the use of fan
charts was introduced as a communication tool to inform the general public about the
uncertainty relating to macroeconomic forecasts and to facilitate discussion among policy
makers and experts about the distribution of forecast risks.
1.3 THE CBN BALANCE SHEET
1.3.1 Income and Appropriation
The audited financial statements of the CBN for the year ended 31st December,
2011 indicated that total income was N311.2 billion, a decline of 44.6 per cent
from the level in 2010. The decline in income largely reflected the significant fall
(-88.4 per cent) in income from realized gains on foreign currency. Similarly,
operating cost declined by 23.0 per cent in 2011, thus, bringing the operating
surplus before provisions to N80.2 billion, compared with N46.5 billion in 2010. In
accordance with the provisions of Section 22 (1) and (2) of the Fiscal
Responsibility Act (FRA) 2007, the sum of N64.1 billion was due to the Federal
Government, while the balance accrued to general reserve.
1

Central Bank of Nigeria Annual Report—2011
20
1.3.2 Assets and Liabilities
The size of CBN‘s balance sheet increased in 2011 as total assets/liabilities grew
appreciably by 66.6 per cent to N11.3 trillion. The assets position reflected a
phenomenal growth of over 3,000 per cent in investments, driven largely by the
Bank‘s investment in AMCON bonds and Bank of Industry Debenture, as loans
and advances fell by 52.9 per cent. External reserves, Holdings of Special
Drawing Rights, Federal Government Securities, Fixed assets and other assets
grew by 9.6, 4.4, 12.6, 25.4 and 24.7 per cent, respectively. The corresponding
increase on the liability side was driven by increases in both the CBN Instruments
and other financial liabilities which grew by 1,352.2 and 279.1 per cent,
respectively. Deposits, Notes and Coins in circulation, and IMF allocation of
Special Drawing Rights also rose by 28.1, 13.6 and 4.4 per cent, respectively. The
paid-up capital of the Bank remained at N5.0 billion while the general reserve
fund increased by 13.3 per cent to N94.6 billion.
1

Central Bank of Nigeria Annual Report—2011
21
onetary management in 2011 was influenced largely by developments in the domestic
and external environment. Growth in the major monetary aggregates, which remained
moderate for most of the year, rose substantially towards the end of the year, exceeding the
programme benchmark and the level attained at the end of the preceding year. Open
market operation (OMO) was the main instrument of monetary policy, complemented with
foreign exchange market interventions and discount window operations, such as the
standing facilities. The Monetary Policy Rate (MPR) was reviewed upwards six times during
the year, in line with the liquidity conditions. Interest rates were generally higher than in the
preceding year. Also, the yields on fixed income securities across various maturities were
higher than in 2010.
The Wholesale Dutch Auction System (wDAS) subsisted in the foreign exchange market,
while the Naira exchange rate remained relatively stable in 2011. The payments and
settlement landscape improved with increased use of e-money products. Furthermore, the
CBN continued its „clean naira note‟ policy and also outsourced the maintenance of
currency processing machines to equipment manufacturers, for greater efficiency and cost-
effectiveness. The Bank sustained its developmental functions through the Agricultural Credit
Guarantee Scheme Fund (ACGSF) and infrastructure financing, among other programmes.
2.1 MONETARY OPERATIONS
2.1.1 Monetary and Credit Developments
Monetary growth rose sharply at the end of 2011 after moderate growth for
most of the year and despite the tight policy stance of the Bank. The
development reflected largely the substantial growth in domestic credit arising
from fiscal operations and increased claims on AMCON. Consequently, the
growth of key monetary aggregates at end-December 2011 exceeded the
indicative benchmark for fiscal 2011 and the outcome at the end of the
preceding year.
Relative to end-December 2010, the broad measure of money, M2, grew by
15.4 per cent to N13,300.3 billion, compared with the growth rate of 6.9 per
cent at end of the preceding year and the indicative benchmark of 13.6 per
cent for fiscal 2011. The growth in M2 was driven by the significant increase in
M
CHAPTER TWO
MONETARY POLICY, SURVEILLANCE
ACTIVITIES AND OPERATIONS OF THE CBN
IN 2011

Central Bank of Nigeria Annual Report—2011
22
domestic credit (net) and foreign assets (net) of the banking system, but was
moderated by the substantial decline of 70.3 per cent in other assets (net) of
the banking system. Narrow money (M1) grew by 21.5 per cent at end-
December 2011, compared with the growth of 11.1 per cent at the end of the
preceding year. Aggregate bank credit to
the domestic economy (net) grew by 42.4
per cent, compared with the indicative
benchmark of 29.3 per cent for fiscal 2011
and the growth of 10.0 per cent at end-
December 2010. The development reflected
the 52.7 and 31.3 per cent growth in net claims on the Federal Government
and the private sector, respectively. Base money, the Bank‘s operating target
for monetary policy, stood at N2,784.3 billion, representing an increase of 50.9
and 12.7 per cent over the level at the end of the preceding year and the
indicative benchmark for 2011, respectively.
Ou
tco
m
e
Ta
rge
t
Ou
tco
m
e
Ta
rge
t
Ou
tco
m
e
Ta
rge
t
Ou
tco
m
e
Ta
rge
t
Ou
tco
m
e
Ta
rge
t
Growth in base money 22.6 3.3 29.6 20.8 6.8 3.6 11.6 35.9 50.9 12.7
Growth in broad money
(M2)44.2 24.1 57.8 45.0 17.6 20.8 6.90 29.3 15.4 13.6
Growth in narrow money
(M1)36.6 37.64 55.9 65.4 3.3 32.2 11.1 22.4 21.5 15.8
Growth in aggregate
bank credit276.4 -29.9 84.2 65.7 59.6 87.0 10.0 51.4 42.4 29.3
Growth in bank credit to
private sector90.8 30.0 59.4 54.7 26.6 44.9 -3.8 31.5 31.6 29.1
Inflation rate 6.6 9.0 15.1 9.0 13.9 9.0 11.8 11.2 10.3 10.0
Growth in real GDP 6.5 10.0 6.0 7.5 7.0 5.0 7.9 6.1 7.7 7.0
2007 2008 2009
Table 2.1 : Key Policy Targets and Outcomes, 2007 - 2011 (per cent)
2010 2011
Source: CBN
1/ Revised
2/Provisional
Monetary growth rose sharply at the end of 2011 despite the tight policy stance of the Bank. The development reflected largely the substantial growth in domestic credit arising from fiscal operations and increased claims on
AMCON.
2

Central Bank of Nigeria Annual Report—2011
23
2007 2008 2009 2010
< 10.0 per cent 6.6 15.1 12 11.8
≤ 5.0 per cent of retained
revenue of the GovernmentNil Nil Nil Nil
≤ 4.0 per cent 0.5 0.2 3.3 3.7
≥ 3 Months of import cover 21.6 15.9 16.3 7.2
Table 2.2: WAMZ Convergence Criteria, 2007 - 2011
TargetAchievement
2011
Inflation rate 10.3
Ways & Means Advances Nil
Deficit to GDP Ratio 3.2
Gross Official Reserve 6.5 Source: CBN
Nigeria met all but one WAMZ convergence criteria, inflation, in 2011 despite
the weak global economic recovery.
2.1.2 Liquidity Management
Monetary policy in 2011, as in the preceding year, was conducted to ensure
adequate liquidity in the banking system. Liquidity management was, therefore,
geared towards a continuous improvement in the liquidity condition and
efficiency of the financial markets in order to achieve the objective of
monetary and price stability.
The Bank embarked on a mix of policy measures to ensure price stability and a
steady flow of credit to the real sector of the economy, including: six upward
reviews of the Monetary Policy Rate (MPR) from 6.25 per cent in December
2010 to 12.00 per cent in December 2011 and retention of the symmetric
corridor of +/- 200 basis points around the
MPR. During the year, the Bank adopted an
operational framework of Reserve Averaging
for monetary policy implementation in an
attempt to smoothen interest rate volatility.
This framework was, however, suspended at
an extraordinary meeting of the MPC held on October 10, 2011 to rein in
liquidity surfeit arising largely from fiscal operations. In addition, the Bank
reduced the net open position limit of banks from 5.00 to 1.00 per cent and
later reviewed it to 3.0 per cent. Furthermore, the Bank introduced the wDAS-
Forwards in the foreign exchange market to mitigate financial market risks. The
Liquidity management was, therefore, geared towards a continuous improvement in the liquidity and efficiency of the financial markets in order to achieve the objective of monetary
and price stability.
2

Central Bank of Nigeria Annual Report—2011
24
Bank also adjusted the mid-point of the official exchange rate band from
N150/US$1 +/-3 per cent to N155/US$1 +/-3 per cent in order to maintain
adequate reserves and safeguard the value of the Naira
Other policy measures included the upward review of the Liquidity Ratio (LR) of
DMBs to 30.00 per cent from 25.00 per cent, at the MPC meeting of January 24
– 25, 2011. The Bank conducted open market operations (OMOs),
complemented by cash and liquidity ratios, standing facilities and repurchase
transactions in moderating liquidity in the system. The domestic money market
instruments were supplemented by foreign exchange market interventions at
both the wholesale Dutch Auction System (wDAS) and the interbank segments.
The banking sector crisis resolution, involving the transfer of non-performing
loans from the balance sheets of DMBs to the AMCON, resulted in improvement
in the liquidity position of banks. That position was further exacerbated by the
fiscal operations of the Federal Government in the review period.
The monetary policy measures implemented in 2011 moderated the growth of
banking system liquidity and interest rate volatility. Consequently, reserve
money and monetary aggregates surpassed the targets for the year. Reserve
money, which stood at N2,784.3 billion at end-December 2011, was N269.0
billion or 10.7 per cent above the indicative benchmark of N2,515.3 billion for
the year. This was in contrast to the reserve money of N1,845.7 billion at end-
December 2010, which was N386.7 billion (17.32 per cent) below the indicative
benchmark of N2,232.4 billion for that year. The development was due to fiscal
expansion and liquidity injection through purchases of AMCON bonds as well as
the upward review of the CRR from 1 per cent to 0.8 per cent during the year.
2

Central Bank of Nigeria Annual Report—2011
25
2.1.3 Interest Rate Policy and Developments
Developments in interest rates reflected the
credit and liquidity conditions in the banking
system during 2011. The MPR was raised six
(6) times, from 6.25 per cent in January to
12.0 per cent in October 2011; Cash Reserve Requirement (CRR) was raised
three (3) times from 1.0 per cent in January 2011 to 8.0 per cent in October;
while the Liquidity Ratio (LR) was raised once from 25.0 to 30.0 per cent in
January 2011. The MPC decisions signalled to the market the clear and
unambiguous commitment to the attainment of the Bank‘s key mandate of
monetary and price stability. The upward review of the MPR during the year
was aimed at containing the adverse effects of excess liquidity that arose from
government fiscal operations and the purchase of AMCON Bonds.
2.1.3.1 Money Market Rates
The annual average of money market rates was generally higher than their
levels in 2010. The development was attributable to the suspension of the
Reserve Averaging Scheme and the tight monetary policy, involving the
upward review of MPR and CRR, from 6.25 and 1.00 to 12.00 and 8.00 per cent,
respectively. Interbank rates remained stable in the first quarter of 2011, but
fluctuated thereafter. The weighted average collaterised open-buy-back (OBB)
rate increased from 7.5 per cent at end-December 2010 to 9.6 per cent at end-
June 2011, and further to 14.1 per cent at end-December 2011. The annual
weighted average interbank call rate and open-buy-back (OBB) rate rose to
10.71 and 9.65 per cent, from their respective levels of 4.32 and 2.86 per cent in
2010. The Nigerian Interbank Offer Rate (NIBOR) for 7-day and 30-day tenors
averaged 11.70 and 12.80 per cent, respectively, in 2011, from 6.00 and 8.55
per cent in 2010.
Developments in interest rates reflected the credit and liquidity conditions in the banking system.
2

Central Bank of Nigeria Annual Report—2011
26
Dec-10 6.25 10.17 7.46 10.74 12.27
Jan-11 6.50 6.13 5.84 7.83 10.15
Feb-11 6.50 8.31 7.66 9.50 11.19
Mar-11 7.50 8.78 8.22 10.26 11.47
Apr-11 7.50 10.74 9.35 11.54 12.51
May-11 8.00 9.61 8.80 10.41 11.67
Jun-11 8.00 11.66 9.59 12.39 13.15
Jul-11 8.75 8.87 7.61 9.91 11.45
Aug-11 8.75 8.55 8.18 9.47 10.79
Sep-11 9.25 10.50 10.06 11.07 11.74
Oct-11 12.00 14.10 12.38 15.21 15.74
Nov-11 12.00 15.72 14.04 16.47 17.00
Dec-11 12.00 15.50 14.06 16.30 16.74
Average 2011 8.90 10.71 9.65 11.70 12.80
Average 2010 6.08 4.32 2.86 6.00 8.55
Table 2.3: Money Market Rates (per cent)
WEIGHTED AVERAGE
Month MPR Call Rate OBB
NIBOR 30-
days
NIBOR
7-days
Source: CBN
2.1.3.2 Deposit Rates
Available data showed that, in general, DMBs‘ deposit rates fell in 2011. The
annual average savings deposit rate fell slightly by 0.7 percentage point to 1.4
per cent. Similarly, the average deposit rates on various maturities declined to a
range of 2.4 – 6.1 per cent in 2011, from a range of 2.5 – 6.9 per cent at end-
December 2010.
0
5
10
15
20
Dec. 10 Mar '11 Jun '11 Sep '11 Dec '11
Per
cen
t
Figure 2.1: Money Market Rates in 2011
MPR Call Rate OBB
2

Central Bank of Nigeria Annual Report—2011
27
2.1.3.3 Lending Rates
The annual weighted average prime and maximum lending rates decreased
by 1.6 and 0.1 percentage points to 16.03 and 22.44 per cent, respectively, in
2011.
Consequently, the spread between the average
term deposit and maximum lending rates widened
to 17.65, from 16.91 percentage points in 2010.
With the year-on-year inflation rate at 10.3 per
cent in December 2011, all the deposit rates were negative in real terms,
while lending rates were positive in real terms.
1.3
1.8
2.3
2.8
3.3
3.8
15
19
23
27
2007 2008 2009 2010 2011
per
cen
t
Per
cen
t
Figure 2.2 Savings and Lending Rates (Prime and Maximum)
Maximum Lending Prime Lending Savings Rate (right axis)
0
5
10
15
20
25
30
2007 2008 2009 2010 2011
Per
cen
t
Figure 2.3: Spread between the Average Deposit and Maximum Lending Rates
Maximum Lending Rate Average Term Deposit Rate
The spread between the average term deposit and maximum lending rates widened to 17.6 percentage points, from 16.9 percentage points
in 2010.
2

Central Bank of Nigeria Annual Report—2011
28
2.1.3.4 Return on Fixed Income Securities - The Yield Curve
Analysis of the return on fixed income securities in 2011 showed that average
yields were generally higher in 2011 than 2010. The yield curve, as in the
preceding year, remained typically upward-sloping, reflecting investors‘
optimism about the future growth prospects of the economy. Towards the end
of the year, bond yields on short-term maturities increased progressively,
reflecting the impact of the upward review of the Banks‘ policy rate. The yield
spread (the difference between the yield on the longest and shortest
maturities) stood at 3.2 percentage points, compared with 5.5 percentage
points recorded in the preceding year.
A plot of the bond price of the 6-month maturity and weighted average inter-
bank tenored rate showed that the bond price and interest rates typically
moved in opposite directions.
-20
-10
0
10
20
2007 2008 2009 2010 2011
Rat
es
Figure 2.4: Real Interest Rates
Maximum Lending Rate Savings Rate Prime Lending Rate
4.0000
6.0000
8.0000
10.0000
12.0000
14.0000
16.0000
18.0000
6months 2yr 3.5yr 5yr 6.5yr 8yr 9.5yr 11yr 12.5yr 14yr 15.5yr 17yr 18.5yr 20yr
per
cen
t
Figure 2.5 Government Bonds and Average Yield
2010. Avg par yield 2010. Avg TSR-yield 2011. Avg par yield 2011. Avg TSR-yield
2

Central Bank of Nigeria Annual Report—2011
29
2.1.4 Payments, Clearing and Settlement Developments
The CBN, in collaboration with other stakeholders, continued to take measures
aimed at improving the efficiency of the payments system, including the
following measures:
Granted 14 mobile payment licences to enhance financial inclusion;
Conducted nationwide sensitization workshops for MDAs on the adoption
of end-to-end electronic payment (for government suppliers, salaries,
pensions and taxes);
Approved guidelines on the underlisted initiatives, with a view to
increasing public confidence in the system:
o Electronic payment of taxes,
o Electronic payment of salaries and pensions by organisations with
more than 50 employees, and
o Electronic payment of government suppliers;
Acquired a new Real -Time Gross Settlement (RTGS)system to meet the
requirement of FSS20-2020;
Followed-up on the Payments Management Bill earlier presented to the
National Assembly, through the Federal Ministry of Justice;
Issued a new Point-of-Sale(POS) guidelines, which define the industry
structure for POS services as well as the roles and responsibilities of various
stakeholders, including the introduction of a Payment Terminal Services
90
92
94
96
98
100
102
0
2
4
6
8
10
12
14
16
18
Dec. 10 Jan' 11 Feb '11 Mar '11 Apr '11 May'11
Jun '11 Jul '11 Aug.11
Sep '11 Oct '11 Nov '11Dec '11
Pri
ce
Rat
e
Figure 2.6 Interest Rate & Price of 6-Month Maturity
Wtd Avg Interbank Tenored 6-month price (on right axis)
2

Central Bank of Nigeria Annual Report—2011
30
Aggregator (PTSA) and the introduction of a standardised T+1 settlement,
amongst other things;
Licensed six (6) Payment Terminal Service Providers (PTSPs);
Facilitated the negotiation with POS terminal manufacturers in order to
obtain discounted prices and increased local service/support;
Sensitized the public as a means of creating awareness on the cash-less
policy;
Launched the Nigerian Electronic Fraud Forum (NeFF) to proactively
manage e-fraud attempts and losses;
Facilitated the transformation of Nigeria Interbank Settlement System
(NIBSS) Plc to effectively play the role of PTSA;
Developed a detailed Monitoring Framework to track and assess the
impact of cash-less Lagos on a monthly basis, in terms of usage of
electronic channels and cash circulation and cash holding rates. These
would enable the CBN monitor the progress of the scheme and
engender public confidence; and
Facilitated the mass deployment of shared POS terminals by banks and
service providers, under the shared services project, with a view to
reducing operational cost.
The Bank also initiated a cash-less policy in 2011 as part of its efforts to further
improve efficiency of the payments system, among others.
Box 2: The CBN’s Cash-less Policy
The Central Bank of Nigeria (CBN) introduced a new policy that aims at reducing the amount
of physical cash (coins and notes) in circulation, and encouraging more electronic-based
transactions.
Objectives of the Policy were to:
Drive the development and modernization of the country‘s payments system, in line with
Nigeria‘s Vision 2020 goal of being amongst the top 20 economies by the year 2020;
Reduce the cost of banking services (including cost of credit) and drive financial
inclusion by providing more efficient transaction options and greater reach;
Improve the effectiveness of monetary policy in managing inflation and driving
economic growth;
Curb some of the adverse consequences associated with the huge usage of physical
cash in the economy, including:
a) the high cost of cash along the value chain - from the CBN & the banks to corporations,
traders and individuals,
2

Central Bank of Nigeria Annual Report—2011
31
b) the high risk of using cash: such as robberies and other cash-related crimes, and
c) inefficiency and corruption, including leakages and money laundering, amongst other
financial crimes.
Content of the Policy
The policy shall commence with a pilot run from January 1, 2012 in Lagos State (―tagged Cash-
less Lagos‖) with application of the following aspects:
Only cash-in-transit (CIT) licensed companies shall be allowed to provide cash pick-up
services. Banks will cease cash in transit lodgement services rendered to merchant-
customers in Lagos State from December 31, 2011. Any Bank that continues to offer
cash in transit lodgement services to merchants shall be sanctioned.
Third party cheques above N150, 000 shall not be eligible for encashment over the
counter. Value for such cheques shall be received through the clearing house.
The service charges/fees will not apply until March 30, 2012, in order to give consumers time to
migrate to electronic channels. DMBs would therefore continue to encourage their customers
to migrate to available e-payments channels.
Account Application
The cash-less policy applies to all accounts, including collection accounts. Banks are
expected to work with their corporate customers to arrange for suitable e-collection options.
Limits
The limits are cumulative withdrawal/deposits of N150,000 and N1,000,000 daily for individual
and corporate customers, respectively.
The limits apply to the account irrespective of the payment channel used. It also applies to
cash brought through CIT companies, as the CIT company only serves as a means of
transportation.
·Charges
The service charge for daily cumulative deposits above the limit into an account shall be borne
by the account holder. However, during the pilot-run in Lagos, individuals paying money from
Lagos, into an account outside Lagos, shall bear the charges for any single transaction above
the daily limit.
Interstate Transactions
Charges/fees shall apply for all transactions in Lagos, and on Lagos State-based accounts.
Transactions above the cumulative daily limit initiated out of Lagos State, and affecting a Lagos
based account shall not attract charges/fees, while transactions initiated from Lagos State,
and affecting an account outside Lagos, shall attract charges/fees.
The policy will eventually be rolled out to other regions across the country from June 1, 2012. The
policy however, does not prohibit withdrawals or deposits above the stipulated amounts, but
such transactions are subject to a handling charge.
Current Awareness/Engagement Status
The CBN had engaged in various enlightenment and sensitization programmes with various
stakeholders. The DMBs are expected to encourage their customers to migrate to available e-
payment channels
Expected Benefits of the Policy
A variety of benefits are expected to be derived by various stakeholders from an increased
utilization of e-payment. Such as:
Increased convenience; more service options; reduced risk of cash-related crimes;
cheaper access to cost of banking services for consumers;
Faster access to funds; reduced revenue leakage; minimised cash handling costs for
corporations; and
Increased tax collections; greater financial inclusion; enhanced accountability for
Government.
2

Central Bank of Nigeria Annual Report—2011
32
2.2 CURRENCY OPERATIONS
2.2.1 The Issue of Legal Tender
In order to meet the currency needs of the economy in 2011, the Bank
projected an indent of 3549.52 million pieces of banknotes of various
denominations. A total of 2, 649.52 million pieces or 74.6 per cent was ordered
to be printed by the Nigeria Security and Minting (NSPM) Plc. Out of this order,
the company delivered 2226.02 million pieces or 84.0 per cent by end
December, 2011. The balance of 900 million pieces of N500 and N1000 were
delivered during the year by foreign printers. The Bank‘s clean notes policy was
sustained in 2011 through the processing of banknotes into clean and unfit
notes, the withdrawal of unfit/soiled banknotes, and the re- issuance of the
clean and fit banknotes into circulation. A total of 113,982 boxes valued at
793,526 billion were processed and 122,642 boxes valued at 828,398 billion
audited. The total boxes audited included a closing balance of 8660 boxes in
2010 brought forward in 2011. Furthermore, a total of 6522.60 million pieces of
mint notes were issued in 2011, compared to 6,677.9 million pieces issued in the
corresponding period of 2010. The implementation of the approved
outsourcing of maintenance of currency processing machines, in order to
improve efficiency, continued under the year under review.
2.2.2 Currency in Circulation (CIC)
The currency in circulation at end-December 2011 stood at N1,565.76 billion,
representing an increase of 13.6 per cent over the level in 2010.The growth in
CIC reflected the high dominance of cash in the economy as well as an
increase in economic activities. The ratio of CIC to nominal GDP, which
measures the moniness of the economy, dropped from 4.7 per cent in 2010 to
4.3 per cent in 2011. The decline in the CIC/GDP ratio reflected increased use
of e-payment products such as electronic payment cards.
2

Central Bank of Nigeria Annual Report—2011
33
Figure 2.7a Currency in Circulation, 2007 - 2011
Figure 2.7b Ratio of Currency in Circulation to GDP
The denominational breakdown of the currency in circulation in 2011 is as
shown below:
Value Volume Value Volume Value Volume Value Volume Value
(N billion) (million) (N billion) (million) (N billion) (million) (N billion) (million) (N billion)
N2 81.9 0.16 104.5 0.21 114.5 228.9 107.83 0.22 107.87 0.22
N 1 615.4 0.62 532.2 0.53 490.6 490.65 530.11 0.53 581.23 0.58
50k 738.3 0.37 463.1 0.23 454.5 227.26 434.48 0.22 529.72 0.26
25k 19 0.01 240.6 0.06 212 53 196.53 0.049 339.12 0.08
10k 2.2 0.0002 235.1 0.02 228.3 228.82 212.82 0.021 302.89 0.03
1k 0 0 51.2 0.0005 57.4 0.57 48.74 0.0048 12.75 0.08
Sub Total 1,456.80 1.15 1,629.70 1.06 1,557.30 1,023.20 1,530.51 1.04 1,873.58 1.26
Notes
N1000 264.4 264.4 572.9 572.91 584.4 584.39 663.76 663.7 959.45 959.45
N500 707.2 353.6 801.9 400.93 852.8 426.4 1,027.78 513.89 726.22 363.10
N200 1,256.00 251.3 571.6 114.32 491.9 98.38 501.27 100.25 621.75 124.31
N100 494.9 49.5 323.6 32.36 350 35 341.12 34.11 507.90 50.77
N50 351.3 17.6 228 11.4 344.9 17.25 782.27 39.11 777.94 38.89
N20 823 16.5 827.3 16.55 769.5 15.39 752.65 15.1 788.67 15.77
N10 355.9 3.6 283.2 2.83 285.5 2.85 680.61 6.81 789.13 7.89
N5 579 2.9 533.1 2.67 720.5 3.6 837.93 4.19 865.38 4.33
Sub-Total 4,831.70 959.4 4,141.60 1,153.97 4,399.50 1,183.27 5,587.39 1,377.16 6,036.43 1,564.50
Total 6,288.50 960.55 5,768.30 1,155.03 5,956.80 1,184.30 7,117.90 1,378.20 7,910.01 1,565.76
2011
Coins
2007 2008 2009 2010
Volume
(million)
Source: CBN
0
500
1000
1500
2000
2007 2008 2009 2010 2011
Nai
ra B
illio
n
4.10
4.20
4.30
4.40
4.50
4.60
4.70
4.80
2007 2008 2009 2010 2011
pe
r ce
nt
2

Central Bank of Nigeria Annual Report—2011
34
2.3 FOREIGN EXCHANGE MANAGEMENT
The Bank retained the Wholesale Dutch Auction System (wDAS) as the
mechanism for the management of exchange rate in the foreign exchange
market in 2011. As part of its efforts to develop a liquid, deep market, minimize
risk in the Nigerian financial market and enhance the transmission of monetary
policy, the Bank introduced the foreign exchange forwards market on March
23, 2011. Short-tenored forwards foreign exchange transactions were approved
to provide hedging opportunities to end-users and smoothen foreign exchange
demand pressure.
2.3.1 Foreign Exchange Flows
The total foreign exchange inflow into the economy amounted to US$105.11
billion, an increase of 19.3 per cent above the level in 2010. The development
resulted from a significant growth in inflow through the CBN, which amounted
to US$47.21 billion. This represented an increase of 69.5 per cent over the level
of the previous year and accounted for 44.9 per cent of the total. The inflow
through autonomous sources accounted for 55.1 per cent of the total and
dropped by US$2.40 billion or 4.0 per cent to
US$57.90 billion. This development was due
to the fall in capital inflow and invisibles
(mainly ordinary domiciliary account and
over-the-counter purchases) by 48.4 and 4.3
per cent below their levels in 2010, respectively. The total foreign exchange
outflow grew by 28.8 per cent from the level in 2010 to US$50.42 billion. A
breakdown showed that the outflow through the CBN and autonomous
sources rose by 28.6 and 33.0 per cent over the levels in the preceding year to
US$48.77 billion and US$1.65 billion, respectively. Consequently, the net inflow
position improved by US$5.70 billion over the position in 2010 to US$54.69 billion.
Analysis of foreign exchange inflow through the CBN showed that receipts from
crude oil sales rose by 58.0 per cent above the level in 2010 to US$41.33 billion
and accounted for 87.6 per cent of the total. The increase in receipts was as a
The total foreign exchange inflow into the economy amounted to US$105.11 billion, an increase of 19.3 per cent above the levels in
2010.
2

Central Bank of Nigeria Annual Report—2011
35
result of the rise in crude oil output and prices in 2011. The non-oil component of
inflow through the CBN grew significantly by 249.0 per cent above the level in
2010 to US$5.88 billion. This was driven by a 145.1 per cent growth in other
official receipts to US$2.89 billion, wDAS purchases of US$2.0 billion and foreign
exchange swaps totaling US$0.78 billion. Earnings on reserves and investments,
however, fell by 56.5 per cent to US$0.22 billion as a result of the continued
weak recovery of the financial markets in the developed economies.
Foreign exchange outflow through the Bank rose by 28.6 per cent to US$48.77
billion in 2011. A disaggregation of the outflow indicated that the amount that
went to the foreign exchange market rose by US$11.02 billion to US$41.19 billion
and accounted for 84.4 per cent of the total in 2011. Of this, total wDAS
utilization was US$34.57 billion (US$29.78 billion in wDAS Sales, wDAS-forward
US$2.79 billion and interbank sales of US$2.0 billion). Foreign exchange sales to
BDCs amounted to US$5.91 billion, accounting for 12.1 per cent of the total and
was 10.8 per cent higher than the level in 2010. Other outflows were drawings
on letters of credit and National Priority Projects, which increased by 49.8 and
264.6 per cent to US$1.45 billion and US$0.07 billion, respectively. As a
component of total outflow, other official payments (payments to international
organizations and embassies, parastatals and estacode, NNPC/JV Cash calls,
contributions and grants and miscellaneous) declined by 10.3 per cent to
US$5.72 billion.
This resulted in an outflow of US$1.57 billion, compared with US$10.07 billion in
2010.
2

Central Bank of Nigeria Annual Report—2011
36
2.3.2 Developments in the Foreign Exchange Market
Ninety-five (95) trading sessions were held in the wDAS segment of the foreign
exchange market during the year, compared with ninety-six (96) in 2010. The
aggregate demand for foreign exchange grew by 37.3 per cent above the
level in the preceding year to US$48.2 billion. The surge in demand was
attributed largely to the increased importation of petroleum products,
settlements of matured letters of credit, and dividend payments. Further
analysis showed that in the wDAS segment, spot and forward market demands
amounted to US$42.3 billion (87.7 per cent of the total) and the BDC demand
accounted for the balance. Total supply of foreign exchange rose by 37.7 per
cent over the level in 2010 to US$41.6 billion. Of this, wDAS sales (wDAS and
wDAS-FWD) amounted to US$33.0 billion and BDCs US$5.9 billion, an increase of
32.9 and 10.8 per cent, respectively, over the levels in 2010. The balance was
accounted for by the intervention of the Bank in the interbank market through
the sale of US$2.0 billion and swap contracts worth US$0.7 billion in the last
quarter of 2011.
-20
-10
0
10
20
30
40
50
60
2010 2011
US
$ M
illio
n
Figure 2.8: Foreign Exchange Flows through the CBN
Inflow Outflow NetFlow
2

Central Bank of Nigeria Annual Report—2011
37
In the wDAS Forward contract segment, thirty-six (36) auctions for 1-, 2- and 3-
month tenors were conducted. The total demand of US$4.4 billion comprised of
1-, 2- and 3- month tenors of US$1.9 billion, US$1.4 billion and US$1.05 billion,
wDAS , 29.8 BDC , 5.9
wDAS Forward, 2.8
Interbank Sales, 2.0
Swaps, 0.7
Externa Debt Service, 0.4
Drawing on L/C, 1.5
Other Official Payments, 5.7
National Priority Project, 0.1
Figure 2.9: Foreign Exchange Disbursement, 2011 ($'Billion)
0
5
10
15
20
25
30
35
40
2010 2011
US
$ b
illio
n
Figure 2.10: Developments in the Foreign Exchange Market
WDAS Demand BDC Demand Forward Demand Sales to WDAS Sales to BDC Sales to Forward Swap
0
10
20
30
40
50
60
2010 2011
US
$ b
illio
n
Figure 2.11: Demand for, and Supply of, Foreign Exchange
Total Demand Total Supply
2

Central Bank of Nigeria Annual Report—2011
38
respectively. The Bank approved US$3.2 billion wDAS-Forward but redeemed a
total of US$2.8 billion at maturity in 2011.
2.3.3 Sectoral Utilization of Foreign Exchange
The utilization of foreign exchange for import through the DMBs in 2011 grew by
38.9 per cent above the level in 2010 to US$47.2 billion. Of the total, US$31.9
billion (67.6 per cent) was utilized on visible trade transactions, compared with
US$24.3 billion in 2010. Invisible trade transactions accounted for US$15.3 billion
(32.4 per cent), compared with US$9.7 billion in 2010.
Analysis of visible trade transactions showed that mineral and oil sector imports
rose by US$1.2 billion and US$4.8 billion to US$1.4 billion and US$10.9 billion,
respectively, in 2011. Similarly, imports under the industrial and food products
categories grew by 20.4 and 17.2 per cent to US$7.6 billion and US$5.3 billion,
respectively. Furthermore, imports of transport and agriculture related goods
increased by 17.6 and 9.8 per cent to US$1.8 billion and US$0.4 billion,
respectively, in 2011. However, the share of manufactured products fell by 14.4
per cent from the level in 2010 to US$4.6 billion.
A disaggregation of invisible trade showed that the financial services sector
constituted the bulk of invisible transactions, with a total foreign exchange
outflow of US$6.8 billion, an increase of 1.4 per cent over the level in 2010.
Environmental services grew substantially from US$0.1 million in 2010 to US$1.3
billion, reflecting the efforts by government to improve the environment.
Transport services and education grew by 4.8 and 1.5 per cent, respectively,
over the levels in 2010. The outflow by business, communication, construction,
distribution and health services fell by 11.1, 28.8, 32.0, 19.3 and 78.3 per cent,
respectively, below the levels in the corresponding period of 2010.
2

Central Bank of Nigeria Annual Report—2011
39
Figure 2.12: Sectoral Utilization of Foreign Exchange in 2011
2.3.4 External Reserves Management
Nigeria‘s gross external reserves at end-December 2011 stood at US$32.6 billion,
an increase of 0.9 per cent when compared with the level at end-December
2010. The external reserves could support 6.5 months of goods and services
import cover, compared with 7.9 months in 2010.
A breakdown of the external reserves by components showed that the
Federation Account, the Federal Government and CBN reserves stood at
US$3.2 billion, US$5.2 billion and US$24.3 billion, respectively, accounting for 9.8,
15.8 and 74.4 per cent, respectively.
Industrial 16%
Food Products 11%
Manufactured 10%
Transport 4%
Agriculture 1% Minerals
3%
Oil Sector 23%
Invisible 32%
0
5
10
15
20
0
10
20
30
40
50
60
2007 2008 2009 2010 2011
Mo
nth
s o
f Im
po
rts'
Co
ver
Bill
ion
s o
f U
S D
olla
rs
Figure 2.13: Nigeria's Gross External Reserves Position (US$billion) and Months of Import Cover
External Reserves Months of Imports' Cover
2

Central Bank of Nigeria Annual Report—2011
40
The total earnings from investment of the external reserves amounted to N36.3
billion, 47.4 per cent lower than the level in 2010. The development was due
largely to the weak economic performance and low interest rates in
developed economies in 2011. As part of efforts to diversify foreign reserves and
minimize risks in reserves management, the Bank‘s Investment Committee
approved the inclusion of the Chinese yuan as part of the foreign reserves
currency portfolio.
The Bank continued with the External Asset Manager Programme in 2011. The
market value of the assets under the programme stood at US$9.655 billion as at
December 31, 2011 and was managed by the World Bank, under the Reserve
Advisory Management Programme (RAMP) and eleven other asset managers.
Analysis of the performance of the programme, from its inception to December
31, 2011, showed that nine of the managers (including the World Bank)
outperformed the benchmark, while three managers underperformed, albeit
within the approved risk budget. The performance of the eleven asset
managers is measured against the Bank of America Merrill Lynch G7
Government Index 1-3 year 100 per cent hedged to the US Dollar, while that of
the World Bank is measured against the Bank of America Merrill Lynch 1-3 year
US Treasury Index.
Federation Account
9.8%
CBN 74.4%
FGN 15.8%
Figure 2.14: Holdings of External Reserves as at End-December 2011
2

Central Bank of Nigeria Annual Report—2011
41
Box 3: The Forwards Foreign Exchange Market
The foreign exchange forwards market provides the institutional arrangement through which
foreign currencies are purchased for delivery at a predetermined exchange rate (delivery
price) at a future date (settlement date). The forward rate is the future value of one currency
against another.
The value is determined for a period that exceeds the spot rate in advance of 2 days (two days
after the deal date). The forward rate is priced, based on the spot rate, interest differentials,
interest risk differentials and a flexible built-in commission for the contract provider. The two
reference currencies are referred to as currency pair. Where the forward rate is higher than the
spot rate, it is referred to as forward premium; if it is less, it is referred to as forward discount. The
fixed currency in the currency pair is referred to as the base currency and the variable currency
is called the terms currency.
For the contracting parties, forward rate contracts provide opportunities for hedging exchange
rate risk as the future exchange rate is locked in the contract and it is not affected by changes
in interest rate. Its limitations, however, include the risk of an uncompetitive exchange rate in
the future, absence of a secondary market, fixed contract inflexibility and the additional cost to
obtain a delivery before the settlement date.
A Forward exchange rate contract could be fixed, partially optional, or fully optional. In a fixed
contract, foreign currency can only be delivered at the agreed future date. Partially optional
contract has two periods, the first locks in the contract until the agreed beginning date of the
second period termed optional period, which stretches to settlement date during which
delivery of foreign currency can occur anytime. The third variant is the fully optional contract,
which gives the option of delivery of foreign currency at any time within the contract. The
delivery of exchange rate before the maturity date under the fixed contract period is referred
to as early delivery and attracts an additional administrative cost.
Trading under the foreign exchange forwards market in Nigeria is conducted in a multiple price
Dutch Auction System referred to as the Wholesale Dutch Auction System–Forward (wDAS-FWD)
in US Dollar/Nigerian Naira (currency pair) with a minimum allowable bid of US$500,000.00 by an
authorized dealer. Maturity dates are set at the spot date (T+2) plus 1-, 2- and 3- month tenors.
All foreign exchange bought through the forward market are not transferable in the interbank
market as authorized dealers are expected to bid on behalf of their customers.
2

Central Bank of Nigeria Annual Report—2011
42
2 .4 SURVEILLANCE REPORT ON THE ACTIVITIES OF FINANCIAL INSTITUTIONS
2.4.1 Banking Supervision
The Bank intensified its banking reform programme aimed at fostering the
stability of the financial system. In that regard, the Bank‘s surveillance activities
continued to focus on the implementation of the revised prudential guidelines,
the revised banking model and crisis mitigation measures through the AMCON.
Other complementary measures included regular appraisal and review of
banks‘ periodic returns, spot checks, monitoring, special investigations, risk-
based and consolidated supervision. To further improve the effectiveness of
supervision, the Bank issued three key supervisory guidelines, namely the
Supervisory Intervention Framework, the Framework for Cross-Border Supervision,
and the Risk-based Pricing Model for the industry.
The CBN Credit Risk Management System
(CRMS) infrastructure recorded significant
improvement in the management of basic
credit information on customers. The
database at end-December 2011 had
77,246 registered borrowers, indicating an
increase of 3.3 per cent. Of this, 25,828 borrowers had 32,614 facilities with a
total outstanding balance of N4.65 trillion. This represented a decline of N0.58
trillion or 11.1 per cent, compared with N5.23 trillion for 28,093 borrowers at end-
December 2010. The development was attributed, largely, to the increased
awareness among banks and customers of the critical role of the infrastructure,
reinforced by the co-operation among stakeholders in the industry.
Description 2010 2011Absolute
Change
%
Change
Total No. of Borrowers 74,786 77,246 2,460 3.3
No. of Borrowers with outstanding credits 28,093 25,828 -2,265 -8.1
No. of Credits/facilities 26,367 32,614 5,958 23.7
Total outstanding balance (N’000 bn) 5,227 4,649 -578 11.1
Table 2.5: Borrowers from the Banking Sector
Derived from the Bank’s CRMS
To further improve the effectiveness of supervision, the Bank issued three key supervisory guidelines, namely, the supervisory intervention framework; the framework for cross-border supervision; and the risk-based pricing model for the industry.
2

Central Bank of Nigeria Annual Report—2011
43
The Bank‘s CRMS was complemented by the activities of the three (3) licensed
private credit bureaux (PCBs) in the industry. The range of products and
services provided by the PCBs during the period under review were: customer
identity verification, credit reports, self-enquiry, bulk portfolio review, credit
rating and scoring, and referencing and credit risk assessment, among others.
The growing demand for borrower/customer credit information and status
enquiries by financial and non-financial entities buoyed the activities of these
institutions.
Following the adoption of the new banking model, six (6) of the twenty (20)
DMBs applied for commercial banking licence with international authorization,
five (5) for commercial licence with national authorization, one (1) for
commercial banking licence with
regional authorization, four (4) for mixed
holding company (HoldCo)comprised of
three (3) with international authorization
and one (1) with national authorization.
Of these, approvals-in-principle (AIPs) were granted to twelve (12) banks that
applied for monoline commercial banking licence, while final approval was
granted to four that applied for HoldCo in order to restructure their operations
in line with their approved compliance plans.
In order to promote financial inclusion, the CBN, on June 21, 2011, issued
guidelines on the Framework for the Regulation and Supervision of Institutions
offering non-interest financial services in Nigeria. The issuance of the guidelines
formally opened the window for the licensing and operation of non-interest
banking, based on the principles of Islamic commercial jurisprudence, among
others. At end-December 2011, Jaiz Bank Plc was licensed as a full-fledged
non-interest bank with regional authorisation, while Stanbic IBTC Bank Plc was
granted approval to offer non-interest (Islamic) banking products.
In order to promote financial inclusion, the CBN on June 21, 2011 issued guidelines on the Framework for the Regulation and Supervision of Institutions
offering non-interest financial services in Nigeria.
2

Central Bank of Nigeria Annual Report—2011
44
In addition, the CBN participated in all meetings organized by the Islamic
Financial Services Board (IFSB), including its Council Meetings and those of its
working groups on stress testing, liquidity risk management, capital adequacy
and Takaful undertakings. The Bank also participated in the Board‘s capacity
building initiatives, aimed at enhancing examiners‘ understanding of non-
interest banking.
The CBN sustained its support for the re-capitalization drive of the eight banks in
which it had intervened to contain systemic distress. In that regard, the Bank
adopted mergers and acquisitions or outright sale to new investors, as part of
the resolution options for the affected banks. The re-capitalization process was
initially slowed down by litigations instituted by shareholders of some of the
banks. Following the signing of Transaction Implementation Agreements (TIAs)
between five of the intervened banks and their preferred bidder, AMCON
injected funds into these banks that brought their shareholders‘ fund to a
positive position, preparatory to their acquisition/merger with other entities.
After reviewing the progress of the re-capitalization effort, three of the eight
banks (Spring Bank Plc, Bank PHB Plc and Afribank Nigeria Plc) were viewed as
lacking the capacity to recapitalize before the stipulated deadline of
September 2011. Consequently, the CBN revoked the licences of the three
banks, in accordance with the powers granted to it by the BOFI Act 1991 (as
amended), while the Nigeria Deposit Insurance Corporation (NDIC)
incorporated new banks (bridge banks as provided for in Section 29 of the
NDIC Act 2006), namely, Enterprise Bank Ltd, Keystone Bank Ltd and Mainstreet
Bank Ltd. The bridge banks assumed the deposit liabilities and certain other
liabilities and assets of Spring Bank Plc, Bank PHB Plc and Afribank Nigeria Plc,
respectively, effective August 5, 2011. Sequel to an arrangement with the NDIC,
the AMCON purchased the equity of the bridge banks on August 6, 2011. This
resulted in the termination of their status as bridge banks and were
subsequently re-capitalized by AMCON.
2

Central Bank of Nigeria Annual Report—2011
45
In December 2011, the shareholders of Access Bank, Ecobank, FCMB and
Sterling Bank held court-ordered meetings to approve the issuance and
allotment of their respective shares in consideration of the acquisition of the
assets, liabilities and undertakings of Intercontinental Bank, Oceanic Bank,
Finbank and Equitorial Trust Bank (ETB), respectively. By end-December 2011,
the CBN and SEC had granted the necessary approval, while the courts had
sanctioned the resolutions. A core investor, Union Global Partners Ltd injected
funds into Union Bank, and on December 14, 2011, the bank opened a Rights
Issue of 1.407 billion shares at N6.81035 per share (5 new shares for every 9
existing shares held), which was scheduled to close on February 10, 2012.
The Bank strengthened its collaborative effort with other stakeholders, under the
aegis of the Roadmap Committee of Stakeholders on the adoption of
International Financial Reporting Standards (IFRS) in Nigeria. The main objective
was to ensure a phased transition to IFRS over a three-year period, beginning
with the 2012 reporting date for all listed companies and major public entities.
In that regard, the following milestones were attained during the year:
engagement of consultants to guide the Bank on the implementation of both
the Basel II and IFRS projects in the Nigerian banking system; sensitization of the
industry on IFRS implementation; establishment of relevant committees and
workgroups; gap/impact analysis of IFRS conversion in the banking system; and
capacity building. The adoption of IFRS would facilitate the implementation of
Basel II requirements by banks in Nigeria.
Following the creation of a Cross-Border Supervision Unit in the Bank in 2010, a
framework for cross-border supervision was issued in 2011.The framework was
intended to provide guidance on the supervision of Nigerian banks with
offshore branches/subsidiaries and also on the level of cooperation expected
from host countries in the supervision of cross-border entities. In that regard, the
CBN, during the year under review, conducted the first joint examination with
host regulators of fourteen (14) banks in five (5) WAMZ member countries,
2
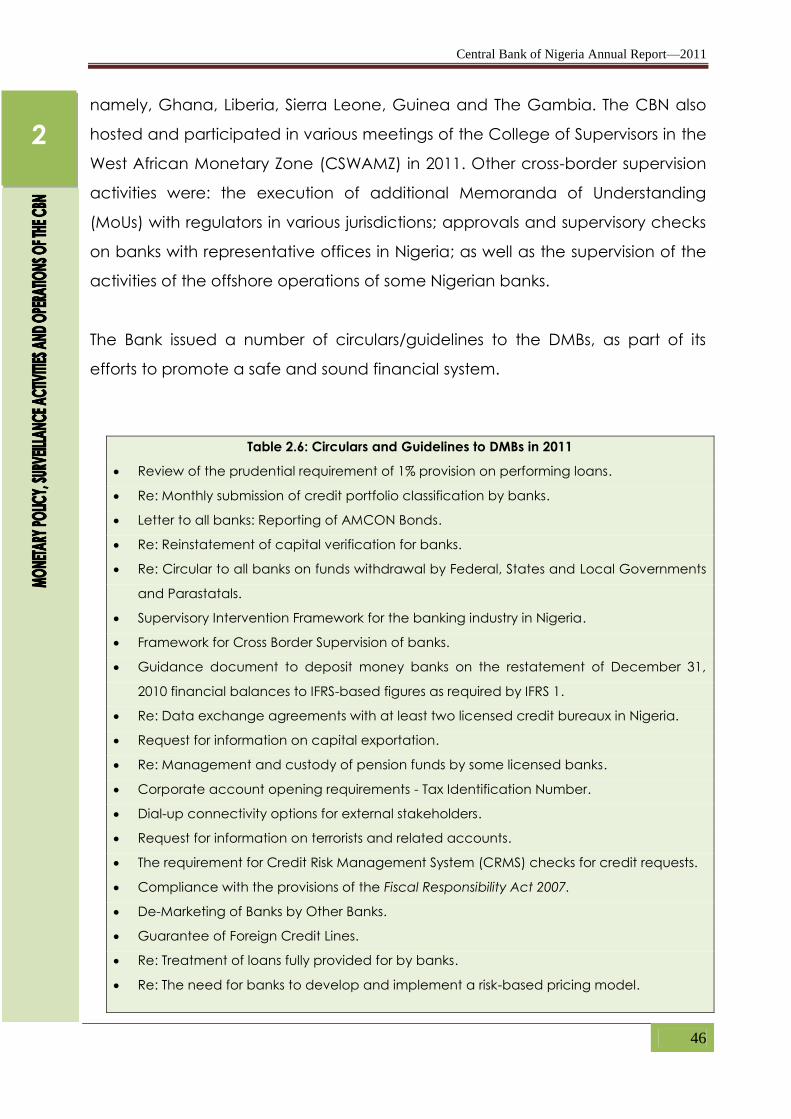
Central Bank of Nigeria Annual Report—2011
46
namely, Ghana, Liberia, Sierra Leone, Guinea and The Gambia. The CBN also
hosted and participated in various meetings of the College of Supervisors in the
West African Monetary Zone (CSWAMZ) in 2011. Other cross-border supervision
activities were: the execution of additional Memoranda of Understanding
(MoUs) with regulators in various jurisdictions; approvals and supervisory checks
on banks with representative offices in Nigeria; as well as the supervision of the
activities of the offshore operations of some Nigerian banks.
The Bank issued a number of circulars/guidelines to the DMBs, as part of its
efforts to promote a safe and sound financial system.
Table 2.6: Circulars and Guidelines to DMBs in 2011
Review of the prudential requirement of 1% provision on performing loans.
Re: Monthly submission of credit portfolio classification by banks.
Letter to all banks: Reporting of AMCON Bonds.
Re: Reinstatement of capital verification for banks.
Re: Circular to all banks on funds withdrawal by Federal, States and Local Governments
and Parastatals.
Supervisory Intervention Framework for the banking industry in Nigeria.
Framework for Cross Border Supervision of banks.
Guidance document to deposit money banks on the restatement of December 31,
2010 financial balances to IFRS-based figures as required by IFRS 1.
Re: Data exchange agreements with at least two licensed credit bureaux in Nigeria.
Request for information on capital exportation.
Re: Management and custody of pension funds by some licensed banks.
Corporate account opening requirements - Tax Identification Number.
Dial-up connectivity options for external stakeholders.
Request for information on terrorists and related accounts.
The requirement for Credit Risk Management System (CRMS) checks for credit requests.
Compliance with the provisions of the Fiscal Responsibility Act 2007.
De-Marketing of Banks by Other Banks.
Guarantee of Foreign Credit Lines.
Re: Treatment of loans fully provided for by banks.
Re: The need for banks to develop and implement a risk-based pricing model.
2

Central Bank of Nigeria Annual Report—2011
47
All DMBs to expand their existing ATM help desks and discount houses and other
financial institutions to establish help desks to handle all consumer complaints.
Re: IT requirements for NUBAN Account Numbering Scheme.
Time frame to access the CBN IT Application.
Re: Circular on the need to combat card fraud.
Inter-bank Funds Transfers and Settlement Arrangements on behalf of Payment Solution
Providers.
One year extension of transition period for NUBAN.
Circular to all Mobile Operators.
Box 4: THE INTERNATIONAL FINANCIAL REPORTING STANDARD
The International Financial Reporting Standards (IFRS) was issued by the International
Accounting Standard Board (IASB). It was issued to serve as the global accounting language
for the purpose of meeting the information needs of global business investors, shareholders and
financial services providers. Specifically, the IFRS is a globally-accepted set of accounting
standards, framework and interpretations, adopted by the IASB and its interpretative body (The
International Financial Reporting Interpretations Committee - IFRIC). For a truly global economy
(where companies and accounts issuers interrelate around the globe) to be efficient, it is
appropriate to have a common standard in business and financial reporting. IFRS thus, became
the set of high quality, transparent and globally renowned accounting standards and
framework that provide for international comparison. At the global level, such standards are
regarded as a major component of a good financial system that reduces cost of capital,
allowing for transparency and disclosure, as well as facilitating increase in capital formation. Its
basic components include:
International Accounting Standards – IASs;
International Financial Reporting Standards ( IFRSs);
IASB Framework for preparation and presentation of financial statements; and
Interpretations of International Financial Reporting.
The world-wide adoption of IFRS is expected to facilitate presentation of financial information in
a manner that:
Allows and helps evaluators and users to determine the financial status and liquidity
position of a company;
Breaks down the information about a company‘s activities and operations so as to show
clearly its future cash flow; and
Every organization‘s financial statement supports and backs one another, while giving a
cohesive picture of all its activities;
The number of countries that have either moved, or are in the process of moving, to IFRS
increased to 117 (involving more than 12,000 companies) at end-December 2011 from 100 at
end-December 2009. At end-December 2011, 15 African countries, including Nigeria, had
either adopted, converged to or made a commitment to implement IFRS.
In Nigeria, the bodies responsible for the regulation of accounting information are statutory
agencies such as the Nigerian Accounting Standards Board (NASB), the Securities and
Exchange Commission (SEC), Nigerian Stock Exchange (NSE) and the Central Bank of Nigeria
(CBN). The NASB, established in September 1982, under the sponsorship of the Institute of
Chartered Accountants of Nigeria (ICAN), is a government agency statutorily responsible for
issuing Statements of Accounting Standards (SAS) in Nigeria on various accounting matters,
after taking into account all peculiarities of the business environment, customs, laws and level
of development. The NASB had earlier announced its decision to converge to IFRS in the last
quarter of 2010, but the commencement date was later shifted to January 1, 2012 in order to
ensure legal and capacity building in the project. The road map requires that the entire
2

Central Bank of Nigeria Annual Report—2011
48
business community in the country would implement and converge in phases, while the phases
are submerged within a general implementation framework. The general plan would ensure
appropriate changes and restructuring are made to processes, systems and the people in
terms of training and capacity building.
Based on this Roadmap, companies listed on the Nigerian Stock Exchange and ―significant
public interest entities‖ (―PIEs‖) would be required to comply with IFRS for periods ending after
January1, 2012. Other PIEs would be required to comply for periods ending after January1, 2013
while small and medium sized entities would need to comply for periods ending after January1,
2014. Businesses would, therefore, be required to identify and understand the similarities and
differences between the Nigeria General Accepted Accounting Practice (Nigeria GAAP),
including changes that would occur within the transition period up to its full adoption and
implementation. In Nigeria, the migration process to IFRS has been mixed, especially among the
organizations in the first phase with commencement date of January 1, 2012. The banking and
discount houses sub-sectors had the greatest momentum, while most other corporations waited
on their external auditors to drive implementation and compliance. This requires that regulators
would do well to institutionalize close monitoring and compliance processes.
In general, convergence to IFRS would promote uniformity in operations and auditing of
companies. This is expected to have a significant impact on firms‘ financial performance and
ultimately on their financial position. It is expected that implementation of the IFRS (Uniform
Global Accounting Language) would, among other things, allow for easy access to efficient
global capital; increase demand for, and enhance practice of public accountability and
transparency; enhance understanding and ability to generate value from strategic activities
and synergies; facilitate comparison between entities as well as enhance attraction and
encouragement of foreign investors.
2.4.2 Prudential Examinations
Available data revealed that the banking industry‘s liquidity significantly
improved in 2011. The industry‘s average liquidity ratio, which stood at 47.5 per
cent at end-December 2010 rose by 21.6 percentage points to 69.1 per cent at
end-December 2011. All the banks in the industry met the prescribed minimum
liquidity ratio (LR) of 30.0 per cent at end-December 2011. The development
was attributed, largely, to AMCON‘s intervention in the banks. Similarly, the
banking industry‘s cash reserve ratio (CRR) was 8.0 per cent, compared with 1.0
per cent at end-December 2010. The average capital adequacy ratio (CAR) of
the industry stood at 17.9 per cent at end-December 2011, representing an
increase of 13.9 and 9.9 percentage points over its levels at end-December
2010 and the Basel II minimum requirement of 8.0 per cent, respectively. One
(1) of the banks, however, failed to meet the CBN statutory minimum CAR of
10.0 per cent at end-December 2011, compared with eight (8) at end-
December 2010.
Eight hundred microfinance banks (MFBs) were examined during the year. The
exercise included the licence validation/capital verification undertaken on the
2

Central Bank of Nigeria Annual Report—2011
49
119 MFBs that were granted provisional licences in 2010, post-examination
monitoring of the 50 MFBs adjudged sound in 2010, and routine examination of
631 other MFBs. The examinations revealed that 24 MFBs had either closed shop
or ceased to operate in their registered offices, while two (2) were undergoing
restructuring. Analysis of the examination reports of the remaining 774 MFBs
indicated that 70.4 per cent of the institutions met the prescribed capital
adequacy ratio of 10.0 per cent, with 52.0 per cent having capital funds in
excess of the minimum regulatory capital. Also, 84.0 per cent of the institutions
met the prescribed minimum liquidity ratio of 20.0 per cent, translating to an
average liquidity ratio of 88.0 per cent for the sub-sector. This reflected the
pervasive under-trading and placement of funds with DMBs. The average
portfolio-at-risk (PAR) or non-performing loan to total, on the other hand, was
46.0 per cent, reflecting a high level of non-performing loans. A total of twenty-
nine (29) MFBs, however, had PAR ratios below the prudential maximum of 2.5
per cent. Each MFB with a regulatory/ supervisory issue of concern was served
an appropriate supervisory letter with prescribed timelines for compliance.
Holding actions were imposed in 54 cases entailing the cessation of the grant of
fresh loans and further acquisition of fixed assets.
2.4.3 Compliance with the Provisions of the Code of Corporate Governance for
Banks in Nigeria
The CBN continued to monitor compliance with the Code of Corporate
Governance, as part of its routine review to ensure safety and soundness in the
governance structures of the DMBs in 2011. During the year, several banks
experienced changes in the composition of their boards and management,
and replacements were made in accordance with the requirements of extant
guidelines. Accordingly, five banks made changes to their board membership,
in compliance with the tenure limitation provisions of CBN‘s Code, and three
banks changed their external auditors following the expiration of their tenures.
To ensure continuity in operations, the Bank sustained its efforts to promote the
development of, and adherence to, clearly defined succession plans in the
2

Central Bank of Nigeria Annual Report—2011
50
DMBs. In addition, compliance with CBN guidelines on the appointment of
Chief Compliance Officers was closely monitored.
2.4.4 Financial Crime Surveillance/Money Laundering
The on-going efforts of the CBN to combat money laundering and financing of
terrorism received a boost with the enactment of the Money Laundering
Prohibition Act (MLPA), as amended during the review period. The Act
criminalises the financing of terrorism and addresses the issues of freezing,
seizure and confiscation of both laundered money and terrorist funds.
Furthermore, the Anti-Money Laundering/Combating the Financing of Terrorism
(AML/CFT) Office established in the CBN undertook some key activities. These
included: the preparation of a draft AML/CFT risk-based examination manual
and an AML/CFT risk–based regulation for financial institutions; review of the
Inter-governmental Action Group Against Money Laundering in West Africa
(GIABA) Country Report on Nigeria for 2010; and the establishment of an
enforcement unit for monitoring compliance.
The Bank also developed ‗Standard Account Opening Forms‘ for banks, in
conjunction with the Committee of Chief Compliance Officers of Banks in
Nigeria (CCCOBIN). Furthermore, the CBN, collaborated with the US
Department of State and the US Embassy in Nigeria in respect of individuals and
entities sanctioned by the United Nations (UN), in the areas of training and
provision of information on Al-Qaeda in the Arabian Peninsula (AQAP). The CBN
worked in the joint Inter-Departmental and Nigerian Financial Intelligence Unit
(NFIU) Committee to prepare an acceptable format to receive information on
politically- exposed persons (PEPs) from financial institutions and to prepare an
acceptable national data base for PEPs. It investigated and provided
information in respect of a request from the Nigeria Police on individuals/entities
being investigated for alleged laundering of US$2.5 million; and granted the
Bank of Ghana‘s request to undertake a working visit to the CBN in March 2012,
2

Central Bank of Nigeria Annual Report—2011
51
in line with the Financial Action Task Force (FATF) Recommendation 40 on
international cooperation.
2.4.5 The Special/Target Examination
A Joint CBN/NDIC risk-based examination was conducted on sixteen (16) DMBs,
excluding the bridge banks and some of the CBN-intervened banks. The
exercise involved assessment of risk assets to determine the extent of
compliance with the regulatory thresholds on non-performing loans and capital
adequacy ratio, among others. The adequacy of the risk management
processes of the banks was also appraised. The assessments were concluded
by allotment of ratings, based on the significance of the business activity
undertaken. The findings and the recommendations for improvement were
communicated to the Boards and Managements of the affected banks for
appropriate action.
In addition, the CBN undertook various spot checks and ad-hoc reviews on the
DMBs‘ operations. These included: the extraction of top users of banks‘ funds;
first quarter foreign exchange review; investigation of seven (7) major
petroleum products marketers‘ utilization of foreign exchange for importation of
refined products; extraction of total public sector deposits with the DMBs; and
investigation of selected banks‘ liquidity positions.
2.4.6 Foreign Exchange Monitoring/Examination
In order to enhance the supervision of the foreign exchange operations of the
DMBs, a Foreign Exchange Monitoring Unit, was created by the Bank. Prior to
the creation of the Unit, the review of the foreign exchange operations of
banks was integrated into the Bank‘s routine risk-based examination.
Consequently, the first quarter review of the foreign exchange operation
(sources and utilization) of all the DMBs was carried out in the first half of 2011.
The review focused on the various sources of foreign exchange, the quantum
of BDCs sales, the impact of domiciliary accounts on the volume of foreign
2

Central Bank of Nigeria Annual Report—2011
52
exchange available for the banks‘ use, and utilization of foreign exchange
acquired. A special foreign exchange examination was conducted in the
second half of 2011. The enhanced scrutiny of the foreign exchange market
operations in 2011 resulted in an improvement in the enforcement of extant
rules and regulations governing foreign exchange disbursement and
highlighted the need to review some of the existing foreign exchange
regulations.
2.4.7 Banking Sector Soundness
The health of banks significantly improved at end-December 2011 with the sale
of the non-performing loans of the intervened banks to AMCON. The industry‘s
average CAR was 17.9 per cent, compared with 4.0 per cent at end-
December 2010. Further analysis showed that with the exception of one bank,
other DMBs had a CAR above the 10.0 per cent minimum for the industry at
end- December 2011, with the lowest at 10.0 per cent and the highest at 41.0
per cent. This was an improvement over the preceding year‘s level when the
eight intervened banks had negative CAR. The industry‘s ratio of non-
performing loans to total loans significantly declined to 5.0 per cent, from 15.5
per cent at end-December 2010. This was below the maximum threshold of 12.5
per cent set by the supervisory intervention framework. The development was
attributed to the acquisition of non-performing loans in the industry by AMCON.
All the banks in the industry met the prescribed minimum liquidity ratio (LR) of
30.0 per cent at end-December 2011. The banking industry‘s cash reserve ratio
(CRR) was 8.0 per cent, compared with 1.0 per cent at end-December 2010.
The developments indicated that the overall health of the industry had further
improved.
2
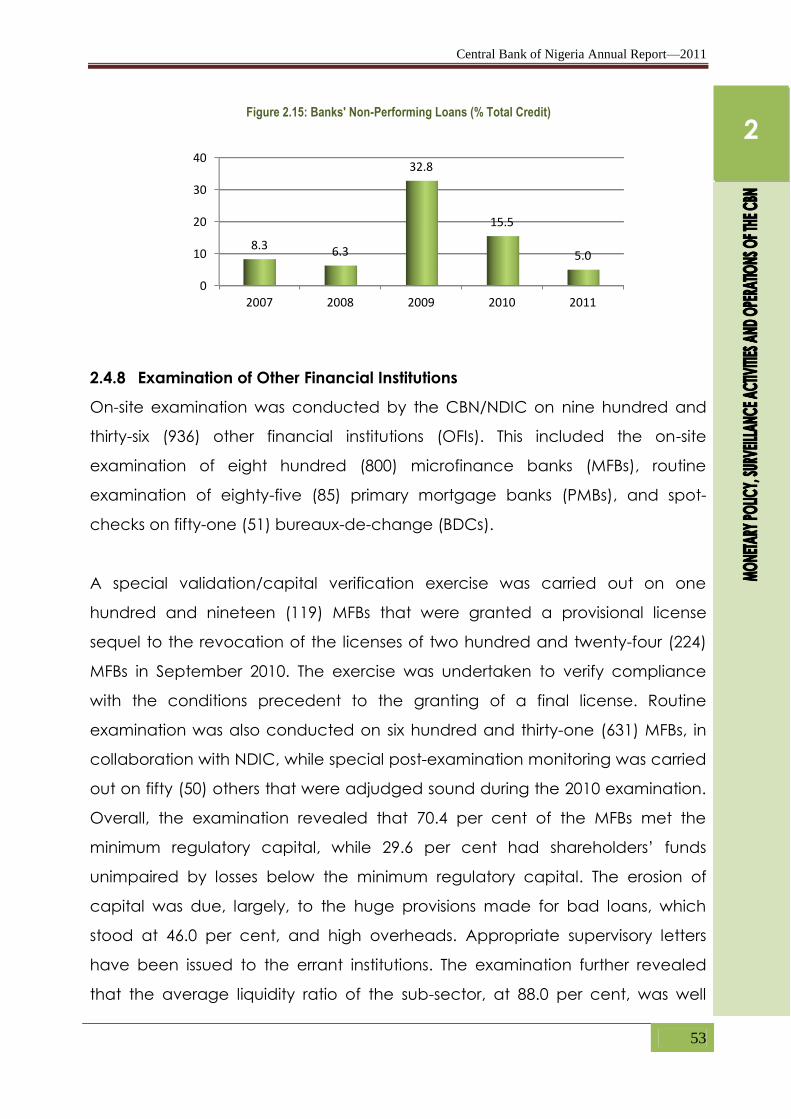
Central Bank of Nigeria Annual Report—2011
53
2.4.8 Examination of Other Financial Institutions
On-site examination was conducted by the CBN/NDIC on nine hundred and
thirty-six (936) other financial institutions (OFIs). This included the on-site
examination of eight hundred (800) microfinance banks (MFBs), routine
examination of eighty-five (85) primary mortgage banks (PMBs), and spot-
checks on fifty-one (51) bureaux-de-change (BDCs).
A special validation/capital verification exercise was carried out on one
hundred and nineteen (119) MFBs that were granted a provisional license
sequel to the revocation of the licenses of two hundred and twenty-four (224)
MFBs in September 2010. The exercise was undertaken to verify compliance
with the conditions precedent to the granting of a final license. Routine
examination was also conducted on six hundred and thirty-one (631) MFBs, in
collaboration with NDIC, while special post-examination monitoring was carried
out on fifty (50) others that were adjudged sound during the 2010 examination.
Overall, the examination revealed that 70.4 per cent of the MFBs met the
minimum regulatory capital, while 29.6 per cent had shareholders‘ funds
unimpaired by losses below the minimum regulatory capital. The erosion of
capital was due, largely, to the huge provisions made for bad loans, which
stood at 46.0 per cent, and high overheads. Appropriate supervisory letters
have been issued to the errant institutions. The examination further revealed
that the average liquidity ratio of the sub-sector, at 88.0 per cent, was well
0
10
20
30
40
2007 2008 2009 2010 2011
8.3 6.3
32.8
15.5
5.0
Figure 2.15: Banks' Non-Performing Loans (% Total Credit)
2

Central Bank of Nigeria Annual Report—2011
54
above the prescribed minimum level of 20.0 per cent, due to under-trading
and placement of available funds with DMBs. Furthermore, twenty-four (24)
MFBs had either closed shop or ceased to operate in their registered offices,
while two (2) were undergoing restructuring.
Similarly, a special/routine examination was conducted on eighty-five (85)
PMBs, in collaboration with the NDIC. Nine (9) of them were found to be at
various stages of restructuring and re-capitalization and were given three (3)
months to conclude the process. The examination of the seventy-six (76) other
PMBs was conducted principally to verify the claims made by the PMBs in
response to the supervisory letters issued to them on the findings of the 2010
examination. It also aimed at establishing the status of the institutions with
regard to the critical parameters on which their compliance with the recently
issued guidelines for the sub-sector would be based. Also, on-site verification
was conducted on the existence claims filed by twelve (12) PMBs, in response
to the published notice on the planned revocation of the licences of sixteen
(16) PMBs that were found to have ceased operations during the 2010
examination.
Post-examination monitoring was conducted on FCs during the review period
as a critical follow-up action to the examination conducted in the last quarter
of 2010. The issues of supervisory concern included pervasive low capital base,
weak corporate governance, large volumes of delinquent facilities, and
excessive exposure to capital market activities. The exercise led to an increase
in the number of FCs classified as inactive, from 33 to 47, and the procurement
of necessary approval to proceed with the revocation of their licences. In
addition, the thirty-three (33) FCs that were either rated marginal, unsound or
technically insolvent were issued supervisory letters, imposing various holding
and corrective actions to be complied with within a 3-month timeframe,
ending March 31, 2012. Similarly, three (3) others undergoing restructuring were
2

Central Bank of Nigeria Annual Report—2011
55
given up to March 31, 2012 to conclude the restructuring exercise, failing which
their licenses would be revoked.
A pilot target examination was carried out on fifty-four (54) out of the two
thousand and fifty-one (2,051) BDCs with the aim of ascertaining their level of
compliance with the operating guidelines, particularly in the area of utilization
of foreign exchange purchased from the CBN window and autonomous
sources. The exercise revealed that over 50.0 per cent of the foreign exchange
purchased were from autonomous sources and were sold mainly to end-users
for personal travel allowance; most BDCs did not have anti-money laundering
policies and procedures in place and did not keep proper accounting records
that could serve as the basis for rendering returns on their assets, liabilities,
income and expenditure. Appropriate sanctions were handed down to thirty-
seven (37) of the BDCs for infractions. In addition, the exercise set the stage for
the commencement of regular comprehensive assessments of the operational
status of BDCs with respect to their assets and liabilities, corporate governance
and risk management structures.
2.5 DEVELOPMENTAL FUNCTIONS OF THE CBN
2.5.1 The Agricultural Credit Guarantee Scheme Fund (ACGSF)
The CBN guaranteed 56,232 loans valued at N10.19 billion in 2011, which were,
respectively 10.8 and 31.6 per cent higher than the number and value
guaranteed in 2010.
A breakdown of the loans guaranteed by states showed that Katsina State
had the highest volume with 8,420 loans (15.0 per cent), valued at N1.09 billion
(10.7 per cent), followed by Kebbi State with 5,346 loans (9.5 per cent), valued
at N0.43 billion (4.2 per cent). Jigawa State came third with 5,346 loans (9.5 per
cent) valued at N0.29 billion (2.8 per cent). A sub-sectoral analysis of number of
loans guaranteed indicated that food crops were dominant with 46,037 or 82.0
per cent, followed by livestock with 4,349 or 8.0 per cent. Mixed farming,
fisheries, ‗others‘, and cash crops accounted for 2,083 or 4.0 per cent, 1,842 or
2

Central Bank of Nigeria Annual Report—2011
56
3.0 per cent, 1,396 or 2.0 per cent and 621 or 1.0 per cent, respectively. Analysis
of loans guaranteed by size in 2011 showed that beneficiaries with loan that
amounted to N100, 000 or below were 32,857 or 58.3 per cent, while those
above were 23,471 or 41.70 per cent. This indicated a preponderance of small
holder farmers in the scheme.
Since the scheme‘s inception in 1978 to 2011, a cumulative of 754,528 loans
valued at N52.34 billion had been guaranteed.
Figure 2.16: Distribution of Number of Loans Guaranteed
by Purpose under ACGS in 2011
The volume of recovered loans in 2011 was 50,366, valued at N7.2 billion, thus
bringing the cumulative volume and value of fully repaid loans since the
inception of the Scheme to 543,211 and N31.2 billion, respectively. Analysis of
repaid loans by state showed that Katsina State had the highest volume with
7,933 valuedat N855.0 million, followed by Kebbi and Jigawa States in second
and third places, respectively. A total of 2,162 claims, valued at N123.7million
were settled in 2011, bringing the cumulative number and value settled since
the scheme‘s inception to 11,354 and N354.2 million, respectively.
Cash crops 1%
Food Crops 82%
Livestock 8%
Fisheries 3%
Mixed Farming 4%
Others 2%
2

Central Bank of Nigeria Annual Report—2011
57
Category Volume Value in N’ billion
N100,001 and above 23,471 8.19
N100,000 and below 32,857 2
Total 56,328 10.19
Table 2.7: Distribution of Loans under the ACGSF by
Volume and Value in 2011
Source: CBN
2.5.2 The Trust Fund Model (TFM)
There was no new placement of fund under the TFM in 2011. The total number
of MoUs signed and the sum pledged under the model remained at fifty-six (56)
and N5.52 billion, respectively, as in 2010.
Type of Stakeholder Amount (N'Billion)
Multinationals/Oil
Companies 0,444
SGs/LGAs 2.438
Federal Govt. Agencies 2.000
Individuals/Organizations 0.634
TOTAL 5.516
Number Remarks
4
N5 million less due to
suspension of MISCAD
Table 2.8: Funds Placement under the Trust Fund Model (TFM) at end–December, 2011
13
56N5 million less due to
suspension of MISCAD
35
4
Source: CBN
2.5.3 Operations of the Agricultural Credit Support Scheme (ACSS)
No claim was settled by the Bank under the ACSS in 2011. The cumulative
claims settled since the inception of the scheme in 2006 amounted to N844.3
million for 42 projects.
2

Central Bank of Nigeria Annual Report—2011
58
Performance Parameter
Application Received from banks 5 167.0 2 1,100.0 3 1.114 199 38,992.8
Approval by banks 5 147.5 2 1,100.0 3 1.114 199 29,772.3
Project submitted to CBN for
verification5 147.5 2 1,100.0 3 1.114 108 22,467.3
Project verified 5 147.5 - - 2 1.014 103 19,907.3
Disbursement by banks 5 147.5 2 1,100.0 3 1.114 104 20,541.3
Approval for 6% interest rebate 20 356.9 7 119.1 - - 42 0.844,281
No. Value (N) million
Table 2.9: Performance of the Agricultural Credit Support Scheme (ACSS)
Value (N) million
Jan - December 2009 Jan - December 2010 Jan - December 2011 2006 - December 2011
No. Value (N) million No. Value (N) million No.
Source: CBN
2.5.4 The Commercial Agriculture Credit Scheme (CACS)
The sum of N56.75 billion was disbursed to 102 private projects in 2011.
Additional five (5) DMBs joined the Scheme in 2011, bringing the number of
participating banks to sixteen (16). Cumulatively, N151.02 billion had been
disbursed to 190 projects (163 private projects and 27 state governments,
including the FCT), leaving an undisbursed balance of N48.98 billion. A
breakdown of disbursement by value-chain showed that production
accounted for 44.2 per cent, followed by processing at 41.1 per cent.
Marketing received 8.0 per cent, while storage accounted for the balance of
6.8 per cent.
A total of 32,801 jobs were created under CACS in 2011. Disbursements in
respect of private projects accounted for 61.6 per cent of the total jobs
created, while disbursements backed by state governments, including the FCT,
accounted for the balance of 38.4 per cent.
2

Central Bank of Nigeria Annual Report—2011
59
2.5.5 The SME/Manufacturing Refinancing and Restructuring Fund
The Fund, established in 2010, with an initial sum of N200.00 billion had
additional approval for N35.0 billion in 2011, bringing the resources under the
scheme to N235.0 billion. The sum of N30.0 billion was disbursed in the same
period, bringing the cumulative to N220.64 billion for 486 projects. The sum of
N11.24 billion was repaid during the review period. The sectoral distribution of
disbursements showed that food and beverages had the highest share with
21.0 per cent, followed by engineering and construction and
chemicals/plastics, which recorded 19.0 and 18.0 per cent, respectively. Agro-
allied and paper/allied had 10.0 per cent each, oil and gas 5.0 per cent, while
pharmaceuticals, ICT and solid minerals recorded 4.0 per cent each.
Textile/leather, and hotel and tourism got 2.0 per cent each, while
transportation got 1.0 per cent.
The Scheme had since its inception generated 16,422 new jobs, sustained
the operations of 347 projects and resuscitated 9 moribund companies.
In addition, capacity utilization and turnover of the beneficiaries
increased from a pre-intervention level of 25.0 to 36.0 per cent and N2.97
billion to N5.34 billion, respectively. Under the Scheme, beneficiary
companies accessed long-tenored funds, culminating in an annual
Marketing 8%
Storage 7%
Production 44%
Processing 41%
Figure 2.17: Analysis of Private Projects under the Commercial Agriculture Credit Scheme (CACS) as at December 2011
2

Central Bank of Nigeria Annual Report—2011
60
interest cost-saving of N35.30 billion, while boosting the liquidity of the
participating banks.
Figure 2.18: Sectoral Distribution of Loans under RRF
2.5.6 The Small and Medium Enterprises Credit Guarantee Scheme
A total of eighteen (18) applications, valued at N0.89 billion, were guaranteed
under the Scheme in 2011, as against the position in 2010 when none was
guaranteed.
2.5.7 The Power and Airline Intervention Fund
At end-December 2011, the sum of N158.87 billion had been released to the
Bank of Industry (BOI). Of this, N144.61 billion was disbursed to 21 projects
comprised of N58.99 billion and N85.62 billion for power and airline projects,
respectively. The intervention in the power and aviation sub-sectors had begun
to impact on the economy. Beneficiaries made an average cost-savings on
interest expense of N19.0 billion. Furthermore, the 10 power projects financed
under the initiative have a generating capacity of 679 MW. About 568.4 MW of
capacity was already being generated in 2011, of which 349.2 MW was fed to
the national grid.
Solid Minerals 4%
Eng./Construction 19%
Chem./Plastics 18%
Food/Beverages 21%
Pharmaceuticals 4%
Hotel/Tourism 2%
Transportation 1%
Textile/Leather 2%
Oil/Gas 5%
Paper/Allied Products
10%
ICT 4%
Agro Allied 10%
2

Central Bank of Nigeria Annual Report—2011
61
2.5.8 Entrepreneurship Development Centres (EDCs)
The three EDCs trained 29,323 participants involving 4,113 degree holders and
25,210 non-graduates in 2011. In the process, 631 jobs were created. Since its
inception, the scheme had trained 101, 847 entrepreneurs out of which 802 or
2.3 per cent were able to access N185.40 million from DMBs and MFBs for
business start-ups, and another 4,373 secured jobs. Approval was secured for
the establishment of three (3) more EDCs in the North-East, North-Central and
South- South geo-political zones of the country.
2.5.9 Nigeria Incentive – based Risk Sharing System for Agricultural Lending
(NIRSAL)
The CBN established NIRSAL in 2010, following an agreement with the Alliance
for a Green Revolution in Africa (AGRA), to address the weaknesses of existing
agricultural financing schemes. It was an innovative mechanism for unlocking
finance to serve the needs of all farmers, particularly smallholder farmers, agro-
processors, agribusinesses as input suppliers in the agricultural value-chain. The
aim was to provide farmers with affordable financial products while reducing
the risk of loans to farmers offered by the financial institutions. The scheme
would build the capacity of banks to lend to agriculture, deploy risk sharing
instruments to lower risks of lending, and develop a rating scheme for banks
based on their commitment to lending to the agricultural sector. Since its
establishment in 2010, several activities have been recorded, including
engagements with both local and international stakeholders to secure their
buy-in, charting the implementation road-map, and organization of a national
conference. On the completion of the framework in 2011, the scheme was
formally launched.
2

Central Bank of Nigeria Annual Report—2011
62
Enerally, the global economy experienced a slowdown in growth in 2011. Global output
growth rate slowed to 3.8 per cent, compared with 5.2 per cent in 2010, due to the
persistence of the Euro area debt crisis, the weak recovery of the US economy, and
political crisis in the Middle East and North Africa (MENA). Global inflation remained elevated in
2011, due largely to the resurgence of commodity prices in the first half of the year, and in
some economies, demand pressures fuelled by accommodative policies, strong credit growth,
and capital inflows. Commodity prices initially peaked in early 2011 before declining, due to
weak output and sluggish demand, resulting in a decline in global trade. The international
financial market remained weak and fragile, due to the escalating Euro area crisis.
.
3.1 OUTPUT GROWTH
Global output growth rate slowed to 3.8 per cent, compared with 5.2 per cent
recorded in 2010, due to the persistence of the Euro area debt crisis, the weak
recovery of the US economy, and political
crisis in the Middle East and North Africa
(MENA). Weaker global growth was fuelled
by indications that the euro area economy
would lapse into a mild recession, following
additional fiscal consolidation, as well as the
effects of tighter credit conditions on the real economy.
Growth in the advanced economies recorded 1.6 per cent, compared with 3.2
per cent in 2010, as US consumers reduced their savings in reaction to the
gloomy economic prospects. However, there were strong recoveries of business
investments, as well as the supply-chain disruptions, after the earthquake in
Japan. These developments helped in stabilising oil prices.
G
Global output growth rate slowed to 3.8 per cent, compared with 5.2 per cent recorded in 2010, due to the persistence of the Euro area debt crisis, the weak recovery of the US economy, and political crisis in the Middle East
and North Africa (MENA).
CHAPTER THREE
THE GLOBAL ECONOMY

Central Bank of Nigeria Annual Report—2011
63
The U.S. economy showed a lower GDP growth rate of 1.8 per cent relative to
the 2.8 per cent in 2010. This was attributed to the initial problems in getting a
deal for the debt ceiling that resulted in the downgrade` of the US credit rating
by Standard and Poor‘s (S&P). Output in the Euro area recorded a slight
decline as GDP grew at 1.6 per cent, compared with 1.8 per cent in 2010, due
to marked budget cuts by governments in order to curtail the region‘s debt
crisis.
In China, the growth rate slowed down to 9.2 per cent from 10.4 per cent in
2010. China‘s manufacturing contracted as the European debt crisis led to a
reduction in export demand in addition to sluggish domestic demand.
Developing and emerging economies also experienced a slowdown in growth,
as output moved from 7.3 per cent in 2010 to 6.2 per cent. The situation was
the same for the Commonwealth of Independent States (CIS) as GDP growth
declined to 4.5 per cent from 4.6 per cent in 2010. Also, in Developing Asia, the
Middle East and North Africa, and Latin America and Caribbean, growth
decelerated to 7.9, 3.1, and 4.6 per cent, compared with their respective rates
of 9.5, 4.3 and 6.1 per cent in 2010. Russia grew by 4.1 per cent compared with
4.0 per cent in 2010; and Central and Eastern Europe grew by 5.1 per cent
compared with 4.5 per cent in 2010. Growth in Sub-Saharan Africa (SSA)
moderated at 4.9 per cent compared with 5.3 per cent in 2010. The slight
moderation in SSA growth was due, largely, to the limited spillover effects of
global growth slowdown on the region, owing to its weak trade and finance
linkages with the rest of the world.
3

Central Bank of Nigeria Annual Report—2011
64
Table 3.1: Changes in World Output and Prices (per cent), 2007-2011
Region/Country 2007 2008 2009 2010 2011 2007 2008 2009 2010 2011
World Output N/A 3.9 3.0 5.2 3.8 3.6 2.0 N/A N/A
Advanced Economies 2.7 0.2 -3.4 3.2 1.6 2.3 2.0 0.7 1.1 2.3
United states 1.9 N/A -2.6 3.0 1.8 2.9 2.2 0.9 0.9 2.5
Japan 2.4 -1.2 -6.3 4.4 -0.9 -0.7 -0.8 -0.9 -2.1 -0.3
European Union 3.2 0.8 -4.1 2.0 1.6 2.4 3.7 0.9 1.9 3.0
Germany 2.7 1.0 -4.7 3.6 3.0 2.3 2.8 0.2 1.3 2.2
France 2.3 0.1 -2.5 1.4 1.6 1.6 3.2 0.1 1.6 2.1
Italy 1.5 -1.3 -5.0 1.5 0.4 2.0 3.5 0.8 1.6 2.6
United Kingdom 2.7 -0.1 -4.9 2.1 0.9 2.3 3.6 2.1 3.1 4.5
Euro Area 2.9 0.5 -4.1 1.9 1.6 2.1 3.3 0.3 1.6 1.4
Other Advanced Economies4
1 -1.2 5.8 3.3 2.7 3.1 0.82.7 3.5
Newly Industrialized Asian
Economies5.8 1.8 -0.9 8.4 4.2 2.2 4.5 1.3 2.6 3.3
Other Emerging Markets and
Deeloping Countries8.7 6.0 -2.6 7.3 6.2 6.5 9.2 5.2 6.2 6.2
Commonwealth of Independent
States5.5 -6.6 4.6 4.5 15.6 11.2 7.2 6.1
Regional Groups
Central and Eastern Europe 5.5 3.0 -3.6 4.5 5.1 6.0 8.1 4.7 5.2 5.2
Russia 8.5 5.2 -7.9 4.0 4.1 9.0 14.1 11.7 6.6 8.9
Latin America and the Caribbean2.9 0.4 6.1 4.6 12.0 3.6
6.4 4.8
Africa 7 5.5 2.8 5.3 4.9 6.9 11.7 10.4 7.5 8.4
Asia 11.4 7.7 7.0 9.5 7.9 5.4 7.5 3.1 6.1 7.0
Middle East 6 5.0 1.8 4.3 3.1 10.0 13.5 6.7 6.8 9.9
Western Hemisphere 5.6 4.6 -1.7 5.7 4.0 5.4 7.9 5.0 6.8 4.0
China 14.2 9.6 9.2 10.4 9.2 4.8 5.9 -0.7 3.5 5.5
Output Consumer Prices
Source: World Economic Outlook, January 2012
3.2 GLOBAL INFLATION
Inflation in many regions of the world remained elevated in 2011 due, largely, to
the resurgence of commodity prices in the
first half of the year, and, in some economies,
demand pressures fuelled by
accommodative policies, strong credit growth, and capital inflows. In the
advanced economies, inflation rose to 2.3 per cent from 1.1 per cent in 2010.
US inflation, which averaged 2.5 per cent from 0.9 per cent in 2010, was
restrained from further increase by the retreat in commodity prices, weak job
growth and a persistent economic slack that held back wages. In the Euro
area, inflation declined at a slower pace to 1.4 per cent, from 1.6 per cent, as
inflationary pressures remained well contained following receding commodity
prices.
Inflation in many regions of the world remained
elevated in 2011.
3

Central Bank of Nigeria Annual Report—2011
65
In Asia, inflation rose marginally to 7.0 from 6.1 per cent in 2010. Inflation in
advanced Asia, including Australia, New Zealand and the newly industrialized
economies, rose to 3.3 per cent from 2.6 per cent in 2010; the Japanese
inflation became less negative from -2.1 to -0.3 per cent. In developing Asia
(comprised of China, India, and the ASEAN-5), inflation rose to 7.0 per cent from
5.7 per cent a year ago. However, Indian inflation which remained in double
digits due to strong credit growth, a positive output gap, and accommodative
policies, decelerated to 10.6 per cent from 12.0 per cent in 2010.
In Latin America and the Caribbean, inflation rose marginally to 4.8 from 6.4 per
cent in 2010 and it broadly remained within target in most of the region‘s
inflation targeters. Consumer prices in Brazil and Argentina rose to 6.6 and 11.5
per cent from their respective levels of 5.0 and 10.5 per cent in 2010.
In the Commonwealth of Independent States (CIS), headline inflation picked
up and reached double digits in several of the region‘s economies, reflecting
the sharp rise in commodity prices in the first half of the year and the high share
of food in the consumption basket. During the year, inflation in CIS declined to
6.1 from 7.2 per cent in 2010.
Consumer prices in the MENA region remained elevated in 2011, driven by
commodity price developments and social unrest. Inflation among the oil
exporters surged to 10.8 from 6.6 per cent in 2010, but decelerated to 7.5 from
7.6 per cent among the oil importers.
In Sub-Saharan Africa (SSA), the rise in inflation was driven by an earlier surge in
commodity prices, accommodative monetary conditions in some economies
(including Ethiopia, Kenya, and Uganda), and the severe drought in the horn of
Africa which precipitated a major humanitarian crisis in the region. As a result,
SSA inflation rate rose to 8.4 from 7.5 per cent in 2010. Among oil exporters,
3

Central Bank of Nigeria Annual Report—2011
66
inflation remained high, as pre-crisis rapid monetary expansion (Nigeria) and a
sharp increase in domestic fuel prices (Angola) fed into domestic price
increases. In Nigeria, however, inflation rate continued its deceleration to 10.3
per cent from 11.8 and 13.9 per cent in the preceding two years, owing to a
series of monetary policy tightening and complementary measures undertaken
during the year.
3.3 GLOBAL COMMODITY DEMAND AND PRICES
Global commodity prices peaked in early 2011 after more than two years of
strong growth, before declining due to weak
output in advanced countries and sluggish
demand in emerging markets. The
commodity price index computed by the IMF
declined by 10.0 per cent between April and
August, 2011. Prices of metals decreased the
most, and agricultural raw materials recorded the largest individual decline,
especially cotton and rubber, edible oils such as coconut and palm kernel oil,
and cocoa. Overall, in 2011, agriculture, energy and metal prices declined by
19.0, 10.0 and 25.0 per cent, respectively. The rising risk aversion in global
financial markets owing to lingering concerns about sovereign debt risks in the
Euro area coupled with appreciation of the U.S. dollar, also contributed to the
decline in commodity prices.
Despite the fall in energy prices in 2011, the average basket price of crude oil
increased to US $ 107.46 per barrel from US $ 77.45 in 2010. The rise in prices was
attributable to reduced supply owing to the crises in Libya and other parts of
the Middle-East and North-Africa as well as the March 2011 earthquake in
Japan that led to the shutdown of its major nuclear plants and increased
Japanese demand for energy imports. Oil prices stabilized towards the end of
2011, mainly due to supply developments. However, increasing geopolitical risks
The rising risk aversion in global financial markets, owing to lingering concerns about sovereign debt risks in the Euro area coupled with appreciation of the U.S. dollar, also
contributed to the decline in commodity prices.
3

Central Bank of Nigeria Annual Report—2011
67
to oil prices emerged over Iran‘s nuclear programme and the international
embargo on its oil exports.
The global commodity demand slowed on account of sluggish global growth,
weak financial markets and an uncertain global economic outlook. Crude oil
demand in the advanced economies declined to 45. 4 from 45.7 million barrels
per day (mbd) in 2010, but increased in the emerging and developing
economies to 44.1 mbd from 42.6 mbd, largely due to the robust economic
activity in China. However, policy tightening in response to rising inflation and
surging housing prices in China, which accounts for 40 per cent of global metal
consumption and 18 per cent of energy consumption, dampened the demand
for major commodities, especially base metals.
3.4 WORLD TRADE
Growth in world trade declined to 6.9 per cent from 12.7 per cent in 2010. The
decline was attributed to the post-August turmoil in financial markets and weak
demand in Europe which impacted directly on trade. Global merchandise
imports fell by 8.0 per cent between August and October, 2011.
In the advanced economies, both imports and exports decreased substantially
from 12.2 and 11.5 per cent in 2010 to 5.5 and 4.8 per cent, respectively. Much
of the decline in the import volumes of high income countries came from a
decline in European Union imports.The terms of trade, however, improved from
a deficit of 1.2 per cent in 2010 to a lower deficit of 0.1 per cent. These
developments affected average annual changes in trade volumes in emerging
and developing economies, where exports and imports also declined but at a
slower pace to 9.0 and 11.3 per cent, from 13.8 and 15.0 per cent in 2010,
respectively. Developing countries‘ exports declined at an annualized rate of
1.2 per cent in the third quarter of 2011 and remained in decline, with the
sharpest drop in South Asia where it fell at double digits because of supply
disruptions caused by the flooding in Thailand. In the review period, the exports
of developing Europe and Central Asia expanded slowly, while Latin American
3

Central Bank of Nigeria Annual Report—2011
68
exports‘ growth strengthened. Consequently, the terms of trade in the
emerging and developing economies improved marginally to 3.6 from 3.3 per
cent in 2010.
Volume of Trade 2007 2008 2009 2010 2011 2007 2008 2009 2010 2011
Exports 6.4 1.9 -14 11.5 4.8 9.4 4.7 -8 13.8 9
Imports 5.3 0.4 -13.6 12.2 5.5 13.5 8.4 -9.5 15 11.3
Terms of Trade 0.5 -2.4 3.8 -1.2 -0.1 0.3 2.9 -5.7 3.3 3.6
Table 3.2: World Trade Volumes (Average Annual Percentage Change in Trade in Goods and Services), 2007 - 2011
Advanced Emerging and Developing
Source: World Economic Outlook, September, 2011 and January, 2012 updates
3.5 INTERNATIONAL FINANCIAL MARKETS
3.5.1 Money Markets
The global money market remained weak
due to the escalating Euro area crisis and
financial fragilities across the globe. In
particular, concerns about banking sector
losses and fiscal sustainability widened
sovereign risk spreads for many Euro area countries. The phenomenon was
unprecedented since the commencement of the Economic and Monetary
Union. Bank funding dried up in the Euro area, prompting the European Central
Bank (ECB) to offer a three-year Long-Term Refinancing Operation (LTRO). Bank
lending conditions fluctuated or deteriorated across a number of advanced
economies. Capital flows to emerging economies fell sharply.
3.5.2 Capital Markets
For a greater part of the year under review, the capital market was constrained
by the Euro area debt crisis that elevated financial stability risks. Markets
became more skeptical about the precarious public debt situation in many
countries, especially the fringe European countries. As the year rolled on and
with growth prospects lowered, concerns extended to more European
The global financial market, which had appreciably recovered by end of 2009, suffered a major setback during the second
quarter of 2010.
3

Central Bank of Nigeria Annual Report—2011
69
countries and beyond—from Japan to the US. Worries about sovereign risk
extended to concerns about the banks holding sovereign bonds, mainly in
Europe. The worries resulted in a partial freeze of financial flows with banks
keeping high levels of liquidity and tightening lending. Consequently, stock
prices fell. The crisis in the euro area deepened and escalated as spreads on
the sovereign bonds of the periphery economies reached new high levels.
Concurrently, spreads of several other economies also widened to varying
degrees. In the process, stock prices experienced sharp corrections, due to
concerns about weak activity and financial sectors in advanced economies.
Strains resurfaced in interbank markets, while credit default swap spreads on US
government rose.
Following these developments, the performance of international stock markets
was bearish, with global indices recording declines. In North America, the S&P
500, the S&P/TSX Composite and the Mexico Bolsa (IPC) indices decreased by
1.1, 11.1 and 4.0 per cent, respectively. In South America, the Brazilian Bovespa,
the Argentine Merval and the Colombian IGBC General indices decreased by
18.9, 32.1 and 17.6 per cent, respectively. Europe‘s FTSE 100, CAC 40, DAX and
MICEX indices decreased by 5.6, 19.0, 15.6 and 16.9 per cent, respectively. In
Asia, Japan‘s Nikkei 225, China‘s Shanghai Stock Exchange-A and India‘s BSE
Sensex indices decreased by 18.7, 22.9 and 25.0 per cent, respectively. In
Africa, the Nigeria‘s NSE ASI, the South African JSE African ASI, the Kenyan
Nairobi NSE 20, the Egyptian EGX CSE 30 and Ghanaian GSE All-Share indices,
decreased by 16.3, 1.0, 28.7, 48.8 and 3.1 per cent, respectively.
The political crises in the Middle East and North Africa (MENA) region, the debt
crises in the Euro-zone, the U.S. sovereign rating downgrade, and the Tsunami in
Japan all contributed to the poor performance of global equities.
3

Central Bank of Nigeria Annual Report—2011
70
Country Index 31-Dec-10 31-Mar-11 30-Jun-11 30-Sep-11 30-Dec-11 % Change b/w
(a) and (e)
AFRICA (a) (b) (c) (d) (e) (f)
Nigeria ASI 24,770.52 24,621.21 24,980.20 20,373.00 20730.63 -16.3
South Africa JSE African ASI 32,296.50 32,204.10 31,864.50 29,674.20 31,985.67 -1
Kenya Nairobi NSE 20 4,495.41 3,887.07 3,968.12 3,284.06 3,205.02 -28.7
Egypt EGX CSE 30 7,073.12 5,463.72 5,373.00 4,137.35 3,622.35 -48.8
Ghana GSE AII Share 1,000.00 1,071.50 1,188.91 1,098.38 969.03 -3.1
US S&P 500 1,271.89 1,325.83 1,320.64 1,131.42 1,257.60 -1.1
Canada S&P/TSX Composite 13,443.20 14,116.10 13,300.90 11,623.84 11,955.09 -11.1
Mexico Bolsa 38,605.80 37,440.50 36,558.10 33,503.28 37,077.52 -4
Brazil Bovespa Stock 69,962.30 68,586.70 62,403.60 52,324.42 56,754.08 -18.9
Argentina Merval 3,628.48 3,388.03 3,360.64 2,084.99 2,462.63 -32.1
Columbia IGBC General 15,368.30 14,469.70 14,067.70 12,915.80 12,665.71 -17.6
EUROPE
UK FTSE 100 5,899.94 5,908.76 5,945.71 5,128.48 5,572.28 -5.6
France CAC 40 3,900.86 3,989.18 3,982.21 2,981.96 3,159.81 -19
Germany DAX 6,989.74 7,041.31 7,376.24 5,502.02 5,898.35 -15.6
Russia MICEX 1,687.99 1,814.65 1,662.18 1,366.54 1,402.33 -16.9
ASIA
Japan NIKKEI 225 10,398.10 9,708.39 9,859.79 8,700.29 8,455.35 -18.7
China Shanghai SE A 2,987.03 3,107.15 2,892.01 2,359.22 2,304.12 -22.9
India BSE Sensex 20,610.20 19,432.40 18,803.50 16,453.80 15,454.92 -25
NORTH AMERICA
SOUTH AMERICA
Source: Bloomberg
Table 3.3: International Stock Market Indices as at 30TH
December, 2011
3.5.3 The International Foreign Exchange Market
Most currencies depreciated against the US dollar. The South African rand and
the Indian rupee depreciated by 22.6 and 19.5 per cent, respectively. The UK
pound lost 6.76 per cent while the Euro depreciated by 18.6 per cent. The
Chinese yuan and Japanese yen both appreciated by 4.6 and 5.2 per cent,
respectively. The rand depreciated the most in the African Region. The Nigerian
naira, the Ghanaian cedi, the Egyptian pound, and the Kenyan shilling all
depreciated by 5.1, 2.8, 4.0 and 5.3 per cent, respectively. Exchange rates
were largely affected by the global economic slow-down, high energy prices,
the Euro debt crisis, political unrest in the Middle East and North Africa, show U.
S. economic recovery and the natural disasters in Japan.
3

Central Bank of Nigeria Annual Report—2011
71
Country Currency 31-Dec-10 31-Mar-11 30-Jun-11 30-Sep-11 31-Dec-11% Change b/w
(a) and (e)
AFRICA (a) (b) (c) (d) (e) (f)
Nigeria Naira 150.66 155.10 152.28 159.73 158.27 5.05
South Africa Rand 6.60 6.77 6.77 8.10 8.09 22.58
Kenya Shilling 80.80 88.00 89.33 100.27 85.07 5.28
Egypt Pound 5.80 5.96 5.97 5.96 6.03 3.97
Ghana Cedi 1.42 1.44 1.42 1.45 1.46 2.82
Canada Dollar 1.00 0.97 0.96 1.05 1.02 2.00
Mexico Peso 12.30 11.90 11.71 13.90 13.94 13.33
Brazil Real 1.70 1.63 1.56 1.88 1.87 10.00
Argentina Peso 4.00 4.05 4.11 4.20 4.30 7.50
Columbia Peso 1923.90 1871.00 1770.78 1931.98 1938.50 0.76
EUROPE
UK Pound Sterling 0.60 0.62 0.62 0.64 0.64 6.76
Euro Area Euro 0.70 0.99 0.97 0.82 0.83 18.57
Russia Ruble 30.60 28.42 27.87 32.18 32.14 5.03
ASIA
Japan Yen 81.10 83.13 80.56 77.06 76.91 5.17
China Remnibi 6.60 6.55 6.46 6.38 6.30 4.55
India Rupee 44.40 44.59 44.70 48.97 53.07 19.53
Table 3.4: Exchange Rates of Selected Countries (Values in Currency units of US$)
NORTH AMERICA
SOUTH AMERICA
Source: Bloomberg
Source: Bloomberg, April 26, 2012
-15.0
-10.0
-5.0
-
5.0
10.0
2010 2011
% A
pp
reci
atio
n/D
ep
reci
atio
n
Figure 3.1: Annual Percentage Change in the Average Unit of Naira Per Foreign Currency
U S DOLLAR POUND STERLING EUROSWISS FRANC J APANESE YEN C F A FRANC
3

Central Bank of Nigeria Annual Report—2011
72
3.5.4 Central Bank Interest Rate Policies
Monetary policy remained accommodating in most economies in the second
half of 2011, especially in many advanced economies. The Federal Reserve
Bank and the Bank of England maintained interest rates at 0.25 and 0.50 per
cent, respectively, throughout the year. The
European Central Bank, the Peoples Bank of
China and the Bank of Japan, all increased
interest rates by 25, 10 and 25 basis points,
respectively, in the second half of 2011. The Bank of Japan and the European
Central Bank cut interest rates in October and December, 2011 by 25 and 10
basis points, respectively.
In the emerging economies, interest rate policy varied in different countries
during the year. India increased its rate from 7.50 per cent in July to 8.0 per cent
and again to 8.50 per cent in October 2011. The Central Bank of Brazil
increased its interest rate from 12.25 to 12.50 per cent in August and later
reduced it to 11.50 per cent in October 2011.
Monetary policy remained accommodating in most economies in the second half of 2011, especially in many advanced economies.
3

Central Bank of Nigeria Annual Report—2011
73
Ghana S. Africa Kenya Nigeria Brazil Chile USA Japan Euro Area India Russia China UK Indonesia
Sept. 2010 13.5 6.0 6.0 6.25 10.75 2.5 0.0 - 0.25 0.1 1.0 6.0 7.75 5.31 0.5 6.5
Oct. 2010 13.5 6.0 6.0 6.25 10.75 2.75 0.0 - 0.25 0.0 - 0.1 1.0 6.0 7.75 5.56 0.5 6.5
Nov. 2010 13.5 5.5 6.0 6.25 10.75 3.0 0.0 - 0.25 0.0 - 0.1 1.0 6.0 7.75 5.56 0.5 6.5
Dec. 2010 13.5 5.5 6.0 6.25 10.75 3.25 0.0 - 0.25 0.0 - 0.1 1.0 6.0 7.75 5.69 0.5 6.5
2011
January 13.5 5.5 6.0 6.5 10.75 3.25 0.0 - 0.25 0.0 - 0.1 1.0 6.0 7.75 5.69 0.5 6.5
February 13.5 5.5 5.75 6.5 11.25 3.5 0.25 0.0 1.0 6.0 8.0 6.06 0.5 6.75
March 13.5 5.5 5.75 7.5 11.25 4.0 0.25 0.0 1.0 6.0 8.0 6.06 0.5 6.75
April 13.5 5.5 6.0 7.5 11.75 4.5 0.25 0.0 1.25 5.75 8.25 6.31 0.5 6.75
May 13.0 5.5 6.25 8.0 12.25 5.0 0.25 0.0 1.25 7.5 8.25 6.31 0.5 6.75
June 13.0 5.5 8.0 8.0 12.25 5.25 0.25 0.0 1.25 7.5 8.25 6.31 0.5 6.75
July 12.5 5.5 8.0 8.75 12.25 5.25 0.25 0.0 1.5 8.0 8.25 6.56 0.5 6.75
August 12.5 5.5 8.0 8.75 12.5 5.25 0.25 0.1 1.5 8.0 8.25 6.56 0.5 6.75
September 12.5 5.5 6.25 8.75 12.5 5.25 0.25 0.1 1.5 8.0 8.25 6.56 0.5 6.75
October 12.5 5.5 16.5 9.25 11.5 5.25 0.25 0.0 1.5 8.5 8.25 6.56 0.5 6.0
November 12.5 5.5 16.5 12.0 11.5 5.25 0.25 0.0 1.5 8.5 8.25 6.56 0.5 6.0
December 12.5 5.5 18.0 12.0 11.5 5.0 0.25 0.0 1.0 8.5 8.0 6.56 0.5 6.0
Table 3.5: Monetary Policy Rates of Selected Countries, 2010-2011 (Per cent)
Sources: US Federal Reserve, BOJ – Bank of Japan, ECB - European Central Bank, BOE - Bank of England
SARB – South Africa Reserve Bank, BOG – Bank of Ghana, POEC - Peoples Bank of China, CBN
3.6 The Impact of Global Economic Developments on the Nigerian Economy
Global developments during the year, including the general slowdown in
growth, persisting European debt crisis, weak financial markets, elevated
commodity prices and inflation rates, affected the Nigerian economy in several
ways.
Growth in the Nigerian economy slowed, partly reflecting the deterioration in
the external environment. Although the monetary policy stance remained
tightened throughout 2011, Nigeria experienced a moderate exchange rate
depreciation, despite recovery in oil prices.
The sharp increase in commodity prices against the backdrop of the social
unrest in the MENA region had a beneficial effect on Nigeria‘s current accounts
balance. As oil exporters generally benefitted from the price increase, Nigeria‘s
current account rose slightly. However, the need to import petroleum products
3

Central Bank of Nigeria Annual Report—2011
74
to meet the domestic supply gap resulted in a huge import bill that took a
significant part of the inflow.
The economy witnessed increased capital inflows in the form of foreign direct
investments (FDI) and portfolio investment, driven largely by the improved
investment climate. However, the tight
private external financing environment,
caused largely by the Euro area debt crisis,
intensified pressures in foreign exchange
markets across the globe. Inflows from
foreign banks remained low. Nonetheless,
there was modest accretion to the external reserves and the 6.5 months of
import cover realized by end-2011 was adequate to engender confidence
among the trading partners.
There were indications of increased private capital inflow, partially reflecting
confidence in the general macroeconomic stability in Nigeria and the
successful conclusion of the April 2011 general elections. Nigeria issued Euro
bonds of US$500 million in the first quarter of 2011 with a high patronage.
Global developments during the year including the general slowdown in growth, persisting European debt crisis, weak financial markets, elevated commodity prices and inflation rates, affected the Nigerian economy in several ways.
3

Central Bank of Nigeria Annual Report—2011
75
he Nigerian financial sector remained relatively resilient and stable in 2011, despite the elevated risks
to financial stability in some advanced economies. The outcome was due to the various measures
taken to sustain confidence in the system, improve liquidity and credit flows, while the supervisory
framework was strengthened.
The thrust of monetary policy in 2011 was largely restrictive. The monetary policy rate was reviewed
upwards six (6) times during the year. Growth in money supply was moderate for most of 2011, but
increased substantially in the last quarter of the year. Growth in net domestic credit was above the
indicative benchmark due, largely, to the increase in credit to both the Federal Government and the
private sector. Reserve money, the Bank‟s operating target, also rose above the indicative benchmark
for the year.
The outcome of financial developments was mixed in 2011. The ratio of broad money supply (M2) to
nominal GDP, at 36.4 per cent, was lower than the 39.5 per cent recorded at end-December 2010.
Total money market assets outstanding grew by 24.7 per cent at end-December 2011 due, largely, to
the increase in the value of FGN bonds, NTBs and commercial papers (CPs). The yield on fixed income
securities (NTBs and FGN bonds) was generally higher in 2011 than in 2010. The yield curve was normal
for most of the year, but inverted towards the end of the year, reflecting the effects of the tight
monetary policy stance of the CBN in 2011. Activities on the floor of the Nigerian Stock Exchange
indicated mixed developments.
4.1 INSTITUTIONAL DEVELOPMENTS
4.1.1 Growth and Structural Changes
The structure of the Nigerian financial sector changed during the year under
review in terms of the number of institutions, capital requirements and licensing
of new institutions. In the banking sub-sector, the number of DMBs declined to
twenty (20) from twenty-four (24), following the mergers/acquisitions of four (4)
of the intervened banks by four (4) healthy banks. The number of DMBs‘
branches, however, increased to 5,810, from 5,799 in 2010, indicating an
increase of 0.2 per cent. As at December 31, 2011 the NDIC had not obtained
a final court order for the liquidation of the remaining two (2) of the thirteen (13)
insolvent banks that were closed on January 16, 2006, given that the revocation
of the banks‘ licences were the subject of litigation. Therefore, the two banks in-
liquidation could not be offered for sale under the Purchase and Assumption (P
T
CHAPTER FOUR
FINANCIAL SECTOR DEVELOPMENTS

Central Bank of Nigeria Annual Report—2011
76
& A) resolution option during the period under review. The Bank issued
promissory notes worth N48.0 billion to cover the shortfall between the assumed
deposit liabilities and the cherry-picked assets of the eleven (11) failed banks
that were liquidated. The CBN received N5.24 billion as liquidation dividend
from the NDIC in respect of the failed banks, in line with the terms of the P & A
contract.
In the other financial institutions (OFIs) sub-sector, a revised microfinance policy
framework was issued by the CBN on April 29, 2011 with the following capital
structure:
Unit microfinance banks, authorized to operate in one location only,
required to have a minimum paid-up capital of N20.0 million;
State microfinance banks, authorized to operate within a state or the
Federal Capital Territory (FCT), required to have a minimum paid-up
capital of N100.0 million; and
National microfinance banks, authorized to operate in more than one
state including the FCT, required to have a minimum paid-up capital of
N2.0 billion.
In addition, a new policy framework for the operation of the primary mortgage
bank sub-sector was approved in November 2011. The policy provides for an
increase in the minimum paid-up capital of primary mortgage institutions (PMIs)
and a change of their generic name to primary mortgage banks (PMBs). The
new policy categorizes the sub-sector along national and state lines, with paid-
up capital as follows:
National Primary Mortgage Banks:
o Minimum paid-up capital of N5.0 billion, allowed to operate in all the
states of the Federation
State Primary Mortgage Banks:
o Minimum paid-up capital of N2.5 billion, allowed to operate in only one
state
4

Central Bank of Nigeria Annual Report—2011
77
The policy further provides for the development of a uniform underwriting
standard for mortgage loan origination and the establishment of a second-tier
mortgage finance institution. The institution is to be dedicated to the provision
of mortgage refinance/liquidity, including short-term liquidity, long-term funding
and guarantees for mortgage/housing finance lenders.
The new policy precludes PMBs from operating current accounts for non-
mortgage customers, granting consumer or commercial loans and engaging in
project management for real estate development, amongst others. It also aims
at strengthening corporate governance by limiting the tenure of executive
directors to a maximum of 5 years, renewable once; while that of non-
executive directors is restricted to a maximum of 4 years, renewable twice.
Existing PMBs are allowed a maximum of 18 months to meet the compliance
deadline of April 30, 2013.The reform is expected to facilitate the provision of
affordable housing for both low and medium income segments of the Nigerian
society and the overall development of the housing sector.
4.1.2 Fraud and Forgery
The number of reported cases of attempted or crystalised fraud and/or forgery
in the banking industry declined in 2011. There were 2,527 reported cases of
attempted fraud or forgery, involving N29.5 billion, as against 5,960 cases
involving N19.7 billion and US$19.2 million in 2010. Of this amount, the actual loss
to the banks was N5.8 billion, compared with N11.4 billion and US$10.98 million
at end-December 2010.The reduction in actual loss was accounted for by
improvements in risk management practices in the banking sector. The fraud
cases were perpetrated through various means, including pilfering and theft,
suppression and conversion of customer deposits, illegal funds transfer and
fraudulent ATM withdrawals, among others.
4

Central Bank of Nigeria Annual Report—2011
78
Box 5: The Nigerian Sustainable Banking Principles
The Nigerian Sustainable Banking Principles are an initiative spearheaded by the Bankers‘
Committee Sub-Committee on Economic Development and Sustainability. It has emerged as a
result of recent global trends that demand greater attention to environmental and social issues
in banking practices.
At the CEO Roundtable held on September 9, 2011 during the Nigerian Sustainable Finance
Week, it was agreed that Nigeria‘s development imperative should not only be economically
viable, but socially relevant and environmentally responsible. It was further agreed that the
banking sector has a significant role and responsibility to deliver a positive development impact
to society, whilst protecting the communities and environment in which it operates. At the
Roundtable, the Governor of the Central Bank of Nigeria reinforced the need to institutionalize
sustainability into Nigeria‘s banking culture and pledged the Central Bank of Nigeria‘s support
for this initiative.
The Bankers‘ Sub-committee on Economic Development and Sustainability will lead an effort to
develop industry-wide standards that would help ensure that the lending and banking
operations of Nigerian banks conform to global environmental and social practices. A team of
six banks (Access Bank Plc., Citibank Nigeria Limited, Diamond Bank Plc., Guaranty Trust Bank
Plc., Standard Chartered Bank Nigeria Limited and Zenith Bank Plc.), with support from the
Netherlands Development Finance Company (FMO), the International Finance Corporation
(IFC) and an independent advisor, was constituted to form the core working-group known as
the Strategic Sustainability Working Group (SSWG). Under the auspices of the Bankers‘ Sub-
Committee, the SSWG is tasked with developing the Nigerian Sustainable Banking Principles. A
Joint Commitment Statement was subsequently released in October 2011, signed by all
members of the Bankers‘ Committee.
Furthermore, at the Bankers‘ Committee Annual Retreat held in Calabar in 2011, it was agreed
that all banks in the sector should be included in the process of developing the guidelines
thereby ensuring a balanced approach that would be reflective and inclusive of the entire
sector. Therefore, each Bank and Discount House has nominated a Sustainability Champion,
who would be responsible for driving the sustainability agenda within their respective
institutions. Other sector stakeholders such as the NDIC, Development Finance Institutions (DFIs)
and representatives of relevant Federal Ministries and Agencies have also been invited to
partake in the process.
The SSWG will be working steadily over the next few months to develop an overarching set of
principles with the aim of introducing good practice for the Banks in relation to:
• Direct footprint: leading by example – corporate sustainability of the Banks; and
• Indirect footprint: environmental and social risks and opportunities relating to business
activities (e.g. lending, risk management, client on-boarding/credit approval processes,
retail/consumer).
In addition, a set of sector-specific guidelines will be developed for each of the following
priority sectors:
• Oil and Gas,
• Power (with a focus on renewable energy), and
• Agriculture (with a focus on related water resources).
The sector-specific guidelines shall provide clear and practical guidance to the institutions
adopting the principles to: i) leverage financial sector investment across the value chain to
drive economic growth that is environmentally responsible and socially relevant; and ii) ensure
that, where possible, the approach taken is consistent with international best practice and
standards.
4

Central Bank of Nigeria Annual Report—2011
79
A further commitment has also been made to raise awareness and develop lasting local
capacity to manage emerging environmental and social risks and opportunities within banks‘
internal operations, as well as in relevant financial sector government agencies, learning
institutions and service providers. Therefore, it is envisaged to roll out an industry-wide capacity
building programme, following the adoption of the principles in June 2012. The SSWG, with
support from IFC and FMO is currently working on identifying the capacity gaps within the
industry and designing a programme that would adequately address them. A deadline of June
2012 has been given by the Bankers‘ Sub-Committee to formally adopt the principles.
4.1.3 Consumer Protection
The Bank strengthened its consumer protection activities in the year. A
consumer protection framework was developed, which included consumer
literacy and education, complaints management, fair practices and
collaboration with stakeholders, amongst others. In order to enhance consumer
education and promote consumer rights on financial transactions with banks
and other financial institutions in Nigeria, the Consumer Protection Office was
mandated to address customer/consumer complaints. The Bank also issued
relevant circulars to the banks and collaborated with the Consumer Protection
Council (CPC) on complaints management, consumer education and
enlightenment, and information sharing.
The Bank received 1,926 complaints at end-December 2011, of which 1,510
were treated, resulting in a refund of N4.34 billion by banks, compared with
1,526 complaints and a refund of N2.20 billion in 2010. Most of the complaints
bordered on conversion of invested funds, unauthorised and fraudulent
withdrawals from customer accounts, excess charges, and staff matters.
4.1.4 Cheque Clearing
In 2011, the volume and value of cheques cleared nationwide increased by
11.0 per cent and 13.3 per cent to 37.72 million and N22.30 trillion from 33.99
million and N19.69 trillion, respectively, in 2010. The rise in volume was due
largely to the slow implementation of the Federal Government‘s e-payment
policy in respect of taxes, staff salaries, pensions and contractors‘ payments.
4
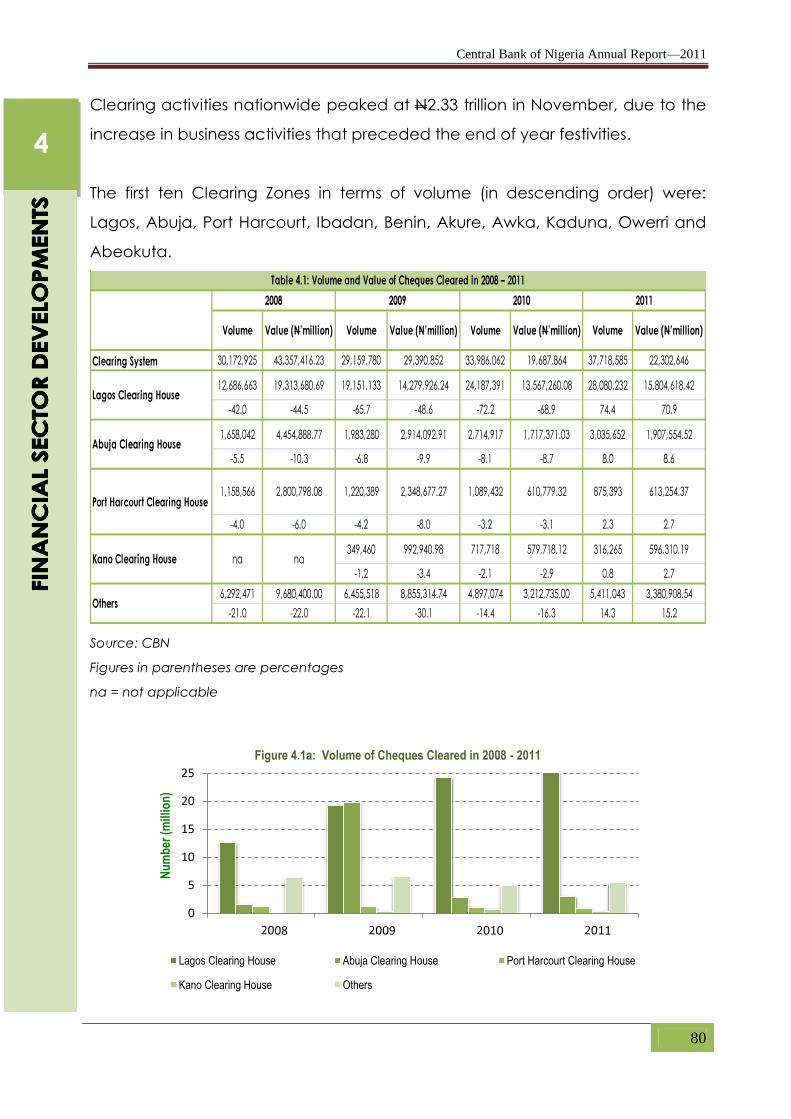
Central Bank of Nigeria Annual Report—2011
80
Clearing activities nationwide peaked at N2.33 trillion in November, due to the
increase in business activities that preceded the end of year festivities.
The first ten Clearing Zones in terms of volume (in descending order) were:
Lagos, Abuja, Port Harcourt, Ibadan, Benin, Akure, Awka, Kaduna, Owerri and
Abeokuta.
Clearing System 30,172,925 43,357,416.23 29,159,780 29,390,852 33,986,062 19,687,864 37,718,585 22,302,646
12,686,663 19,313,680.69 19,151,133 14,279,926.24 24,187,391 13,567,260.08 28,080,232 15,804,618.42
-42.0 -44.5 -65.7 -48.6 -72.2 -68.9 74.4 70.9
1,658,042 4,454,888.77 1,983,280 2,914,092.91 2,714,917 1,717,371.03 3,035,652 1,907,554.52
-5.5 -10.3 -6.8 -9.9 -8.1 -8.7 8.0 8.6
1,158,566 2,800,798.08 1,220,389 2,348,677.27 1,089,432 610,779.32 875,393 613,254.37
-4.0 -6.0 -4.2 -8.0 -3.2 -3.1 2.3 2.7
349,460 992,940.98 717,718 579,718.12 316,265 596,310.19
-1.2 -3.4 -2.1 -2.9 0.8 2.7
6,292,471 9,680,400.00 6,455,518 8,855,314.74 4,897,074 3,212,735.00 5,411,043 3,380,908.54
-21.0 -22.0 -22.1 -30.1 -14.4 -16.3 14.3 15.2Others
Value (N’million)
Lagos Clearing House
Abuja Clearing House
Port Harcourt Clearing House
Kano Clearing House na na
2011
Volume Value (N’million)
Table 4.1: Volume and Value of Cheques Cleared in 2008 – 2011
2008 2009 2010
Volume Value (N’million) Volume Value (N’million) Volume
Source: CBN
Figures in parentheses are percentages
na = not applicable
0
5
10
15
20
25
Nu
mb
er (
mill
ion
)
Figure 4.1a: Volume of Cheques Cleared in 2008 - 2011
Lagos Clearing House Abuja Clearing House Port Harcourt Clearing House
Kano Clearing House Others
4

Central Bank of Nigeria Annual Report—2011
81
In terms of value of cheques cleared in 2011, the ranking,(in descending order)
was Lagos, Abuja, Port Harcourt, Kano, Abeokuta, Kaduna, Benin, Awka, Uyo
and Asaba.
The Lagos Clearing Zone accounted for 74.5 per cent (volume) and 70.9 per
cent (value) of the total cheque transactions in 2011. This was attributed to the
fact that Lagos remained the economic and commercial hub of Nigeria.
Cheque clearing activities in the Abuja Zone, however, shrank because of the
implementation of e-payment by the Federal Government for staff salaries,
suppliers‘ and contractors‘ payments.
4.1.5 Inter-bank Funds Transfer (IFT)
The volume and value of interbank funds transfer, through the RTGS System
(CBN Interbank Fund Transfer System – CIFTS), increased by 32.1 and 26.1
percent to 492,953 and N117,246.51 billion in 2011, respectively compared with
373,248 and N92,955.0 billion, in 2010.
4.1.6 Use of e-Money Products
The volume and value of electronic card (e-card) transactions increased
significantly from 195,525,568 and N1,072.9 billion in 2010 to 355,252,401 and
N1,671.4 billion, reflecting an increase of 81.5 and 55.8 per cent, respectively.
The increase was attributed to enhanced public confidence in electronic card
payments.
0
5
10
15
20
25
2008 2009 2010 2011
N'b
illio
n
Figure 4.1b: Value of Cheques Cleared in 2008 - 2011
Lagos Clearing House Abuja Clearing House Port Harcourt Clearing House
Kano Clearing House Others
4

Central Bank of Nigeria Annual Report—2011
82
Data on various e-payment channels for the period under review indicated
that ATMs remained the most patronized, accounting for 97.8 per cent,
followed by web payments, 1.0 per cent,
Point-of-Sale (POS) terminals, and mobile
payments, 0.6 per cent each. Similarly, in
value terms, ATMs accounted for 93.4 per
cent, web 3.5 per cent, POS 1.9 per cent and
mobile payments, 1.2 per cent.
The number of ATMs stood at 9,640, while the volume and value of transactions
amounted to 347,569,999 and N1,561.75 billion, at end-December 2011,
respectively. These figures reflected increases of 86.7 and 63.7 per cent
respectively over the volume and value of 186,153,142 and N954.04 billion, at
end-December 2010.
The volume and value of mobile payments increased by 215.6 and 185.8 per
cent from 1,156,553 and N6.7 billion to 3,649,374 and N19.0 billion, respectively,
at end-December 2011.
e-Payment
Segment 2008 2009 2010 2011 2008 2009 2010 2011
ATM 60.1 109.6 186.2 347.6 399.7 548.6 954.0 1561.8
% of Total 91.0 95.3 95.1 97.9 9.5 85.0 88.9 93.4
Web (internet) 1.6 2.7 7.2 3.6 25.1 84.2 99.5 58.0
% of Total 2.4 2.3 3.7 1.0 5.7 13.1 9.3 3.5
POS 1.2 0.9 1.1 2.1 16.1 11.0 12.7 31.0
% of Total 1.8 0.8 0.6 0.6 3.7 1.7 1.2 1.9
Mobile 3.2 1.8 1.2 1.9 0.7 1.3 6.7 20.5
% of Total 4.8 1.6 0.6 0.5 0.1 0.2 0.6 1.2
TOTAL 66.1 115.0 195.7 355.2 441.6 645.1 1072.9 1671.4
Volume (Millions)
Table 4.2: Market Share in the e-Payment Market in 2008 - 2011
Value (N ' Billion)
Source: CBN
The use of the various forms of e-payment grew significantly, due to enhanced public
confidence in electronic card payments.
4

Central Bank of Nigeria Annual Report—2011
83
4.1.7 Institutional Savings
Aggregate financial savings rose by N427.9 billion or 6.7 per cent to N6,858.5
billion, compared with N6,430.6 billion at end-December 2010. The ratio of
financial savings to GDP was 18.8 per cent, compared with 32.9 per cent in
2010. The DMBs remained the dominant depository institutions within the
financial system and accounted for 95.2 per cent of the total financial savings,
compared with 92.6 per cent in the preceding year. Other savings institutions,
namely, the PMBs, life insurance funds, the pension funds, the Nigerian Social
Insurance Trust Fund, and microfinance banks accounted for the balance of
4.8 per cent.
ATM 97.9%
POS 0.6%
Web 1.0%
Mobile 0.5%
Figure 4.2a: Volume of Electronic Card-based Transactions in 2011
ATM 93.4%
POS 1.9% Web
3.5%
Mobile 1.2%
Figure 4.2b: Value of Electronic Card-based Transactions in 2011
4

Central Bank of Nigeria Annual Report—2011
84
4.2 MONETARY AND CREDIT DEVELOPMENTS
4.2.1 Reserve Money (RM)
At N2, 784.3 billion, reserve money (RM) grew by 50.9 per cent over the level at
end-December 2010. At this level, RM exceeded the indicative benchmark of
N2, 515.3 billion for fiscal 2011 by 10.7 per cent, compared with 11.6 per cent at
end-December 2010. The growth in sources of monetary base was accounted
for by the rise in net domestic assets and foreign assets (net) of the CBN. The
corresponding rise in the uses of base money reflected the increase in its
components, namely, currency and DMBs‘ reserves at the CBN.
4.2.2 Broad Money (M2)
Broad money supply (M2) grew by 15.4 per cent at end-December 2011 to N13,
300.3 billion, compared with the indicative benchmark of 13.8 per cent for fiscal
2011 and the growth of 6.9 per cent at end-December 2010. The development
0
500
1000
1500
2000
2500
3000
2007 2008 2009 2010 2011
N' B
illio
n
Figure 4.3a: Reserve Money and its Components
Reserve Money Currency in Circulation Bank Reserves
0
500
1000
1500
2000
2500
3000
2007 2008 2009 2010 2011
N' B
illio
n
Figure 4.3b: Reserve Money Targets and Outcomes
Benchmark Actual
4

Central Bank of Nigeria Annual Report—2011
85
was largely driven by the expansion in domestic credit (net) and foreign assets
(net) of the banking system. Correspondingly, the growth in total monetary
liabilities, M2, was driven by the increase in its components, namely, narrow
money and quasi-money.
Analysis of the composition of M2 showed that, as in the preceding year, the
distribution was skewed in favour of the highly liquid M1, especially in the last
quarter of the year, due to seasonal factors.
Demand deposit and currency outside bank
grew by 23.1 and 15.0 per cent, respectively,
compared with 9.8 and 16.7 per cent at end-
December 2010. As a proportion of the total
monetary liabilities, demand deposit and currency outside bank stood at 41.1
and 9.4 per cent, respectively, at the end of the year under review. At 13.6 per
cent at end-December 2011, foreign currency deposit, remained a significant
component of M2.
4.2.3 Drivers of Growth in Broad Money
4.2.3.1 Net Foreign Assets (NFAs)
Net foreign assets of the banking system, at N7,180.6 billion, represented an
increase of 10.4 per cent at end-December 2011, in contrast with the decline of
14.3 per cent at the end of the preceding year. The development reflected,
wholly, the increase in the net foreign assets (NFA) holdings of the CBN, which
10
12
14
16
18
20
2007 2008 2009 2010 2011
per
cen
t
Figure 4.4: Ratio of Currency in Circulation to M2
The movement in M2 was largely driven by the expansion in domestic credit (net) and foreign
assets (net) of the banking system.
4

Central Bank of Nigeria Annual Report—2011
86
rose to N5, 865.8 billion at end-December 2011 from N5, 372.3 billion at end-
December 2010. As a share of M2, NFA accounted for 54.0 per cent and
contributed 5.9 per cent to its growth at end-December 2011.
4.2.3.2 Net Domestic Credit (NDC)
Credit to the domestic economy (net) grew by 42.4 per cent at end-December
2011, compared with 10.0 per cent at end-December 2010. At that level,
domestic credit (net) exceeded the indicative benchmark of 29.3 per cent for
fiscal 2011. The development reflected the 52.7 per cent growth in credit to the
Federal Government and the 31.6 per cent rise in credit to the private sector.
Net domestic credit to the economy contributed 32.1 per cent to the growth of
total monetary assets (M2) at end-December 2011.
4.2.3.3 Net Credit to Government (NCG)
Net credit to government (NCG) rose by 52.7 per cent, compared with 51.3 per
cent at end-December 2010 and the indicative benchmark of 29.3 per cent for
fiscal 2011. The substantial growth in credit to the Federal Government was
attributable to the issuance of treasury bills and bonds during the review period.
Notwithstanding, the Federal Government remained a net creditor to the
banking system in 2011, as in the preceding year.
-200
-100
0
100
200
300
400
500
600
700
2007 2008 2009 2010 2011
Figure 4.5: Growth in M2 and its Sources (per cent)
NFA NDC OAN M2
4

Central Bank of Nigeria Annual Report—2011
87
2007 2008 2009 2011
Net Foreign Assets (NFA) 23.8 22.1 -11 5.9
Net Domestic Credit (NDC) 49 39 31.9 32.1
Other Assets (net) (OAN) -28.6 -3.3 -3.9 -22.6
M2 44.2 57.8 17.06 15.4
Narrow Money (M1) 20.7 30 1.2 10.4
Quasi Money 23.5 27.8 15.9 5
M2 44.2 57.8 17.06 15.4
6.7
4.93
1.77
6.7
Table 4.3: Contribution to the Growth in M2 (2007 – 2011) per cent
2010
-11.98
9.84
8.84
Source: CBN
4.2.3.4 Credit to the Private Sector (CP)
Credit to the private sector (including states and local governments and non-
financial public enterprises) grew by 31.6 per cent, in contrast to the decline of
3.8 per cent at end-December 2010. Credit to the core private sector
increased by 31.3 per cent, in contrast to the decline of 4.4 per cent at end-
December 2010. The significant growth in credit to the private sector reflected
the injection of funds by AMCON into the intervened banks.
-150
-50
50
150
2007 2008 2009 2010 2011per
cen
t
Figure 4.6: Share of NFA and NDC in M2 (per cent)
NFA NDC OAN
4

Central Bank of Nigeria Annual Report—2011
88
4.2.3.5 Other Assets (Net) (OAN)
Other Assets (net) of the banking system declined by 70.3 per cent, in contrast
to an increase of 22.0 per cent at end-December 2010. Consequently, the
decline in other assets (net) moderated the expansion in M2 as it contributed
negative 22.6 percentage points to its growth.
4.2.3.6 Narrow Money (M1)
Narrow money supply (M1), grew by 21.5 per cent at end-December 2011,
compared with 11.1 per cent at end-December 2010. The currency
component (COB) rose by 15.0 per cent, while demand deposit grew by 23.1
per cent, compared with their respective growth rates of 16.7 and 9.8 per cent
at the end of the preceding year. As a proportion of M1, COB stood at 18.0 per
cent at end-December 2011, 1.4 percentage point lower than the level at end-
December 2010.
-700-600-500-400-300-200-100
0100200300400500600700
2007 2008 2009 2010 2011
Figure 4.7: Growth in Domestic Credit (per cent)
Aggregate Credit Credit to Prv. Sector Credit to Govt.
4

Central Bank of Nigeria Annual Report—2011
89
2007 2008 2009 2010 2011
Net Foreign Assets 125.1 93.3 70.3 56.5 54
Net Domestic credit 46.3 54.0 73.4 75.6 93.3
Net Credit to Government -40.8 -33.9 -21.2 -9.7 -4.0
Credit to Private Sector 87.0 87.9 94.8 85.3 97.2
Other Assets (Net) -71.3 -47.3 -43.9 -32.0 -47.2
Total Monetary Assets 100 100 100 100 100
Money Supply (M1) 53.6 53.0 46.5 48.3 50.9
Currency Outside Banks 12.7 9.7 8.6 9.4 9.4
Demand Deposit 40.9 43.2 37.9 38.9 41.5
Quasi Money 46.4 47.0 53.5 51.7 49.1
Time & Savings Deposit 46.4 47.0 53.5 51.7 49.1
Foreign Currency Deposit (FCD) 8.2 10.1 13.4 13.1 14.8
Total Monetary Liabilities (M2) 100.0 100.0 100.0 100.0 100.0
Table 4.4: Composition of Total Monetary Aggregate (M2) (Per cent)
Source: CBN
-50
0
50
100
150
2007 2008 2009 2010 2011
Figure 4.8: Growth in Monetary Aggregates (per cent)
Reserve Money M1 M2
0
20
40
60
80
100
120
140
0
20
40
60
80
100
120
140
160
2007 2008 2009 2010 2011
Gro
wth
in C
OB
, Dem
and
Dep
osi
ts a
nd
Q
uas
i Mo
ney
Gro
wth
in M
2
Figure 4.9: Growth in the Components of Broad Money (M2) (per cent)
Currency Outside Banks Demand Deposits Quasi-Money M2
4

Central Bank of Nigeria Annual Report—2011
90
4.2.3.7 Quasi-Money
Quasi-Money grew by 9.7 per cent, compared with 3.3 per cent at end-
December 2010. The development reflected, largely, the growth in foreign
currency deposit with DMBs.
4.2.4 Maturity Structure of DMBs’ Loans and Advances and Deposit Liabilities
The structure of DMBs‘ outstanding credit at end-December 2011 indicated the
dominance of short-term maturities, as in the preceding year. Outstanding
loans and advances maturing in one year or shorter accounted for 60.0 per
cent, compared with 65.3 per cent at end-December 2010, which showed a
marginal shift towards the medium to long
term. The medium term (longer than one
year, but less than three years) and long
(three years and above) maturities
improved at 15.2 and 24.8 per cent,
respectively, which indicated 1.6 and 4.7 percentage points growth over the
levels at end-December 2010. Similarly, short-term deposits constituted 97.8
per cent of the total, compared with 96.9 per cent at end-December 2010.
Further analysis showed that 76.5 per cent of the deposit had a maturity of less
than 30 days, compared with 76.3 per cent at end-December 2010, while long-
term deposit of longer than three (3) years constituted only 0.1 per cent at end-
December 2011, from 1.1 per cent recorded at the end of the preceding year.
The dominance of short-term maturities in deposit money banks constrained
their capacity to grant long-term credit.
Analysis of DMBs’ outstanding credits and deposit liabilities showed that short-term maturities dominated both the credit and
deposit markets.
4

Central Bank of Nigeria Annual Report—2011
91
Tenor/Period 2007 2008 2009 2010 2011 2007 2008 2009 2010 2011
0-30 days 49.2 46.6 50.1 46.1 33.4 74.1 72.7 73.3 76.3 76.5
31-90 days 11.3 13.4 6.4 10.0 12.2 12.3 13.1 15.0 14.4 12.6
91-181 days 5.8 7.8 7.3 3.9 6.1 4.3 6.2 4.7 3.4 4.5
181-365 days 9.5 7.5 6.5 5.3 8.3 2.6 2.7 2.7 2.8 4.21
Short term 75.8 75.4 70.3 65.3 60.0 93.3 94.8 95.7 96.9 97.77
Medium term(above I year and
below 3 years)13.5 14.5 14.3 14.6 15.2 3.3 5.2 4.1 2.1 2.14
Long term (3 years and above) 10.7 10.1 15.3 20.1 24.8 3.3 0.03 0.1 1.1 0.087
Total 100.0 100.0 100.0 100.0 100.0 100.0 100.0 100.0 100.0 100.0
Table 4.5: Maturity Structure of DMBs’ Loans and Advances and Deposit Liabilities (per cent)
Loans and Advances Deposits
Source: CBN
Short term 60.0%
Medium term 15.2%
Long term 24.8%
Figure 4.10a: Maturity Structure of DMBs Loans and Advances at End-December 2011
Medium term, 2.1%
Short term , 97.8%
Long term, 0.1%
Figure 4.10b: Maturity Structure of DMBs' Deposits at End-December 2011
4

Central Bank of Nigeria Annual Report—2011
92
4.2.5 Sectoral Distribution of Credit
Credit to the core private sector by the DMBs grew by 31.3 per cent at end-
December 2011, in contrast to the decline of 4.4 per cent recorded at end-
December 2010. Of the amount outstanding, DMBs‘ credit to priority sectors
constituted 36.1 per cent, of which 3.5, 17.7, 0.5 and 14.4 per cent, were
disbursed to agriculture, solid minerals, exports and manufacturing,
respectively. The less preferred sectors accounted for 45.8 per cent of
outstanding credit, compared with 47.8 per cent at end-December 2010, while
the unclassified sector accounted for the balance of 18.1 per cent.
2007 2008 2009 2010 2011
1. Priority Sector 25.9 26.2 25.2 30.4 36.1
Agriculture 3.2 1.4 1.4 1.7 3.5
Solid Minerals 10.7 11.3 12.7 15.3 17.7
Exports 1.4 1.0 0.5 0.6 0.5
Manufacturing 10.4 12.5 10.6 12.8 14.4
2. Less Preferred Sectors 41.2 42.0 46.9 47.8 45.8
Real Estate 6.2 6.2 8.3 8.7 6.2
Public Utilit ies 0.6 0.6 0.8 0.7 0.9
Transp. & Comm. 6.8 7.2 8.3 10.7 17.3
Finance & Insurance 9.4 9.5 13.1 11.3 4.1
Government 3.7 1.9 3.7 4.9 6.8
Imports & Dom. Trade 14.5 16.4 12.8 11.7 10.3
3. Unclassified 32.9 31.8 27.9 21.8 18.1
Total (1+2+3) 100.0 100.0 100.0 100.0 100.0
Table 4.6:Share of Credit to the Core Private Sector, 2007 – 2011 (Per cent)
Source: CBN
Unclassified, 18.1
Less Preferred Sectors,
45.8
Agriculture, 3.5
Solid Minerals, 17.7
Exports, 0.5
Manufacturing, 14.4
Priority sectors, 36.1
Figure 4.11a: Share in Outstanding Credit to the Core Private Sector in 2011 (per
cent)
4

Central Bank of Nigeria Annual Report—2011
93
4.2.6 Outstanding Consumer Credit
Consumer credit improved during the review period. Available data showed
that outstanding DMBs‘ consumer credit rose by 18.6 per cent to N526.39 billion
at end-December 2011 over the level at end-January 2011. At that level,
consumer credit constituted 4.2 per cent of the total DMBs‘ outstanding credit
to the core private sector and was 0.7 percentage points lower than the ratio
of 4.9 per cent at end-January 2011. The development might be attributable to
the rising incomes and enhanced confidence among consumers as well as a
positive outlook of the economy, especially the financial system. Furthermore,
the rising consumer credit implies greater financial inclusion, which could
enhance the effectiveness of monetary policy transmission.
0
10
20
30
40
50
60
2007 2008 2009 2010 2011
pe
r ce
nt
Figure 4.11b: Share in Outstanding Credit to the Core Private Sector (2007-2011)
Priority Sectors Less Preferred Sectors Unclassified
4

Central Bank of Nigeria Annual Report—2011
94
Figure 4.12: Consumer Credit in 2011
4.2.7 Financial/Banking System Development
Financial deepening was less impressive in 2011, as the ratio of M2 to GDP stood
at 36.4 per cent, down from 39.5 per cent at end-December 2010. Bank
financing of the economy, measured by the ratio of private sector credit to
GDP (CP/GDP) stood at 53.1 per cent at end-December 2011, compared with
58.8 per cent at end-December 2010. In addition, the intermediation efficiency
indicator, as measured by the ratio of currency outside banks to broad money
supply, at 9.4 per cent, remained the same as at end-December 2010.
380
400
420
440
460
480
500
520
540
N' B
illio
n
-10
0
10
20
30
40
50
60
70
2007 2008 2009 2010 2011
Per
cen
t
Figure 4.13a: Ratio of Broad Money (M2) and Credit to the Private Sector (CP) to GDP and Currency Outside Bank (COB) to M2 (Per cent)
M2/GDP CPS/GDP COB/M2
4

Central Bank of Nigeria Annual Report—2011
95
The ratio of financial savings to GDP declined to 17.9 per cent, from 20.2 per
cent in the preceding year. The moniness of the economy, as measured by the
ratio of CIC to GDP, declined slightly to 4.3 per cent from 4.7 per cent in 2010.
Similarly, the size of the DMBs‘ assets relative to the size of the economy,
indicated by the ratio of DMBs total assets to GDP, declined slightly from 58.8
per cent at end-December 2010 to 53.1 per cent in 2011.
-
20.00
40.00
60.00
80.00
100.00
120.00
2007 2008 2009 2010 2011
Per
cen
t
Figure 4.13b: Ratio of Banking System's Total Assets to GDP (per cent)
-
10.00
20.00
30.00
40.00
50.00
60.00
70.00
80.00
2007 2008 2009 2010 2011
Per
cen
t
Figure 4.13c: Ratio of Deposit Money Banks' Assets to GDP (per cent)
4

Central Bank of Nigeria Annual Report—2011
96
Aggregates (N’ billion) 2007 2008 2009 2010 2011
Nominal GDP 20,657.3 24,296.3 24,712.7 29,108.0 36,531.9
Broad money (M2) 5,809.8 9,166.8 10,767.4 11,488.7 13,300.3
Quasi Money (Savings) 2,693.6 4,309.5 5,763.5 5,954.3 6,531.9
Currency in circulation 960.8 1,155.3 1,181.5 1,378.0 1,565.8
Currency Outside banks 737.9 892.8 927.2 1,082.2 1,244.8
Credit to Private Sector 5,056.7 8,059.5 10,206.1 9,703.7 12,934.3
DMBs Assets 10,981.7 15,919.6 15,522.9 17,331.6 19,396.6
CBN Assets 8,689.0 10,204.0 8,898.4 8,767.7 15,796.1
Banking System Assets 19,670.7 26,123.5 27,726.8 26,230.0 28,164.3
Monetary Ratio (per cent)
M2/GDP 28.1 37.7 43.6 39.1 36.4
CIC/ M2 16.5 12.6 11.0 12.0 11.8
COB/ M2 12.7 9.7 8.6 9.4 9.4
Quasi Money/ M2 46.4 47.0 53.5 51.7 49.1
CIC/GDP 4.7 4.8 4.8 4.7 4.3
Cp/GDP 24.5 33.2 41.3 58.8 53.1
Cp/Non-Oil GDP 38.5 55.4 67.2 50.2 58.7
DMBs Assets/GDP 53.2 65.5 70.9 58.8 53.1
CBN‘s Assets/GDP 48.6 35.8 41.3 30.2 24.0
Banking System‘s Assets/GDP 95.2 107.5 112.2 88.9 77.1
Qm/GDP 12.9 17.5 22.8 20.2 17.9
Table 4.7: Monetary Aggregates and Measures of Financial/Banking Developments, 2007 - 2011
Source: CBN
4.2.8 Money Multiplier and Velocity of Money
The broad money multiplier at end-December 2011 stood at 4.8, compared
with 6.4 at the end of the preceding year and the 6.7 programmed for fiscal
2011. The decline reflected the increase in the reserve /deposit ratio from 4.8 to
10.6, offsetting the slight decline in its currency component.
2007 2008 2009 2010 2011
Currency Ratio 19.2 14.5 2.9 14.1 13.7
Reserve Ratio 4.7 4.9 5.2 4.8 10.6
M2 Multiplier 4.9 5.9 6.5 6.4 4.8
Velocity of M2 3.6 2.7 2.3 2.5 2.7
Table 4.8: Money Multiplier and Velocity of M2, 2007 - 2011
Source: CBN
4

Central Bank of Nigeria Annual Report—2011
97
The velocity of circulation of broad money edged up slightly, but remained
relatively stable at end-December 2011. The M2 velocity, which stood at 2.5 at
end-December 2010 increased slightly to 2.7 at end-December 2011. However,
it showed a declining trend over the last five years, reflecting an improvement
in financial deepening in the economy.
4.3 OTHER FINANCIAL INSTITUTIONS
4.3.1 Development Finance Institutions (DFIs)
The total assets of the five DFIs increased by 13.7 per cent to N359.6 billion,
compared with N316.2 billion at end-December 2010. Analysis of the assets
base of the five institutions indicated that the Bank of Industry (BOI) accounted
for 53.2 per cent of the total. The Federal Mortgage Bank of Nigeria (FMBN), the
Nigeria Export-Import Bank (NEXIM), the Bank of Agriculture (BOA) and the
4.9
5.9 6.5 6.4
4.8
0.0
5.0
10.0
15.0
20.0
25.0
0.0
1.0
2.0
3.0
4.0
5.0
6.0
7.0
2007 2008 2009 2010 2011
Rat
io
Rat
io
Figure 4.14: Money Multiplier, Currency Ratio and Reserve Ratio, 2007 - 2011
Currency Ratio (Right Axis) Reserve Ratio (Right Axis) Multiplier for M2 (Left Axis)
2.0
2.5
3.0
3.5
4.0
Dec '07 Dec '08 Dec '09 Dec '10 Dec 11
Figure 4.15: The Velocity of Money
4

Central Bank of Nigeria Annual Report—2011
98
Urban Development Bank (UDBN) accounted for 21.9, 11.4, 10.0 and 3.0 per
cent of the total, respectively.
Cumulative loans disbursement by the five institutions rose to N129.8 billion at
end-December 2011, from N111.8 billion at end-December 2010, representing
an increase of 16.1 per cent. A breakdown of the loans disbursement indicated
that FMBN, BOI, BOA, NEXIM and UDBN accounted for 42.7,29.6, 17.4, 10.2 and
0.1 per cent, respectively. The combined paid-up share capital of the five DFIs
was N68.4 billion, compared with N50.1 billion at end-December 2010, while
their combined shareholders‘ funds was N25.8 billion, owing to the substantial
negative reserves of some of the DFIs. This, however, represented an
improvement when compared with the negative N3.0 billion recorded at end-
December 2010.
4.3.2 Microfinance Banks (MFBs)
The total assets/liabilities of MFBs increased by 12.0 per cent to N190.7 billion at
end-December 2011.Similarly, the paid-up capital and shareholders‘ funds
increased by 9.2 and 7.6 per cent to N45.4 billion and N47.3 billion, respectively.
The loans and advances, and deposits also increased by 27.9 and 13.6 per
cent, respectively. The development was attributed, largely, to the increased
confidence occasioned by the sustained sanitization of the sub-sector in 2011.
Investible funds available to the sub-sector was N21.6 billion, compared with
N22.1 billion in the preceding year. The funds were sourced mainly from
increased deposits (N10.3 billion), paid-up capital (N3.8 billion) and placements
from other institutions (N2.4 billion). The funds were used mainly to increase
loans and advances (N3.2 billion) and placement with other banks (N2.2
billion), among others.
4

Central Bank of Nigeria Annual Report—2011
99
4.3.2.1 Maturity Structure of Microfinance Banks’ (MFBs) Loans and Advances
and Deposit Liabilities
Short-term investments remained dominant in the microfinance banks (MFBs)
market in 2011, reflecting the structure of their deposits. Short-term loans, at
end-December 2011, accounted for 89.7 per cent of the total, up from 88.0 per
cent in the preceding year, while loans with maturity over 360 days accounted
for 10.3 per cent, down from the 12.0 per cent at end-December 2010. Similarly,
the short-term liabilities of these institutions remained dominant as deposits of
less than one year maturity accounted for 93.2 per cent, while deposits of
above one (1) year accounted for 6.8 per cent at end-December 2011, from
the respective levels of 92.3 and 7.7 per cent at end-December 2010.
Tenor/PeriodLoans and
AdvancesDeposits
Loans and
AdvancesDeposits
0-30 days 24.3 60.3 23.1 56.3
31-60 days 9.6 7.7 10.9 7.9
61-90 days 16.7 9.3 16.0 12.1
91-180 days 18.4 7.2 21.9 7.1
181 – 360 days 19.0 7.8 17.8 9.8
Short term 88.0 92.3 89.7 93.2
Above I80 days but below 1 year 19.0 7.8 17.8 9.8
Above 360 days 12.0 7.7 10.3 6.8
Total 100.0 100.0 100.0 100.0
Table 4.9: Maturity Structure of Assets and Liabilities of Microfinance Banks (MFBs) (Per cent)
2010 2011
Source: CBN
4.3.3 Discount Houses (DHs)
Total assets/liabilities of the discount houses declined by 1.5 per cent to N320.8
billion, compared with N362.4 billion in 2010. Total funds sourced amounted to
N102.3 billion, compared with N152.2 billion in the preceding year. The funds
were sourced mainly from claims on banks (N45.7 billion),claims on others
(N24.3 billion), and money-at-call (N15.9 billion). The funds were utilized mainly
for investment in Federal Government securities (N48.2 billion) and repayment
of borrowings (N45.0 billion), among others. Discount houses‘ investments in
4

Central Bank of Nigeria Annual Report—2011
100
Federal Government securities of less than 91-day maturity amounted to N62.2
billion, representing 33.0 per cent of their total current liabilities. This was 27.0
percentage points below the prescribed minimum of 60.0 per cent for fiscal
2011.
4.3.4 Finance Companies (FCs)
Aggregate assets/liabilities of the FCs increased by 3.4 per cent to N117.6 billion
at end-December 2011. Similarly, total paid-up capital and shareholders‘ funds
increased by 3.1 and 51.0 per cent toN20.1 billion and N15.4 billion,
respectively. Furthermore, loans and advances, fixed assets and investments
increased by 4.2, 6.6 and 1.8 per cent to N31.9 billion,N9.7 billion and N27.6
billion, respectively, at end-December 2011. Total borrowings, however,
declined by 3.0 per cent to N78.8 billion. Investible funds available to the sub-
sector were N6.9 billion, compared with N90.8 billion in the preceding year. The
funds were sourced mainly from accretion to reserves (N4.6 billion) and draw-
down on balances with banks (N0.7 billion), among others. The funds were used
mainly to increase cash and short-term funds (N1.9 billion) and loans/advances
(N1.3 billion).
4.3.5 Primary Mortgage Banks (PMBs)
Aggregate assets of the PMBs declined marginally by 0.5 per cent to N357.1
billion at end-December 2011.Similarly, loans and advances declined by 4.7 per
cent to N126.6 billion. Investments, other assets and fixed assets, however,
increased by 2.9, 15.5 and 24.0 per cent to N68.9 billion, N61.3 billion and N23.5
billion, respectively, at end-December 2011. Investible funds available to the
PMBs totalled N28.2 billion, compared with N30.1 billion in 2010. The funds were
sourced mainly from an increase in other liabilities (N6.7 billion) and recovery of
loans and advances (N6.3 billion), and were utilized mainly in the acquisition of
other assets (N8.2 billion), draw down on reserves (N7.2 billion) and increase of
fixed assets (N4.5 billion).
4

Central Bank of Nigeria Annual Report—2011
101
4.3.6 Bureaux-de-Change (BDCs)
A total of ninety-two (92) BDCs were granted approval during the review
period, thus bringing the total number of approved BDCs to 2,051 at end-
December 2011.
4.4 MONEY MARKET DEVELOPMENTS
Activities in the money market in 2011 were influenced mainly by the Bank‘s
tight monetary policy stance. In particular, the Bank‘s policy action of upward
adjustments of MPR during the year was aimed at proactively stemming
inflationary pressures anticipated from the April general election expenditure,
other fiscal injections, and the monetization of AMCON bonds, among others.
4.4.1 Inter-bank Funds Market
At the interbank funds market, the value of transactions increased by 124.5 per
cent to N43,855.8 billion in 2011. The development was attributed to the
monetary tightening action of the CBN. As a proportion of the total value of
transactions, the inter-bank call and the open-buy-back segments accounted
for 86.0 and 14.0 per cent, respectively, compared with 59.6 and 40.4 per cent
in 2010. The increase in the value of interbank call transactions was attributed
to the increase in borrowing by some market players who could not access the
CBN repo window for lack of government securities as collateral.
5,000
10,000
15,000
20,000
25,000
30,000
35,000
40,000
45,000
50,000
2007 2008 2009 2010 2011
N' B
illio
n
Figure 4.16: Value of Inter-bank Funds Market Transactions, 2007 - 2011
4

Central Bank of Nigeria Annual Report—2011
102
4.4.2 Money Market Assets Outstanding
The total value of money market assets outstanding, which stood at N4,447.3
billion at end-December 2010, grew by 24.7 per cent to N5,545.5 billion at end-
December 2011. The development was attributed to the increase in the value
of Nigerian Treasury Bills (NTBs), FGN Bonds issued to finance government fiscal
operations, and Commercial Papers (CPs).
Government securities, which comprised Nigerian treasury bills and FGN bonds
accounted for 95.0 per cent of the total value of the money market assets
outstanding at the end of the review year. Private sector-issued securities
accounted for the balance of 5.0 per cent. This development implied that
government remained the dominant player in the Nigerian money market. The
ratio of the value of money market assets to GDP declined marginally by 0.099
percentage points from the level at end-December 2010 to 15.2 per cent in
2011.
Asset Share in Total (%) in 2010 Share in Total (%) in 2011
Nigerian Treasury Bills 28.72 31.16
Development Stocks 0.005 0.00
Commercial Papers 4.25 3.66
Bankers’ Acceptances 1.78 1.32
FGN Bonds 65.24 63.86
Total 100.00 100.00
Table 4.10: Composition of Money Market Assets Outstanding in 2011
Source: CBN
0
500
1000
1500
2000
2500
3000
3500
4000
FGN Bonds CPs TBills
N' B
illio
n
Figure 4.17: Money Market Assets Outstanding
2007 2008 2009 2010 2011
4

Central Bank of Nigeria Annual Report—2011
103
4.4.2.1 Nigerian Treasury Bills (NTBs)
NTBs (91-, 182- and 364-day tenors) amounting to N3,048.49 billion, N6,512.7
billion and N3,048.5 billion respectively were offered, subscribed to, and
allotted in 2011. The amount allotted increased by 52.1 per cent over the
N2,004.0 billion allotted in 2010. The over-subscription was attributed to the
growing preference for risk-free government securities with their more attractive
yields, following the various upward reviews of the MPR.
Investors in NTBs by category, showed that DMBs took up N2, 001.2 billion (65.7
per cent), discount houses subscribed N344.9 billion (11.3 per cent), while
mandate and internal funds got N702.6 billion (23.0 per cent). The average
range of successful bid rates was between 5.56-16.99 per cent, compared with
the range of 1.04 and 10.3 per cent in the preceding year. Matured NTBs repaid
during the year amounted to N2,597.7 billion, compared with the N1,525.9
billion redeemed in 2010. Consequently, the value of NTBs outstanding at end-
December 2011 was N1, 727.9 billion, reflecting an increase of 35.3 per cent
over the preceding year‘s level.
0
1000
2000
3000
4000
2007 2008 2009 2010 2011
N' B
illio
n
Figure 4.18: NTB Issues, Subscriptions and Allotments, 2007 - 2011
Issues Subscriptions Allotments
4

Central Bank of Nigeria Annual Report—2011
104
CBN take-up 0%
DMBs 66%
Discount Houses 11%
Mandate & Internal A/C
23%
Figure 4.19: Nigerian Treasury Bills: Breakdown of Allotments in 2011 (per cent)
574.9 471.9
797.5
1,277.0
1,727.9
- 150.0 300.0 450.0 600.0 750.0 900.0
1,050.0 1,200.0 1,350.0 1,500.0 1,650.0 1,800.0
2007 2008 2009 2010 2011
N' B
illio
n
Figure 4.20: Treasury Bills Outstanding, 2007 - 2011
DMBs 84.4%
Non-bank Public 11.6%
CBN take up 4%
Figure 4.21: Nigerian Treasury Bills: Classes of Holders in 2011
4

Central Bank of Nigeria Annual Report—2011
105
2007 2008 2009 2010 2011
DMBs 587.3 383.7 838.8 1478.7 2,001.23
Mandate and Internal Fund 556.3 429.3 346.1 324.1 702.58
Discount Houses 135.5 69.1 71.1 201.2 344.68
MMD Take-up 2.4 23.4 5.0 0.0 0.0
CBN Take-up - 7.6 0.03 0.0 0.0
Total 1,281.50 913.1 1,261.00 2,004.00 3,048.49
Table 4.11: Allotment of NTBs (N’Billion), 2007 - 2011
Source: CBN
4.4.2.2 Commercial Papers (CPs)
The value of CPs held by DMBs increased by 7.3 per cent to N203.0 billion at
end-December 2011, as against the decline of 62.8 per cent at end-December
2010. Thus, CPs constituted 3.7 per cent of money market assets outstanding,
compared with 4.3 per cent at the end of the preceding year.
4.4.2.3 Bankers’ Acceptances (BAs)
Holdings of BAs by the DMBs declined by 7.3 per cent to N73.4 billion in 2011, as
against the increase of 27.2 per cent at end-December 2010. Consequently,
BAs accounted for 1.3 per cent of money market assets outstanding, down
from 1.8 per cent at end-December 2010. The development reflected the
decline in investors‘ preference for BAs.
4.4.2.4 Federal Republic of Nigeria Development Stocks (FRNDS)
There was no issue of FRNDS during the year. The outstanding FRN Development
Stocks which stood at N0.2 billion in 2010 were redeemed in 2011.
4.4.2.5 FGN Bonds
In the year under review, there was one issue, and the reopening of the 4th, 5th,
6th and 7th FGN-Bond series. As a result, FGN bonds outstanding at the end of
the year was N3,541.2 billion, compared with N2,901.6 billion at the end of the
preceding year, representing an increase of N639.6 billion (22.0 per cent). The
high patronage of FGN Bonds was attributed to the high level of liquidity in the
banking system, the investors‘ preference for long-term instruments, and the
4

Central Bank of Nigeria Annual Report—2011
106
attractive coupon yield on the bonds. Of the total outstanding bonds, 0.02,
1.75, 12.17, 19.92 and 23.58 per cent respectively, were for the 1st, 3rd, 4th, 5th
and 6th FGN Bonds, while the balance of 42.6 per cent was for the 7th FGN
Bond.
The structure of holdings of FGN Bonds showed that 60.2 per cent was held by
DMBs and discount houses, the non-bank public held 37.6 per cent, and the
Central Bank of Nigeria, 2.0 per cent.
In order to strengthen the banking sector, AMCON Bonds were issued in
exchange for the acquired non-performing facilities of banks and for the
recapitalization of intervened/nationalized banks. The first tranche of bonds
issued by AMCON was redeemed for cash at the CBN, while the
recapitalization bonds were used to access CBN‘s standing facility window. The
3rd 1.76%
5th 19.91%
6th 23.58%
1st 0.02%
4th 12.17%
7th 42.56%
Figure 4.22: Outstanding FGN Bonds
DMBs and Discount Houses 60.21%
Non-bank 37.75%
CBN 2.04%
Figure 4.23: FGN Bonds by Holders
4

Central Bank of Nigeria Annual Report—2011
107
nationalized/intervened banks were the majority holders of these bonds and
therefore experienced greater liquidity challenges. In order to improve liquidity
in the system, the CBN purchased the sum of N3,206.8 billion worth of AMCON
bonds of different maturities from the affected banks.
4.4.3 Open Market Operations (OMOs)
In line with the restrictive monetary policy stance occasioned by the need to
curtail inflation OMO, auctions were conducted throughout the year to mop-
up excess liquidity in the banking system. The highest level of OMO sales was in
October 2011 when there was need to mop-up the huge inflow of funds into
the banking system, following the purchase of AMCON Bonds from DMBs. The
two-way quote trading and repurchase transactions complemented OMOs.
4.4.4 OMO Auctions
OMO auctions were conducted throughout the year, except in February 2011.
CBN bills worth N643.6 billion were sold in October, of which N552.0 billion were
AMCON Bonds. CBN bills worth N2,362.1 billion of various tenors, ranging from 6
to 359 days were sold in 2011, compared with N270.6 billion sold in 2010. The
total CBN bills offered and subscribed to was N933.4 billion and N4,362.3 billion,
respectively, in 2011, with bid rates ranging from 14.5 to 19.6 per cent. The stop
rates at the auctions ranged from 6.6 to 18.1 per cent, for the various maturities
offered. CBN bills valued at N861.8 billion matured and were repaid during the
year, with an outstanding amount of N1,500.7 billion at end–December 2011.
0
1000
2000
3000
4000
5000
2007 2008 2009 2010 2011
Bill
ion
Nai
ra
Figure 4.24: OMO Issues and Sales, 2007 - 2011
Bids Sales
4

Central Bank of Nigeria Annual Report—2011
108
4.4.5 The Two–way Quote Trading in NTBs
NTBs of maturities ranging from 15 to 22 days were traded on the two-way
quote trading platform in 2011. The bid rates ranged from 7.3 to 9.5 per cent,
while the offer rates ranged from 6.6 to 9.0 per cent. Bills worth N1.0 billion were
bought at 9.0 per cent, while sales totalled was N0.3 billion at the deal rate of
7.3 per cent in the only trade held in the year. There was a sharp decline when
compared with the bills issued and total sales of N52.0 billion and N26.0 billion,
respectively, in 2010.
4.4.6 Discount Window Operations
4.4.4.1 CBN Standing Facilities
The CBN standing facilities were accessed by DMBs and discount houses
throughout the year in order to enable them meet their short-term liquidity
needs and invest their surpluses. The applicable rates remained within the
corridor around the MPR of +/- 200 basis points for the standing lending facility
(SLF) and standing deposit facility (SDF), respectively, throughout the year
under review.
4.4.4.1.1 Standing Deposit Facilities (SDFs)
Patronage of the standing deposit facilities by DMBs and DHs significantly
declined in 2011 due, largely, to the effects of the Bank‘s monetary tightening
stance and the fact that SDFs were suspended between March 9 and October
10, 2011 when the reserve averaging scheme was operational. The average
daily deposit stood at N173.0 billion, compared with N212.3 billion in 2010.
Interest paid on the deposit also increased significantly to N703.7 million, from
N12.5 million in 2010. The SDF rate, which was increased to 4.3 per cent in
January, rose further to 10.0 per cent in October, in line with adjustment in MPR.
4.4.4.1.2 Standing Lending Facilities (SLFs)
The average daily request for SLFs in 2011 was N42.6 billion, compared with
N41.0 billion in 2010. The lending facility rate was maintained at 200 basis points
4

Central Bank of Nigeria Annual Report—2011
109
above the Monetary Policy Rate and, therefore, rose from 8.3 per cent at end-
January to 14.0 per cent at end-December 2011.
4.4.4.2 Over-the-Counter Transactions (OTCs)
NTBs worth N11,159.4 billion were traded in 44,360 deals at the secondary
market in 2011, compared with N8,652.2 billion in 34,542 deals in the preceding
year. This represented an increase of 29.0 and 28.4 per cent in value and
volume, respectively.
4.4.4.3 Over-the-Counter Transactions (OTCs) in FGN Bonds
In 2011, FGN Bonds worth N8,947.6 billion were traded in 65,319 deals at the
secondary market, compared with N18,962.7 billion in 197,406 deals in the
preceding year. This represented a decrease of 52.8 and 66.9 per cent in value
and volume, respectively, owing to the decline in trading by the Primary
Dealers and Market Makers (PDMMs).
4.4.4.4 Foreign Investment
During the year under review, N260.1 billion and N337.0 billion, respectively,
were invested in NTBs and FGN Bonds, as against N132.5 billion and N109.6
billion respectively invested in 2010. The renewed interest by foreigners
reflected the significant recovery in the global economy from the effects of the
global economic and financial crisis and the search for investment
opportunities in emerging and developing economies.
4.4.4.5 CBN Promissory Notes
One–year tenored promissory notes worth N371.6 billion were issued to two
DMBs, following the purchase and assumption arrangement of four liquidated
banks. The interest rates ranged from 3.9 to 11.0 per cent. The sum of N116.1
million was redeemed.
4

Central Bank of Nigeria Annual Report—2011
110
4.4.4.6 CBN Guarantees
The Bank sustained the guarantee of interbank transactions, foreign credit lines
and pension funds placements with deposit money banks in 2011. The
guarantee that was expected to terminate on June 30, 2011 was extended for
the intervened banks till December 2011, following the successful signing of
Transaction Implementation Agreements (TIAs) with respective investors and
the subsequent mergers and acquisitions.
Outstanding interbank guarantees at end-December, 2011 were N275.2 billion,
compared with N904.6 billion in the corresponding period of 2010.
4.4.4.7 Repurchase Transactions (Repo)
The repo market remained active throughout the year, but the total request for
repo transactions increased significantly from June till the end of the year, as a
result of the liquidity condition in the banking system. Total value of transactions
stood at N3, 279.6 billion in 2011, at rates ranging from 9.3 to 15.0 per cent,
compared with the total request of N470.2 billion in 2010 at rates ranging from
9.3 to 10.8 per cent.
4.4.4.8 Open-Buy-Back (OBB) Transactions
The total value of transactions at the OBB stood at N22,353.0 billion in 2011,
reflecting an increase of 18.6 per cent above the N18,845.0 billion recorded in
2010. The development was attributed to tight liquidity in the banking system.
4.5 CAPITAL MARKET DEVELOPMENTS
4.5.1 Developments in the Nigerian Capital Market in 2011
The Board of the Securities and Exchange Commission (SEC) approved a new
Code of Corporate Governance for public companies, under its regulatory
purview in order to entrench transparency and accountability in the Nigerian
capital market. The new Code, which came into effect on April 1, 2011,
outlined the responsibilities and duties of the Board, including the mode of
4

Central Bank of Nigeria Annual Report—2011
111
appointment, structure, remuneration and
board composition of public companies. It
further stated the standard requirements on
matters relating to reporting format, protection
of shareholders‘ rights, risk management,
insider trading, whistle blowing policy,
accountability, communication policy, code of ethics and resolutions, among
others. As part of measures to instill discipline in the Exchange, the NSE directed
stock broking firms to separate their accounts from clients‘ accounts.
The Council of the Nigerian Stock Exchange (NSE) restructured its operations
during the review year. Consequently, the directorate of strategy and business
development was divided into two separate units. The business development
arm was merged with the listings department, while the strategy unit formed
part of the Office of the Chief Executive of the Exchange. A new Director
General was appointed for the Nigerian Stock Exchange.
In order to stem the persistent tide of losses at the capital market and attract
foreign and local institutional investors, the NSE launched investor clinics across
the country. Under the aegis of the investor clinic, the Exchange collaborated
with brokers and dealers to provide investment information and education to
investors, particularly on portfolio management.
The NSE also launched two new products to address the problems of low
investor confidence and illiquidity in the market. These were:
The Sim Capital Alliance Value Fund listed on July 28, 2011 to give
investors the opportunity to own shares in a scheme that invests in
equities and non-equities, providing access to a ―packaged‖ investment
product that is traded on the Exchange; and
The ABSA New Gold Exchange Traded Fund (ETF) launched on
December 19, 2011. The Fund provides investors direct access to an
4
The Board of the Securities and Exchange Commission (SEC) approved a new Code of Corporate Governance for public companies, under its regulatory purview, in order to entrench transparency and accountability in
the Nigerian capital market.

Central Bank of Nigeria Annual Report—2011
112
efficient and cost-effective investment in gold and currency hedging.
As part of efforts aimed at internationalising its operations, the NSE consolidated
its thirty-three (33) industry sectors into twelve (12) that better reflect the
structure of the Nigerian economy and streamlined it with international
industrial classifications. Consequently, all listed companies on the Exchange
were reclassified into the new sectors, thereby reducing restrictions that
previously deterred prospective issuers. Furthermore, the number of trading
hours on the stock exchange was increased from five (5) to seven (7) hours
daily to accommodate more trading activities, as well as allow more foreign
investors to participate.
In order to improve its communication with the investing public and other
stakeholders, the NSE, on March 12, 2011, commissioned a Contact Centre
where stakeholders could make enquiries on issues concerning the stock
market. The Centre opens for 12 hours, and enquiries and complaints could be
made in the country‘s three major languages and in ―pidgin‖ English.
Furthermore, Nigeria‘s first Sovereign Eurobond, worth US$500.0 million, was
admitted for trading on the London Stock Exchange. On cross-border listing, the
SEC commenced collaboration with regulators in the West African sub-region
to facilitate the formation of a single stock exchange in order to address the
challenges of cross-border listings on exchanges within the sub- region.
In addition, nine (9) companies, which comprised three (3) dormant companies
that had applied for voluntary delisting and six (6) deposit money banks that
had either nationalized or restructured, were delisted from the NSE Daily Official
list at end-December 2011.
Other developments in the market during the year included: the introduction of
market making, company share buy-back, securities lending, revision of listing
requirements, and short-selling activities.
4

Central Bank of Nigeria Annual Report—2011
113
4.5.2 The Nigerian Stock Exchange (NSE)
Activities on the floor of the NSE in 2011 indicated mixed developments.
Aggregate volume and value of traded securities declined by 11.8 and 21.9
per cent, respectively, while the aggregate market capitalization of the 250
listed securities rose by 3.6 per cent to close at N10.3 trillion, from N9.9 trillion at
end-December 2010. The increase in total market capitalization was attributed
to the introduction of Exchange Traded Funds (ETF) and increases in state and
corporate bonds issues. The market capitalization of the 201 listed equities
declined by 17.7 per cent to close at N6.5 trillion, from N7.9 trillion at end-
December 2011 and constituted 63.1 per cent of the total market
capitalization. The development was due, largely, to the delisting of the three
nationalized banks, price depreciation recorded by the blue-chip companies,
and equity exposure cuts by funds and asset managers to cover positions in the
US and Euro Zone. The debt securities component, consisting of twenty-five (25)
Federal Government Bonds (N2.1 trillion), eleven (11) Sub-National Bonds (N0.3
trillion), and twelve (12) Corporate Bonds/Debenture (N1.4 trillion) accounted
for the balance. The top twenty (20) most capitalized stocks had a market
capitalization of N5.4 trillion, representing 52.4 and 83.1 per cent of the
aggregate market capitalization and equities market capitalization,
respectively.
Aggregate market capitalization as a percentage of GDP was 28.1 per cent,
compared with 33.6 per cent in 2010.The ratio of the value of stocks traded to
GDP stood at 1.7 per cent, compared with 0.3 per cent in 2010, while the
turnover value as a percentage of market capitalization was 6.1 per cent,
compared with 8.0 per cent in 2010.The annual turnover value (measured as
the ratio of the total value of stocks traded to the total value of stocks listed on
the NSE) fell by 21.9 per cent, as against the increase of 16.3 per cent in 2010.
4

Central Bank of Nigeria Annual Report—2011
114
0
10
20
30
40
50
60
70
0.0
2.0
4.0
6.0
8.0
10.0
12.0
14.0
2006 2007 2008 2009 2010 2011
Ind
ex (
'000
)
Tri
llio
n N
aira
Figure 4.25: Trends in Market Capitalization and NSE Value Index, 2006 - 2011
Market Capitalization (left axis) Banking Sector Market Capitalization
Index (right axis)
Equities, 6.5 FederalGovernment Bonds,
2.1
Sub-National bonds, 0.3
Corporate Bonds , 1.4
Figure 4.26: Aggregate Market Capitalization
4

Central Bank of Nigeria Annual Report—2011
115
2007 2008 2009 2010 2011
Number of Listed Securities 309 299 266 264 250
Volume of Stocks Traded (Turnover Volume) (Billion) 138.1 193.1 102.9 93.3 82.3
Value of Stocks Traded (Turnover Value) (Billion Naira) 2100.0 2400.0 685.7 797.6 622.6
Value of Stocks/GDP (%) 8.9 10.0 10.0 0.3 1.7
Total Market Capitalization (Billion Naira) 13294.6 9,535.80 7,032.10 9,918.20 10,282.20
Of which: Banking Sector (Billion Naira) 6432.2 3715.5 2238.1 2710.2 1839.3
Total Market Capitalization/GDP (%) 56.0 39.7 28.5 33.6 28.1
Of which: Banking Sector/GDP (%) 27.1 15.5 9.1 9.2 5.0
Banking Sec. Cap./Market Cap. (%) 41.8 39.0 31.8 27.3 17.5
Annual Turnover Volume/Value of Stock (%) 6.6 8.0 15.0 15.0 13.2
Annual Turnover Value/ Total Market Capitalization (%) 15.8 25.2 9.8 8.0 6.1
NSE Value Index (1984=100) 57,990.22 31,450.78 20,827.17 24,770.50 20,730.63
Growth (In percent)
Number of Listed Securities 7.6 -2.6 -11.0 -0.8 -5.3
Volume of Stocks 278.4 39.8 -46.9 -9.3 -3.2
Value of Stocks 346.5 14.3 -71.4 16.3 -20.1
Total Market Capitalisation 159.6 -27.8 -26.3 41.0 4.0
Of which: Banking Sector 200.2 -42.2 -39.8 21.1 -32.1
Annual Turnover Value 346.5 14.3 -71.4 16.3 -21.9
NSE Value Index 74.7 -45.8 -33.8 18.9 -17
Share of Banks in the 20 Most Capitalized Stocks in the NSE (%) 65.0 70.0 59.0 80.0 40.0
Table 4.12: Indicators of Capital Market Developments in the Nigerian Stock Exchange (NSE), 2007 - 2011
Source: Securities and Exchange Commission
4.5.2.1 The Secondary Market
The secondary market segment of the NSE was bearish in 2011. The cumulative
volume and value of shares traded stood at 82.3 billion shares and N622.6
billion, respectively, in 1,235,467 deals, compared
with 93.3 billion shares and N797.6 billion in
1,925,375 deals at end-December 2010. On an
average daily activity, the Exchange recorded
334.6 million shares valued at N2.5 billion, compared with 377.9 million shares
valued at N3.2 billion in 2010. In terms of volume, value and number of deals,
the equities segment maintained its dominance of trading activities in the stock
market as it accounted for 99.99, 79.10 and 99.98 per cent, respectively. The
banking sub-sector accounted for 58.3 and 60.9 per cent of the total volume
and value of transactions, respectively. The insurance sub-sector accounted for
The secondary market segment of the NSE was bearish in 2011.
4

Central Bank of Nigeria Annual Report—2011
116
19.1 and 3.2 per cent of the total volume and value of transactions,
respectively. The Industrial loan and preference stock sub-sectors remained
inactive in the review period. The top twenty (20) listed companies, by turnover
volume, constituted 72.7 per cent of the total volume of transactions, while the
financial services sector contributed 83.9 per cent. Similarly, the top twenty (20)
listed companies, by turnover value, constituted 85.0 per cent of the total. The
financial services sector constituted 58.0 per cent of this. Further analysis
showed that of the top twenty (20) listed companies, the banking sub-sector
accounted for eight (8) and constituted 40.0 per cent of the total.
4.5.2.2 The NSE Value Index
The Nigerian Stock Exchange (NSE) All-Share Index declined by 16.3 per cent to
close at 20,730.63, compared with 24,770.52 in the preceding year. The
development reflected the fall in share prices of most of the listed stocks on the
NSE.
The NSE-30 fell by 14.9 per cent to close at its year-end level of 923.77,
compared with 1,081.95 at end-December 2010. Similarly, the four sectoral
indices, namely, the NSE Food/Beverage, the NSE Banking, the NSE Oil/Gas and
the NSE Insurance fell significantly by 26.7, 34.7, 42.0 and 14.7 per cent
respectively to close at 589.60, 274.26, 220.11 and 143.54.
0
20
40
60
80
2007 2008 2009 2010 2011
65 70
59
80
40
Per
cen
t
Figure 4.27: Share of Banks in the 20 Most Capitalized Stocks in the NSE, 2007 - 2011
4

Central Bank of Nigeria Annual Report—2011
117
4.5.2.3 The New Issues Market
The primary segment of the market recorded increased activity, as reflected in
the rise in the number of applications received and issues offered for public
subscription. The development reflected a gradual restoration of confidence in
the market with investors making recourse to
the stock market. The NSE approved thirty-four
(34) applications valued at N2.2 trillion,
compared with thirty-one (31) applications
valued at N2.44 trillion in 2010. All the issues
were fully subscribed. The non-bank corporate
sub-sector accounted for 64.8 per cent of the total new issues approved, with
twenty-two (22) applications valued at N1,972.3 billion, while the banking sub-
sector accounted for 17.6 per cent, with six (6) applications valued at N103.1
billion. Similarly, the NSE received six (6) applications (17.6 per cent of the total)
for state governments bond issues valued at N149.8 billion.
Further analysis of the approved new issues showed that the sum of N304.7
billion was raised through rights issue; N22.3 billion, preference shares; N1,890.0
billion, bonds issue (including six State Government bonds); listing by
introduction, N2.2 billion; share placements, N5.0 billion; and others accounted
for the balance.
The primary segment of the market recorded increased activity reflected in the rise in the number of applications received and issues
offered for public subscription.
4

Central Bank of Nigeria Annual Report—2011
118
Figure 4.29 New Issues by Type
Banking
Sector
5.2%
Non-bank 87.3%
State Govt. Bonds 7.5%
Figure 4.28: New Issues by Sector
0% IPO
Mergers/Acquisitions 86.2%
Right Issues 1.9%
Bonds 7.2%
Others 4.6%
Figure 4.28: New Issues by Type
Rights Issue 14%
Introduction 0%
Placement 0%
Bonds 85%
Preference Share 1%
ETF 0%
4

Central Bank of Nigeria Annual Report—2011
119
igeria‟s fiscal policy thrust in 2011 was to ensure fiscal consolidation, improve physical
infrastructure, boost employment generation, and foster inclusive economic growth. At
N11,116.9 billion or 31.4 per cent of GDP, the Federation Account revenue (gross)
increased by 52.2 per cent above the level in 2010. The development was attributed to
enhanced receipts from oil and non-oil revenue sources. The sum of N6,158.3 billion was
transferred to the Federation Account, reflecting an increase of 28.7 per cent above the level
in the preceding year.
Favourable oil prices in the international market and enhanced production resulted in a
substantial accretion to the excess crude account savings, from US$2.2 billion at end-2010 to
US$5.2 billion at end-2011.
At N3,553.5 billion and N4,712.1 billion, Federal Government-retained revenue and aggregate
expenditure grew by 15.0 per cent and 12.3 per cent respectively, above their levels in 2010.
The fiscal operations of the Federal Government resulted in an overall deficit of N1,158.5 billion,
or 3.3 per cent of GDP. Provisional data on state government finances indicated an overall
deficit of N131.9 billion, while that of the local governments revealed a surplus of N2.6 billion.
Consequently, general government‟s consolidated expenditure was N9,774.3 billion, or 27.6 per
cent of GDP, while aggregate revenue was N8,486.5 billion. This resulted in an overall deficit of
N1,287.8 billion or 3.6 per cent of GDP, and financed largely from the domestic financial
market.
Federal Government consolidated debt stock was N6,519.6 billion, or 18.4 per cent of GDP, at
end-2011, compared with N5,241.7 billion, or 17.8 per cent of GDP, at end-2010. External debt
stock rose by US$1.1 billion to US$5.7 billion, following additional disbursement of concessional
loans by the multilateral institutions and other non-Paris bilateral and commercial debts.
Domestic debt grew by 23.5 per cent to N5,622.8 billion as a result of borrowing to finance
critical infrastructure by the Federal government. Overall, in consonance with the fiscal
consolidation strategy of the Federal Government, the rate of debt accumulation moderated
to 24.4 per cent in 2011, from 37.3 per cent in 2010.
5.1 THE FISCAL POLICY THRUST
The main thrust of fiscal policy in the 2011 Budget was to ensure fiscal
consolidation, improve physical infrastructure, boost employment generation,
and foster inclusive economic growth. The 2011 Budget, the first in the 2011 –
2013 Medium Term Fiscal Framework (MTFF), was set within the First National
Implementation Plan (FNIP) of Vision 20:2020.The budget encapsulated policies
that would attract foreign investment and facilitate private sector growth as
N
The fiscal policy thrust for 2011 Budget was designed to ensure fiscal consolidation, foster inclusive economic growth, improve physical infrastructure and boost employment generation.
CHAPTER FIVE
FISCAL POLICY AND GOVERNMENT
FINANCE

Central Bank of Nigeria Annual Report—2011
120
catalysts for greater wealth creation, employment generation and rapid
economic growth. Therefore, consistent with the 2011-2013 MTFF and the FNIP
of the Vision 20:2020, the 2011 Budget was underpinned by four pillars drawn
from Nigeria‟s Economic Growth Strategy. These were:
Fostering inclusive growth and job creation;
Optimizing capital spending by rationalizing recurrent expenditure and
maximizing government revenue;
Accelerating the implementation of reforms to enhance the quality and
efficiency of public expenditure; and,
Ensuring greater prudence in the management of the nation‘s financial
resources.
Other ancillary targets included accelerating implementation of the Public
Private Partnership (PPP) policy, through the creation of a Viability Gap Fund, to
encourage private sector participation and enhance private sector investment
in critical infrastructure.
5.2 FEDERATION ACCOUNT OPERATIONS
5.2.1 Federally-collected Revenue
Total federally-collected revenue rose by 52.2 per cent to N11,116.9 billion in
2011 and constituted 31.4 per cent of GDP. The development was attributed to
enhanced receipts from both oil and non-oil revenue sources.
21.3
26.5
12.7
18.3
25.1
6.0 5.4 6.6 6.5 6.3
-
5.0
10.0
15.0
20.0
25.0
30.0
2007 2008 2009 2010 2011
per
cen
t
Figure 5.1: Oil and Non-oil Revenue (per cent of GDP), 2007 - 2011
Oil Revenue Non-oil Revenue
5

Central Bank of Nigeria Annual Report—2011
121
Of the total receipts, oil revenue (gross) accounted for N8,879.0 billion
representing 79.9 per cent of the total(25.1 per cent of GDP), indicating an
increase of 64.5 per cent above the level in 2010. A breakdown showed that
revenue from crude oil and gas exports grew significantly by 34.9 per cent to
N2,287.9 billion. In the same vein, receipts
from petroleum profit tax (PPT) and royalties
increased by 104.5 per cent to N3,976.3
billion, while revenue from domestic crude oil
sales rose by 49.4 per cent to N2,608.8 billion.
The development reflected improved crude oil production, occasioned by the
relative peace in the Niger Delta region, as a result of the amnesty programme
of the Federal Government, and increased export receipts, driven by sustained
demand and favourable prices in the international market. The sum of N1,008.8
billion was deducted from the gross oil receipts for the Joint Venture Cash (JVC)
calls, N3,854.8 billion in respect of excess crude/PPT/royalty proceeds and
―others‖, leaving a balance of N4,015.4 billion for distribution to the three tiers of
government.
Gross revenue from non-oil sources increased by 17.3 per cent to N2,237.9
billion representing 20.1 per cent of the total or 6.3 per cent of GDP. A
breakdown indicated that Value Added Tax (VAT) rose by 15.4 per cent to
N649.5 billion, while corporate tax (CT) and customs/excise duties rose by 6.6
4,4
62
.9
6,5
30
.6
3,1
91
.9
5,3
96
.1
8,8
79
.0
1,264.6 1,336.0 1,652.7
1,907.6 2,237.9
0%
10%
20%
30%
40%
50%
60%
70%
80%
90%
100%
2007 2008 2009 2010 2011
Figure 5.2: Federation Account: Composition of Revenue (Naira Billion), 2007 - 2011
Oil Revenue Non-Oil Revenue
5
Total federally-collected revenue increased by 52.2 per cent to N11,116.8 billion in 2011, and
constituted 31.4 per cent of GDP.

Central Bank of Nigeria Annual Report—2011
122
and 41.8 per cent, to N700.5 billion and N438.3 billion, respectively. The
Independent Revenue of the Federal Government and custom levies also grew
by 18.8 and 51.6 per cent, to N182.5 billion and N156.8 billion, respectively. The
rise in most of the components of the non-oil revenue reflected improved
economic activities, particularly in the second half of the year, resulting in
enhanced collection by the revenue-collecting agencies.
`
The sum of N94.9 billion was deducted from the non-oil revenue as cost of
collection, leaving a distributable balance of N2,142.9 billion.
5.2.2 Federation Account Distribution
The sum of N6,158.4 billion accrued to the Federation Account, indicating an
increase of 28.7 per cent over the level in 2010. Of this amount, N623.5 billion,
N182.5 billion and N267.1 billion were transferred to the VAT Pool Account, the
FG Independent Revenue, and ‗other transfers‘1, respectively, leaving a net
revenue of N5,085.3 billion. In addition, N450.0 billion, N873.6 billion, N502.4
billion and N30.5 billion were drawn from the excess crude account for excess
crude revenue-sharing, share of the difference between provisional and actual
budget, budget augmentation, and NNPC refunds to state and local
governments, respectively. These amounts were added to the federally-
collected revenue (net) to boost the distributable total to N6,941.8 billion.
1This includes the Education Tax, Customs Levies, and the National Information Technology Development Fund.
CT 31.3%
Customs & Excise 19.6%
VAT 29.0%
FG Indep. Rev. 8.2%
Education Tax 4.5%
Customs Levies 7.0% NITDF
0.4%
Figure 5.3: Composition of Non-oil Revenue in 2011
5

Central Bank of Nigeria Annual Report—2011
123
Analysis of the distribution among the three tiers of government2, showed that
the Federal Government (including Special Funds) received the sum of N3,240.8
billion, state governments N1,658.8 billion, and local governments N1,278.8
billion, while the sum of N763.4 billion was shared among the oil-producing
states as 13% Derivation Fund.
5.2.3 VAT Pool Account Distribution
The sum of N623.5 billion was transferred to the VAT Pool Account, representing
an increase of 15.4 per cent over the level in 2010. Analysis of the distribution
among the three tiers of government3 showed that the Federal Government
(including the FCT) received N93.5 billion, while state and local governments
shared N311.8 billion and N218.2 billion, respectively.
5.3 GENERAL GOVERNMENT FINANCES
5.3.1 Aggregate Revenue
Provisional data showed that at N8,486.5 billion, the aggregate revenue of the
three tiers of government in 2011 comprised N5,085.3 billion from the Federation
Account, N1,376.1 billion, the budget augmentation (including share of the
difference between budget and actual federation revenue), N450.0 billion
from excess crude revenue-sharing, N30.5 billion as NNPC refunds to states and
local governments, and N623.5 billion from VAT. Others were N182.5 billion from
the Federal Government Independent Revenue, and N36.6 billion from ‗other
funds‘4. Revenue exclusive to the sub-national (state and local) governments
included N536.6 billion, N132.8 billion and N32.5 billion respectively from
internally-generated revenue, grants and the stabilisation fund.
2The Federation Account revenue sharing formula is as follows: FG (52.68%), SGs (26.72%) and LGs (20.60%), while 13.0%
of net oil revenue is shared among oil-producing states. 3 The VAT Pool Account revenue sharing formula is as follows: FG (15%), SGs (50%) and LGs (35%). 4This constitutes unspent balances from the Federal Government budget and other receipts by state and local governments not classified
elsewhere.
5

Central Bank of Nigeria Annual Report—2011
124
F G's Share F C T Sub-T o tal States 13% Sub-T o tal
Share from Federation Account 2,359.0 44.9 2,403.9 1,219.3 522.0 1,741.3 940.0 5,085.3
Augmentation 1/ 618.7 12.0 630.7 319.9 178.9 498.8 246.6 1,376.1
Share from Excess Crude 202.3 3.9 206.2 104.6 58.5 163.1 80.6 450.0
NNPC Refunds - - - 15.0 4.0 18.9 11.5 30.5
Share of VAT 87.3 6.2 93.5 311.8 - 311.8 218.2 623.5
FG Independent Rev enue 182.5 - 182.5 - - - - 182.5
Internally-Generated Rev enue 509.3 509.3 27.3 536.6
Less State Allocat ion to LG 14.0 14.0 14.0
Net Internally-Generated Rev enue 495.3 495.3 27.3 522.6
Grants and Others 88.7 88.7 44.1 132.8
Stabilization Fund 11.2 11.2 21.3 32.5
State Allocation to LG 14.0 14.0
Others 36.6 36.6 36.6
TOTAL 3,486.5 67.0 3,553.5 2,565.7 763.4 3,329.1 1,603.8 8,486.5
1/ Includes share of difference between prov isional distribution and actual budget
Table 5.1: SOURCES OF FUNDS FOR THE THREE TIERS OF GOVERNMENT IN 2011 (Naira Billion)
SOURCE
Federal Government State Governments Local
Governments Grand Total
Source: Federal Ministry of Finance
Office of the Accountant-General of the Federation
Fiscal returns from state and local governments Survey
5.3.2 Aggregate Expenditure
At N9,774.3 billion, the aggregate
expenditure of general government
increased by 11.2 per cent from the level in
2010. As a proportion of GDP, it represented
27.6 per cent, compared with 29.8 per cent in 2010. A breakdown showed that
the outlay on recurrent activities at N6,011.9 billion (17.0 % of GDP), accounted
for 61.5 per cent, and capital expenditure at N2,715.5 billion (7.7 % of GDP),
represented 27.8 per cent. Transfers and ‗others‘ at N935.9 billion (2.6 % of GDP)
and N111.0 billion (0.3% of GDP), respectively, accounted for 9.6 and 1.1 per
cent of the total.
At N9,774.3 billion, the aggregate expenditure of general government rose by 11.2 per cent
from the level in 2010.
5

Central Bank of Nigeria Annual Report—2011
125
5.3.3 Consolidated Fiscal Balance and Financing
The fiscal operations of general government resulted in a primary deficit of
N528.4 billion (1.5 % of GDP), and an overall deficit of N1,287.8 billion (3.6 % of
GDP), compared with N1,206.9 billion (4.1 % of GDP) in 2010. The deficit was
financed, largely, with borrowing from the non-bank public and the domestic
banking system.
5.4 FEDERAL GOVERNMENT FINANCES
5.4.1 Overall Fiscal Balance and Financing
The current balance in 2011 reflected a surplus of N239.0 billion, or 0.7 per cent
of GDP, compared with a deficit of N20.2 billion, or 0.1 per cent of GDP in the
preceding year. The primary balance recorded a deficit of N631.3 billion, or 1.8
per cent of GDP, relative to N689.8 billion or
2.3 per cent of GDP in 2010. The overall fiscal
operations of the Federal Government
resulted in a deficit of N1,158.5 billion, or 3.3
per cent of GDP, compared with the deficit
of N1,105.4 billion, or 3.7 per cent of GDP, in 2010. The deficit was within the
WAMZ primary convergence criterion target of 4.0 per cent, and outperformed
the position in the preceding two fiscal years. The overall budget deficit was
financed mainly from domestic sources.
Recurrent 61.5%
Capital 27.8%
Transfers 9.6%
Others 1.1%
Figure 5.4: Composition of General Government Expenditure in 2011
The overall fiscal operations of the Federal Government resulted in a notional deficit of N1,158.5 billion, or 3.3 per cent of GDP, compared with the deficit of N1,105.4 billion, or
3.7 per cent of GDP, recorded in 2010.
5

Central Bank of Nigeria Annual Report—2011
126
5.4.2 Federal Government-retained Revenue
The Federal Government-Retained revenue rose to N3,553.5 billion, from
N3,089.2 billion in 2010. Analysis of the revenue showed that the share of the
Federation Account was N2,403.9 billion, or
67.7 per cent of the total; the VAT Pool
Account amounted to N93.5 billion (2.6%);
the Federal Government Independent
Revenue was N182.5 billion (5.1%); the excess crude (including augmentation)
accounted for N836.9 billion (23.6%), while ‗others‘ accounted for the balance
of N36.7 billion (1.0%).
-0.6
-0.2
-3.2
-3.7 -3.3
-4.00
-3.50
-3.00
-2.50
-2.00
-1.50
-1.00
-0.50
-
2007 2008 2009 2010 2011
Figure 5.5: FG Fiscal Deficit (per cent of GDP)
Federation Account 67.7%
VAT Pool Account
2.6%
Independent Revenue
5.1%
Excess Crude 23.6%
Others 1.0%
Figure 5.6: Composition of Federal Government-retained Revenue in 2011
The Federal Government retained revenue increased to N3,553.5 billion, from N3,089.2
billion in FY2010.
5

Central Bank of Nigeria Annual Report—2011
127
5.4.3 Total Expenditure of the Federal Government
The estimated aggregate expenditure of the Federal Government grew in
absolute terms by 12.3 per cent to N4,712.1 billion in 2011. As a proportion of
GDP, it contracted slightly to 13.3 per cent,
from 14.2 per cent in the preceding fiscal year.
The non-debt expenditure increased from the
level in 2010 by 10.7 per cent. Total debt
service payments amounted to N527.2 billion, representing 11.2 per cent of the
total expenditure, or 1.5 per cent of GDP.
5.4.3.1 Recurrent Expenditure
At N3,314.5 billion, recurrent expenditure expanded in absolute terms by 6.6 per
cent over the level in 2010 and accounted for 70.3 per cent of the total
expenditure. However, as a percentage of GDP, it shrank to 9.4 per cent, from
-
5.0
10.0
15.0
2007 2008 2009 2010 2011
11.1
12.9
10.5 10.5 10.0
7.6 8.6 8.4
10.5
9.4
3.6 3.9 4.6 3.0 2.6
Figure 5.7: Federal Government Revenue and Expenditure (per cent of GDP)
Retained Revenue Recurrent Expenditure Capital Expenditure
Recurrent Expenditure
70.3%
Capital Expenditure
& Net Lending 19.5%
Transfers 10.2%
Figure 5.8: Composition of Federal Government Expenditure in 2011
Aggregate expenditure of the Federal Government increased in absolute terms by 12.3 per cent to N4, 712.1billion in 2011.
5

Central Bank of Nigeria Annual Report—2011
128
10.5 per cent in 2010, reflecting the policy stance to rationalize recurrent
expenditure. Interest payments increased by 26.8 per cent and the goods and
services component fell by 0.7 per cent.
Analysis of the goods and services component,
at N2,527.3 billion (76.3% of total), showed that
personnel cost and pensions amounted to
N1,854.0 billion (73.4%),while overhead cost
was N673.3 billion (26.6%). Furthermore, interest
payments5 rose to N527.2 billion or 1.5 per cent of GDP (15.9 % of total). A
breakdown indicated that N41.8 billion was expended on external debt service
and N485.4 billion spent on domestic debt service. Transfers to the Federal
Capital Territory (FCT) and other special funds (stabilization fund, development
of natural resources and ecology) accounted for N260.1 billion (7.8 % of the
total).
5This includes interest payments on ways and means.
Goods & Services 76.3%
Interest Payments
15.9%
Transfers 7.8%
Figure. 5.9: Economic Classification of FG Recurrent Expenditure in 2011
Recurrent expenditure shrank to 9.4 per cent of GDP, reflecting the consolidation stance
of the Federal Government in FY2011.
5

Central Bank of Nigeria Annual Report—2011
129
The functional classification of recurrent expenditure showed that the outlay on
administration grew by 12.6 per cent to N1,427.1 billion and accounted for 43.1
per cent of the total. Similarly, transfer payments increased by 8.9 per cent to
N956.2 billion and constituted 28.8 per cent of the total. Expenditure on
economic services, at N310.5 billion, accounted for 9.4 per cent of total
recurrent expenditure. Within the economic sector, agriculture, transport,
communications and roads/construction collectively absorbed 80.6 per cent.
The expenditure on social and community services sector accounted for 18.7
per cent of the total recurrent expenditure.
-
2.00
4.00
6.00
8.00
10.00
12.00
2007 2008 2009 2010 2011
7.6 8.6 8.4
10.5 9.4
3.6 3.8 3.8 4.7 4.9
Figure 5.10: FG Recurrent Expenditure & Personnel Cost (per cent of GDP)
Recurrent Expenditure Personnel Cost
Administration 43.1%
Economic Sector 9.4%
Social & Community Services 18.7%
Transfers 28.8%
Figure 5.11: Functional Classification of Federal Government Recurrent Expenditure in 2011
5

Central Bank of Nigeria Annual Report—2011
130
5.4.3.2 Capital Expenditure
Capital expenditure rose by 3.9 per cent to N918.5 billion, or 2.6 per cent of
GDP, and accounted for 19.5 per cent of the total expenditure, reflecting the
decision of the Federal Government to optimize capital spending. As a
proportion of Federal Government revenue, capital expenditure was 25.8 per
cent, exceeding the stipulated minimum
target of 20.0 per cent under the WAMZ
secondary convergence criteria. Analysis
of capital expenditure showed that outlays
on economic services accounted for
N385.5 billion, or 42.1 per cent of the total, compared with 46.6 per cent in the
preceding year. Within the economic services sector, manufacturing,
mining/quarrying, agriculture/natural resources, transport/communications and
roads/construction absorbed 72.4 per cent. Public investments in social and
community services accounted for 10.0 per cent of the total. As a ratio of
capital spending, expenditure on education declined to 3.9 per cent in 2011
from 9.9 per cent in the preceding year, while that on health rose from 4.0 per
cent in 2010 to 4.3 per cent in 2011.
Administration 25.3%
Economic Sector 42.1%
Social & Community Services 10.0%
Transfers 22.6%
Figure 5.12: Functional Classification of Federal Government Capital Expenditure in 2011
Capital expenditure increased by 3.9 per cent to N918.5 billion and accounted for 19.5 and 2.6 per cent of total expenditure and GDP,
respectively.
5

Central Bank of Nigeria Annual Report—2011
131
Box 6: FISCAL CONSOLIDATION AS A STRATEGY FOR DEFICIT AND DEBT REDUCTION
In order to improve public finances, tackle the challenges of reducing deficits/debts and
restore fiscal sustainability in a regime of weak global economic recovery, many advanced
and emerging countries embarked on fiscal consolidation (FC) in 2011. According to the
Organization of Economic Co-operation and Development (OECD, 2011),FC refers to a
government economic policy that is intended to reduce deficits and the accumulation of
debts. Such policy, which is essential for financial and macroeconomic stability, is expected
to spell out government‘s efforts to lower the level of deficit while simultaneously limiting the
generation of new debt obligations. In fact, many of the advanced and emerging
economies initiated the FC strategy through a combination of spending cuts and tax hikes.
Ostensibly, the essence of FC appears to conflict with the desire to stimulate economic
growth, as slamming the brakes on government spendings too quickly could hurt economic
recovery and worsen job creation prospects. As argued by Trichet, Jeane-Claude of the
European Central Bank (ECB), the most effective strategy for fiscal consolidation is to
‗systematically adjust fiscal spendings while simultaneously boosting long-term growth‘.
Therefore, the success of FC depends on its design/implementation and the potential long-
run benefits must be balanced against its short-run adverse effects on growth and job
creation.
The need to embrace FC in Nigeria followed the implementation of various fiscal stimulus
packages by the Federal Government (FG), beginning from fiscal year 2009 through 2010, to
arrest the slowdown in economic activities, create the enabling environment for greater
private sector participation in the economy and accelerate sustainable economic growth.
These included: the disbursement of N200 billion through the deposit money banks (DMBs)
under the Commercial Agricultural Credit Scheme (CACS) to boost commercial and
mechanized agriculture; the investment of N361.2 billion in critical infrastructure; and the
injection of a N100 billion multilateral loan in the critical sectors of the economy. Others were
the N113.1 billion Presidential Intervention/Quick-Win projects and the N140.0 billion targeted
intervention in critical infrastructure/ job creation.
The implementation of these discretionary fiscal measures in the face of revenue leakages
significantly raised government expenditure and resulted in a sharp increase in deficit and
debt built-up. Consequently, in absolute terms, the fiscal deficit surged from N0.047 trillion in
FY2008 to N0.81 trillion in 2009 and further to N1.11 trillion by 2010. Similarly, the consolidated
debt rose significantly by 35.7 per cent to N3.82 trillion at end of 2009 and further ballooned
to N5.24 trillion at the end of FY2010, representing a 37.3 per cent hike over the level in 2009.
The consequent realization, by the last quarter of 2010, of the bourgeoning fiscal deficit and
debt, by the last quarter of 2010, necessitated the paradigm shift with regards to stimulus
spending. Accordingly, the FG, in the 2011 Budget which was set within the 2011–2013
Medium Term Expenditure and Fiscal Strategy, embraced the FC strategy as a means of
curtailing expenditure, reducing fiscal deficits and lessening the accumulation of debt to an
optimal level, over a period of three years.
5

Central Bank of Nigeria Annual Report—2011
132
5.5 STATE GOVERNMENTS’ FINANCES6
5.5.1 Overall Fiscal Balance and Financing
Provisional data on state governments‘
finances (including the FCT) showed that, in
absolute terms, the overall deficit increased
from N103.7 billion in 2010 to N131.9 billion in
2011. As a ratio of GDP, however, the deficit
remained the same as in 2010 at 0.4 per cent. The deficit was financed largely
through borrowing from the DMBs.
6The provisional data are from the CBN survey returns from 36 states and the FCT.
Provisional data on state governments’ finances (including FCT) indicated an increase in the overall deficit to N131.9 billion, up from N103.7 in 2010.
The FC strategy focused on:
Implementing wide-ranging public financial management reforms to improve the
quality and efficiency of fiscal spending, as well as to steadily rationalize recurrent
expenditure and optimize capital expenditure;
Accelerating the implementation of the Public-Private-Partnership (PPP) policy by
creating the Viability Gap Fund to encourage greater private sector participation in
the economy;
Maximizing, diversifying and accelerating the identification as well as the resolution
of revenue leakages through various interventions, including (i) strengthening of pre-
shipment inspection for crude oil and gas; (II) conduct of audits of all revenue
generating agencies such as the Nigerian National Petroleum Corporation (NNPC)
and agencies required to remit internally-generated revenue to the Treasury; and (iii)
Fast-track reforms by the Federal Inland Revenue Service (FIRS) and the Nigerian
Customs Service (NCS) to boost non-oil revenue and
Improving the risk management strategies to hedge against commodity (crude oil)
price volatility through the establishment of the Nigeria Sovereign Wealth Fund
(NSWF) which would entrench greater prudent management of the exhaustible oil
wealth for the purpose of inter-generational equity and as a platform for counter-
cyclical policy measures, as well as a catalyst for attracting investment in critical
infrastructure.
Importantly, the consistency of government policies in the short to medium term would, to a
large extent, determine the extent of success of the FC initiatives as an effective means of
reducing fiscal deficits and debt accumulation in the economy over time. Also, necessary
precautions would have to be taken to ensure that the FC strategy does not impede
economic growth and job creation, even in the short run.
5

Central Bank of Nigeria Annual Report—2011
133
5.5.2 Revenue
Total revenue of the state governments increased by 7.8 per cent to N3,410.1
billion, or 9.6 percent of GDP, compared with N3,162.5 billion or 10.7 per cent of
GDP in 2010. The analysis of the sources of revenue indicated that allocations
from the Federation Account (including 13.0% Derivation Fund) was N1,786.3
billion, or 52.4 per cent; the VAT Pool Account was N318.0 billion, or 9.3 per
cent; Internally Generated Revenue (IGR) was N509.3 billion, or 14.9 per cent;
the Stabilization Account was N11.2 billion,
or 0.3 per cent; the Excess Crude Account
(including budget augmentation and
refund to the state governments by the
NNPC) totalled N696.7 billion or 20.5 per
cent; and grants/others amounted to N88.7 billion, or 2.6 per cent. The IGR fell
below the level in 2010 by 32.8 per cent, indicating a slowdown in the drive for
internal revenue. In terms of tax efforts, measured as the ratio of IGR to total
revenue (IGR/TR), Lagos State ranked highest with 54.9 per cent, followed by
Abia and Ogun States, with 37.1 and 28.7 per cent, respectively, while Borno
State ranked the least with 3.4 per cent. In terms of state governments‘ effort at
improving internally-generated revenue, Ondo State topped, with an increased
IGR/TR ratio from 2.1 per cent in 2010 to 8.6 per cent in 2011, followed by Kogi
and Bauchi States in the second and third positions, respectively. Overall, the
Federation Account 52.4%
Internally Generated Revenue
14.9%
VAT 9.3%
Stabilisation Fund 0.3%
Excess Crude Revenue
20.5%
Grants & Others 2.6%
Figure 5.13: State Governments' Revenue in 2011 (Naira Billion)
Total revenue of the state governments rose by 7.8 per cent to N3,410.1 billion, or 9.6 per cent of GDP.
5

Central Bank of Nigeria Annual Report—2011
134
consolidated IGR/TR ratio of the state governments fell from 24.0 per cent in
2010 to 14.9 per cent.
2010 2011
Amount Amount
(N‘ Billion) (N‘ Billion)
Federation Account 2/ 1,353.7 42.8 1,786.3 52.4 4.6 5.0
Excess Crude Rev enue 3/ 500.1 15.8 696.6 20.5 1.7 2.0
VAT 275.6 8.7 318.0 9.3 0.9 0.9
Internally Generated Rev enue 757.9 24.0 509.3 14.9 2.6 1.4
Stabilisation Fund 51.0 1.6 11.2 0.3 0.2 0.03
Grants & Others 224.2 7.1 88.7 2.6 0.7 0.3
Total 3,162.5 100 3,410.1 100 10.7 9.6
Table 5.2: State Governments’ Revenue
State Governments’ Revenue Share in Overall GDP
Item
2010 2011 1/
Share (%) Share (%) % %
1/ Including FCT
2/ Including 13% Derivation Fund
3/ Including Budget Augmentation and Foreign Exchange Rate Gains
Sources: Federal Ministry of Finance
Office of the Accountant-General of the Federation
Fiscal returns from state and local governments Survey
5.5.3 Expenditure
Estimated total expenditure of the state
governments increased by 8.4 per cent to
N3,542.0 billion, or 10.0 per cent of GDP. A
breakdown showed that, at N2,055.8 billion
or 5.8 per cent of GDP, recurrent expenditure was 24.7 per cent higher than the
level in the preceding year and accounted for 58.1 per cent of the total.
5.4 4.8
5.8 6.1 5.7 5.6 5.8
3.5 3.1 4.1
5.9 5.1 5.2
3.9
1.2 0.6 0.2 0.2 0.3 0.3 0.3
10.1
8.5
10.1
12.3 11.0 11.1
10.0
-
2.0
4.0
6.0
8.0
10.0
12.0
14.0
2005 2006 2007 2008 2009 2010 2011
Pe
r ce
nt
Figure 5.14: State Governments' Expenditure (per cent of GDP)
Recurrent Expenditure Capital Expenditure
Extra-Budgetary Expenditure Total Expenditure
The total expenditure of the state governments grew by 8.4 per cent to N3,542.0 billion, or
10.0 per cent of GDP.
5

Central Bank of Nigeria Annual Report—2011
135
At N1,375.2 billion, or 3.9 per cent of GDP, the capital expenditure was 9.7 per
cent below the level in 2010 and accounted for 38.8 per cent of the total.
Similarly, extra-budgetary expenditure grew by 16.3 per cent and accounted
for 3.1 per cent of the total.
Analysis of spending on primary welfare sectors indicated that expenditure on
education decreased by 17.0 per cent from the level in 2010 to N212.6 billion
and accounted for 6.0 per cent of total expenditure. Also, the expenditure on
health, agriculture, water supply and housing also fell by 14.6, 12.6, 32.4 and
48.4 per cent, respectively, relative to their levels in 2010 to N119.6 billion, N116.4
billion, N57.0 billion and N29.2 billion. On the whole, aggregate expenditure on
primary welfare sectors amounted to N534.8 billion, or 1.5 per cent of GDP, and
accounted for 15.1 per cent of the total.
0.0
1.0
2.0
3.0
4.0
5.0
6.0
Education Health Agriculture WaterSupply
Housing
6.0
3.4 3.3
1.6 0.8
Figure 5.15: State Governments' Expenditure in Key Sectors for 2011 (per cent of Total Expenditure)
0.6
0.3 0.3
0.2 0.1
-
0.1
0.2
0.3
0.4
0.5
0.6
0.7
Education Health Agriculture Water Supply Housing
Per
cen
t
Figure 5.16: State Governments' Expenditure in Key Sectors for 2011 (per cent of GDP)
5

Central Bank of Nigeria Annual Report—2011
136
5.6 LOCAL GOVERNMENTS’ FINANCES7
5.6.1 Overall Fiscal Balance and Financing
Provisional data on local governments‘ fiscal
operations indicated a surplus of N2.6 billion,
compared with a surplus of N2.5 billion in 2010.
5.6.2 Revenue
The total revenue of local governments, at N1,603.8 billion, represented an
increase of 18.0 per cent over the level in 2010. The sources of the revenue
comprised allocations from the Federation Account (N940.0 billion), Share of
Excess Crude Account (N80.7 billion), NNPC refunds to LGs (N11.5 billion),
budget augmentation (N246.6 billion)
VAT (N218.2 billion), IGR (N27.3 billion),
grants/‗others‘ (N44.1 billion),
stabilization fund (N21.3 billion), and
state allocation (N14.0 billion).
7The provisional data are from the CBN survey returns from 727 LGAs while 47 LGAs were estimates.
0.02
-0.01
0.01 0.01 0.01 0.1 0.1 0.1 0.1 0.1
4.0
5.6
4.2
4.5 4.6
0.0
1.0
2.0
3.0
4.0
5.0
6.0
-0.02
0
0.02
0.04
0.06
0.08
0.1
0.12
2007 2008 2009 2010 2011
Pe
r ce
nt
Figure 5.17: Local Governments' Revenue & Overall Balance (Per cent of GDP)
Overall Balance (left axis) Internally Generated Revenue (left axis)
Total Revenue & Grants (right axis)
Provisional data on local governments’ fiscal operations indicated a surplus of N2.6 billion.
The total revenue of local governments was estimated at
N1,603.8 billion, indicating an increase of 18.0 per cent.
5

Central Bank of Nigeria Annual Report—2011
137
2010 2011
Amount Amount
(N‘ Billion) (N‘ Billion)
Federation Account 716.0 52.7 940 58.6 2.4 2.7
Excess Crude Rev enue 158.9 11.7 80.7 5.0 0.5 0.2
FGN Refunds to LG 121.6 8.9 11.5 0.7 0.4 0.03
Budget Augmentation 78.7 5.8 246.6 15.4 0.3 0.7
Exchange Rate Gain 7.1 0.5 0 0 0.02 0
VAT 189.1 13.9 218.2 13.6 0.6 0.6
Internally Generated Rev enue 26.2 1.9 27.3 1.7 0.1 0.1
Stabilization Fund 12.6 0.9 21.3 1.3 0.04 0.1
State Allocation 12.7 0.9 14.0 0.9 0.04 0.04
Grants & Others 36.3 2.7 44.1 2.7 0.1 0.1
Total 1,359.2 100 1,603.8 100 4.5 4.6
Table 5.3: Local Governments’ Revenue
Local Governments’ Revenue Share in Overall GDP
Item
2010 2011
Share (%) Share (%) % %
Sources: Federal Ministry of Finance
Office of the Accountant-General of the Federation
CBN survey of state and local governments.
5.6.3 Expenditure
At N1,601.2 billion, the total expenditure of
local governments indicated an increase of
18.0 per cent above the level in 2010, and
represented 4.6 per cent of the GDP. A
breakdown indicated that recurrent outlay stood at N1,179.4 billion or 73.7 per
cent, while capital expenditure amounted to N421.8 billion, or 26.3 per cent of
the total.
A breakdown of recurrent expenditure showed that personnel cost was N748.1
billion, while overhead cost and the consolidated fund charges/others
3.3 3.3
2.8 2.8
3.3
0.7
2.3
1.4 1.8
1.2
4.0
5.6
4.2 4.5 4.6
-
2.0
4.0
6.0
2007 2008 2009 2010 2011
pe
r ce
nt
Figure 5.18: Local Governments' Expenditure (per cent of GDP)
Recurrent Expenditure Capital Expenditure Total Expenditure
The expenditure of the local governments was 18.0 per cent higher than the level in 2010 and
represented 4.6 per cent of the GDP.
5
5
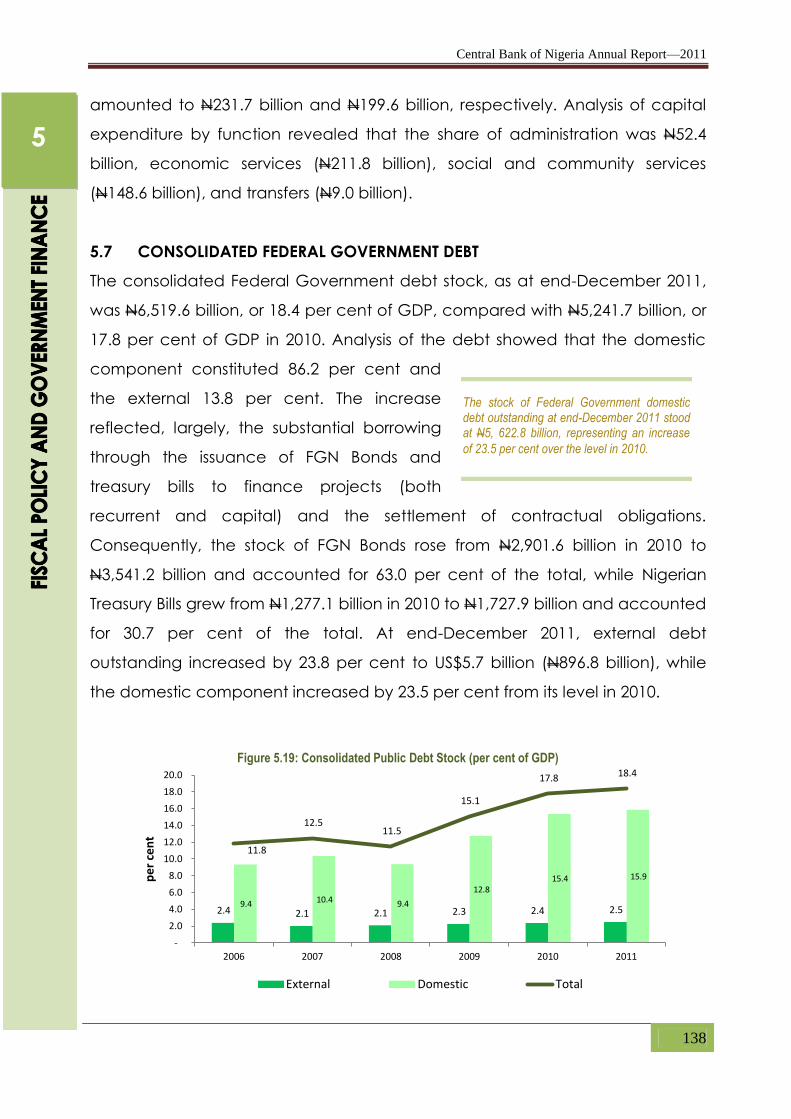
Central Bank of Nigeria Annual Report—2011
138
amounted to N231.7 billion and N199.6 billion, respectively. Analysis of capital
expenditure by function revealed that the share of administration was N52.4
billion, economic services (N211.8 billion), social and community services
(N148.6 billion), and transfers (N9.0 billion).
5.7 CONSOLIDATED FEDERAL GOVERNMENT DEBT
The consolidated Federal Government debt stock, as at end-December 2011,
was N6,519.6 billion, or 18.4 per cent of GDP, compared with N5,241.7 billion, or
17.8 per cent of GDP in 2010. Analysis of the debt showed that the domestic
component constituted 86.2 per cent and
the external 13.8 per cent. The increase
reflected, largely, the substantial borrowing
through the issuance of FGN Bonds and
treasury bills to finance projects (both
recurrent and capital) and the settlement of contractual obligations.
Consequently, the stock of FGN Bonds rose from N2,901.6 billion in 2010 to
N3,541.2 billion and accounted for 63.0 per cent of the total, while Nigerian
Treasury Bills grew from N1,277.1 billion in 2010 to N1,727.9 billion and accounted
for 30.7 per cent of the total. At end-December 2011, external debt
outstanding increased by 23.8 per cent to US$5.7 billion (N896.8 billion), while
the domestic component increased by 23.5 per cent from its level in 2010.
2.4 2.1 2.1 2.3 2.4 2.5 9.4 10.4 9.4
12.8 15.4 15.9
11.8
12.5 11.5
15.1
17.8 18.4
-
2.0
4.0
6.0
8.0
10.0
12.0
14.0
16.0
18.0
20.0
2006 2007 2008 2009 2010 2011
pe
r ce
nt
Figure 5.19: Consolidated Public Debt Stock (per cent of GDP)
External Domestic Total
The stock of Federal Government domestic debt outstanding at end-December 2011 stood at N5, 622.8 billion, representing an increase
of 23.5 per cent over the level in 2010.
5

Central Bank of Nigeria Annual Report—2011
139
5.7.1 Domestic Debt
The stock of Federal Government domestic debt at end-December 2011 was
N5,622.8 billion, representing an increase of 23.5 per cent over the level in
FY2010. The development reflected the substantial borrowing through the
issuance of FGN Bonds and Nigerian Treasury Bills. The banking system remained
the dominant holder of the outstanding debt instruments with 76.2 per cent,
and the non-bank public accounted for the balance of 23.8 per cent.
Disaggregation of the banking system‘s holdings indicated that N3,790.8 billion,
or 88.4 per cent, was held by the DMBs and DHs, and N495.2 billion or 11.6 per
cent by the CBN and the Sinking Fund.
Analysis of the maturity structure of the
domestic debt showed that instruments of
two (2) years and below accounted for
N3,124.9 billion or 55.6 per cent, followed by
instruments of above two (2) to five (5) years
at N1,064.4 billion, or 18.9 per cent; those
with tenors of five (5) to ten (10) years totalled N715.2 billion or 12.7 per cent,
and tenors of over ten (10) years at N718.3 billion, or 12.8 per cent.
Non-bank
Public 23.8%
Central Bank/SF 11.6%
DMBs/DHS 88.4%
Banking System 76.2%
Figure 5.20: Composition of Domestic Debt Stock by Holder in 2011
The analysis of debt indicators revealed that at 18.4 per cent, the debt stock/GDP ratio remained low relative to the maximum international threshold of 30.0 per cent of
GDP.
5

Central Bank of Nigeria Annual Report—2011
140
5.7.2 External Debt
At US$5.7 billion, Nigeria‘s external debt grew by 23.8 per cent over the level at
end-December 2010. The rise reflected the drawdown of additional multilateral
loans by the Federal Government, amounting to US$351.2 million, as well as
borrowings from the international capital market, including the issuance of
Euro-bond amounting to US$500 million. Of the external debt outstanding, the
share of multilateral institutions was US$4.6 billion and accounted for 80.6 per
cent, while ‗others‘ amounting to US$1.1 billion accounted for the balance.
5.7.3 Debt Service Payments and Debt Indicators
Total debt service payments8 stood at N591.5 billion, or 1.7 per cent of GDP,
and comprised N54.1 billion, or US$0.35 billion, for external and N537.4 billion for
domestic debt. The external debt service consisted of amortization (principal
repayment) of N35.7 billion, or 66.0 per cent, and actual interest payments of
N18.4 billion, or 34.0 per cent. Domestic debt service indicated that
amortization stood at N19.4 billion, or 3.6 per cent, while interest payment was
N518.0 billion, or 96.4 per cent of the total debt service payments.
The analysis of debt indicators revealed that at 18.4 per cent, the debt
stock/GDP ratio remained low relative to the maximum international threshold
of 30.0 per cent in 2011. The debt service/revenue ratio worsened from 13.2 per
cent in 2010 to 16.6 per cent in 2011, implying that a higher proportion of the
total revenue was devoted to debt service during the year.
8This represents actual debt service payments by the Debt Management Office which may differ from the figures in the Federal Government finances table that indicates contribution to the external creditors’ fund.
5

Central Bank of Nigeria Annual Report—2011
141
Table 5.4: Debt Service Payments (Naira Billion) and Debt Sustainability Indicators (per cent)
2011
- 117.2 9.0 17.4 15.3 18.4
- 11.4 46.2 46.5 38 35.7
- 185.4 233 271.3 19.5 518.0
- 67.3 238.3 207.4 334.7 19.4
- 381.2 526.5 542.5 407.4 591.5
30 12.5 11.5 15.1 17.8 18.4
30 2.1 2.1 2.3 2.3 2.5
10.4 9.4 12.8 15.4 15.9
5.3 4.3 7.0 6.3 5.8
16.3 16.5 20.5 13.2 16.6
Total Debt/Rev enue (%) 250 111.8 89.0 144.5 169.7 183.5
Total Debt Serv ice/Rev enue (%) 20-25 (Max.=25)
Total External Debt/GDP
Total Domestic Debt/GDP 40-60
Total External Debt/Export (%) 100
2009 2010
Total Debt/GDP
Indicators International Thresholds 2007 2008
External Debt Serv ice (Interest Payments)*
Amortization - External Debt
Domestic Debt Serv ice (Interest Payments)
Amortization - Domestic Debt
Total Debt Service
Sources: Debt Management Office, Central Bank of Nigeria, Office of the Accountant
General of the Federation
5

Central Bank of Nigeria Annual Report—2011
142
he growth of the economy remained relatively strong in 2011. The real Gross Domestic
Product (GDP), measured in 1990 basic prices, grew by 7.4 per cent, compared with 8.0
per cent in 2010. Growth in 2011 was broad-based but driven mainly by the non-oil sector,
which grew by 8.9 per cent, while the oil sector grew by 1.5 per cent. Agriculture grew by 5.7
per cent, led by livestock and fishery. Wholesale and retail trade grew by 11.3 per cent and
building and engineering construction by 12.3 per cent. The services and industrial sectors grew
by 13.3 and 1.3 per cent, respectively. The moderation in inflationary pressure witnessed in 2010
was sustained in 2011 but remained above the single digit. The moderate inflation recorded
was attributable, largely, to good agricultural harvest, increase in crude oil production,
sustained investment in infrastructure by Government and a non-accommodating monetary
policy. Further expansion in output was, however, constrained by poor infrastructure, the most
serious of which was inadequate power supply.
6.1 DOMESTIC OUTPUT
Provisional data from the National Bureau of Statistics (NBS) indicated that the
estimated Gross Domestic Product (GDP), measured at 1990 constant basic
prices, stood at N833.4 billion in 2011. This indicated a GDP growth of 7.4 per
cent in 2011, compared with 8.0 per cent
in 2010 and an annual average of 7.0 per
cent over the period 2007 – 2011 period.
The 7.4 per cent GDP growth rate was,
however, higher than the target growth
rate of 7.0 per cent for the year. In terms
of contribution to GDP growth, the
services sub-sector contributed the largest with 2.4 percentage points. This was
followed by agriculture with a contribution of 2.3 percentage points; wholesale
T
The Gross Domestic Product (GDP), measured at 1990 constant basic prices, was estimated at N833.4 billion in 2011, indicating a growth rate of 7.4 per cent. This was lower than the 8.0 per cent recorded in 2010, but higher than the target growth rate of 7.0 per cent for the year and the average annual growth rate of 7.0 per cent for the period 2007 – 2011.
CHAPTER SIX
REAL SECTOR DEVELOPMENTS

Central Bank of Nigeria Annual Report—2011
143
and retail trade contributed 2.1 percentage points; and building and
construction 0.2 percentage point. Industry as a group made a contribution of
0.3 percentage point.
The development in 2011 was attributed largely to the conducive
macroeconomic environment. The specific factors included the favourable
credit conditions, which enhanced financing of the private sector, and the
stable supply of petroleum products. Others included the favourable weather
conditions which boosted agricultural output, increase in crude oil production,
sustained investment in infrastructure by government, building and construction
activities across the country and expansion in the telecommunications sub-
sector.
-10
-5
0
5
10
15
20
25
2007 2008 2009 2010 2011
per
cen
t
Figure 6.1 GDP Growth Rate (2007 - 2011)
GDP Growth Rate Oil Non-Oil
6

Central Bank of Nigeria Annual Report—2011
144
Activity Sector 2007 2008 2009 2010 1/ 2011 2/
1. Agriculture 7.2 6.3 5.9 5.6 5.7
Crop Production 7.3 6.2 5.8 5.6 5.7
Liv estock 6.9 6.9 6.5 6.5 6.2
Forestry 6.1 6.1 5.9 5.8 5.9
Fishing 6.6 6.6 6.2 6.0 5.9
2. Industry -2.2 -3.4 2.0 5.6 1.3
Crude Petroleum -4.5 -6.2 0.5 5.0 -0.6
Solid Minerals 12.8 12.8 12.1 12.3 11.5
Manufacturing 9.6 8.9 7.9 7.6 7.6
3. Building & Construction 13.0 13.1 12.0 12.1 12.3
4. Wholesale & Retail Trade 15.2 14.0 11.5 11.2 11.3
5. Services 9.9 10.4 10.8 11.9 13.3
Transport 7.0 7.0 6.8 6.7 6.8
Communications 32.9 33.2 34.2 34.5 34.8
Utilities 4.9 3.7 3.2 3.3 3.4
Hotel & Restaurant 13.0 12.9 11.9 12.0 12.1
Finance & Insurance 5.0 4.8 4.0 4.0 4.0
Real Estate & Business Serv ices 11.4 11.4 10.6 10.4 10.1
Producers of Gov t. Serv ices 5.9 6.0 5.9 5.7 5.6
Comm., Social & Pers. Serv ices 10.6 10.7 9.8 9.7 9.9
TOTAL (GDP) 6.5 6.0 7.0 8.0 7.4
NON-OIL (GDP) 9.5 9.0 8.3 8.5 8.9
Table 6.1: Sectoral Growth Rates of GDP at 1990 Constant Basic Prices (per cent)
Activity Sector 2007 2008 2009 2010 1/ 2011 2/
1. Agriculture 3.0 2.8 2.5 2.4 2.3
Crop Production 2.7 2.4 2.2 2.1 2.1
2. Industry -0.6 -0.5 0.4 1.2 0.3
Crude Petroleum -1.0 -0.9 0.1 0.8 -0.1
3. Building & Construction 0.2 0.2 0.2 0.2 0.2
4. Wholesale & Retail Trade 2.3 2.3 2.0 2.0 2.1
5. Services 1.6 1.7 1.8 2.1 2.4
Communication 0.6 0.7 1.0 1.3 1.6
TOTAL (GDP) 6.5 6.0 7.0 8.0 7.4
NON-OIL (GDP) 9.0 9.4 8.3 8.5 8.9
Table 6.2: Sectoral Contribution to Growth Rates of GDP at 1990 Constant Basic Prices
(percentage points)
1/ Revised
2/ Provisional
Source: NBS
Non-oil GDP recorded a growth rate of 8.9 per cent, compared with 8.5 per
cent in 2010. The improved performance in the sector was driven largely by the
6

Central Bank of Nigeria Annual Report—2011
145
agricultural sector which grew by 5.7 per cent, underpinned by robust growth in
all its components. Other drivers of growth in non-oil GDP included services,
building and construction, and wholesale and retail trade, which recorded
growth rates of 13.3, 12.3 and 11.3 per cent, respectively. In the services sub-
sector, communications recorded the highest growth rate of 34.8 per cent,
reflecting the sustained liberalisation and expansion of telecommunications
services. At 7.9 per cent, the growth in Industrial output (excluding crude
petroleum) was sustained in 2011. A sub-sectoral analysis indicated that, solid
minerals and manufacturing output grew by 11.5 and 7.6 per cent,
respectively. The sustained implementation of the Federal Government
amnesty programme, which paved the way for relative peace and,
consequently, led to increased crude oil production in 2011, stability in the price
and supply of petroleum products, continued government investment in critical
infrastructure development, accounted for the performance. Other
government programmes and policies, especially those in support of small- and
medium-scale enterprises, also buoyed industrial growth.
05
1015202530354045
2007 2008 2009 2010 2011
per
cen
t
Figure 6.2: Sectoral Share in GDP, 2007 - 2011
Agriculture Industry Building & Construction Wholesale & Retail Trade Services
6

Central Bank of Nigeria Annual Report—2011
146
A sectoral analysis of the real GDP indicated that agriculture‘s share in total
GDP was 40.2 per cent, slightly lower than the 40.8 per cent recorded in 2010.
The share of industry increased marginally from 20.4 per cent in 2010 to 21.0 in
2011, while crude oil in GDP declined from 15.9 per cent in 2010 to 13.5 per
cent. The share of solid minerals and manufacturing components of industry
remained minuscule. Services as a group had a share of 17.7 per cent of GDP,
of which communications, finance and insurance, utilities and transport
accounted for 5.7, 2.9, 2.9 and 2.5 percent, respectively.
Provisional data showed that real domestic demand at 1990 purchasers‘ price
(GDP by Expenditure approach) fell by 0.6 per cent to N521.2 billion in 2011,
compared with N524.6 billion in 2010. Private consumption was N174.4 billion,
while government final consumption expenditures totalled N267.0 billion in 2011,
compared with N193.5 billion and N253.8 billion, respectively, in the preceding
year. This indicated a decrease of 9.9 per cent in real private consumption
0
5
10
15
20
2007 2008 2009 2010 2011
Per
cen
t
Figure 6.3: Growth Rate of Major Sectors of Non-oil GDP, 2007 - 2011
Agriculture Industry (excl. Crude Petroleum)Building&Construction Wholesale&Retail TradeServices
0
2
4
6
2007 2008 2009 2010 2011
Per
cen
tag
e P
oin
ts
Figure 6.4: Contribution to Growth Rate of Non-oil GDP, 2007 - 2011
Agriculture Industry (excl. Crude Petroleum)
Building & Construction Wholesale & Retail Trade
Services
6

Central Bank of Nigeria Annual Report—2011
147
expenditure and an increase of 5.2 per cent in real government consumption
expenditure. Investment (gross fixed capital formation) and net exports grew by
3.0 and 2.0 per cent, respectively, in real terms. The increase in government
consumption was attributed mainly to the rise in government‘s investment in
security and critical infrastructure.
6.2 AGRICULTURE
6.2.1 Agricultural Policy and Institutional Support
The Federal Ministry of Agriculture and Natural Resources launched the
Agricultural Transformation Action Plan (ATAP), 2011-2015, as the anchor for the
Transformation Agenda of the Federal Government. The objectives of the plan
were to facilitate the attainment of food security, diversify the economy, create
more jobs, and generate foreign earnings. In specific terms, additional 20
million tonnes of food would be produced, while 3.5 million new jobs would be
created in the agricultural sector over the four-year period. The key
components of the plan involve reforms in input supply management,
particularly fertilizer, marketing institutions, financing the agricultural value-
chain, and creating an investor-friendly framework for agricultural investment.
Under the input supply management reform, government withdrew from direct
participation in the purchase and distribution of fertilizers to farmers. The
distribution of fertilizers and other agricultural inputs would be undertaken by
the private sector to enhance efficiency. The policy would also improve
farmers‘ access to the commodity as Government would pay 10%
0
100
200
300
400
500
2007 2008 2009 2010 2011
Nai
ra B
illio
n
Figure 6.5: GDP (Expenditure Approach) at 1990 Purchasers' Price
Private Consumption Expenditure Government Consumption Expenditure
6

Central Bank of Nigeria Annual Report—2011
148
achievement fees to companies that meet supply targets. Government also
intensified effort to ensure the rapid expansion of agro-dealer networks across
the country. To this end, 60 one-stop agro-input shops were established across
the country in 2011, with plans to build additional 18 shops in 2012.
The reform of the marketing institutions would support the establishment of
marketing firms along agricultural value-chains by private sector institutions to
coordinate market standards and promote export activities. In addition,
agricultural commodity exchanges would be established to improve market
access and stabilize prices.
In order to strengthen the financing of the agricultural value-chain, the Nigeria
Incentive-based Risk Sharing System for Agricultural Lending (NIRSAL), initiated
in 2010, was formally launched in 2011. The scheme would focus on the
agricultural value-chain and provide strong incentives for banks to lend to
agriculture. The NIRSAL would stimulate innovations in agricultural lending,
encourage bank lending to the sector, eliminate state dependency by banks
for deploying loanable funds to agriculture, leverage DMBs‘ balance sheet for
lending to agriculture, build a business approach to lending to the sector, and
motivate banks to share in the risk.
The sum of US$500 million earmarked for the scheme would be administered by
a non-bank financial institution. The five components of the scheme include: a
Risk sharing Facility (US$ 300 million), an Insurance Facility (US$ 30million), a
Technical Assistance Facility (US$ 60million), an Agricultural Bank Rating
Mechanism (US$ 10 million), and a Bank Incentives Mechanism (US$ 100 million).
The agricultural investment component of the plan seeks to attract private
investors into areas of high food production to set up food processing plants,
reduce current high levels of post-harvest losses, and link farmers in clusters to
food processing plants. The plan also seeks to establish more staple crop
6

Central Bank of Nigeria Annual Report—2011
149
processing zones. The zones would offer fiscal incentives, such as tax breaks on
import of agricultural processing equipment; and tax holidays for food
processors and supportive infrastructure, such as power, roads, logistics, storage
facilities and cargo airports. Furthermore, six priority crops, namely, rice,
cassava, sorghum, cotton, tomato and maize in which Nigeria has competitive
advantage, as well as livestock and aquaculture, have been identified and
accorded priority with a view to increasing productivity and output.
The Rural Finance Institution Building Programme (RUFIN) in pursuit of its
mandate, part of which was to enhance access to rural financial services,
linked 3,508 rural microfinance institutions (RMFIs)to 32 participating MFBs and
other banks. Through this linkage, N119.2 million was provided to village savings
and credit associations for on-lending to their members /clients. In addition,
various capacity building programmes were conducted for personnel of RMFIs
and MFBs for all RUFIN participating states.
6.2.2 Agricultural Production
At 270.6 (1990=100), the provisional aggregate index of agricultural production
increased by 5.7 per cent. Although the growth rate in 2011 remained
unchanged from 2010, it was lower than the national sectoral target of 8.0 per
cent. The prevalence of favourable weather conditions across the country‘s
ecological zones and implementation of the various intervention programmes
largely accounted for the growth in the sector.
6.2.2.1 Crop Production
The output of staples increased by 5.7 per cent in 2011, as in 2010. Estimated
output for ‗other crops‘ increased by 6.5 per cent, compared with 6.1 per cent
in the preceding year. The performance of the crops sub-sector was buoyed by
favourable weather conditions, private sector investments in food production,
the creation of staple crop processing zones (SCPZ), reduced post-harvest
losses, and the continuation of various government programmes initiated in
6

Central Bank of Nigeria Annual Report—2011
150
2010. Cassava output grew by 6.0 per cent, due to the increased use of
improved cassava cuttings and expansion of processing facilities across the
country. Also, government‘s directive on the use of at least 10.0 per cent of
cassava flour in baking bread boosted output in cassava production. Rice
production increased by 5.0 per cent, compared with 4.0 per cent in 2010.
Crop 2010 2011 Crop 2010 2011
Wheat 5.5 6.3 Plantain 5.5 6.5
Sorghum 4.0 5.4 Potatoes 5.8 6.8
Rice 4.0 5.0 Yam 4.8 5.4
Maize 5.9 6.5 Cassava 6.9 6.0
Millet 4.9 5.2 Rubber 5.6 5.9
Soya -Bean 8.4 8.6 Palm Oil 8.3 9.7
Beans 6.1 6.5 Cocoa 6.6 8.3
Table 6.3: Growth in Major Crops Production (per cent)
6.2.2.2 Livestock
Livestock output remained at 6.4 per cent in 2011, as in 2010. Analysis of the
sub-sector showed that poultry and beef production increased by 5.2 and 8.7
per cent, respectively, when compared with their levels in 2010. The growth in
the sub-sector was propelled by the support provided by government to
expand the livestock value-chain, including the continued utilization of modern
abattoirs, and sanitary sales outlets established across the country. Other
factors were improved control of livestock diseases, and increased investment
in poultry farming.
6.2.2.3 Fishery
Fishery production grew by 5.9 per cent to 804,223 tonnes from its level in 2010.
The development reflected the improved usage of fish cage structures and
dam reservoirs, coupled with increased investment in fish farming in the
country. Despite of the impressive growth in the fishery subsector, the output
was 46.4 per cent lower than the estimated national annual demand of 1.5
million tonnes.
6

Central Bank of Nigeria Annual Report—2011
151
6.2.2.4 Forestry
Forestry products increased by 5.9 per cent to 174.8 million cubic metres in
2011, higher than the 4.8 per cent increase in 2010. The growth was driven
mainly by the increased demand for wood products. In addition, the Forestry
Research Institute of Nigeria (FRIN) sustained the supply of improved breeder
seedlings to replace the harvested tree stocks in order to sustain wood
production in the country.
6.2.3 Agricultural Prices
The prices of most of Nigeria‘s agricultural export commodities were higher in
2011 when compared with the previous year. Despite of this development, the
overall index computed, in US dollar terms, stood at 416.3 (1990=100),
representing a decrease of 2.1 per cent from the level in 2010. The price of
cocoa declined by 4.9 per cent below the level in the previous year due
largely, to the increase in supply, arising from the relative peace in Ivory Coast,
the leading global producer. However, other export commodities showed price
increases during the year under review. Copra recorded the highest price
increase of 54.3 per cent over the 2010 level due, largely, to strong demand.
Similarly, cotton, coffee, soya beans, and palm oil recorded price increases of
49.7, 38.3, 25.3 and 25.2 per cent, respectively. The development was
occasioned by supply cuts as a result of bad weather conditions in some
producing countries. In naira terms, the all-commodities price index increased
by 1.5 per cent to 6190.7 (1990=100) in 2011, ostensibly due to the depreciation
of the Naira vis-a-vis the US dollar. Except for cocoa which declined by 2.71 per
cent, compared with 2010, indices of all other commodities rose. Copra,
cotton, coffee, soya beans and palm oil recorded price increases of 57.7, 52.9,
41.6, 28.3 and 28.1 per cent, respectively.
6

Central Bank of Nigeria Annual Report—2011
152
6.3 INDUSTRY
6.3.1 Industrial Policy and Institutional Support
The former Ministry of Commerce and Industry was transformed into the Ministry
of Trade and Investment. The rationale was to ensure a seamless harmonization
of domestic and foreign investment policy for focused growth and
development. The mandate of the new Ministry was to attract investments into
the country, coordinate trade activities, as well as oversee small and medium
enterprises.
In order to encourage foreign investments, the Ministry created trade and
investment desks in major Nigerian embassies to act as facilitators and provide
guidance on business opportunities in Nigeria. The Ministry also launched the
Nigeria Agribusiness and Agro-Industries Development Initiative (NAADI) to
foster growth in the agribusiness sub-sector. With the success of the backward
integration policy in the cement sub-sector in 2010 (which led to considerable
expansion in local manufacturing capacity in 2011), the Ministry extended the
same policy to the agricultural sector, targeting sugar and rice production in
2011.
In order to bridge the manpower gap in the industrial sector, the Ministry of
Trade and Investment embarked on several specialized and vocational training
programme for budding entrepreneurs. Some of the programmes included: the
Train-to-Work Programme; SMEDAN‘s Young Entrepreneurs Programme; the
African-Diaspora Partnership for Empowerment and Development; and the
Human Capital Development Centre which would enable the country to
leverage on the opportunities in the US African Growth and Opportunity Act
(AGOA). It also equipped the Model Skills Training Centre in Abuja, and created
three additional ITF Area Offices at Lekki, Lagos State, Warri, Delta State, and
Yenagoa, Bayelsa State.
In 2011, policy also focused on promoting domestic manufacturing, through
guided patronage of locally made products. Some of the policy initiatives in
this regard included: approval of N119.82million loans for manufacturers of
6

Central Bank of Nigeria Annual Report—2011
153
motorcycle tyres and tubes; establishment of a long-term Automotive
Development Fund for concessionary lending; and establishment of a
Mechanics Credit Scheme (with a take-off fund of N1.0 billion).
The Federal Government continued its quest to boost power supply with a two-
pronged approach. The first was to ensure steady supply with respect to current
installed capacity, while fast-tracking the completion of new generation plants
to add new capacities. Since the launch of the road map for the power sector
reforms, generation has stabilized above 3,500Mw and the frequency of grid
collapse has drastically reduced. The achievement was attributed to the
massive investment in the rehabilitation of generating plants, upgrading of the
transmission lines, and expansion of the distribution network. Private sector
participation, through better grid metering and a revenue collection
management programme rendered the billing system more efficient, thereby
growing the revenue base of the companies. Regarding the addition of new
capacities, work reached an advanced stage in ten power plants across the
country in 2011. The plants were expected to add 4,771MW to current installed
capacity. Seven of them (Olorunshogo, Sapele, Ihovbor, Gbarain, Omoku,
Geregu, and Omotosho) were scheduled for commissioning in December 2012.
The second approach was to fully privatize the power sector for greater
efficiency. Eighteen successor companies to the PHCN became independent
entities. Except for the Transmission Company of Nigeria (TCN), all others were
being privatized. In the first quarter of 2011, the Bureau of Public Enterprises
called for expressions of interest in the generation and distribution companies
and received 929 bids, out of which 529 were for distribution while the rest were
for generation. The overwhelming interest in the sector, as manifested in the
large number of bids, was attributed to the Multi Year Tariff Order (MYTO) which
was aimed at ensuring that investors would be able to cover their costs. The
Board of the Nigeria Bulk Electricity Trading Company was inaugurated in 2011.
6

Central Bank of Nigeria Annual Report—2011
154
6.3.2 Industrial Production
At 132.0 (1990=100), the estimated industrial production index for 2011 rose by
8.7 per cent over the level in 2010. The improved performance of the industrial
sector in 2011 resulted from the continuation of policies and programmes put in
place the previous year. The growth was driven by increased activities in all the
sub-sectors, reflecting renewed efforts of government to transform the
economy. Also, the continuation of policies and programmes put in place in
2010, such as the intervention fund for the manufacturing sector, significantly
improved the performance of the industrial sector. The indices of the
manufacturing, mining and electricity sub-sectors increased by 7.4, 5.4 and 4.3
per cent, respectively, compared with the levels in 2010.
6.3.2.1 Manufacturing
The index of manufacturing production, estimated at 101.2 (1990=100), rose by
7.4 per cent above the level in 2010, while the average capacity utilisation rate
of the manufacturing sub-sector showed a marginal improvement from 56.2 to
56.9 per cent in 2011. The increase was mainly due to the improved
performance in the cement, sugar and confectioneries, electronics and
electrical components, and motor vehicle assembly sub-sectors.
105
110
115
120
125
130
0.0
50.0
100.0
150.0
200.0
250.0
2007 2008 2009 2010 2011
Pe
r ce
nt
Figure 6.6: Index of Industrial Production, 2007 - 2011 (1990 = 100)
Manufacturing Mining Electricity Consumption Industry
6

Central Bank of Nigeria Annual Report—2011
155
6.3.2.2 Extractive Industry
6.3.2.2.1 Oil & Gas
The implementation of the Nigerian Local Content Policy Act, which was
enacted in April 2010, continued in 2011. Aspects of the Act yet to be
implemented include: a local component manufacturing strategy, the
development of Indigenous Marine Vessels, and an Offshore Assets Acquisition
Strategy. Others are the: establishment of the Nigerian Content Development
Fund and the development of the Nigerian Oil and Gas Employment/ Training
Strategy.
a. Crude Oil Production, Refinery Utilization, Petroleum Products and Prices
i. Crude Oil and Condensates Production
Nigeria‘s aggregate crude oil production, including condensates and natural
gas liquids, was 792.05 million barrels, averaging 2.17mbd in 2011. This
represented a 1.9 per cent increase,
compared with 777.45 million barrels or
2.13 mbd produced in 2010.The increase
in production was attributed, largely, to
the relative peace in the Niger Delta
region, following the success of the Federal Government‘s amnesty
programme.
37
40
43
46
49
52
55
58
0.0
25.0
50.0
75.0
100.0
125.0
2007 2008 2009 2010 2011
Cap
acit
y U
tilis
atio
n (
%)
Ind
ex o
f M
anu
fact
uri
ng
Figure 6.7: Index of Manufacturing Production and Capacity Utilisation
Index of Manufacturing Capacity Utilization
6
The abated restive militancy in the Niger Delta continued in 2011. This paved the way for
improved crude production

Central Bank of Nigeria Annual Report—2011
156
ii. Refinery Utilization
In 2011, the actual refining capacity of the three (3) refineries increased by 4.1
percentage points, from 30.5 per cent in 2010. The Port Harcourt Refining
Company (PHRC) and the Kaduna Refining and Petrochemical Company
(KRPC) recorded an increased capacity of 8.0 and 5.1 per cent, respectively,
while the Warri Refining and Petrochemical Company (WRPC) had a decline of
2.0 per cent. The total output of petroleum products from the refineries was 4.9
million tonnes in 2011, representing an increase of 7.6 per cent, compared with
4.5 million tonnes refined in 2010. The increase in output of the refineries was
attributed to the rehabilitation and maintenance works on oil-processing
facilities and pipelines, specifically, the restoration of System 2C. Of the total
quantity of refined products, fuel oil accounted for the largest share of 28.7 per
cent, while Premium Motor Spirit (PMS), Automotive Gas Oil (AGO), Dual
Purpose Kerosene (DPK), and Low Pour Fuel (LPG) and others accounted for
27.5, 22.4, 15.7, 2.5 and 3.2 per cent, respectively. In terms of actual output, the
WRPC, PHRC and KRPC refined 2.3, 1.6, and 0.9 million tonnes of products,
respectively.
iii. Petroleum Products Consumption
The total volume of petroleum products consumed in 2011 was 22.3 billion litres.
This represented an increase of 5.3 per cent, compared to 21.2 billion litres
consumed in 2010. A breakdown by product showed that PMS had the highest
figure of 17.1 billion litres (76.4 per cent of total). This was followed by AGO, with
2.9 billion litres (12.8 per cent of total), DPK, with 2.0 billion litres (9.0 per cent of
total), LPFO, with 319.6 million litres (1.4 per cent of total), Liquefied Petroleum
Gas (LPG), with 31.8 million litres (0.1 per cent of total), and Asphalt & Others
with 51.5 million litres (0.2 per cent of total).
6

Central Bank of Nigeria Annual Report—2011
157
iv. Prices
The average spot price of Nigeria‘s reference crude, the Bonny Light, (37° API),
stood at US$113.77 per barrel in 2011, compared
with an average of US$80.81 per barrel in 2010.
This translated to an increase of 40.8 per cent.
Disruption of activities in the Sarir Oilfield at Sirte
basin, Libya in February saw the price of
Nigeria‘s Bonny Light rising from US$103.23 to
US$126.91 in April. Other contributory factors to the high average price of the
Bonny Light and, indeed, other crudes in 2011 were supply cuts in the North
Sea, the Gulf of Mexico and China, and seasonal demand increases from Asian
refineries.
The average prices of other crude streams, such as the West Texas Intermediate
(WTI) at US$94.69; the UK Brent at US$111.92 and the Forcados at US$114.52,
exhibited a similar trend as the Bonny Light. The average price of OPEC‘s
basket, which comprised twelve (12) variants of crude, also increased by 38.7
per cent from US$77.45 to US$107.46 per barrel in 2011, mainly due to the loss in
Libyan crude, El Sider.
b. Gas
The cost regimes for gas-to-power and gas-to-industry, which were introduced
in 2010 to ensure sustainability of supply, provided a strong impetus for the local
0.00
20.00
40.00
60.00
80.00
100.00
120.00
140.00
Jan Feb Mar Apr May Jun Jul Aug Sept Oct Nov Dec
2010 2011
Figure 6.8: Bonny Light Monthly Prices in 2010 and 2011
6
The average spot price of Nigeria’s reference crude, the Bonny Light,
(37°API) stood at US$113.77 per barrel in 2011, compared with an average of US$80.81 per barrel in 2010.

Central Bank of Nigeria Annual Report—2011
158
gas market in 2011. The power, cement and steel sub-sectors were the major
users.
i Gas Production and Utilization
The volume of gas produced in 2011 decreased to 1.9 billion mscf from 2.4
billion mscf, representing a decline of 18.7 per cent in 2010. Of the total, 70.6
per cent was utilized, while 29.4 per cent was flared. Out of the volume utilized,
49.5 per cent was sold to industries, including the power, cement and steel
companies, while 25.5 per cent was re-injected, and gas lifted accounted 11.3
per cent. Gas sold to Nigeria Liquefied Natural Gas (NLNG) Company, used as
fuel as well as gas converted to natural gas liquids, accounted for 7.6, 4.4 and
1.7 per cent, respectively.
6.3.2.2.2 Solid Minerals
a. Institutional Support for the Sector
The Federal Government sustained its reform of the solid minerals sector in 2011.
Areas of focus were: governance, institutional and human capital
development, poverty reduction initiatives, and resuscitation of abandoned
projects. During the year, the minerals and mining regulations were released,
while the Geosciences Research and Analytical Laboratory in Kaduna was
upgraded with additional equipment. Also, as part of capacity building in the
-
0.5
1.0
1.5
2.0
2.5
3.0
2007 2008 2009 2010 2011
Bill
ion
msc
f
Figure 6.9: Gas Production and Utilization (2007 - 2011)
Gas Produced Gas Utilised Gas Flared
6

Central Bank of Nigeria Annual Report—2011
159
subsector, additional artisanal miners and gemstones cutters, polishers and
beads makers were trained under the Train-the-Trainers programme. The
government also made concerted efforts to revamp the Nigeria Iron Ore
Mining Company (NIOMCO) which was expected to be the major iron ore
supplier to Ajaokuta Steel Company Limited.
b. Solid Minerals Production
Efforts to boost mining activities in the country enhanced the aggregate output
of solid minerals by 11.1 per cent to 53.61 million tonnes in 2011. All the principal
minerals, especially limestone, barite, sand & stone aggregates, laterite, shale
and lead/zinc contributed to the growth in output.
6.3.3 Electricity Generation
Total installed electricity generation capacity stood at 9287 MW in 2011,
reflecting an increase of 5.4 per cent over the level in 2010. The additional
capacity came from Olorunshogo II power plant which commenced operation
in the year. A disaggregation of the installed capacity showed that hydro-
power and thermal power accounted for 20.9 and 79.1 per cent, respectively.
Further analysis showed that the former Power Holding Company of Nigeria
(PHCN) had 74.1 per cent of the total installed capacity, while the Independent
Power Plants (IPPs) accounted for the balance.
Hydro-Power 20.9%
PHCN74.1%
IPPs25.9%
Others (Thermal)
79.1%
Figure 6:10 Nigeria' Power System Composition in
2011
6

Central Bank of Nigeria Annual Report—2011
160
At 3,086.1 mega-watts per hour (MW/h), electricity generation increased by 1.9
per cent above its level in 2010. The increase was attributed to improved gas
supply to the thermal stations, refurbishment of power generation stations, and
the commencement of operation at the Olorunshogo II Power Plant.
Figure 6.11: Electric Power Generation
6.3.4 Energy Consumption
At 194.7 (1990=100), the index of energy consumption fell marginally by 0.2 per
cent, compared with a decline of 3.2 per cent recorded in 2010. In absolute
terms, aggregate energy consumed in 2011 stood at 17.6 million tonnes of coal
equivalent (tce), compared with 17.7 million tce in the preceding year,
representing a marginal decline of 0.4 per cent. The decline was attributed to
the decline in the consumption of coal, hydro-power and natural gas which fell
by 14.2, 7.7 and 6.4 per cent, respectively.
6.3.4.1 Electricity Consumption
At 2,703.0MW/h, electricity consumption increased by 13.4 per cent above the
level of 2,383.1 MW/h in 2010. The development was attributed to enhanced
generation and improvement in transmission and distribution infrastructure.
0
500
1000
1500
2000
2500
3000
3500
2007 2008 200 2010 2011
6

Central Bank of Nigeria Annual Report—2011
161
Figure 6.12: Electric Consumption, 2007 - 2011
6.3.4.2 Hydropower Consumption
At 3,305,962.9 ton coal equivalent (tce), hydropower consumption in 2011
declined by 7.7 per cent, compared with the level in 2010. This was due to a fall
in electricity generated at the Kainji and Jebba power plants, which declined
by 34.5 and 14.3 per cent, respectively.
6.3.4.3 Coal Consumption
Aggregate coal consumption in 2011 was estimated at 39,213.4 tonnes,
representing a decrease of 14.2 per cent, compared with 45,713.1 tonnes
recorded in 2010. The decline in coal consumption was as a result of the shift to
other sources of energy which are more environmentally- friendly.
6.3.5 Industrial Financing
6.3.5.1 The Nigeria Export-Import Bank (NEXIM)
The sum of N8.55 billion was disbursed by NEXIM, under different facilities, to
beneficiaries in 2011. Of this amount, N6.94 billon and N960.00 million were for
standing and export credit guarantee facilities, respectively. The refinancing
and rediscounting facility got N445.00 million, while N200.00 million and N2.00
million were disbursed under the direct lending and start-your-own business
facilities, respectively.
A sectoral distribution showed that the manufacturing sector received the
highest amount of N5.20 billion or 61.0 per cent of the total, while the
0
500
1000
1500
2000
2500
3000
2007 2008 200 2010 2011
6

Central Bank of Nigeria Annual Report—2011
162
agricultural and solid mineral sectors got 14.0 and 13.9 per cent, respectively,
and the service sector accounted for the balance of 11.1 per cent.
Figure 6.13: Sectoral Distribution of NEXIM’s Credit in 2011
6.4 TRANSPORTATION AND COMMUNICATIONS
6.4.1 Aviation Services
6.4.1.1 Policy and Airport Development
The sub-sector witnessed a boost as the rehabilitation of airports across the
country commenced. The rehabilitation works covered eleven (11) airports:
Murtala Muhammed International Airport, Lagos; Murtala Muhammed Airport
(General Aviation Terminal), Lagos; Nnamdi Azikwe International Airport, Abuja;
Port Harcourt International Airport, Port Harcourt; Kaduna Airport, Kaduna;
Margaret Ekpo International Airport, Calabar; Benin Airport, Benin-City; Akanu
Ibiam International Airport, Enugu; Sam Mbakwe Airport, Owerri; Yola Airport,
Yola; and Yakubu Gowon Airport, Jos. The cost of the special renovations and
upgrades was put at N19.0 billion. The Federal Airports Authority of Nigeria
(FAAN) maintained international standards for passenger safety and security.
This resulted in a relatively safe year with no recorded accident in the
programmed regular flight category.
Manufacturing 61%
Agriculture 14%
Solid Minerals 14%
Services 11%
6

Central Bank of Nigeria Annual Report—2011
163
6.4.1.2 Domestic Operations
The operations of airlines on domestic routes witnessed improvements in 2011.
The number of passengers airlifted increased by 2.8 per cent, from 10.7 million in
2010 to 11.0 million in 2011. Aircraft movement increased by 6.1 per cent to
218,482 in 2011. The increase in passenger traffic and aircraft movement
reflected increased government funding and regulation, an improvement in
airline service delivery and greater public confidence in the sector.
6.4.1.3 International Operations
The operational performance of airlines on the international routes improved
significantly in 2011, as the number of passengers airlifted on the routes
increased by 21.9 per cent to 3.9 million in 2011, compared with 3.2 million in
2010. International flights also increased by 24.1 per cent, from 34,981 in 2010 to
43,395. The development was attributed to an improved business climate in the
country, stable macroeconomic policies, improved infrastructure, and an
enhanced investor confidence in the economy.
6.4.2 Railway Services
The Nigerian Railway Modernisation Project, which started in 2009 continued in
2011. The major projects in 2011 were: the rehabilitation of the 488 km Lagos-
Jebba track with 97.0 per cent completion;
rehabilitation of 636 km Jebba-Kano track
with 80.0 per cent completion; and
mobilization of contractors for the eastern
and Zaria-Kaura Namoda lines
rehabilitation. Other major projects were: workshop and training school
rehabilitation with 80.0 per cent completion; procurement of additional 40
wagons and rehabilitation of two locomotives; procurement of three railroad
recovery vehicles, as well as the rehabilitation of stations, buildings, bridges and
culverts. During the year, the Nigeria Railway Corporation (NRC) entered into a
number of MoUs with some strategic business partners which included the Osun
The Nigerian Railway Modernization Project
which started in 2009 continued in 2011.
6

Central Bank of Nigeria Annual Report—2011
164
State Government for the running of freight and passenger train services and
the Reynolds Construction Company (RCC) for the lifting of 100,000 metric tons
of lump stone and sand traffic.
In terms of passenger carriage, the mass transit service of the NRC moved 3.1
million passengers in 2011, compared with 1.5 million in 2010, an increase of
107.7 per cent. The freight moved stood at 181,860 tons in 2011, as against
139,377 tons in 2010, an increase of 30.5 per cent. In addition, the corporation
generated N684.8 million revenue in 2011, compared with N287.1 million in 2010,
an increase of 138.5 per cent.
6.4.3 Maritime Services
The Nigerian maritime sector remained attractive for investors. During the year,
a leading ship building firm from Asia signed an agreement to build a US$7.0
billion shipyard in Bayelsa State. The Federal Government continued the pursuit
of key maritime programmes in the areas of security, safety, labour, marine
environmental practices, human capacity building, and development of
infrastructure, in recognition of the need to have a platform for promoting
indigenous tonnage and capacity.
The Joint Committee of Freight Forwarders (JACOFF), was formed to bring
almost all the freight forwarding associations under the same umbrella to
engender transparency and probity in the sector. It was part of the on-going
reform programmes in the maritime sector. The Federal Government intensified
efforts to promote the utilization of inland waterways. It continued the dredging
of the lower River Niger from Lokoja to Onitsha to harness economic benefits
and reduce the risks associated with road haulage.
The cargo throughput handled in Nigerian ports increased by 10.5 per cent,
from 74,910,284 in 2010 to 82,763,384 metric tons in 2011. Similarly, ship traffic at
Nigerian ports increased in 2011 with the number of ocean-going vessels at
6
6

Central Bank of Nigeria Annual Report—2011
165
5,327, reflecting an increase of 7.4 per cent. The gross tonnage of ocean-going
vessels increased by 13.1 per cent to 122.0 million, compared with 108.6 million
in 2010. Laden container traffic throughput increased by 22.2 per cent, from
668,697 units in 2010 to 817,246 in 2011.
6.4.4 Communications
The communications sector sustained its growth in 2011, driven mainly by the
Global System of Mobile Communications (GSM). However, the challenge of
quality service delivery persisted.
Table 6.4: The Nigerian Telecommunications Market Statistics, 2007 - 2011
2007 2008 2009 2010 2011
No. of Active Fixed Wired/Wireless Lines (‗000) 1,580 1,308 1,481 1,050 753
No. of Active Digital Mobile Lines (million) 55.24 62.99 73.1 87.29 94.63
No. of National Carriers 2 2 2 2 2
No. of Operating ISPs 117 83 - - -
No. of Active Licensed Fixed Line Operators 29 20 22 - -
Number of Licensed Mobile Operators 4 9 8 8 8
Teledensity 29.98 45.93 53.23 63.11 68.13
Cumulative Investment ( US$ million) 11,500 12,000 18,000 - -
Source: Nigerian Communications Commission (NCC)
As at end-December 2011, the combined active subscriber base of the
telecommunications sub-sector had increased by 8.0 per cent, over its level in
December 2010, to a total of 95,886,714 active lines (719,406 fixed
wired/wireless and 95,167,308 mobile lines). Thus, the teledensity increased from
63.11 to 68.5 lines per 100 inhabitants over the same period. This has consistently
exceeded the International Telecommunication Union (ITU) minimum standard
of 1:100. In addition, the sub-sector grew by 35.0 per cent in 2011 and
accounted for 5.6 per cent of the GDP.
Other developments in the sub-sector included the successful implementation
of the compulsory SIM card registration which started in May 2010; the
introduction of a mobile money policy by the CBN to promote financial
6

Central Bank of Nigeria Annual Report—2011
166
inclusion; the e-registration exercise carried out by the Independent National
Electoral
Commission (INEC), and the launching of the NigComSat-1R at the Xichang
Satellite Launch Centre, among others.
The sector in 2011 witnessed the creation of a new Information and
Communication Technology (ICT) Ministry. Two e-libraries were established in
each state of the federation by the Universal Service Provision Fund (USPF) of
the NCC. The project was aimed at sensitising Nigerians on IT usage and
boosting IT education in the country.
6.5 CONSUMER PRICES
Inflationary pressure was largely contained in 2011 though the rate remained
above the single digit. Data from the NBS showed that the all-items composite
Consumer Price Index (CPI) stood at 126.0 (November 2009=100) in December
2011, compared with 114.2 in December 2010. This represented a year-on-year
headline inflation of 10.3 per cent, which was lower than the rate at end-
December 2010 by 1.5 percentage points. A trend analysis indicated that
inflation dropped from12.1 per cent at end- January 2011, to 9.3 per cent in
August, before assuming an upward trend to 10.3 per cent from the end of the
third quarter to end-December 2011. Core inflation (all-items, less farm
0
10
20
30
40
50
60
70
80
010,000,00020,000,00030,000,00040,000,00050,000,00060,000,00070,000,00080,000,00090,000,000
100,000,000
2007 2008 2009 2010 2011
Figure 6.14: Trends of Total Connected Lines and Teledensity, 2007 - 2011
Fixed Wired/Wireless Mobile Teledensity (Right Axis)
6

Central Bank of Nigeria Annual Report—2011
167
produce) was 12.1 per cent at end-January, but fell to 10.9 per cent at end-
August 2011. It fell further to close at 10.8 per cent at end-December 2011.
Food inflation, which was 10.3 per cent at end-January, fell to 9.2 and 8.7 per
cent at end-June and end-August, respectively, before trending upwards to
close at 11.0 per cent at end-December, 2011.
Urban inflation followed a similar pattern with headline inflation as the all-items
index closed the year at 9.0 per cent,
compared with 10.7 per cent at end –
December 2010. Core urban inflation and
food urban inflation were 9.7 and 9.8 per
cent at end-December, compared with 9.8 and 11.6 per cent in 2010,
respectively.
All three components of rural inflation also declined in 2011. At 11.3 per cent at
end-December 2011, the all-items inflation fell by 1.4 percentage points,
compared with end-December 2010. Similarly, rural core and rural food inflation
both fell from 11.9 per cent each at end-December to 11.7 per cent each.
2007 2008 2009 2010 2011
January 8 8.6 14 14.4 12.1
February 7.1 8 14.6 15.6 11.1
March 5.2 7.8 14.4 14.8 12.8
April 4.2 8.2 13.3 15 11.3
May 4.6 9.7 13.2 12.9 12.4
June 6.4 12 11.2 14.1 10.2
July 4.8 14 11.1 13 9.4
August 4.2 12.4 11 13.7 9.3
September 4.1 13 10.4 13.6 10.3
October 4.6 14.7 11.6 13.4 10.5
November 5.2 14.8 12.4 12.8 10.5
December 6.6 15.1 13.9 11.8 10.3
Average 5.4 11.5 12.6 13.8 10.9
Table 6.5: Annual Headline Inflation Rates (Year-on-Year) (per cent)
Inflationary pressure was largely contained in 2011 though the rate remained above the
single digit.
6

Central Bank of Nigeria Annual Report—2011
168
1/ 12 MMA is a 12-month moving average
The 12-month moving average headline inflation rate was 10.8 per cent in 2011,
compared with 13.7 per cent at end-December 2010.
The inflation trend in the year was attributed to several factors such as the
prevalence of favourable weather
conditions in the year, which led to good
harvests for most crops, relative stability of
the naira exchange rate, and improved
supply and relatively stable prices of petroleum products. The inflation rate at
the end of the year exceeded both the national and the WAMZ single-digit
inflation rate targets.
-5
0
5
10
15
Jan Feb Mar Apr May Jun Jul Aug Sept Oct Nov Dec
Rat
es (
per
cen
t)
Figure 6.15: Trends in Inflation in 2011
Year-on-Year 12 MMA Month-on-Month
0
5
10
15
Jan Feb Mar Apr May Jun Jul Aug Sept Oct Nov Dec
Rat
es (
per
cen
t)
Figure 6.16: Trends in Inflation (Composite, Core and Food) in 2011
Composite Core Food
6
Inflationary rate at the end of the year exceeded both the national and the WAMZ
single-digit inflation rate target.

Central Bank of Nigeria Annual Report—2011
169
6.6 UNEMPLOYMENT
The National Bureau of Statistics (NBS), in 2011, conducted the General
Household Survey (GHS) under the auspices of the Annual NBS/CBN
Collaborative Survey initiative. The result of the survey showed that the national
unemployment rate increased to 23.9 per cent in 2011, from 21.4 per cent in
2010. The unemployment rate in the rural and urban areas was 25.6 and 17.1
per cent, compared with 20.7 and 22.8 per cent, respectively, in 2010. The
unemployment rate by gender was 23.5 and 24.3 per cent for males and
females, respectively.
2007 2008 2009 2010 2011
Total Population 144,925,607 149,563,227 154,349,250 159,288,426 167,912,561
Economically Active 81,448,191 84,054,533 86,744,278 89,520,095 92,384,738
Labour Force 59,294,283 61,191,700 63,149,835 65,170,629 67,256,090
Employed 51,763,909 52,074,137 50,709,317 51,224,115 51,181,884
Unemployed 7,530,374 9,117,563 12,440,517 13,946,515 16,074,205
Newly Unemployed 463,323 1,587,189 3,322,954 1,505,997 2,127,691
Unemployment Rate (%) 12.7 14.9 19.7 21.4 23.9
Table 6.6: Labour Statistics, 2007 - 2011
Source: NBS
State Rate State Rate State Rate
Abia 11.2 Enugu 25.2 Niger 39.4
Adamawa 33.8 Gombe 38.7 Ogun 22.9
Akwa Ibom 18.4 Imo 26.1 Ondo 12.5
Anambra 12.2 Jigawa 35.9 Osun 3.0
Bauchi 41.4 Kaduna 30.3 Oyo 8.9
Bayelsa 23.9 Kano 21.3 Plateau 25.3
Benue 14.2 Katsina 28.1 Rivers 25.5
Borno 29.1 Kebbi 25.3 Sokoto 17.9
Cross River 18.2 Kogi 14.4 Taraba 12.7
Delta 27.2 Kwara 7.1 Yobe 35.6
Ebonyi 23.1 Lagos 8.3 Zamfara 42.6
Edo 35.2 Nasarawa 36.5 FCT Abuja 21.1
Ekit i 12.1
Table 6.7 Unemployment Rate by State in 2011
Source: NBS
6

Central Bank of Nigeria Annual Report—2011
170
Items Urban Rural Composite Urban Rural Composite Urban Rural Composite
Educational Group
Never Attended School 20.6 20 20.1 19.2 17.7 17.9 19 22.8 22.4
Below Primary 18.4 22.9 22.3 24.9 23.1 23.5 - - -
Primary 15.1 14.7 14.8 21.8 21.8 21.8 15.5 22.7 21.5
Secondary 21.4 25.3 23.8 - - - - - -
Modern School - - - - - - 14.5 27.5 24.3
Post Secondary 13.9 26.4 21.3 - - - - - -
JSS - - - 24.5 22.4 23.1 16.6 36.9 33.4
Vocational/Commercial - - - 27.9 24.1 25.7 34.5 27 28.7
SSS - - - 24.2 23.6 23.9 13.9 22.5 20.1
A Levels - - - - - - 34.1 29.7 31
NCE/OND/Nursing - - - 22.3 20.4 21.5 17.2 22.5 20.2
B.A/B.Sc./B.Ed./HND - - - 24 21.5 23.1 16.8 23.8 20.2
Tech/Professionals - - - - - - 5 27.9 20.6
M.Sc/M.AM.Admin - - - 20.7 18.5 20.1 3.2 8.3 5.1
Doctorate - - - 19.6 19.6 19.6 11.1 7.7 9.1
Others - - - 22 23.7 22.8 31.3 36.1 35.5
Age Group
15-24 49.9 39.6 41.6 26 24.8 25.2 33.5 38.2 37.7
25-44 16.3 17.3 17.1 22.7 19.6 20.7 16.3 24.1 22.4
45-59 10 12.1 11.5 20.8 19.3 19.9 12.5 19.6 18
60-64 18.2 16.2 16.7 22.5 20.6 21.3 17.8 22.1 21.4
Gender
Male 17.2 16.9 17 21.6 18.5 19.6 16.9 25.1 23.5
Femal 21.7 23.9 23.3 24.2 23.1 23.5 17.2 26.1 24.3
National 19.2 19.8 19.7 22.8 20.7 21.4 17.1 25.6 23.9
2009 2010 2011
Table 6.8 Unemployment Rate by Educational Level, Age Group and Gender
Source: NBS/CBN/NCC GHS 2009 & 2010
6.7 THE SOCIAL SECTOR
6.7.1 Demography
The National Population Commission (NPC) estimated Nigeria‘s population at
167.9 million in 2011, based on an annual population growth rate of 2.3 per
cent. A breakdown of the figure showed that 82.1 million or 48.9 per cent were
females while males accounted for 85.8 million or 51.1 per cent.
6.7.2 Education
The education sector was plagued by instability in 2011, arising from various
prolonged strike actions, the closure of a number of illegal universities, as well as
an accreditation crisis in some tertiary institutions.
6

Central Bank of Nigeria Annual Report—2011
171
The Education Tax Fund (ETF) Act was amended to become Tertiary Education
Tax Fund (TETFUND) Act for funding tertiary education in the country.
Furthermore, nine (9) federal universities were established in Ebonyi, Kogi,
Nasarawa, Gombe, Taraba, Katsina, Jigawa, Ekiti, and Bayelsa States. The
National Universities Commission (NUC) embraced a cross-border university
education approach to encourage foreign universities to offer degree
programmes in Nigeria.
During the period, the Federal Government approved a new education
system, the 1-6-3-3-4 to replace the existing 6-3-3-4. The new system entails a
compulsory one-year early childhood education (ECE) for five-year old pupils,
six years of primary, three years of junior secondary, three years of senior
secondary, and four years of higher education.
The Nigerian Educational Research and Development Council (NERDC)
introduced the new Senior Secondary School Curriculum in 2011. The new
curriculum has five core subjects – English Studies, General Mathematics,
Entrepreneurial Trade, Computer Studies, and Civic Education. It also has four
distinct fields of study – Senior Secondary Education Science, Humanities,
Technology and Business, with 34 entrepreneurial trades to provide the required
skills for job creation and poverty eradication.
6.7.3 Health
In a bid to expand the scope of health care delivery, the Federal Government
vigorously pursued collaboration with foreign partners in 2011. These efforts
culminated in the signing of a number of MoUs. These included: public health
collaboration between the governments of Nigeria and Austria collaboration
on Reproductive Health between the Nigerian government and the United
Nations Population Fund; renewal of the MoU between the Nigerian
government and the University of Texas MD Anderson Cancer Centre on
cancer control; and the Workforce Training and Capacity Building between the
government of Nigeria and the Griffith University, Australia.
6

Central Bank of Nigeria Annual Report—2011
172
Achievements in the sector included the reduction of the wild polio virus
transmission by 95.0 per cent; the establishment of mass cancer screening
centres and the Nigeria Centre for Disease Control; and distribution of over four
million insecticide-treated nets and 17.5 million free contraceptive
commodities.
Others were: completion of the FGN/VAMED project at the University of Benin
Teaching Hospital (UBTH), Benin-City, and at Obafemi Awolowo University
Teaching Hospital (OAUTH), Ile-Ife; and the establishment of a stem cell
transplantation centre at UBTH. In addition, the Avian Influenza Intensive Care
Unit at the University of Abuja Teaching Hospital (UATH), Gwagwalada, was
commissioned.
6.7.4 Poverty
Anecdotal evidence showed that the measures of the poverty level in Nigeria
worsened in 2011, when compared with their levels in 2010. The estimated
poverty measures, using the relative, absolute and US dollar-per-day, were 71.5,
61.9 and 62.8 per cent, respectively.
Table 6.9 Nigeria’s Poverty Profile
2004 2010 2011
Est imated Population (Million) 126.3 163 168
Relative Poverty (%) 54.4 69 71.5
Absolute Poverty (%) 54.7 60.9 61.9
Dollar Per Day (%) 62.8 61.2 62.8
Source: NBS Nigeria Poverty Profile 2010 Report; 2011 figures are estimates.
6

Central Bank of Nigeria Annual Report—2011
173
n 2011, the overall Balance of Payments (BOP) position swung from a deficit of N1,491.5
billion or 4.4 per cent of Gross Domestic Product(GDP) in 2010, to a surplus of N47.1 billion,
representing 0.1 per cent of GDP. The current account recorded a surplus of N1, 336.8 billion
which surpassed the deficit of N831.4 billion in the capital and financial account. However, the
current account surplus, as a percentage of GDP declined from 5.9 per cent in 2010 to 3.6 per
cent attributed mainly to the higher deficits in the services and income accounts. The
impressive performance of export trade reflected favourable development in the oil sector. The
price of Nigeria‟s reference crude, Bonny Light (370 API), grew on an annualized basis from an
average of US$81.6 per barrel in 2010 to US$113.8 in 2011, an increase of 39.5 per cent. Similarly,
the volume of crude oil production and exports increased from an average of 2.1 and 1.6
mbpd in 2010 to 2.2 and 1.7 mbpd, respectively. The capital and financial account outcome
constituted 2.2 per cent of GDP. External debt increased, but remained within a tolerable limit.
The external reserves rose slightly by 0.9 per cent to US$32.6 billion at end-December 2011, and
could finance 6.3 months of current import commitments. Movement in the Naira/US dollar
exchange rate was relatively stable throughout the year in all segments of the foreign
exchange market. The external sector however remained vulnerable and faces the challenges
of non-diversification and rising external debt.
7.1 BALANCE OF PAYMENTS
7.1.1 Major Developments
The external sector improved in 2011 with an estimated overall balance of
payments surplus of N47.1 billion (US$0.3 billion), or 0.1 per cent of GDP, in
contrast to a deficit of N1, 491.5 billion (US$10.0 billion) in 2010. The surplus in the
current account declined to N1, 336.8 billion (US$8.8 billion), or 3.6 per cent of
GDP, which was lower than the N1, 993.0 billion (US$13.4 billion), or 5.9 per cent
of GDP, recorded in 2010. This development was accounted for by the
widened deficits of 18.8 and 20.0 per cent in both services and income
accounts (net). Inward transfers, however, increased by 7.8 per cent to N3,
355.2 billion (US$22.0 billion). The capital and financial account recorded a
deficit of N831.4 billion (US$5.4 billion), or 2.2 per cent of GDP, compared with
I
CHAPTER SEVEN
EXTERNAL SECTOR DEVELOPMENTS

Central Bank of Nigeria Annual Report—2011
174
the surplus of N305.6 billion (US$2.1 billion), or 0.9 per cent of GDP in 2010.
External debt stock increased by 23.8 per cent from US$4.6 billion in 2010 to
US$5.7 billion, but remained sustainable.
-20
-10
0
10
20
30
40
50
2007 2008 2009 2010 2011
Figure 7.1: Balance of Payments (per cent GDP), 2007 - 2011
Current Account Balance Overall Balance
Capital & Financial Account Balance Export of Goods and Servces
Import of Goods & Services
7

Central Bank of Nigeria Annual Report—2011
175
2008 2009 2010 2011 2008 2009 2/ 2010 3/ 2011
CURRENT ACCOUNT 3,450.59 2,057.95 1,993.00 1,336.79 29.30 13.97 13.42 8.76
Goods 5,438.77 3,773.35 4,546.10 4,746.35 46.18 25.62 30.61 31.11
Exports (fob) 10,161.49 8,356.39 11,490.30 14,231.45 86.27 56.74 77.37 93.27
Imports (fob) -4,722.72 -4,583.04 -6,944.20 -9,485.10 -40.10 -31.12 -46.76 -62.16
Services(net) -2,621.05 -2,453.71 -2,743.23 -3,259.47 -22.25 -16.66 -18.47 -21.36
Credit 268.32 330.24 463 521.06 2.28 2.24 3.12 3.41
Debit -2,889.37 -2,783.95 -3,206.22 -3,780.53 -24.53 -18.90 -21.59 -24.78
Income(net) -1,784.95 -2,144.67 -2,921.79 -3,505.31 -15.15 -14.56 -19.67 -22.97
Credit 278.77 139.26 149.96 138.10 2.37 0.95 1.01 0.91
Debit -2,063.71 -2,283.93 -3,071.75 -3,643.40 -17.52 -15.51 -20.68 -23.88
Current transfers(net) 2,417.82 2,882.98 3,111.92 3,355.22 20.53 19.58 20.95 21.99
Credit 2,480.72 2,952.02 3,183.76 3,427.82 21.06 20.04 21.44 22.46
Debit -62.91 -69.04 -71.84 -72.61 -0.53 -0.47 -0.48 -0.48
CAPITAL AND FINANCIAL ACCOUNT -992.28 1862.6 305.56 -831.41 -8.42 12.65 2.06 -5.45
Financial account(net) -992.28 1,862.60 305.56 -831.41 -8.42 12.65 2,06 -5.45
Assets -2,157.31 248.21 -834.77 -3,096.42 -18.32 1.69 -5.62 -20.29
Direct investment (Abroad) -124.65 -227.09 -137.03 -125.67 -1.06 -1.54 -0.92 -0.82
Portfolio investment -560.5 -122.35 -167.85 -247.64 -4.76 -0.83 -1.13 -1.62
Other investment -1,275.80 -966.05 -2,021.37 -2,676.05 -10.83 -6.56 -13.61 -17.54
Reserve assets -196.37 1,563.69 1,491.48 -47.06 -1.67 10.62 10.04 0.31
Liabilities 1,165.03 1,614.39 1,140.33 2,265.01 9.89 10.96 7.68 14.84
Direct investment (in reporting economy) 971.54 1,273.82 905.73 1,360.31 8.25 8.65 6.10 8.91
Portfolio investment 157.16 70.94 556.59 792.36 1.33 0.48 3.75 5.19
Other investment liabilities 36.33 269.64 -321.99 122.34 0.31 1.83 -2.17 0.74
NET ERRORS AND OMISSIONS -2,458.31 -3,920.55 -2,298.56 -505.39 -20.87 -26.62 -15.48 -3.31
Memorandum Items:
Current Account Balance as % of G.D.P 14.20 8.30 5.86 3.58 14.20 8.30 5.86 3.58
Capital and Financial Account Balance as % of G.D.P -4.08 7.51 0.90 -2.23 -4.08 7.51 0.90 -2.23
Overall Balance as % of G.D.P 0.81 -6.31 -4.39 -0.13 0.81 -6.31 -4.39 -0.13
External Reserves - Stock (US $ million) 53,000.36 42,382.49 32,339.25 32,639.78 53,000.36 42,382.49 32,339.25 32,639.78
Number of Months of Imports Equivalent 15.86 16.34 7.92 6.30 15.86 16.34 7.92 6.30
External Debt Stock (US$ million) 3,720.00 3,947.30 4,578.77 5,666.58 3,720.00 3,947.30 4,578.77 5,666.58
Effective Central Exchange Rate (N/$) 117.78 147.27 148.51 152.59 117.78 147.27 148.51 152.59
Average Exchange Rate (N/$) 118.53 148.90 149.74 153.85 118.53 148.90 149.74 153.85
End-Period Exchange Rate (N/$) 132.56 149.58 150.66 158.27 132.56 149.58 150.66 158.27
Table 7.1: Summary of the Provisional Balance of Payments Statement 1/
N’ billion US$’ billion
1/ The conversion for BOP purposes was based on the mid-point or the effective central exchange rate.
2/ Provisional
3/ Overall balance mirrors the movement in external reserves
Source: CBN, Statistics Department
7

Central Bank of Nigeria Annual Report—2011
176
7.2 THE CURRENT ACCOUNT
The current account recorded a surplus of N1,336.8 billion (US$8.8 billion) in 2011
compared with the N1,993.0 billion surplus (US$13.4 billion) in 2010. Trade surplus
(goods account) increased by 4.4 per cent from N4,546.1 billion (US$30.6 billion)
in 2010 to N4,746.3 billion (US$31.1 billion),
owing to higher exports of N14,231.5 billion, or
38.2 per cent of GDP, which outweighed
import bills of N9,485.1 billion or 25.4 per cent
of GDP. The deficit in the services account
widened by 18.8 per cent to N3,259.5 billion in the review period. Similarly,
deficit in the income accounts enlarged by 20.0 per cent to N3,505.3 billion,
owing to increased repatriation of dividend and distributed profits by non-
resident investors. Current transfers (net), representing mainly home remittances
by Nigerians abroad, increased by 7.8 per cent to N3,355.2 billion (US$22.0
billion).
7.2.1 The Goods Account
The goods account (fob), adjusted for balance of payments, recorded a
surplus of N4,746.3 billion, indicating an increase of 4.4 per cent. Aggregate
exports grew by 23.9 per cent and represented 38.2 per cent of GDP. This
reflected the substantial earnings from crude oil exports. The oil and non-oil
components of unadjusted merchandise trade (imports and exports) increased
by 30.7 and 22.8 per cent, to N16,789.8 billion and N7,676.8 billion, respectively.
The oil sector component continued to dominate total trade as its share
increased marginally from 67.3 per cent in 2010 to 68.6 per cent in 2011. The
degree of openness of the economy, as measured by the ratio of total
trade/GDP was 65.6 per cent as against 56.2 per cent in 2010.
The current account recorded a surplus of N1,336.8 billion (US$8.8 billion), reflecting the growth in higher exports of 38.2 per cent of GDP which outweighed import bills of 25.4 per cent of GDP and increased home remittances.
7

Central Bank of Nigeria Annual Report—2011
177
Figure 7.2: Value of Imports, Exports and Trade Balance
7.2.1.1 Imports: Cost and Freight (c&f)
The total imports unadjusted for balance of payments increased by 34.4 per
cent to N10,235.2 billion (27.4% of GDP). The huge import bills were as a result of
higher demand, to meet domestic
production gaps, industrial needs in the
form of raw-materials and capital goods, as
well as imports for production in the oil
sector. A breakdown of imports, using
returns by DMBs on foreign exchange
utilization, revealed that oil sector imports accounted for 34.1 per cent of the
total, industrial imports (23.8%), food products (16.4%), manufactured goods
(14.6%), transport (5.5%), minerals (4.5%), and agricultural sector imports (1.1%).
(a) Imports by End-User
Analysis of aggregate imports by end-users revealed that the share of
consumer goods declined by 0.06 percentage point to 43.3 per cent in 2011.
Within the category, durable consumer goods constituted the bulk of the
imports with a share of 28.6 per cent. Capital goods and raw material imports
as a group constituted 56.1 per cent, with raw materials (chemicals) and
capital goods (spare parts and agricultural machinery) accounting for 12.5 and
-
2,000.00
4,000.00
6,000.00
8,000.00
10,000.00
12,000.00
14,000.00
16,000.00
2007 2008 2009 2010 2011
N'm
illio
n
Export Import Trade Balance
The huge import bills were as a result of higher demand, to meet domestic production gaps, industrial needs in the form of raw-materials and capital goods, as well as imports for
production in the oil sector.
7

Central Bank of Nigeria Annual Report—2011
178
43.6 per cent, respectively. Miscellaneous (unclassified imports) accounted for
the remaining 0.6 per cent.
Figure 7.3: Imports by Major Groups in 2011
(b) Non-oil Imports by Country of Origin
A disaggregation of imports by country
showed that, imports from Asian countries
(excluding Japan) was the dominant source
in 2011 and accounted for 39.6 per cent. The
Peoples‘ Republic of China ranked highest in
the group, with a share of 20.0 per cent of the total. Imports from industrialized
countries accounted for 35.5 per cent, up from 35.0 per cent in 2010, with the
USA topping the list with a share of 11.4 per cent. The share of imports from
African countries declined from 2.7 per cent in 2010 to 2.1 per cent in the
review period.
Consumer Goods, 43.3%
Capital Goods & Raw Materials,
56.1%
Miscellaneous, 0.6%
Available data revealed that imports from Asian counties (excluding Japan) became the dominant source in 2011 and accounted for
39.6 percent.
7

Central Bank of Nigeria Annual Report—2011
179
Figure 7.4: Non-oil Imports by Origin in 2011
7.2.1.2 Exports: Free on Board (fob)
Aggregate exports grew by 23.9 per cent in
2011 to N14,231.5 billion (US$93.3 billion),
reflecting the substantial earnings from crude
oil exports occasioned by the high
international price of crude oil, as well as
stable domestic production. The oil sector accounted for 96.6 per cent of the
total, while non-oil exports accounted for the remainder. The continued
dominance of oil exports has made the Nigerian economy susceptible to
external shocks.
[a] Direction of Oil Exports
The Americas as a group constituted the largest buyer of Nigeria‘s crude oil,
followed by European and Asian
countries. The value of oil exports to the
Americas increased from N4,746.2 billion in
2010 to N5,736.3 billion. On a country-by-
country basis, the United States of America (USA) remained the largest single
importer of Nigeria‘s crude oil, accounting for 29.2 per cent of the total. Other
countries in the group were Uruguay (7.2%), Canada (6.3%), Argentina (1.9%),
Peru (0.6%) and Brazil (0.2%).
0
10
20
30
40
50
60
70
2007 2008 2009 2010 2011
% S
har
e o
f T
ota
l
Industrial Countries Africa Asia (excluding Japan) Others
The value of total exports grew by 23.9 per cent in 2011 to N14,231.5 billion, reflecting the substantial earnings from crude oil exports occasioned by the high international price of crude oil, as well as stable domestic production.
The US remained the largest single importer of Nigeria’s crude oil, accounting for 29.2 per cent of
the total.
7

Central Bank of Nigeria Annual Report—2011
180
The share of Asia and the Far East declined by 6.4 percentage points to 20.0
per cent in the review period. In value terms, the share of exports to Asia and
the Far East was N2,529.3 billion, with imports from India dominating the group,
followed by Indonesia. Despite the Eurozone crisis, the share of the European
countries‘ oil imports from Nigeria increased substantially from 131.5 million
barrels in 2010 to 228.0 million barrels. The value also increased by 112.2 per
cent to N3,368.9 billion with the Netherlands dominating the group, followed by
Spain, France and Italy. The share of crude oil exports to African countries
remained the lowest at 8.2 per cent, dominated by imports from South Africa,
Cameroun, Ghana and Cote d‘Ivoire. In the ECOWAS sub-region, Ghana was
the largest importer of Nigeria‘s crude oil, followed by Cote d‘Ivoire and
Senegal.
Figure 7.5: Direction of Crude Oil Exports, 2007 - 2011
[b] Non-oil Exports
The value of non-oil exports increased by 22.4 per cent to N485.2 billion in 2011.
This was attributed mainly to enhanced agricultural produce especially coca
beans, and improvement in production, processing and packaging of Nigeria‘s
manufactured and semi-manufactured products for overseas markets. Despite
this development, the non-oil sub–sector contributed only 3.4 per cent of the
total exports.
-
1,000.00
2,000.00
3,000.00
4,000.00
5,000.00
6,000.00
2007 2008 2009 2010 2011
Nai
ra B
illio
n
Africa Asia & Far East Americas Europe
7

Central Bank of Nigeria Annual Report—2011
181
Further analysis of non-oil exports by product showed that agricultural produce,
semi-manufactured goods, manufactured goods and solid minerals accounted
for 54.1, 30.6, 11.1 and 0.6 per cent of the total, respectively. Other exports,
which comprised petroleum-by products, charcoal, crafts and cement/lime
products, accounted for the remaining 3.7 per cent.
The agricultural produce category, which contributed 54.1 per cent of the total
non-oil exports, comprised cocoa beans, rubber, cotton, fish/shrimp, and
others. In the semi-manufactured category, leather and processed skins
accounted for 18.1 per cent, followed by cocoa products, contributing 4.3 per
cent, while others accounted for 7.8 per cent of the total.
Figure 7.6: Non-oil Exports by Product in 2011
[c] Non-oil Exports to the ECOWAS Sub-Region
Aggregate non-oil exports to the ECOWAS sub-region stood at US$251.7 million
in 2011. Non-oil exports to Ghana ranked highest with US$100.6 million, followed
by Niger, Togo, Benin, Cote d‘ Ivoire and Burkina Faso with US$45.9 million,
US$42.2 million, US$18.5 million, US$17.5 million and US$9.2 million, respectively.
Other importing countries from Nigeria included Guinea, Mali, Liberia and
Senegal. The dominant export products continued to be tobacco, plastics,
rubber, footwear and poly bags.
Agric. Product 54%
Minerals 1%
Semi-Manufactured
30%
Manufactured 11%
Others 4%
7

Central Bank of Nigeria Annual Report—2011
182
[d] Activities of Top 100 Non-oil Exporters
Gross export proceeds by the top 100 exporters amounted to US$2.0 billion in
2011. A ranking of the earnings by exporter revealed that Olam Nigeria Limited
retained the first position as in 2010 with receipts of US$444.0 million, or 22.2 per
cent of the total, largely through the export of sesame seeds and cocoa beans
to Japan and Europe. Bolawole Enterprises Nigeria Limited also retained
second position with earnings of US$146.0 million, or 7.3 per cent of the total,
from exports of cocoa beans largely to the Netherlands. Unique Leather
Finishing Company ranked third with US$124.1 million, or 6.2 per cent, exports of
leather to Italy. Imoniyame Holdings Limited and Saro Agro Allied Limited that
ranked fourth and fifth with US$97.8 million or 4.9 per cent, and US$79.5 million or
4.0 per cent, respectively in 2011. Clean State Commodities Limited and
Kolorkote Nigeria Limited were ranked ninety-ninth and hundredth with exports
valued at US$0.3 million each.
7.2.2 The Services Account
The deficit in the services account (net)
widened by 18.8 per cent from N2,743.2 billion
in 2010 to N3,259.5 billion. This was attributed
to out-payments in respect of financial
services, personal and business travels,
insurance, computer and information services, professional and technical
services, as well as operational leasing activities. However, deficits on freight,
communications and construction services reduced. The deficit in respect of
transportation, travels, government services and other business services
accounted for 30.5, 28.2, 4.9 and 28.3 per cent of total outflows, respectively.
The deficit in the services account (net) widened by 18.8 per cent from N2,743.2 billion
in 2010 to N3,259.5 billion.
7

Central Bank of Nigeria Annual Report—2011
183
Items 2007 2008 2009 2010 2011
Transportation 19.6 21.9 32.7 35.7 30.5
Travel 19.8 29.8 27.7 27.4 28.2
Insurance Services 1.9 2.5 2.8 2.7 3.3
Communication Services 1.7 1.7 1.2 1.3 0.8
Construction Services 0.6 0.6 0.5 0.7 0.4
Financial Services 0.0 0.0 0.1 0.1 1.4
Computer and Information Services 1.8 1.8 1.3 0.7 0.8
Royalties and Licence Fees 1.6 1.6 0.9 1.2 1.0
Government Services 16 4.6 4.9 5.5 4.9
Personal, Cultural & Recreational Services 0.0 0.0 0.0 0.3 0.4
Other Business Services 37.2 35.62 28.1 24.3 28.3
Table: 7.2 Percentage Share of Major Invisible Transactions
7.2.3 The Income Account
The deficit in the income account widened by 20.0 per cent to N3,505.3 billion
in the period under review. The development was attributed to higher out-
payments in respect of dividends and distributed profits, which increased by
20.5 percent to N3,097.9 billion. Both interest earnings on external reserves and
other investment assets by the monetary authorities declined by 4.7 and 35.6
per cent to N389.1 billion and N64.8 billion, respectively. This was attributed to
low interest rates in major financial centres accentuated by a continued lull in
global economic recovery.
0
10
20
30
40
2007 2008 2009 2010 2011
% o
f T
ota
l
Figure: 7.7 Percentage Share of Major Invisible Services
Transportation Travels Government Services Other Business Services
7

Central Bank of Nigeria Annual Report—2011
184
7.2.4 Current Transfers
The surplus in current transfers (net) widened by 7.8 per cent to N3,355.2 billion
in 2011. The inward transfers, largely accounted for by personal home
remittances, increased by 6.9 per cent in the review period. Also, general
government transfers, which are expenses on foreign embassies and payments
to international organizations, rose by 17.3 per cent.
2009 2010 2011
INFLOWS (credit)
1.General government (grants, ODA, Technical
Assistance & gifts)
236.9 240.3 282.0
2. Other sector workers‘ remittances and other transfers
in kind
2,715.1 2,943.4 3,145.8
OUTFLOWS (debit)
1.General government (Payments to International
Organizations & other payments)
17.5 25.3 18.0
2. Other sector workers‘ remittances and other transfers 51.5 46.6 54.6
NET CURRENT TRANSFERS 2,883.0 3,111.9 3,355.2
Table 7.3: Current Transfers (N Billion), 2009 - 2011
7.3 THE CAPITAL AND FINANCIAL ACCOUNT
The capital and financial account, at 2.2 per
cent of GDP, registered a deficit of N831.4
billion (US$5.4 billion), as against the surplus of
N305.6 billion (US$2.1 billion) in 2010. However,
the account witnessed increased foreign
direct investment (FDI) flows occasioned by
an improved investment climate, especially in the oil sector, with the relative
calm in the Niger-Delta region. Also, there was enhanced portfolio inflow in
money market instruments as non-residents can now repatriate their capital
within a year. Provisional data on FDI inflows, which comprised equity capital,
reinvested earnings and other capital, increased significantly by 50.2 per cent
to N1,360.3 billion (US$8.9 billion). FDI inflows were largely into the oil and gas,
banking, manufacturing and telecommunications sub-sectors. The outward FDI
The capital and financial account at 2.2 per cent of GDP, registered a deficit of N831.4 billion (US$5.4 billion), as against the surplus of N305.6 billion (US$2.1 billion) recorded in
2010.
7

Central Bank of Nigeria Annual Report—2011
185
flows declined by 8.3 per cent to N125.7 billion in 2011 as a result of the lull in
global economic activities occasioned by the political crisis in the Middle East
and North African (MENA)countries and the Eurozone debt crisis.
Portfolio investment registered an increase of 42.4 per cent over its level in the
preceding year. The increased inflow was accounted for by equity securities,
(49.9 per cent) and debt securities (50.1 per cent), of total portfolio flows in the
economy. The outward portfolio investment increased significantly by 47.5 per
cent to N247.6 billion in 2011.
A breakdown of other investment liabilities revealed that external debt rose
while fresh commitments increased debt stock from US$4.6 billion in 2010 to
US$5.7 billion. These loans were additional disbursements from the International
Development Agency (IDA), the African Development Bank (AfDB), and other
non-Paris club creditors as well as the issuance of a US$500.0 million 10-year
Eurobond. Other investment assets rose from N2,021.4 billion in 2010 to N2,676.0
billion, attributable largely to ‗other sector‘ claims on the economy.
The external reserves at US$32.6 billion recorded accretion of US$0.3 billion over
its end-December, 2010 level. This could support 6.3 months of imports, as
against the 3 months requirement under the convergence criteria of the West
African Monetary Zone (WAMZ).
7.4 CAPITAL IMPORTATION
Aggregate capital importation in 2011 was US$7.9 billion, as against US$6.0
billion in 2010. The highest inflow came from the United Kingdom (46.1%),
followed by the United States (18.8%), the Netherlands (9.7%) and South Africa
(4.8%). Other countries accounted for the remainder (20.6%).
7

Central Bank of Nigeria Annual Report—2011
186
Figure 7.8: Capital Importation by Country in 2011 (Per cent)
Further analysis of capital inflows by economic sector showed that the stock
market received a boost and accounted for 51.0 per cent of the total.
Investment inflow to the capital market amounted to US$4.0 billion, which was
used for the purchase of shares, indicating renewed investors‘ confidence in
the Nigerian capital market, following a series of reforms. The banking,
financing and manufacturing sub-sectors accounted for 11.1, 10.8 and 6.6 per
cent of total capital importation, respectively. Other sectors accounted for the
remaining 20.5 per cent.
Figure 7.9: Capital Importation by Sector in 2011 (Per cent)
UK 46.1%
USA 18.8%
South Africa 4.8%
The Netherlands 9.7%
Others 20.6%
Capital Market 51%
Banking 11%
Manufacturing 7%
Financing 11%
Others 20%
7

Central Bank of Nigeria Annual Report—2011
187
2008 2009 2010 2011 2008 2009 2010 2011
United Kingdom 4,105 731 2,732 3,644 Banking 4,681 2,624 909 876
United States 4,950 3,296 1,241 1,485 Shares 3,424 1,479 3,161 4,030
South Africa 468 224 537 381 Financing 749 205 171 851
Mauritius 216 77 161 278 Telecommunication 717 336 479 296
Netherlands 154 186 0.1 765 Prod./Manufacturing 504 294 854 520
Cyprus 83 64 45 64 Serv icing 94 33 179 48
Switzerland 73 69 58 47 Brewery - 60 25 73
Luxembourg - 4 121 25 Oil and Gas 641 114 89 22
Germany 18 23 62 221 Trading 63 37 35 26
Denmark 213 - 3 - Construction 130 13 43 42
Sweden 22 10 90 52 Hotels - - 2 -
China 36 139 9 58 Transport 14 50 3 -
United Arab
Emirates151 18 75 49 Marketing 21 28 0 1
Others 682 459 860 834 Others 133 27 44 1,118
TOTAL 11,171 5,300 5,994 7,903 TOTAL 11,171 5,300 5,994 7,903
Table 7. 4: Capital Importation: Country and Sector Inflows (US$ Million)
Source: CBN, Trade and Exchange Department
A breakdown of capital importation into its major components revealed that of
the total of US$7.9billion, FDI was (22.2%), portfolio investment (57.1%), and other
investments – trade credit, loans, currency deposits and other claims (20.7%).
FDI inflows increased significantly by 140.5 per cent over its level in 2010 as a
result of increased investment in equities. Portfolio flows at US$4.5 billion
increased by 14.8 per cent, from US$3.9 billion in 2010, accounted for by 46.7
per cent growth in equities, 9.6 per cent growth in money market instruments,
and 0.8 per cent growth in bonds. In the other investment category, loans,
which accounted for the bulk of the inflows, increased by 15.1 per cent.
7

Central Bank of Nigeria Annual Report—2011
188
NATURE OF CAPITAL 2008 2009 2010 2011
Foreign Direct Investment - Equity 4,597,675.27 3,305,678.28 668,350.88 1,498,906.99
Foreign Direct Investment - Other capital 63,605.92 20,719.32 60,602.15 254,439.30
Portfolio Investment - Equity 2,349,962.47 1,443,228.96 2,979,446.68 3,691,505.55
Portfolio Investment - Bonds 420,057.17 12,617.39 68,476.84 66,489.97
Portfolio Investment - Money Market Instruments 659,672.97 84,151.70 883,844.21 755,126.69
Other Investments - Trade Credits 15,000.00 7,915.11 154.88 1,366.51
Other Investments - Loans 2,735,581.53 816,670.00 1,399,457.35 1,611,294.41
Other Investments - Currency Deposits - 9,199.97 - -
Other Investments - Other Claims 328,133.49 2,708.16 2,225.41 24,640.31
TOTAL 11,169,688.82 5,702,888.88 5,994,150.02 7,903,769.73
Table 7.5: New Capital Inflows (US$’ Thousand)
Source: CBN, Trade and Exchange Department
7.5 THE INTERNATIONAL INVESTMENT POSITION (IIP)
Provisional data revealed that the deficit in net International Investment
Position (IIP) widened to US$10.3 billion, from US$9.8 billion in 2010, reflecting an
increased claims on the economy. The IIP account revealed that the value of
total foreign assets and liabilities amounted to US$98.3 billion and US$108.6
billion respectively, compared with US$83.9 billion and US$93.7 billion in 2010.
Both foreign assets and liabilities increased by 17.1 and 15.8 per cent,
respectively.
Further analysis revealed that, assets abroad – direct investment, portfolio
investment, external reserves and ―other foreign assets‖ amounted to US$5.9
billion, US$14.1 billion, US$32.6 billion and US$45.7 billion, respectively. Both direct
and portfolio investment stocks abroad increased by US$823.6 million and
US$1.4 billion respectively in 2011. Compared with 2010, the total official
reserves increased by 0.9 per cent to US$32.6 billion in 2011 and accounted for
33.2 per cent of Nigeria's total foreign assets.
7

Central Bank of Nigeria Annual Report—2011
189
The stock of liabilities, valued at US$108.6 billion, comprised direct investment
(US$69.2 billion), portfolio investment (US$23.3 billion) and other liabilities (loans
and foreign currency deposits) US$16.0 billion.
Figure 7.10: Assets and Liabilities: International Investment Position (IIP)
Figure 7.11: Net International Investment Position
40,000
60,000
80,000
100,000
2007 2008 2009 2010 2011
US
$ M
illio
n
Assets Liabilities
-15,000
-10,000
-5,000
0
5,000
10,000
15,000
20,000
2007 2008 2009 2010 2011
US
$ M
illio
n
7

Central Bank of Nigeria Annual Report—2011
190
Type of Asset/Liability 2007 2008 2009 2010 2011
Net international investment position of Nigeria 8,786.67 14,665.88 -5,224.41 -9,772.48 -10,272.20
Assets 75,505.24 91,275.85 80,804.65 83,935.26 98,279.48
Direct inv estment abroad 1,506.42 2,564.69 4,118.29 5,041.01 5,864.59
Portfolio inv estment abroad 6,208.32 10,967.09 11,797.86 12,739.73 14,092.16
Equities 5,643.86 9,710.55 10,472.09 11,508.15 12,995.82
Debt Securities 564.47 1,256.55 1,325.78 1,231.59 1,096.35
Other foreign assets 16,457.34 24,743.70 22,506.00 33,815.27 45,682.95
Trade Credits 1,812.57 2,122.47 51.74 5,133.12 6,609.49
Loans 1,167.69 1,459.61 1,842.22 2,069.69 2,269.28
Currency and Deposits 13,477.08 21,161.62 20,612.04 26,612.46 36,804.18
Reserv e Assets 51,333.15 53,000.36 42,382.49 32,339.25 32,639.78
Liabilities 66,718.57 76,609.97 86,029.06 93,707.74 108,551.68
Direct inv estment 37,329.54 45,578.18 54,227.71 60,326.67 69,241.56
Portfolio inv estment 12,368.69 13,702.99 14,368.88 18,116.78 23,309.58
Equities 6,794.49 5,834.69 6,327.36 8,506.64 11,098.92
Debt Securities 5,574.20 7,868.30 8,041.52 9,610.14 12,210.66
Other Inv estment Liabilities 16,107.37 17,328.80 17,432.47 15,264.28 16,000.53
Trade Credits - - - - -
Loans 9,643.14 11,138.25 11,655.32 9,712.42 9,074.85
Currency and Deposits 6,464.23 6,190.55 5,777.15 5,551.86 6,925.68
Table 7.6: International Investment Position (IIP) of Nigeria (2007-2011) [Millions of dollars]
Source: CBN, Statistics Department
7.6 EXCHANGE RATE MOVEMENTS
The exchange rate of the Naira to the US dollar averaged N153.86 per US dollar
at the wDAS segment of the foreign
exchange market in 2011, a
depreciation of 2.3 per cent,
compared with the level in 2010. At
the inter-bank and BDC segments, the
Naira depreciated by 3.1 and 3.9 per cent to N155.89 and N159.31 per US
dollar, respectively. The year commenced with the mid-point exchange rate
The exchange rate of the Naira to the US dollar at the wDAS segment of the foreign exchange market, in 2011, depreciated by 2.3 per cent, compared with the level in
2010.
7

Central Bank of Nigeria Annual Report—2011
191
band of N150/US$. However, due to the
pressure on the foreign exchange market
and external reserves, in the fourth quarter
of the year, the Bank adjusted the mid-point
exchange rate band to N155.00 per US
dollar and maintained the band of +/-3.0 per cent. This was aimed at reducing
arbitrage opportunities and speculative attacks. Following these developments,
the premium between wDAS/interbank and wDAS/BDC rates widened from 0.5
and 1.8 per cent in 2010 to 1.3 and 3.5 per cent, respectively, in 2011.
Figure 7.12: Average Yearly Exchange Rate of the Naira per US Dollar
The end-period exchange rate of the Naira in all the segments of the foreign
exchange market depreciated. At the wDAS and interbank markets, it
depreciated by 4.8 per cent below their levels in 2010 to N158.27 and N159.70
per US dollar, respectively. At the BDC segment, the Naira depreciated against
the US dollar by 5.5 per cent when compared with the level in 2010, to N165.00
per US dollar.
144.00
146.00
148.00
150.00
152.00
154.00
156.00
158.00
160.00
2010 2011
Nai
ra p
er
US$
WDAS Interbank BDC
The premium between wDAS/interbank and wDAS/BDC rates widened from 0.5 and 1.8 percent in 2010 to 1.3 and 3.5 per cent, respectively, in 2011.
7

Central Bank of Nigeria Annual Report—2011
192
Figure 7.13: End-Period Exchange Rate of the Naira per US Dollar
Analysis of the nominal exchange rate of the domestic currency, relative to
other major international currencies, showed that the Naira exchanged at an
average of N244.26, N212.10, N172.17, N1.19 and N40.62 to the British pound
sterling, Euro, Swiss francs, Japanese yen and Saudi riyal, respectively. This
showed a depreciation of 5.8, 6.9, 16.8, 11.3 and 2.7 per cent, respectively,
relative to the levels in 2010. At the regional level, the Naira exchanged at an
average of N0.32 and N239.70 per CFA francs and WAUA, a depreciation of 7.0
and 5.6 per cent, respectively, when compared with the levels in 2010.
The wDAS-forward rates for 1-,2- and 3- month tenors all opened in March 2011
at N/$151.31/US$ and closed at N156.84/US$ in December 2011. When
compared with the spot rates for the respective periods, the Naira traded at a
premium. The US dollar, which traded at a discount of 11.9 per cent at the
beginning of the year, showed a discount of 10.8 per cent at end-December
2011.
7.7 The Nominal Effective Exchange Rate (NEER) and the Real Effective
Exchange Rate (REER)
The average 13-currency Nominal Effective Exchange Rate (NEER) indices rose
by 4.4 per cent over the level in 2010 to 101.18, which showed a loss of
competitiveness of the Naira. The 13-currency REER index opened at 93.31 in
January 2011, and closed 8.8 percentage points lower at December 2011,
140.0
145.0
150.0
155.0
160.0
165.0
170.0
2010 2011
Nai
ra p
er
US$
WDAS Interbank BDC
7

Central Bank of Nigeria Annual Report—2011
193
showing a drop in year-on-year inflation in the Nigerian economy in 2011
relative to 2010.
Figure 7.14: Nominal and Real Effective Exchange Rate Indices, 2008 - 2011
Table 7.7: Nominal and Real Effective Exchange Rate Indices (November 2009=100)
December 2010 December 2011
Monthly
Index
Annual
Average
Monthly
Index
Annual
Average
%Change in
Annual
Average
NEER 97.87 96.88 99.73 101.18 4.4
REER 91.21 92.31 84.56 89.91 (2.6)
40.00
50.00
60.00
70.00
80.00
90.00
100.00
110.00Ja
n-0
8
Mar
-08
May
-08
Jul-
08
Sep
-08
No
v-0
8
Jan
-09
Mar
-09
May
-09
Jul-
09
Sep
-09
No
v-0
9
Jan
-10
Mar
-10
May
-10
Jul-
10
Sep
-10
No
v-1
0
Jan
-11
Mar
-11
May
-11
Jul-
11
Sep
-11
No
v-1
1
Ind
ex
REER NEER
7

Central Bank of Nigeria Annual Report—2011
194
he 2011 Spring and Annual Meetings of the Bretton Woods Institutions (BWIs) focused on
global economic recovery, surveillance, capital flows, reform of the BWIs, and climate
finance, among others. Members observed that the varied rates of recovery across the globe
and reliance on quantitative easing by advanced economies contributed to a surge in capital
flows, increased risks to financial stability, and promoted speculative movements in commodity
prices. At the continental level, the African Union (AU) leaders pledged about US $380 million in
support of drought relief in East Africa. Also the African Ministers of Trade agreed on a draft
Action Plan for boosting Intra-African Trade. At the sub-regional level, the ECOWAS
Convergence Council of Ministers of Finance and Central Bank Governors, clarified the roles of
the various institutions involved in the implementation of the multilateral surveillance mechanism
within ECOWAS Member states, and adopted, in principle, the harmonized convergence
criteria.
8.1 THE INTERNATIONAL MONETARY SYSTEM
8.1.1 International Monetary Fund/World Bank Annual Meetings
The 2011 Spring and Annual Meetings of the Bretton Woods Institutions (BWIs)
were held in Washington D.C., USA, from April 11 – 17 and September 19 – 25,
2011, respectively. The meetings comprised those of the Ministers of the Inter-
governmental Group of 24 (G-24), the International Monetary and Financial
Committee (IMFC) and the Development Committee, amongst others.
The Ministers and Governors at the IMF/World Bank Meetings:
Noted that the global economic recovery continued at different rates in
many countries. Though risks of recession abated in advanced
economies, unemployment remained high, and growth sluggish. In
contrast, most developing countries maintained a strong growth
momentum, reflecting robust macroeconomic frameworks;
Observed that the prospects for a sustained global recovery remained
uncertain, due to continued fragilities in most advanced economies. Of
T
CHAPTER EIGHT
INTERNATIONAL AND REGIONAL
INSTITUTIONS

Central Bank of Nigeria Annual Report—2011
195
particular concern were the weak financial systems and a rapid increase
in sovereign debt in some advanced economies, as well as debt
sustainability issues in some countries in the Euro area;
Stressed that the varied rates of recovery and reliance on the use of
quantitative easing by advanced economies contributed to a surge in
capital flows, increased risks to financial stability, speculative movements
in commodity prices, and overheating of the economy in many
emerging markets;
Indicated the need for urgent action to deal with the consequences of
food and energy price increases, and address the impediments to food
and energy security; and
Underscored the importance of the IMF and the World Bank to
proactively respond to the developmental needs of the (MENA) region.
At the meeting of the Inter-Governmental Group of Twenty-Four (G-24), which
was preceded by the G-24 Technical Group and the Bureau meetings, the
Ministers:
Expressed concern about the threat to the global economic recovery
and underscored the need for urgent and coordinated action to address
the crisis of confidence in advanced economies (AEs), to prevent spillover
effects on emerging markets and developing countries (EMDCs);
Called for more decisive action by the Euro authorities to address the
sovereign debt crisis and restore confidence in financial markets;
Stressed the need for urgent action to deal with the consequences of
volatile commodity prices and long-term impediments to food and
energy security;
Underscored the need for strategies that are inclusive, dynamic, and
guarantee fair opportunities for women, youth, and the poor;
Emphasized the need for protection of the voice and representation of
EMDCs through an increase in the chairs held by EMDCs, including the
addition of a third chair for sub-Saharan Africa; and
8

Central Bank of Nigeria Annual Report—2011
196
Called for concrete proposals on job creation in the upcoming World
Development Report (WDR).
8.1.2 The Group of Developing Eight (D8) Seminar
The Bank hosted a two-day Seminar for the group of eight developing countries
(D-8) on July 18 and 19, 2011 on the theme: ‗Enhancing Global Financial
Supervisory Standards and Practices‘.
Participants agreed, among others:
That for good corporate governance to thrive in member countries,
board and senior management must lead in risk governance by
checking the risk appetite of banking institutions;
That regulators should design appropriate mechanisms for undertaking
surveillance, monitoring, and conduct of regular stress tests of the
financial systems, as well as the implementation of IFRS;
That non-interest banking requires capacity building, awareness
campaign, and amendment of existing laws to enable non-interest banks
exist and operate, side by side with traditional banks;
That it was important to provide an enabling infrastructure for cross-border
cooperation in supervision and regulation, and ensure consistency in the
practice of cross-border supervision; and
Urged members to learn from Bangladesh the success of its micro finance
banking scheme.
8.1.3 International Commodity Organizations
8.1.3.1 The Organization of Petroleum Exporting Countries (OPEC)
The Organization of Petroleum Exporting Countries (OPEC) held two Ordinary
meetings, the 159th and the 160th meetings, in 2011. The 159th meeting was held
in June 2011 at the Organization‘s Headquarters in Vienna, Austria, to discuss a
possible increase in member countries‘ production quota. The meeting centred
on the effect of high oil prices on fluctuating global growth in 2011. The meeting
ended in a deadlock with no decisions being taken. This outcome led to the
8

Central Bank of Nigeria Annual Report—2011
197
board convening the 160th meeting on December 14, 2011 in which the oil
market developments were reviewed using supply/demand
projections. Members noted that the heightened 2011 price volatility was
predominantly a reflection of increased levels of speculation influenced by
geopolitical tensions, rather than as a result of supply/demand
fundamentals. The meeting noted that the downside risks facing the global
economy included: the sovereign debt crisis in the Euro-zone; persistently high
unemployment in the advanced economies; and inflation risk in the emerging
economies. Given global demand uncertainties, the meeting, therefore,
decided to maintain the current production level of 30.0 mbd, including
production from Libya. It was also agreed that Member Countries would, if
necessary, take steps, including voluntary downward adjustments of output, to
ensure market balance and reasonable price levels. Member Countries further
confirmed their preparedness to swiftly respond to developments that might
have a detrimental impact on orderly market developments.
8.1.4 Bilateral Relations
8.1.4.1 The Nigeria-Niger Joint Commission
The Nigeria-Niger Joint Commission for Cooperation was held in Maradi, Niger
Republic, from July 25 to 30, 2011. The decisions centred on: easing the
difficulties in the remittance of funds to eliminate currency trafficking across
borders; and the development of cluster industries to enhance the economic
growth of the two countries.
8.2 REGIONAL INSTITUTIONS
8.2.1 The African Development Bank (AfDB)
The Board of Directors of the African Development Bank (AfDB) Group
approved on May 26 , 2011, two sovereign guaranteed programmes, worth US$
200 million, to the Nigerian Export-Import Bank (NEXIM), and US$ 500 million to
the Bank of Industry (BOI) for financing domestic-oriented SMEs in Nigeria. A
8

Central Bank of Nigeria Annual Report—2011
198
portion of the proceeds would be used to support Technical Assistance for
capacity building at NEXIM, BOI and the SMEs.
Also, the AfDB agreed to contribute US $146 million for the conservation and
sustainable use of natural resources and energy efficiency under the Lake Chad
Basin Regional Programme. The AfDB had worked closely with five implementing
countries (Central African Republic, Cameroon, Niger, Nigeria and Chad) on
the programme design. The AfDB funds would be complemented by a Global
Environment Facility (GEF) grant of US$ 20.5 million, approved by its Council
during its forty-first meeting held in Washington, D.C. from November 9 to 10,
2011.
8.2.2 The Association of African Central Banks (AACB)
The Association of African Central Banks (AACB) held its 2011 Continental
Seminar on the theme, ―Financing Development in Africa: What role for Central
Banks?” The seminar was hosted by the National Bank of Rwanda in Kigali, from
May 30 to June 1, 2011.
Participants at the seminar, agreed that central banks have key roles to play in
financing development and recommended that AACB member central banks
revisit their laws to include financing development, especially where such
provisions are not explicit in existing laws. Members expressed their desire to
leverage on the experiences of Nigeria, The Gambia, and Egypt, in their efforts
to finance development in their respective countries.
The 35th Ordinary Meeting of the Assembly of Governors of the Association of
African Central Banks (AACB) was held in Lilongwe, Malawi on August 12, 2011.
The meeting was preceded by the meetings of the AACB Technical Committee
and the AACB Bureau.
The Assembly:
Noted the delay in the take-off of the study by the joint African Union
Commission (AUC) - AACB Committee on the creation of the African
Central Bank (ACB);
8

Central Bank of Nigeria Annual Report—2011
199
Observed a decline in the performance of member countries under the
African Monetary Cooperation Programme (AMCP) convergence criteria,
despite the stronger economic growth rates recorded in 2010; and
Approved amendments to the Statute of the Association of African
Central Banks (AACB), to allow for the transfer of AACB membership
status from one sub-region to another and made additional provisions in
the statutes to allow for the transfer of the Bank of Tanzania from the
Southern to East African sub-Region.
8.2.3 The African Central Bank (ACB) Steering Committee
The second meeting9 of the Working Group of the Steering Committee of the
African Central Bank (ACB) was held at the Steering Committee‘s Secretariat in
Abuja, Nigeria, from December 12 to 16, 2011. The meeting reviewed the Terms
of Reference, Work Programme, Action Plan, Timelines and a Budget for the
establishment of the African Central Bank.
It was recommended that the Executive Secretary of the AACB and the AUC
extend the contracts of the experts to cover the proposed period of study.
8.2.4 The Experts Meeting on the African Monetary Fund
The Fifth Experts Meeting for the Validation of the Statue and Annexes of the
African Monetary Fund was held in Addis Ababa, Ethiopia, from July 27 to 28,
2011.
The meeting validated the 11 articles of the Statute covering definitions,
establishment, purpose and objectives, membership, authorized share capital,
among other issues. The Draft Statute would be forwarded to the African Union
Conference of Ministers of Economy and Finance for consideration, after which
it would be submitted to the Assembly of Heads of State of the African Union
(AU) for adoption.
9 The first meeting to draw up the work programme was held in November 2011.
8

Central Bank of Nigeria Annual Report—2011
200
8.2.5 The African Union (AU)
The Seventh Ordinary Session of the Conference of African Ministers of Trade
was held on November 29, 2011 in Accra, Ghana. The meeting considered and
recommended the draft Action Plan on boosting Intra-African Trade for
adoption by the Council of Ministers, with a view to fast-tracking the project.
In a related development, the AU also convened a Conference in Addis
Ababa, Ethiopia, on August 25, 2011 to raise funds for drought relief in East
Africa. African leaders pledged US $380 million in support of the cause. The
African Development Bank donated US $300 million for long-term development
in the Horn of Africa, to be spent by 2013.
8.2.6 The Committee of 10 (C-10)
The Committee of 10 African Finance Ministers and Central Bank Governors (C-
10) held its sixth meeting in Cairo, Egypt, on October 30, 2011. The Committee,
at the end of the meeting:
Noted that a 1.0 per cent drop in OECD countries‘ growth rate could
translate into a 10.0 per cent drop in Africa‘s exports as well as a 0.5 per
cent loss in Africa‘s GDP growth rate;
Urged Europe to undertake decisive measures to address underlying
structural problems, and the G-20 to bring the global economy back on a
sustainable growth trajectory; and
Noted, with great concern, recent speculative attacks against some
African currencies and called on the authorities to undertake necessary
measures, promptly and collaboratively, to combat this practice.
8.2.7 The African Economic Conference (AEC)
The Sixth African Economic Conference (AEC) was held in Addis Ababa from
October 25 to 28, 2011, with the theme, ―Green Economy and Structural
Transformation‖.
Participants at the conference noted:
That the transformation of Africa‘s economy had to start with agriculture;
8

Central Bank of Nigeria Annual Report—2011
201
That a green development would involve massive re-forestation, water
management, and soil conservation, which would be crucial in
improving the productivity of farms and raising the income of farmers;
That structural economic transformations would require huge energy
generation from the continent‘s abundant energy resources, whose
opportunity cost was close to zero; and
That Africa‘s structural economic transformation and ‗greening‘ could
only come about if the continent caught up with the technology levels
enjoyed by developed countries.
8.2.8 The Africa Trade Forum (ATF)
The inaugural meeting of the Africa Trade Forum (ATF) was held on November
22, 2011 in Addis Ababa, with the theme: “Accelerating Intra-African Trade and
Enhancing Africa‘s Participation in Global Trade‖. The forum noted that:
With intra-Africa trade at just about 11.0 per cent of total African trade, as
compared to 72.0 per cent of trade with Europe and 52.0 per cent with
Asia, there was room for expansion of trade among African countries;
and
Implementation of trade agreements and protocols by Regional
Economic Communities (RECs) was necessary to improve intra-African
trade. That in order to expand intra-African trade, the continent had to
move forward from trading primary products to manufacturing products,
invest in human capital, improve infrastructure and logistics, and invest in
institutional capacity building.
8.3 SUB-REGIONAL INSTITUTIONS
8.3.1 The Fourth West African Monetary Zone (WAMZ) Trade Ministers’ Forum
The Fourth West African Monetary Zone (WAMZ) Trade Ministers‘ Forum was
convened by the West African Monetary Institute (WAMI) and held in Freetown,
Sierra Leone, from May 18 to 19, 2011.
The major highlights of the Forum included the following:
8

Central Bank of Nigeria Annual Report—2011
202
The election of the Minister of Trade and Industry of the Republic of Sierra
Leone, Dr. Richard Konteh, as Chairman of the Forum for the next year;
That henceforth the Forum would hold twice a year;
The adoption of a common standard for products and services that
would be applicable throughout the ECOWAS sub-region would eliminate
the need for multiple cross-border certification;
The need to adopt an exchange rate mechanism among member
States‘ currencies to facilitate intra-Zone trade without recourse to the U.S
dollar and other convertible currencies; and
The need to encourage the domestication of WAMZ and ECOWAS trade
rules by incorporating them into national trade policies.
8.3.2 The Statutory Meetings of Sub-Regional Institutions
The 2011 Mid-Year Joint Statutory Meetings of the West African Monetary
Agency (WAMA), the West African Monetary Institute (WAMI), and the West
African Institute for Financial and Economic Management (WAIFEM) were held
in Conakry, Guinea, from July 8 to 15, 2011. A meeting of the College of
Supervisors of the West African Monetary Zone was also held on the fringe of the
statutory meetings. The meeting considered collaborative initiatives on cross
border issues and consolidated supervision.
The report indicated that the economies of ECOWAS grew strongly against the
backdrop of a moderate rise in commodity prices. However, the sub-region‘s
fiscal and external positions worsened on the convergence scale.
The WAIFEM report indicated that 13 training and capacity building
programmes were executed and 388 senior/executive-level staff benefited from
the various training programmes.
The Key issues included the following: that vacant positions in WAMI and WAMA
to be filled by the Central Bank of Nigeria; the outstanding financial obligations
8

Central Bank of Nigeria Annual Report—2011
203
to the West African Central Bank (WACB) Capital and Stabilization and
Cooperation Fund; and a need for greater involvement of the Central Banks in
the next phase of the ECOWAS single currency.
8.3.3 The ECOWAS Convergence Council
The Sixth Ordinary Session of the ECOWAS Convergence Council of Ministers of
Finance and Governors of Central Banks was held in Lome, Togo, on October
14, 2011. The meeting reviewed documents relating to the creation of a single
currency in the ECOWAS sub-region, as adopted by the ECOWAS Convergence
Council. These included the Guidelines on the Formulation of a Multi-year
Programme on Convergence within ECOWAS; Draft Supplementary Act on
Convergence and Macroeconomic Stability Pact among Member States; and
Draft Supplementary Amendment of a regional decision on the Creation of a
Multilateral Surveillance Mechanism of Economic and Financial Policies of
Member States.
The Council:
Clarified the role of the various institutions involved in the implementation
of the multilateral surveillance mechanism within ECOWAS Member
states;
Directed the ECOWAS Commission and WAMA to, henceforth, work in
harmony on multilateral surveillance and convergence issues;
Agreed to ensure speedy ratification and implementation of ECOWAS
Protocols and decisions and legal instruments;
Expressed its commitment to intensify efforts to reduce high budget
deficits and promote sustainable budget policies and debts;
Adopted, in principle, the harmonized convergence criteria, pending the
outcome of studies on establishing such issues as Member States‘ optimal
fiscal pressure, budget deficits and internal revenue generation;
Approved the guidelines for the formulation of the multi-year programme
on convergence within ECOWAS; and
8

Central Bank of Nigeria Annual Report—2011
204
Directed that a revised matrix be designed reflecting all the completion
datelines and possible remarks on the road map to the ECOWAS single
currency.
8

Central Bank of Nigeria Annual Report—2011
205
Appendix A1
Balance Sheet
As at 31 December 2011
Note 2011 2010
N' Million N' Million
Assets:
External reserves 2 5,426,974 4,953,779
Holdings of Special Drawing Rights 3 401,734 384,833
Nigerian Government Securities 4 388,688 345,131
Loans and advances 5 150,848 320,163
Investments 6 4,099,652 107,191
Other assets 8 593,301 475,647
Fixed assets 9 261,057 208,192
11,322,254 6,794,936
Liabilities:
Deposit accounts 10 5,308,807 4,145,816
Central Bank of Nigeria instruments 11 1,537,535 105,878
Notes and coins in circulation 12 1,566,047 1,378,135
International Monetary Fund allocation of
Special Drawing Rights 14 401,779 384,870
Other financial liabilities 15 2,227,908 587,647
11,042,076 6,602,346
Capital and reserves:
Share capital 18 5,000 5,000
General reserve fund 19 94,575 83,477
Fixed assets revaluation reserve 20 61,575 57,069
Foreign currency revaluation reserve 21 94,144 14,070
Reserve on fund managers‘ investments 22 24,884 32,974
280,178 192,590
Liabilities and Equity 11,322,254 6,794,936 ________________________ Governor 23 February 2012 ________________________ Director 23 February 2012
________________________ Director 23 February 2012
________________________ Director of Finance 23 February 2012
The accounting policies on pages 205 to 210 and the notes on pages 211 to 227 form part of these financial statements.
APPENDIX
A
APPENDIX
A
APPENDIX
A

Central Bank of Nigeria Annual Report—2011
206
Appendix A2
Income and Expenditure Statement For The Year Ended 31December 2011
Notes 2011 2010
N'Million N'Million
Interest income 23 196,418 106,742
Interest expense 24 (77,021) (33,921)
Net Interest Income 119,397 72,821
Realised gain on foreign currency 21 41,022 354,712
Other operating income 25 150,771 134,648
311,190 562,181
Provision no longer required/(Provision for
bad and doubtful debts) 26 7,048 (206,400)
Operating Costs 27 (238,085) (309,288)
Surplus before appropriation 80,153 46,493
Appropriation:
Transfer to general reserve fund 19 16,031 11,623
Transfer to Federal Government of Nigeria
under S.5 (3) of the Central Bank of Nigeria
Act 2007 16 64,122 34,870
80,153 46,493
The accounting policies on pages 205 to 210 and the notes on pages 211 to 227 form part of these financial statements.
APPENDIX
A

Central Bank of Nigeria Annual Report—2011
207
Appendix A3
Statement of Cash Flows For The Year Ended 31December 2011
Notes 2011 2010
N'Million
N'Million
Cash flow generated from/ (utilized by) operating
activities
Cash generated from/ (utilised by) operating
activities 28 4,611,059
(1,127,029)
Net cash generated from/ (utilised by)operating
activities 4,611,059
(1,127,029)
Cash flow utilised by investing activities
Purchase of fixed assets (52,281) (58,567)
Proceeds from sale of fixed assets 321 12
Deposit for shares - (5,493)
Increase in Investment (3,992,461) (18,667)
Net investment in Government bonds (43,557) 44,440
Net cash utilised by investing activities (4,087,978)
(38,275)
Cash flow utilised by financing activities
Surplus paid to the Federal Government of Nigeria (32,985) (39,712)
Net cash utilised by financing activities (32,985)
(39,712)
Increase/ (Decrease) in cash and cash equivalents 490,096
(1,205,016)
Balance at the beginning of the year 5,338,612
6,543,628
Increase/ (Decrease) in cash and cash equivalents 490,096 (1,205,016)
Balance at the end of the year 5,828,708
5,338,612
The balance at the end of the year is analysed as
follows:
Bank balances 5,769,581 5,218,256
Sundry currencies 59,127 120,356
5,828,708
5,338,612
APPENDIX
A

Central Bank of Nigeria Annual Report—2011
208
Appendix B1
SIGNIFICANT ACCOUNTING POLICIES
The following significant accounting policies were adopted by the Bank in the preparation of its financial statements and have been consistently applied: a. Basis of presentation These are the financial statements of the Central Bank of Nigeria (CBN or the Bank), a body corporate established by the Central Bank of Nigeria Act of 1958 as amended by the CBN Act No. 7 of 2007. The financial statements are prepared under the historical cost convention as modified by the valuation of certain fixed assets and comply with the accounting policies set out below:
b. Consolidation Subsidiary undertakings, which are those companies in which the Bank, directly or indirectly, has an interest of more than half of the voting rights or otherwise has power to exercise control over their operations, have not been consolidated. These entities are not consolidated because their activities and accounting policies are different from those of the Bank. Such entities are accounted for as long-term investments.
c. Foreign currency activities Foreign currency transactions are recorded in Naira, using the exchange rates prevailing at the dates of the transactions. Differences arising at the dates of settlement are recognized in the income and expenditure account. At the balance sheet date, assets and liabilities denominated in foreign currencies are converted to Naira, using the closing rate except where a balance is to be settled at a contracted rate, then that rate is used. All differences arising on conversion are taken to the income and expenditure account, except differences on long-term foreign currency monetary items which are deferred and taken to the income and expenditure account on a systematic basis over the remaining lives of the monetary items concerned. d. External reserves
Gold reserves are held for long-term purposes and are not being traded. It is carried at cost. External reserve balances at year-end are converted into Naira in accordance with the policy in ―c‖ above. All gains and losses realized on external reserve balances are recognized as follows: revaluation gains and losses on reserves due to the Federal Government of Nigeria (FGN) are for the account of the FGN and, consequently, all translation profits and losses are transferred to the respective deposit accounts of the FGN: Revaluation gains and losses on external reserve balances of the Bank are transferred to its Foreign Currency Revaluation Reserve Account.
APPENDIX
B1

Central Bank of Nigeria Annual Report—2011
209
e. Loans and receivables The following assets have been classified as loans and receivables for the
purposes of assessing their recoverability: loans and advances; amounts
due by liquidator of distressed banks; and other assets. A specific credit risk provision is established to provide for Management‘s estimate of credit losses as soon as the recovery of an exposure is identified as doubtful. This provision is made for each account that is not performing in accordance with the terms of the related facility. The basis is as follows: Interest and/or principal outstanding Classification Provision for over
90 days but less than 180 days Sub-standard 10%
180 days but less than 360 days Doubtful 50%
360 days and over Lost100%
In addition, a provision of 1% is made for all performing risk assets to recognize losses in respect of risks inherent in any credit portfolio. The 1% provision is applicable to only loans and advances. Provisions for losses on doubtful receivables are recognized in the income and expenditure account. When a loan is deemed not collectible, it is written off against the related provision for loan losses and subsequent recoveries are credited to income. Risk assets in respect of which a previous provision was not made are written directly to the income statement when they are deemed to be not collectible. In addition to the above basis, Management subjectively makes provisions for loans on the basis of their assessment of the likelihood of recoverability of the facility, and/or risks inherent in such facilities. f. Investment securities The Bank‘s investments in securities are categorized into: long-term investments and short-term investments. (i) Long term investments Long-term investments are equity and debt held by the Bank over a long period of time to earn income. Long-term investments are carried at cost. When there has been a permanent decline in the value of an investment, the carrying amount of the investment is written down to recognize the loss. Such a reduction is charged to the income statement. Reduction in the carrying amount is reversed when there is an increase, other than temporary, in the value of the investment, or if the reasons for the reduction no longer exist. (ii) Nigerian Government Securities
APPENDIX
B1

Central Bank of Nigeria Annual Report—2011
210
Nigerian Government Bonds represent debt instruments issued by the Federal Government of Nigeria (FGN) in which the Bank has invested. These bond issues are normally underwritten by the Bank and the investments arise as a result of crystallization of its underwriting commitment. Treasury bills of the Federal Government of Nigeria are initially recorded at cost and subsequently measured at amortized cost. Treasury bonds and development stocks are initially recorded at cost, plus the incidental cost of acquisition and subsequently measured at amortised cost. A decline in value is not taken into account unless it is considered to be permanent. Where a permanent decline in the value of such bonds and development stock are deemed to have occurred, the carrying amounts of these bonds are written down to recognize the loss.
Interest earned on investment securities is reported as interest income. Dividend received is reported as dividend income.
g. Fixed Assets All items of fixed assets are initially recognized at cost. Cost includes expenditure that is directly attributable to the acquisition of the item.
Subsequent measurement –Fixed assets at historical cost Subsequent costs are included in the asset‘s carrying amount or are recognized as a separate asset, as appropriate, only when it is probable that future economic benefits associated with the item will flow to the Bank and the cost of the item can be measured reliably. Repairs and maintenance expenses are charged to the income and expenditure account during the financial period in which they are incurred.
Depreciation Depreciation is calculated on a straight line basis to write down the cost/valued amounts of fixed assets to their residual values over their estimated useful life at the following rates:
Land and Buildings 2.0% Motor Vehicles:
Buses 12.5% Cars 20.0% Lorries 10.0%
Plant and equipment Air conditioners, generators and water pumps 15.0% Currency processing machines 10.0% Furniture and Fittings 20.0% Computer software/hardware 33.3%
Costs related to fixed assets under construction or in the course of implementation are disclosed as capital work-in-progress. The attributable cost of each asset is transferred to the relevant category immediately the asset is put into use and then subjected to depreciation.
APPENDIX
B1

Central Bank of Nigeria Annual Report—2011
211
Gains and losses on disposal are determined by comparing proceeds with the carrying amount. These are included in the income and expenditure account for the year. h. Borrowings (loans) Borrowings are recognized initially at their issue proceeds net of transaction costs incurred. Borrowings are subsequently stated at amortised cost. Interest paid on borrowings is recognized in the income and expenditure accounts for the year on a prorata basis.
i. Currency in circulation Currency issued by the Bank represents a claim on the Bank in favour of the holder. The liability in respect of notes and coins in issue at the balance sheet date is stated at the nominal value of the currency. j. Central Bank of Nigeria instruments Central Bank of Nigeria instruments comprises Promissory Notes and Open Market Operations Bills. Central Bank of Nigerian Promissory Notes represent short- to medium-term debt instruments issued by the Bank to commercial banks assuming net liabilities under the Purchase and Assumption distress resolution programme for banks which could not meet the minimum capital requirement for licensed banks. Promissory Notes are recognized at the face value of the instrument. Open Market Operations Bills represent short-term debt instruments of the Bank issued to commercial banks as a liquidity management tool. They are recognized at cost less any unamortized premiums/discounts. Interest paid on these instruments is recognized in the income and expenditure account for the year. k. Retirement benefits The Bank operates a defined benefit plan and a contributory retirement savings scheme as required by the Pension Reforms Act of 2004. A defined benefit plan is a pension plan that defines an amount of pension benefit that an employee will receive on retirement, usually dependent on one or more factors, such as age, years of service and compensation. A defined contribution plan is a pension plan under which the Bank and the employees pay fixed contributions into a separate entity. The Bank contributes 15% of basicsalary, housing and transport allowances of the qualifying employees while the employeescontribute 7.5% on the same basis towards the pension plans. For the defined benefit plan, the employer‘s obligation is calculated periodically by independent actuaries, using the projected unit credit method. The present value of the defined benefit obligation is determined by discounting the estimated future cash outflows, using interest rates of high-quality corporate bonds that are denominated in the currency in which the benefits will be paid, and that have terms to maturity approximating to the terms of the related pension liability.
APPENDIX
B1

Central Bank of Nigeria Annual Report—2011
212
Actuarial deficit arising from adjustments and changes in actuarial assumptions are to be amortised systematically over a period of not more than three (3) years. For defined contribution plans, the Bank pays contributions to privately administered pension fund administrators on a monthly basis. The contributions are recognized as employee benefit expense in the income and expenditure account. The Bank has no legal or constructive obligation to pay further contributions if the fund does not hold sufficient assets to pay all employees the benefits relating to employee service in the current and prior periods. l. Provisions Provisions are recognized when the Bank has a present obligation, whether legal or constructive, as a result of a past event for which it is possible that an outflow of resources embodying economic benefits will be required to settle the obligation and a reliable estimate of the amount of the obligation can be made.
i. Internal Currency insurance
This provision is accumulated to cover possible losses that could arise on currency stock held within the Bank and in transit. The provision is determined as premium payable to provide insurance cover over such losses.
ii. Contingency/Guarantees
Contingency/Guarantees provisions are determined on the basis of experts‘ valuation (where applicable) and/or the best estimate by Directors of the Bank of the probable resources required to meet the Bank‘s present obligations, if and when they crystallise.
iii. Self-insurance schemes
The Bank operates self-administered insurance schemes through duly constituted trustees for all potential losses for currency in transit and in vaults and for replacement and major repairs for its fleet of vehicles. Annual appropriations are made, based on past experience.
These schemes are fully funded and managed independent of the Bank‘s operations. m. Sale and repurchase agreements The Bank has entered into repurchase agreements as part of its monetary policy activities. Securities purchased under agreements to resell are recorded under the heading ―Loans and Advances‖ as loans and receivables. Securities sold under agreement to repurchase are disclosed as reverse repurchase agreements included in deposit accounts. The underlying Securities purchased under repurchase agreements are not recorded by the Bank. Likewise, underlying securities sold under repurchase agreements are retained in the books of the Bank.
APPENDIX
B1

Central Bank of Nigeria Annual Report—2011
213
The differences between the purchase and sale prices are treated as interest and recognized on an accrual basis. n. Appropriations In accordance with Section 22(1) and (2) of the Fiscal Responsibility Act (FRA) 2007, the Bank makes an annual appropriation representing twenty per cent of the operating surplus of the Bank for the year to a general reserve fund. All remaining surplus after the statutory appropriation to the general reserve fund is payable to the Federal Government of Nigeria not later than one month following the deadline for publication of the financial statements of the Bank. This is in accordance with Section 22(1) and (2) of the Fiscal responsibility Act (FRA) 2007. o. Cash flow For the purpose of the cash flow statement, cash and cash equivalents comprise sundry currency balances and bank balances with foreign banks. p. Revenue recognition Interest income and expenses are recognised on a time proportion basis, taking account of the principal outstanding amount and the rate over the period to maturity. Interest income and expenses are recognised in the income and expenditure account for all interest-bearing instruments on an accrual basis. Where the instrument is deemed to be non-performing, interest income is suspended and recognized on a cash basis. Interest income and expense include the amortization of any discount or premium or other differences between the initial carrying amount of an interest-bearing instrument and its determined amount at maturity. Fees and commissions, where material, are amortized over the life of the related service. Otherwise fees, commissions and other income are recognized as earned upon completion of the related service. Dividends are recognized when the right to receive payment is established. Other revenue arising from the provision of services to clients is recognized on an accrual basis in accordance with the substance of the relevant transaction.
q. Currency issuance and management expenses Note-printing and coin-minting expenses include ordering, printing, minting, freight, insurance and handling costs. These costs are recorded as prepaid expenses and subsequently released to the income and expenditure account when the currency is delivered to the Bank.
APPENDIX
B1

Central Bank of Nigeria Annual Report—2011
214
Appendix B2
Notes to the Financial Statements for the year ended 31 December, 2011
1. General Information The Central Bank of Nigeria (CBN or the Bank)is the apex regulatory authority of the banking system in Nigeria .It was established by the Central Bank of Nigeria Act of 1958, as amended by theCBN Act No7 of 2007. It commenced operations on 1 July 1959. The issued capital of the Bank is wholly owned by the Federal Government of Nigeria .The
principal objectives of the Bank are to ensure monetary and price stability,issue legal tender
currency in Nigeria, maintain external reserves to safeguard the international value of the legal
tender currency, promote a sound financial system in Nigeria, act as banker to the Federal
Government and Federal Government Parastatals, and provide financial advice to the Federal
Government of Nigeria.
2. External reserves
2011 2010
N' Million N' Million
Convertible Currencies (see notes 2a
and 2b) 5,426,932
4,953,737
International Monetary Fund Reserve
tranche 23
23
Gold 19 19
5,426,974 4,953,779
(a) Convertible currencies comprise:
Current account with foreign banks 1,468,602 821,585
Time deposits and money employed 1,486,411 1,872,343
Domiciliary accounts 809,914 469,834
Other foreign securities 1,602,878 1,669,619
Sundry currencies and travellers' cheques 59,127 120,356
5,426,932 4,953,737
Included in convertible currencies is an amount of N2,839 billion, (2010 – N2,047 billion), which
represents the Naira value of foreign currencies held on behalf of customers in various foreign
accounts for letters of credit transactions and other purposes. The corresponding liability for this
amount is included in deposits. (see note 10b)
APPENDIX
B2

Central Bank of Nigeria Annual Report—2011
215
Appendix B2 (Cont'd)
2011 2010
N' Million N' Million
(b) Convertible currencies are further
analysed by Currency
United States Dollar 4,883,747 4,064,423
British Pounds Sterling 117,885 193,191
Euro 398,211 688,903
Japanese Yen 3,102 4,230
Chines Renminbi 15,787
Others 8,200 2,990
5,426,932 4,953,737
3. Holdings of Special Drawing
Rights
At 1 January 384,833 352,465
Acquisitions during the year - 34,274
Interest earned in the year 1,729 992
Charges for the year (1,734) (1,034)
Revaluation gains/(loss) 16,906 (1,864)
At 31 December 401,734 384,833
4. Federal Government Securities
Nigerian Treasury Bills 113,974 44,169
Nigerian Treasury Bonds 202,412 228,651
Nigerian Development Stocks - 9
FGN Bonds 72,302 72,302
388,688 345,131
The CBN invested in Nigeria Treasury Bonds with coupon rates of 5% - 12.5%. The last Treasury bond
will mature on 15 October 2024. The Bank as directed by the Federal Government through a
refinancing arrangement purchased promissory notes issued by the Federal Government of
Nigeria to Union Trustees in respect of loans granted to Transnational Corporation of Nigeria Plc. by
a consortium of banks (represented by Union Trustees Limited). The promissory notes have been
converted to 5.5%, 7th FGN Bonds worth N72 billion on 19th August 2010 with the maturity date of
19th February 2013.
5. Loans and advances 2011 2010
N' Million N' Million
Overdraft balances & short-term
advances 68,929 263,571
Staff loans 6,081 5,165
Loans to DMBs on Commercial
Agricultural Credit Scheme (Note 15) 154,163 95,606
APPEND
IX B2

Central Bank of Nigeria Annual Report—2011
216
AppendixB2 (Cont'd)
2011 2010
N' Million N' Million
Advances to Federal Mortgage Bank
of Nigeria 9 9
Other loans 13,325 12,794
Long-term loans (see 5(b)) 552,746 603,319
795,253 980,464
Provision for loan losses (Note 5a): (644,405) (660,301)
150,848 320,163
2011 2010
N' Million N' Million
5a Movement in provision for loan
losses
At 1 January 660,301 497,395
Eliminated through forbearance - (36,940)
660,301 460,455
Provision for the year 577,581 199,846
Provision no longer required (593,477 -
At 31 December 644,405 660,301
Overdraft balances and short-term advances
Overdraft balances represent lending to customers and are collateralized by Treasury Bills and
Federal Government Bonds.
Other loans
Other loans represent accommodation to distressed and liquidated banks. These have been fully
provided for.
2011 2010
N' Million N' Million
5b Long term loans:
At 1 January 603,319 637,000
Addition in the year 500,000 3,694
Repayments during the year (550,573) (435)
Eliminated through forbearance - (36,940)
552,746 603,319
APPEND
IX
B2

Central Bank of Nigeria Annual Report—2011
217
AppendixB2 (Cont'd)
Details of benefitting banks and amounts granted by CBN:
2011 2010
Mainstreet Bank ltd. (formerly Afribank Plc) - 50,000
Keystone Bank ltd. (formerly Bank PHB Plc) - 70,000
Finbank Plc - 50,000
Intercontinental Bank Plc - 100,000
Oceanic Bank Plc - 100,000
Societe Generale Bank Ltd 2,685 3,258
Enterprise Bank plc. (formerly Spring Bank Plc ) - 60,000
Union Bank Plc - 120,000
Wema Bank Plc 50,061 50,061
Asset Management Corporation of Nigeria 500,000 -
552,746 637,000
Except for Societe Generale Bank Ltd., long term loans to deposit money banks represent Central
Bank of Nigeria‘s 7-year special intervention support to under-capitalized deposit money banks at
an interest rate of 5.75% per annum as at 31 December 2011 (2010: 3.25% per annum). A provision
of 100% has been effected in the financial statements as at 31 December 2011 for the loan
balance. Repayment in the year was financed with Assets Management Corporation of Nigeria
(AMCON) issued bonds.
Included in long term loans is Central Bank of Nigeria‘s ten year bank recapitalization intervention
fund to the Asset Management Corporation of Nigeria at an interest rate of 2% per annum. There
would be a bullet repayment at the end of the facility tenor while interest payment is on quarterly
basis. A provision of 100% has been effected in the financial statements as at 31st December 2011
for this fund.
During the year, the banking licenses of Afribank plc, BankPHB plc and Spring Bank plc were
revoked. Three new Bridge Banks (Mainstreet Bank ltd., Keystone Bank ltd. and Enterprise Bank ltd.)
were formed to purchase the legally transferrable assets and assume the deposits and other
liabilities of the three banks respectively through Purchase and Assumptions agreement between
the Nigeria Deposit Insurance Corporation and the Bridge Banks. The Assets Management
Corporation of Nigeria has acquired 100% holding in the Bridge Banks as at 5th August 2011.
2011 2010
N' Million N' Million
6. Investments
Percentage
Holding
Investments in subsidiaries and associates: %
Abuja Securities & Commodity Exchange 51 408 408
Africa Finance Corporation 42 57,958 57,958
Asset Management Corporation of Nigeria 50 5,000 250
Bank of Industry 40 2,708 2,708
National Economic Reconstruction Fund 33 100 100
Nigerian Agricultural Cooperative and Rural
Development Bank 40 4,027 4,027
APPEND
IX B2

Central Bank of Nigeria Annual Report—2011
218
AppendixB2 (Cont'd)
2011 2010
N' Million N' Million
Nigeria Deposit Insurance Corporation 60 1,380 1,380
Nigerian Security Printing and Minting
Company Plc (NSPMC) 77 23,575 13,390
Nigerian Export Import Bank 40 25,000 25,000
120,156 105,221
Other Investments:
Agricultural Credit Guarantee Scheme Fund 40 1,200 1,200
Asset Management Corporation of Nigeria
(AMCON) Bonds 3,476,783 -
Federal Mortgage Bank of Nigeria 60 60
Nigerian Interbank Settlement System 4 53 53
International Islamic Liquidity Management
Corporation of Malaysia 7 743 -
Bank of Industry Debenture 500,000 -
6% Perpetual Debentures in Nigerian Export
Import Bank 1,250 1,250
3,980,089 2,563
4,100,245 107,784
Provision for diminution in value of investments (593) (593)
4,099,652 107,191
The Bank invested in AMCON Bonds during the year as part of its liquidity management function.
The AMCON bonds have yield of 10.13% - 13% and are expected to mature in December 2013,
August 2014 and October 2014. The income earned on the bonds during the year has been
recognized in the income and expenditure account.
The Bank invested in the debenture stock by the Bank of Industry (BOI). The investment is for the
funding of intervention activities initiated by the Bank and was executed through the BOI. The sum
of N300 billion will be applied to power projects and N200 billion applied to the
refinancing/restructuring of Deposit Money Banks‘ existing loan portfolios to Nigerian small and
medium scale enterprise and the manufacturing sector. As at 31st December, 2011, a total of
N390.26 billion has been disbursed to the BOI and the balance of N109.74 billion is included in
sundry payables (Note 15).
7. Amount paid out in respect of the following
distressed banks 2011 2010
N' Million N' Million
African Express Bank 691 663
African International Bank 5,202 2,300
All States Trust Bank 16,037 15,922
Assurance Bank 4,475 4,475
APPEND
IX B2

Central Bank of Nigeria Annual Report—2011
219
The Bank entered into Purchase and Assumption arrangements with the Nigeria Deposit Insurance Corporation (NDIC) and some banks over private sector deposits and certain capital assets of some distressed banks in liquidation. Accordingly, the Bank issued promissory notes for the net liabilities assumed. See Note 11 for the liability in respect of the promissory note issued.
8. Other assets
Due from Agricultural Credit Guarantee Scheme
Fund 810 711
Accrued interest receivable 13,163 13,805
Accounts receivable 29,751 29,738
Deposit for shares 4,947 20,625
Sundry receivables (Note (8a) below) 554,829 415,484
603,500 480,363
Provision for doubtful balances (10,199) (4,716)
593,301 475,647
Deposit for shares represents deposits made by the Bank with respect to equity of the Bank of
Industry. The shares have not been allotted as at 31st December 2011.
8a. Sundry receivables are further analysed as:
Deferred interest and prepayments 102,459 8,292
IMF Quota 433,744 402,747
Cheques in clearing 15,233 3,522
Others 3,393 923
554,829 415,484
2011 2010
N' Million N' Million
City Express Bank 5,372 5,372
Gulf Bank 6,201 6,108
Hallmark Bank 2,999 2,979
Lead Bank 3,821 3,821
Trade Bank 7,510 7,303
52,308 48,943
Provision for doubtful balances (52,308) (48,943)
APPEND
IX B2

Central Bank of Nigeria Annual Report—2011
220
Appendix B2 (Cont'd)
9. Fixed Assets
Land &
buildings
Plants &
equipment
Furniture
& fittings
Computers
Motor
vehicles
Capital
work in
progress
Total
N'M N'M N'M N'M N'M N'M N'M
2011:
Cost/valuation:
At 1-January
79,001 20,491 2,004 7,425 2,084 127,316 238,321
Adjustments 454 (627) (103) 223 1,364 6,015 7,326
Additions 30 6,891 913 1,338 1,615 41,494 52,281
Disposals - (70) - - (447) - (517)
At 31-December 79,485 26,685 2,814 8,986 4,616 174,825 297,411
Accumulated
depreciation:
At 1 January 10,466 11,739 1,855 5,381 688 - 30,129
Adjustments 1,027 2,815 (312) (1,269) 559 - 2,820
Charge for the year 133 1,294 186 1,441 551 - 3,605
Disposals - (3) - - (197) - (200)
At 31-December 11,626 15,845 1,729 5,553 1,601 - 36,354
Net book value 67,859 10,840 1,085 3,433 3,015 174,825 261,057
During the year, the Bank conducted a fixed asset verification exercise and effected adjustments as deemed
necessary.
9. Fixed Assets Cont’d
2010:
Cost/valuation: N'M N'M N'M N'M N'M N'M N'M
At 1 January 79,001 27,042 2,191 5,881 4,021 77,709 195,845
Additions - 5,192 270 2,352 1,146 49,607 58,567
Disposals - - - - (25) - (25)
Adjustments - (11,743) (457) (808) (3,058) - (16,066)
At 31-December 79,001 20,491 2,004 7,425 2,084 127,316 238,321
Accumulated depreciation:
At 1 January 8,444 19,076 1,880 5,432 1,831 - 36,663
Charge for the year 2,022 946 367 694 261 - 4,290
Disposals - - - - (25) - (25)
Adjustments - (8,283) (392) (745) (1,379) - (10,799)
At 31-December 10,466 11,739 1,855 5,381 688 - 30,129
Net Book Value 68,535 8,752 149 2,044 1,396 127,316 208,192

Central Bank of Nigeria Annual Report—2011
221
Appendix B2 (Cont'd)
10. Deposit accounts
2011 2010
Government deposits: N' Million N' Million
-Capital/settlement accounts 1,431,683 1,703,128
-Domiciliary accounts 809,914 469,834
Other Accounts (Note 10a) 2,028,686 1,576,786
Financial Institutions:
-Current/settlement accounts 278,686 302,527
-Bank‘s reserve accounts 759,838 93,541
5,308,807 4,145,816
10a. Other accounts are further analysed as
follows:
FGN PPT Naira funding account 869,851 508,898
Special reserve account 656 627
FGN excess crude oil proceeds (Naira funding)
account 310,035 273,347
Letters of credit consolidated account 223,657 314,653
FGN (External creditors) funding account 5,992 42,767
NNPC/ NAPIMS cash call account 6,353 6,353
Deposits for Naira draft account 5,747 2,832
Monetary policy stabilization account - 4,618
IMF Securities Account 430,817 397,373
Sovereign Wealth Fund 156,482 -
Sundry accounts 19,096 25,318
2,028,686 1,576,786
10b. Foreign currency deposits held on behalf of
customers for letters of credit transactions and
other purposes are analysed below:
Domiciliary accounts 809,914 469,834
Other accounts 2,028,686 1,576,786
2,838,600 2,046,620
11. Central Bank of Nigeria instruments
Central Bank of Nigeria Promissory Notes (see
11(a))
At 1 January 1,128 -
Issues during the year 3,365 4,030
Redemption in the year (4,237) (2,993)
Accrued interest 19 91
At 31 December 275 1,128
Open Market Operations - CBN bills (Note11(b)):
At 1 January 104,750 50,800
Issued during the year 2,362,439 270,750
Redemption during the year (929,929) (216,800)
APPEND
IX B2
Central Bank of Nigeria Annual Report—2011
222
At 31 December 1,537,260 104,750
Total Central Bank of Nigeria Instruments 1,537,535 105,878
APPENDIX
B2

Central Bank of Nigeria Annual Report—2011
223
Appendix B2 (Cont'd) (11a) The CBN issued Promissory Notes to Ecobank Nigeria Plc. and United Bank for Africa Plc as part of a Purchase and Assumption Arrangement over the private sector deposits and certain assets of African International Bank Limited and Hallmark Bank Plc (Ecobank Nigeria Plc), City Express Bank Plc (United Bank for Africa Plc). The Promissory Notes have a tenor of 1 year and carry coupon rates of 9.05% - 12.99%. (11b) Central Bank of Nigeria Bills represents bills of the Bank issued to commercial banks as a liquidity management tool. These instruments have tenors ranging from 7 days – 365 days and carry discount rates ranging from 7.3% - 17.05% per annum.
2011 2010
N' Million N' Million
12. Notes and coins in circulation
Notes 1,564,885 1,376,993
Coins 1,162 1,142
1,566,047 1,378,135
13. Employment benefit liabilities
Defined Contributory scheme:
At 1 January - -
Contributions/Deductions 4,540 4,345
Amount remitted to selected PFAs (4,412) (4,345)
At 31 December 128 -
The Bank operated a non-contributory defined benefit pension scheme (Legacy scheme) for
pensioners and staff. An actuarial valuation is conducted by qualified independent actuaries
yearly and the Bank provides for any deficit arising from actuarial valuation. An actuarial valuation
was carried out by Messrs HR Limited (Consultants and Actuaries) as at 30th June 2011 which
reported a surplus position of N4.18 billion. For retired staff under the defined benefit scheme, the
Bank is obliged to pay pension until death of the last pensioner.
In accordance with the Pension Reform Act of 2004 and following approval from the National
Pension Commission, the Bank introduced contributory defined contribution schemes to replace
the non-contributory defined benefit schemes. Under the contributory scheme, the employee
contributes 7.5% of basic salary, housing and transport allowances and the employer contributes
15% on the same basis. New employees joining the Bank from 1st January 2008 would join the
defined contribution scheme. Remittances are made to the PFAs on a monthly basis. The Bank has
twelve (12) approved Pension Fund Administrators under the defined contribution scheme.
From 31st December 2009, the Bank approved the discontinuance of the defined benefit scheme
and its substitution with defined contribution scheme to forestall any future actuarial deficit going
forward in respect of remaining employees. The Bank gave an ultimatum of eighteen (18) months
from 31st December 2009 for all staff to migrate to the defined contribution scheme. A total of 498
staff exited during the period 1st January to 31st December 2011. From 1st July 2011, all staff
operate under the defined contribution scheme.
APPEND
IX B2

Central Bank of Nigeria Annual Report—2011
224
Appendix B2 (Cont'd)
2011 2010
N' Million N' Million
14. IMF Allocation of Special Drawing Rights
At 1 January 384,870 388,982
Revaluation 16,909 (4,112)
At 31 December 401,779 384,870
Special Drawing Rights (SDR) are issued by the International Monetary Fund (IMF) to member
countries and represent allocations available to member countries in managing and meeting their
sovereign payment obligations. The IMF calculates the daily value of the SDR in terms of the United
States of America (US) Dollars by reference to a valuation basket of four currencies (USD, GBP,
Euro& Japanese Yen). The applicable interest rate on SDR is set at the weekly interest rates on the
basis of a weighted average of interest rates on the short-term instruments in the markets of the
currencies included in the SDR allocation basket.
15. Other financial liabilities
N' Million N' Million
Interest payable 595 408
Accrued charges 118,860 83,972
Surplus payable to the Federal Government of
Nigeria (Note 16) 64,422 28,352
Sundry payables 405,683 223,797
Unearned income 908,052 4,139
Employee benefit liabilities (Note 13) 128 -
Payable to DMO on Commercial Agricultural
Credit Scheme 200,000 200,000
Payable to Asset Management Corporation
of Nigeria (AMCON) 500,000 -
IBRD – SME loan 51 51
Bank of Tokyo-Commodity loan 1 1
Other provisions (Note 17) 30,116 46,927
2,227,908 587,647
The Bank, on 6 March 2009, obtained the approval of the Federal Government to mobilize the sum
of N200 billion through the issuance of Federal Government Bonds for disbursement to Commercial
Agric Farmers as part of CBN‘s developmental role in the economy. In that regard, the CBN signed
an MoU with the DMO to source and issue the said bond at the rate of 10.14% which is the
average of the marginal rates for the three-year bond from March to July 2009. The Bank has paid
a total amount of N155 billion to the Deposit Money Banks for disbursement to the farmers A total
repayment of N998, 380,000 was received in the course of the year leaving a balance of N154
billion (note 5).
APPEND
IX B2

Central Bank of Nigeria Annual Report—2011
225
16. Surplus payable to Federal Government of
Nigeria 2011 2010
N' M N' M
At 1 January 28,352 33,194
Transfer from income and expenditure account 64,122 34,870
Paid during the year (28,052) (39,712)
At 31 December 64,422 28,352
17. Other provisions
At 1
January
Additional
Provision
At 31
December
N' Million N' Million N' Million
2011:
Contingency (Note 17a) 31,890 (19,800) 12,090
Internal currency insurance funds
(Note 17b) 4,434 2,989 7,423
Agricultural credit fund (Note 17c) 10,603 - 10,603
At 31 December 46,927 (16,811) 30,116
2010
Contingency 31,890 - 31,890
Internal currency insurance funds 4,434 - 4,434
Agricultural credit fund - 10,603 10,603
At 31 December 36,324 10,603 46,927
(a) Contingency provisions represent provisions in respect of probable legal obligations (note
29a).
(b) The Bank makes provisions for internal currency insurance, based on the premium that
would be payable to external insurers had they been engaged. Losses incurred are
indemnified against these provisions.
(c) The Agricultural Credit Guarantee Fund was set aside to provide guarantees to third party
lenders on behalf of participating agricultural enterprises. Amounts provided were based
on the guarantees issued by the Bank.
2011 2010
N' Million N' Million
18. Capital Authorised share capital 100,000 100,000
Issued and fully paid up:
At 31 December 5,000 5,000
Section 4(1) of the Central Bank of Nigeria Act No 7 2007 gave approval to the increase in
authorized capital of the Bank from N5 billion to N100 billion. S4 (2) provides that all the capital of
the Bank shall be subscribed and held only by the Federal Government of Nigeria.
19. General reserve fund
At 1 January 83,477 71,854
Transfer from appropriation account 16,031 11,623
Transfer to Federal Government of Nigeria* (4,933) -
APPEND
IX B2

Central Bank of Nigeria Annual Report—2011
226
At 31 December 94,575 83,477
*This represents additional transfer to the Federal Government of Nigeria made necessary based
on the now adopted relevant provision of the Fiscal Responsibility Act 2007 which took effect in
2008 but implemented by the Bank during the year.
20. Fixed assets revaluation reserve
At 1 January 57,069 63,143
Realised on disposal/verification exercise
carried out during the year 4,506 (6,074)
At 31 December 61,575 57,069
21. Foreign currency revaluation reserve
At 1 January 14,070 379,982
Net gain/(loss) on revaluation during the year 121,096 (11,200)
135,166 368,782
Realized gaintransferred to income and
expenditure account (41,022) (354,712)
At 31 December 94,144 14,070
The foreign currency revaluation reserve is used to record exchange movements
on long-term monetary assets of the Bank. Unrealised losses or gains on revaluation
of these assets are recorded in the account and upon realisation of the assets, the
corresponding gain or loss is transferred to the income and expenditure account.
22. Reserve on fund managers’ investments 2011 2010
At 1 January 32,974 64,167
Movement during the year (8,090) (31,193)
At 31 December 24,884 32,974
23. Interest income
Analysis by type
Time deposits and money employed 23,567 31,520
Federal Government Securities 32,107 33,995
Asset Management Corporation of Nigeria
(AMCON) 73,844 -
Loans and advances 66,900 41,227
196,418 106,742
Analysis by geographical location:
Domestic 172,851 75,222
External 23,567 31,520
196,418 106,742
24. Interest expense
Central Bank of Nigeria Instruments 50,276 4,593
Interest on Treasury Bonds 2,446 2,608
Deposit Balances 4,029 3,660
Interest subsidy on Commercial Agricultural
Credit Scheme 20,270 23,060
77,021 33,921
APPENDIX
B2

Central Bank of Nigeria Annual Report—2011
227
All interest was paid locally
25. Other operating income
Fees 3,067 2,475
Foreign exchange earnings 114,699 80,540
Commissions 63 26
Dividend Income 214 -
Gain on sale of fixed assets 4 12
Realized gain on fund managers‘ investments 12,748 37,734
Other income 19,976 13,861
150,771 134,648
26. Provisions
Loans and advances (15,896) 199,845
Promissory notes issued 3,365 4,030
Investments - 60
Other assets 5,483 2,465
(7,048) 206,400
27. Operating costs
Currency issue expenses 47,337 57,932
Staff Costs 66,488 97,785
Administrative expenses 31,529 52,967
Banking Sector Resolution Cost Sinking Fund 50,000 50,000
Donations 102 1,473
Depreciation charge 3,605 4,290
Repairs and maintenance 2,070 8,410
Consultancy fees 5,711 9,814
Bank charges 359 386
Audit fees 200 200
Directors‘related expenses 843 307
Centres of excellence 4,752 1,229
Realised loss on fund managers‘ investments 1,224 -
Intervention activities* 23,865 24,495
238,085 309,288
*Intervention activities are made up of Trust Fund for collaborative programmes, Nigerian incentive
based risk sharing and intervention fund for SME (BOI) and power.
28. Cash generated from operating activities
Reconciliation of surplus for year to cash
generated from operating activities: 2011 2010
Surplus before appropriation 80,153 46,493
Adjustments for:
Depreciation 3,605 4,290
Profit on disposal of fixed assets (4) (12)
Provisions (23,859) 217,003
Realised loss/(gain) on fund managers - (37,734)
Realised gain on foreign exchange currency (41,022) (354,712)
Net cash (utilised)/generated from operating
activities 18,873 (124,672)
APPENDIX
B2

Central Bank of Nigeria Annual Report—2011
228
Changes in working capital:
Decrease/(increase) on loans and advances 185,211 (95,520)
increase/(decrease) in foreign currency
revaluation reserve 121,096 (11,200)
(Decrease) in fund managers‘ reserve (8,090) (31,193)
(increase)/Decrease in other assets (123,137) 100,911
Increase/(Decrease) in deposit accounts 1,162,991 (942,426)
Increase in Central Bank of Nigeria instruments 1,428,292 55,078
Increase in notes and coins in circulation 187,912 196,307
Revaluation (loss)/gain on IMF allocation of SDR 16,909 (4,112)
Increase/(Decrease) in other financial liabilities 1,621,002 (270,202)
Cash generated/(utilised) by changes in
working capital 4,592,186 (1,002,357)
Cash generated/(utilised) by operating
activities 4,611,059 (1,127,029)
APPENDIX
B2

Central Bank of Nigeria Annual Report—2011
229
Appendix B2 (Cont'd)
29. Contingent liabilities and commitments
(a) Legal proceedings
There were a number of legal proceedings outstanding against the Bank as at 31
December 2011 with contingent liabilities of N1,808 billion (2010=N3,154 billion). The
Directors estimate that provision made for the contingent liability will be adequate to
meet any liability that may crystalise.
The Directors are also of the opinion that all known liabilities and commitments which
are relevant in the assessment of the state of affairs of the Bank have been taken into
consideration in the preparation of these financial statements.
(b) Capital and other commitments
2011 2010
N' Million N' Million
Intervention funds 645,837
1,054,700
FX forwards and currency swaps 151,369 -
Capital Commitments 96,979 95,053
894,185 1,149,753
Intervention funds balance of N646 billion (2010-N1,055 billion) represents
commitments made in respect of Commercial Agricultural Credit Guarantee
Scheme, Small and Medium Enterprises Credit Guarantee Scheme and the Banking
Sector Resolution Cost Sinking Fund.
The Bank had commitments to deliver foreign currencies to counter parties at an
agreed future date and at an agreed rate. The contractual amounts of these off
balance sheet financial instruments have been shown.
(c) Guarantees
2011 2010
N' Million N' Million
Deposit Money Banks 125,412 897,680
Discount Houses 149,803 42,160
Pension Fund Administrators 34,985 110,170
310,200 1,050,010
The Bank during the year guaranteed local interbank balances and balances with other
financial institutions. Guarantees represent total exposure to the Nigerian Financial Sector
for foreign credit lines extended to deposit money banks.
30. Related party information
The Bank entered into banking transactions with related parties in the normal course of
business. These transactions include the sale and purchase of currencies, services, loans,
deposits, and foreign currency transactions.
APPEND
IX
B2

Central Bank of Nigeria Annual Report—2011
230
31. Comparatives
Where necessary, comparative figures have been adjusted to conform to changes in
presentation in the current year.
APPEND
IX
B2

Central Bank of Nigeria Annual Report—2011
231
Appendix B3
REPORT OF THE INDEPENDENT JOINT AUDITORS TO THE
BOARD OF DIRECTORS OF THE CENTRAL BANK OF NIGERIA
Report on the Financial Statements
We have audited the accompanying financial statements of Central Bank of Nigeria
(―the Bank‖) set out on pages 202 to 228, which comprise the balance sheet as at 31
December, 2011, the income statement, and statement of cash flows for the year then
ended, and a summary of significant accounting policies and other explanatory
information.
Directors’ Responsibility for the Financial Statements
In accordance with the provisions of the Central Bank of Nigeria Act, the Board of
Directors are responsible for the preparation of the financial statements which give a fair
presentation of the state of affairs of the Bank at the end of the year and its income and
expenditure.
The responsibilities include ensuring that:
i. the Bank keeps proper accounting records that disclose, with reasonable
accuracy, the financial position of the Bank and comply with the requirements of
the Central Bank of Nigeria Act;
ii. appropriate and adequate internal controls are established to safeguard its assets
and to prevent and detect fraud and other irregularities;
iii. the Bank prepares its financial statements using suitable accounting policies
supported by reasonable and prudent judgments and estimates that are
consistently applied; and
iv. it is appropriate for the financial statements to be prepared on a going concern
basis.
The Directors accept responsibility for the annual financial statements, which have been
prepared using appropriate accounting policies supported by reasonable and prudent
judgments and estimates in conformity with the Central Bank of Nigeria Act.
The Directors are of the opinion that the financial statements give a fair presentation of
the state of the financial affairs of the Bank and of its income and expenditure and cash
flows.
The Directors further accept responsibility for the maintenance of accounting records
that may be relied upon in the preparation of financial statements, as well as adequate
systems of internal financial control.
Nothing has come to the attention of the Directors to indicate that the Bank will not
remain a going concern for at least twelve months from the date of this statement.
SIGNED ON BEHALF OF THE BOARD OF DIRECTORS BY:
Sanusi Lamido Sanusi, CON Stephen Oronsaye, CFR
Chairman Director
24th February 2011 24th February 2011
APPEND
IX B3

Central Bank of Nigeria Annual Report—2011
232
Auditors’ Responsibility
Our responsibility is to express an opinion on these financial statements based on our
audit. We conducted our audit in accordance with International Standards on
Auditing. Those standards require that we comply with ethical requirements and plan and
perform our audit to obtain reasonable assurance about whether the financial
statements are free from material misstatement.
An audit involves performing procedures to obtain audit evidence about the amounts
and disclosures in the financial statements. The procedures selected depend on the
auditor‘s judgment, including the assessment of the risks of material misstatement of the
financial statements, whether due to fraud or error. In making those risk assessments, the
auditors consider internal control relevant to the Bank‘s preparation and fair presentation
of the financial statements in order to design audit procedures that are appropriate in
the circumstances, but not for the purpose of expressing an opinion on the effectiveness
of the Bank‘s internal control. An audit also includes evaluating the appropriateness of
accounting policies used and the reasonableness of accounting estimates made by the
Directors, as well as evaluating the overall presentation of the financial statements.
We believe that the audit evidence we have obtained is sufficient and appropriate to
provide a basis for our audit opinion.
Opinion
In our opinion, the financial statements of the Bank on pages 202 to 204 for the year
ended 31 December 2011 have been properly prepared in accordance with the
accounting policies set out on pages 205 to 210 and comply with the provisions of the
Central Bank of Nigeria Act No. 7 of 2007and other applicable regulations.
Chartered Accountants Chartered Accountants
Abuja, Nigeria Lagos, Nigeria
28 February 2012 28 February 2012
APPEN
DIX B3

Central Bank of Nigeria Annual Report—2011
233
APPENDIX C
GLOSSARY OF SELECTED TERMS
Approval in Principle: This refers to the grant of an initial permit/permission to any
financial institution, pending the time it would meet the necessary requirements
for operation to qualify it for a formal licence.
Balance of Payments (BOP): These are records of economic transactions
between the residents of a country and the rest of the world during a given
period of time. The major components of a BOP are the current account, the
capital account and the official settlement balance. The current account
comprises transactions arising from the sale or purchase of goods and services
and unrequited transfers, while the capital account is the record of assets and
financial transactions. The official settlement account is used to equalise any
imbalance that may exist in the current and capital accounts so that all the BOP
accounts sum to zero.
Balance of Payments Position: see Foreign Exchange and Balance of Payments
Position
Bank Credit is a major determinant of the money supply and it embraces the
amount of loans and advances given by the CBN as well as deposit money banks
to economic agents. This is the banking system credit to the economy which can
be broken down into bank credit to government and the private sector.
Capital Expenditure: Payment for non-financial assets used in the production
process for more than one year. Loan amortisation (capital repayment) is
included.
Cost of Capital is the cost incurred in securing funds or capital for productive
purposes. The cost includes interest rate, legal, administrative and information
search charges. This means that cost of capital is likely to be greater than or
equal to interest rates on loans.
Cost of Funds: This refers to net expenses incurred in raising funds, including a
reasonable profit margin. The expenses include the interest on deposits, reserve
APPEND
IX C

Central Bank of Nigeria Annual Report—2011
234
requirements and other administrative expenses, as a proportion of total funds
borrowed.
Credit Risk: Credit risk arises from potential that an obligor is either unwilling to
perform an obligation, or its ability to perform such an obligation is impaired,
resulting in loss to the Bank. In addition to direct accounting loss, credit risk should
be viewed in the context of other economic exposures which include opportunity
costs, transaction costs and expenses associated with non-performing assets over
and above the accounting loss.
Debentures are fixed interest-bearing securities. They are usually of two types,
debenture with floating charge and debenture with fixed charge. Debenture
holders are creditors to the company rather than owners.
Debt Stock/GDP: This measures the level of domestic indebtedness relative to the
country‘s economic activity.
Discount House is a financial institution devoted to trading in government
secondary instruments (treasury bills and certificates and other eligible
instruments). The discount house submits bids from authorised dealers, including its
needs for OMO instruments, to the Central Bank and facilitates the payments and
settlement of the transactions.
Distressed Banks: These are banks with problems relating to illiquidity, poor
earnings and non-performing assets. The extreme case of distress is referred to as
insolvency, which implies that a bank‘s liabilities are more than its assets.
Dutch Auction System (DAS): This is a method of exchange rate determination,
through auction, where the bidders pay according to their bid rates. The ruling
rate is arrived at with the last bid rate that clears the market where the authorities
elect to operate a single exchange rate.
Equity Price Risk: Equity price risk is the risk to earnings or capital resulting from
adverse changes in the value of the equity-related portfolios of a financial
institution. The price risk could relate to changes in the overall level of equity
prices or price volatility that is determined by firm specific characteristics.
Exchange Rate: This is the price of one currency in terms of another.
External Assets: These are the reserves held by the monetary authorities, as well as
the banking and non-bank public, in foreign countries. Thus, external assets
APPEND
IX
C

Central Bank of Nigeria Annual Report—2011
235
comprise the external reserves and the private sector holdings of foreign
exchange.
External Reserves: These are portions of foreign exchange receipts saved by the
monetary authorities for the purpose of enhancing the creditworthiness of the
economy, protecting the international value of the domestic currency, and
financing temporary shocks in the balance of payments. Reserves are held in the
form of monetary gold, the reserve position at the International Monetary Fund
(IMF), Special Drawing Rights (SDRs), and foreign bank balances.
Federation Account: This is an account opened by the Federal Republic of
Nigeria into which all revenues of the Federation are paid for eventual distribution
to all tiers of government in Nigeria.
Fiscal Deficit refers to the excess of expenditure over revenue of government. It is
usually assessed by its size in relation to the nominal Gross Domestic Product
(GDP). The fiscal deficits may be financed in various ways – external borrowing
and internal borrowing (banking system and non-bank public). It is inflationary
when financed by the banking system, especially the central banks.
Fiscal Operations: This refers to government financial transactions involving the
collection, spending and borrowing of government for a given period.
Fixed Deposit Rate: When deposits are for a fixed period of time, say 90 or 180
days, the interest rates paid are called fixed deposit rates. They normally attract
higher interest rates; early withdrawals may attract interest penalties.
Foreign Exchange: This is a means of international payments. It includes the
currencies of other countries that are freely acceptable in effecting international
transactions.
Foreign Exchange and Balance of Payments Position: The foreign exchange
position is the difference between foreign exchange receipts and foreign
exchange disbursements. If receipts are higher than disbursements, there is a net
inflow or an accretion to reserves. On the other hand, if receipts are lower, there
is a net outflow and the reserves would be depleted. The balance of payments
position is the difference between the receipts by the residents of one economy
from the rest of the world and the payments by these residents to the rest of the
world. An excess of receipts over payments shows a balance of payments
APPENDIX
C

Central Bank of Nigeria Annual Report—2011
236
surplus, while the reverse represents a deficit. When foreign exchange receipts
and payments are adjusted for valuation changes in reserves, the net position
would be identical to the balance of payments position.
Foreign Exchange Risk: Foreign exchange risk is the current or prospective risk to
earnings and capital arising from adverse movements in currency exchange
rates. Foreign exchange risk may also arise as a result of exposures of banks to
interest rate risk arising from the maturity mismatching of foreign currency
positions.
Government Expenditure: Payment or flow of financial resources out from
government.
High-powered Money: see Monetary Base
Inter-bank Interest Rate: This is the rate that applies to transactions among banks,
mostly for overnight and other short-term funds.
Interest Rate is the price of money. It is the opportunity cost of holding money and
the return for parting with liquidity.
Interest Rate Risk: Interest rate risk arises when there is a mismatch between
positions, which are subject to interest rate adjustments within a specified period.
Interest rate risk is usually assessed from two perspectives: the earnings
perspective which focuses on the impact of variation in interest rate on accruals
or reported earnings, and the economic value perspective which reflects the
impact of fluctuations in interest rates on the economic value of a financial
institution.
Interest rate risk also includes risks associated with the term structure of interest
rates and basis risk. Basis risk is also known as spread risk and it arises when a bank
prices its assets and liabilities using different interest rate basis. On the other hand,
risks associated with the term structure of interest rates are also known as the yield
curve risk. The impact of shifts in the yield curve on earnings is evaluated using
stress tests.
Internal Balance: This refers to a state of convergence between domestic output
and absorption or expenditure. When output is identical with expenditure,
internal balance is considered to have been achieved and the rate of inflation is
expected to be stable. The achievement of the savings-investment identity is also
APPEND
IX C

Central Bank of Nigeria Annual Report—2011
237
viewed as internal balance. Monetary and fiscal policies and external debt
management measures are usually applied to achieve internal balance.
Key Risk Indicator: A key risk indicator is a risk item that has been assessed to be
important, given all relevant factors. This indicator is used to monitor exposure to
risks and could be quantitative or qualitative in nature. It should be forward-
looking in order to serve as an effective risk mitigant.
Liquidity Ratio: This ratio is defined as the ratio of total specified liquid assets to
total current liabilities and reflects the liquidity position of a bank.
Liquidity Risk: Liquidity risk is the potential loss to a bank, arising from either its
inability to meet its obligations as they fall due or to fund increases in assets
without incurring unacceptable costs or losses. Liquidity risk should not be seen in
isolation, because financial risks are not mutually exclusive and liquidity risk is often
triggered by consequences of other bank risks, such as credit, market and
operations risks.
Market Capitalisation is the market value of a company‘s issued share capital. It is
the product of the current quoted price of shares and the number of shares
outstanding. The term is also used as a performance indicator of the capital
market.
Maximum Lending Rate: This refers to the rate charged by banks for lending to
customers with a low credit rating.
Minimum Rediscount Rate: This refers to the amount that is charged by the CBN
for lending to banks in the performance of its function of lender of last resort and
also as a signal of the desired direction of monetary policy.
Monetary Base (or High-powered Money or Reserve Money) comprises certain
liabilities of the CBN and includes currency with the non-bank public and total
bank reserves. The main sources of monetary base are the net foreign assets of
the CBN, net claims on government, claims on government, claims on deposit
money banks, and other assets (net) of the CBN.
Money Supply (or Money Stock) refers to the total value of money in the
economy and this consists of currency (notes and coins) and deposits with deposit
money banks (DMBs). For purposes of policy, there are two variants of money
supply in Nigeria – M1 and M2. M1 is the narrow measure of money supply which
APPENDIX
C

Central Bank of Nigeria Annual Report—2011
238
includes currency in circulation with the non-bank public and demand deposits
(current accounts) at the deposit money banks. M2 is the broad measure of
money supply and includes M1 and savings and time deposits at the DMBs.
Savings and time deposits are also called quasi-money. M2 measures total
liquidity in the economy. Excess liquidity is the amount of liquidity over and above
the optimum level of liquidity, determined by the levels of output and prices.
Net Foreign Assets (NFA) constitute the foreign exchange holdings of the CBN and
the deposit money banks, after netting out the claims of foreigners. Changes in
NFA should reflect developments in the balance of payments. A deficit in the
balance of payments would lead to a decrease in foreign asset holdings and
ultimately the money stock. A surplus in the balance of payments produces the
opposite effect.
New Issues are securities raised in the primary market for the first time.
Nominal Exchange Rate: The nominal exchange rate is the price of one currency
relative to another. The real exchange rate is the nominal exchange rate
deflated by changes in relative prices.
Nominal Interest Rate: This is the actual rental value paid for the use of money or
credit. It includes the effects of inflation and uncertainty.
Offer for Sale is an offer by shareholders to sell existing shares to the public. The
sale is effected usually through stockbrokers and does not affect the capital base
of a company.
Offer for Subscription is an invitation by a company to the public to subscribe to
new issues. This increases the capital base of the company.
Open Market Operations involve the discretionary power of the CBN to purchase
or sell securities in the financial markets in order to influence the volume of liquidity
and levels of interest rates which ultimately would affect money supply. When the
CBN sells financial instruments, the liquidity (excess reserves) of the banking system
reduces. This restricts the capacity of banks to extend credit or induce monetary
expansion. On the other hand, when the CBN purchases such instruments, it
injects money into the system and banks‘ ability to expand credit is enhanced.
APPEND
IX
C

Central Bank of Nigeria Annual Report—2011
239
Operational Risk: Operational risk is the risk of loss resulting from inadequate or
failed internal processes, people and systems, or from external events.
Operational risk is present in virtually all banking transactions and activities.
Other Assets (net) is the other assets of CBN, deposit money banks less (their) other
liabilities.
Preference Shares are shares of companies on which dividends must be paid
before any other shares.
Prime Lending Rate: This is the interest rate applied to loans made to customers
with the highest rating. For each bank, this rate also represents the minimum
lending rate.
Prudential Guidelines: These are guidelines and practices which all licensed
banks are required to adhere to in reviewing and reporting their performance,
particularly in the areas of credit portfolio classification and disclosure; the
provision for non-performing facilities and interest accrual; the classification of
other assets; and off-balance sheet engagements.
Real Exchange Rate: This is the nominal exchange rate deflated by change in
relative prices. See also Nominal Exchange Rate
Real Interest Rate: This is the nominal interest rate adjusted for expected inflation.
In order to encourage savings, real interest rate is expected to be positive.
Recurrent Expenditure: Expenditure on goods and services (other than capital
assets) used in the process of production within one year. Interest on loans is
included.
Required Reserves are a fraction of commercial and merchant banks‘ money
held for the purpose of backing up their deposit operations and partly to control
the level of liquidity in the economy. They are made up of cash reserves and
liquid assets and specified in the form of ratios. The cash reserves ratio is the
percentage of deposit money banks‘ cash deposits with the CBN in relation to
their total demand, savings and time deposits. The liquidity ratio is the
percentage of banks‘ liquid assets to their total deposits liabilities.
Reserve Money: see Monetary Base
Reserve Requirement refers to the proportion of total deposit liabilities which the
deposit money banks are expected to keep as cash in vaults and deposits with
APPEND
IX C

Central Bank of Nigeria Annual Report—2011
240
the CBN. The CBN can control the money stock by varying the requirement as
desirable. Usually, banks keep reserves over and above the legal requirement for
safety. The cash ratio requires the deposit banks to keep a certain proportion of
their total deposit liabilities in cash balances with the CBN, while the liquidity ratio
stipulates the proportion of total deposits to be kept in specified liquid assets,
mainly to safeguard the ability of banks to meet depositors‘ cash withdrawals and
ensure confidence in the banking system. The CBN also has powers to call for
special deposits from banks for the purpose of controlling liquidity.
Rights Issues are shares offered to companies‘ existing shareholders in proportion
to the number of shares held and usually at below the market price to make the
offer attractive.
Savings Deposit Rate: The savings deposit rate is the amount paid by banks for
funds withdrawable after seven days‘ notice. This restriction is, however, seldomly
applied.
Total Reserves: This is the sum of required reserves and excess reserves.
Vault Cash: Deposit money banks keep ―petty cash‖ in their vaults for emergency
transactions before they can access their accounts with the CBN. The amount so
kept is called vault cash.
Ways and Means Advances constitute a portion of credit by the CBN to
government. These are temporary loans to government to bridge shortfalls in
revenue. Statutorily, the CBN must not give more than 12.5 per cent of
government‘s current revenue.
Yield Curve: Shows the relationship between the rate of interest and the time to
maturity of different financial assets.
APPEND
IX C

Central Bank of Nigeria Annual Report—2011
241
Appendix D
Policy Circulars and Guidelines Issued in 2011
1. BANKING SUPERVISION
S/N Name of Circular Reference No. Date
Issued
1. Review of the prudential requirements of 1%
provision on performing loans
BSD/DIR/GEN/CIR/04/013 7/1/2011
2. Re: Monthly submission of credit portfolio
classification by banks
BSD/DIR/GEN/CPC/04/026 2/2/2011
3. Letter to all banks: Reporting of AMCON Bonds BSD/DIR/GEN/AMC/04/034 18/2/2011
4. Re: Reinstatement of capital verification for banks BSD/DIR/GEN/CVB/04/001 15/3/2011
5. Re: Circular to all banks on funds withdrawal by
Federal, States, Local Governments and Parastatals
BSD/DIR/GEN/FWG/04/044 15/3/2011
6. Supervisory intervention framework for the banking
industry in Nigeria
BSD/DIR/GEN/SIF/04/043 15/3/2011
7. Framework for Cross Border Supervision of banks BSD/DIR/GEN/CBF/04/002 4/4/2011
8. Guidance document to deposit money banks on
the reinstatement of December 31, 2010 financial
balances of IFRS-based figures as required by IFRS 1
BSD/DIR/GEN/AMC/04/034 11/4/2011
9. Re: Data exchange agreements with at least two
licensed credit bureaus in Nigeria
BSD/DIR/GEN/DEA/04/004 12/4/2011
10. Request for information on capital exportation BSD/DIR/GEN/ICE/04/005 13/4/2011
11. Re: Treatment of loans fully provided for by banks BSD/DIR/GEN/LWO/04/006 21/4/2011
12. Re: Management and custody of pension funds by
some licensed banks
BSD/DIR/GEN/LTB/04/007 3/5/2011
13. Corporate account opening requirements – Tax
Identification Number
BSD/DIR/GEN/LTB/04/070 13/6/2011
14. Dial-up connectivity options for external
stakeholders
BSD/DIR/GEN/DCO/04/080 20/6/2011
15. Re: Treatment of loans fully provided for by banks BSD/DIR/GEN/LPF/04/008 6/7/2011
16. Request for information on terrorists and related
accounts
BSD/DIR/GEN/TRA/04/088 1/8/2011
17. The requirement for Credit Risk Management
System (CRMS) checks for credit requests
BSD/DIR/GEN/CRM/04/089 2/8/2011
18. Compliance with the provisions of the Fiscal
Responsibility Act 2007
BSD/DIR/GEN/DMB/04/091 9/8/2011
19. De-Marketing of Banks by Other Banks BSD/DIR/GEN/DOB/04/104 22/9/2011
20. Guarantee of Foreign Credit Lines BSD/DIR/GEN/FCL/04/115 14/10/2011
21. Re: Treatment of loans fully provided for by banks BSD/DIR/GEN/LFP/04/010 18/10/2011
22. Re: The need for banks to development and
implement a risk-based pricing model
BSD/DIR/GEN/RPM/04/120 20/10/2011
2. FINANCIAL POLICY & REGULATION DEPARTMENT
S/N Reference No. Name of Circular Date Issued
1. FPR/DIR/CIR/AML/CFT/01/001 The Circular informed Stakeholders of the
Gazetting of the AML/CFT Regulation. The
Circular also m\Mandated Deposit Money
Banks to Comply with the Provisions of the
Regulation.
5/5/2010
2 FPR/DIR/GDL/01/002 The Circular Listed the Various Names
Associated with a Terrorist Group (AQI) and
17/6/2010
APPEND
IX D

Central Bank of Nigeria Annual Report—2011
242
Required Banks to Render Returns upon
Discovery of any Related Account within their
Institutions.
3 FPR/DIR/CIR/AML/CFT/01/002 This Circular Required Banks to Forward all
AML/CFT Returns to the Director, Financial
Policy & Regulation Department.
8/7/2010
4 FPR/DIR/CIR/CFP/Vol.1/003 The Circular Directed Banks to Review their
Processes for Handling exited Staff Matters and
to Issue Favourable/Adverse Clearances within
60 days of the date of receipt of the request for
clearance.
15/7/2010
5 This Policy Listed the Terms/Conditions for the
Grant of Liquid Asset Status to State
Governmental Bonds.
9/9/2010
6 FPR/DIR/CIR/FXM/01/004 The Circular informed Stakeholders of the
Revocation of the Licences of Class ‗A‘
Bureaux De Change
02/11/10
3. FINANCIAL MARKETS DEPARTMENT
S/N Name of Circular Reference No. Date Issued
1. Guidelines for FX derivatives and modalities for
CBN FX forwards
FMD/DIR/GUI/FXF/VOL/1/001 31/1/2011
2 Guidelines for the operation of the Foreign
Exchange Market – Wholesale Dutch Auction
System (WDAS-FWD)
FMD/FED/CIR/GEN/01/083/11 22/3/2011
3. Guidelines for foreign Exchange Derivatives in the
Nigerian Financial Markets
FMD/FED/CIR/GEN/01/084/11 22/3/2011
4. Guidelines for the use of AMCON Bonds in CBN
Operations
FMD/DIR/CIR/GEN/01/001 8/4/2011
5. Suspension of reserve averaging scheme and
change in cash reserve requirement
FMD/DIR/GEN/CIR/02/004 11/10/2011
4. TRADE AND EXCHANGE DEPARTMENT
S/N Name of Circular Reference No. Date
Issued
1. The appointment of six (6) additional inspections Agent
for the inspection of Oil and Gas export from Nigerian
under the Nigerian Export Supervision Scheme (NESS).
TED/FEM/FPC/GEN/01/005 11/2/2011
2. Director to all Authorised Dealer banks to endorse the
Department of Petroleum Resources (DPR) permit used
for importation of petroleum products. This was to
reduce incidence of opening multiple L/Cs for
importation of Petroleum Products.
TED/FEM/FPC/GEN/01/007 13/5/2011
3. The lifting of restriction of foreign investors from investing
in Federal Government Bonds with tenor of less than one
year. The circular stipulated that foreign investors can
now invest in Government Bond of any tenor.
TED/FEM.FPC/GEN/01/009 24/6/2011
4. Foreign Exchange Cash Sales to Bureaux De Change
(BDCs) by banks. Authorised Dealers are allowed to sale
a maximum of US$1,000,000.00 BDC per week and BDC
are allowed to buy from only one Authorised Dealer per
week from autonomous funds.
TED/FEM/FPC/GEN/01/012 12/8/2011
5. Foreign Exchange Cash Sales to Bureaux De Operators TED/FEM/FPC/GEN/01/013 12/8/2011
APPEN
DIX
D

Central Bank of Nigeria Annual Report—2011
243
by CBN was increased from USD50,000.00 to
USD100,000.00 with effect from Wednesday 17th August,
2011.
6. All Authorized Dealers were requested to submit relevant
document evidencing the utilization of foreign exchange
for the importation of the following products:
Petroleum Products,
Cement,
Rice, and
Wheat
TED/FEM/FPC/GEN/01/014 15/8/2011
7. Companies engaged in product SWAP arrangement
with NNPC/PPMC are barred from acceding WDAS funds
for consummation of petroleum products imports.
Instead, they use the proceeds of the SWAP to fund the
transactions.
TED/FEM/FPC/GEN/01/018 5/10/2011
8. All remittance in respect of dividends, capital and
proceeds of investment, proceeds of sales of
international air ticket and consultancy services shall
henceforth be consummated through the use of
autonomous funds.
TED/FEM/FPC/GEN/01/020 13/10/201
1
9. Policy measure to streamline petroleum products
importation. Authorised Dealers establishing Letters of
Credit and Bills for collection for the Importation of
Petroleum Product s are required to obtain prior
approval from the CBN and to submit shipping
documents after the transaction.
TED/FEM/FPC/GEN/01/021 13/10/201
1
10. In the continuous effort to sustain stability in the foreign
exchange market, the Central Bank of Nigerian shall
from time to time intervene in the inter-bank market to
either buy or sell.
Any Authorised Dealer interested in participating in the
CBN intervention will do so by submitting bid and offer
rate for a specific amount and the spread between the
bid and offer rates shall not exceed 20 pips (i. e 20 kobo)
TED/FEM/FPC/01/025 20/10/201
1
5. BANKING AND PAYMENTS SYSTEM DEPARTMENT
S/N Reference
No.
Name of Circular Date
Issued
1. The Circular made Clarifications on the Policy of N10 million
Maximum cap for single Cheque Payment as follows:
Cheques (to include Bank Drafts and Manager
Cheque)
In-House Cheques Drawn by all Classes of Account
holders of the same Bank and or Branch
Across-the-Counter Cash Withdrawals with Cheque by
Customers of Banks
Dividend/Interest Warrant
All Classes of Cheques Issued Prior to the Take-Off Date
of the Policy with Value Higher than N10 Million, but yet
to be paid after January 1, 2010. Cheques in this
Category were Allowed to be Presented within Two
Weeks from January 4, 2010.
4/1/2010
2 Circular on Accreditation of Cheque Printers :
The Circular Notified the Public that the CBN has Approved the
1/3/2010
APPENDIX
D

Central Bank of Nigeria Annual Report—2011
244
Accreditation and Re-accreditation of 14 Cheque Printers
Under ―Nigeria Cheque Printer Accreditation Scheme‖
(NICPA)
3 Standards and Guidelines on Automated Teller Operations in
Nigeria:
No ATM Owner of Acquirer shall Discriminate Against
any Card Scheme or Issuer
ATM Complaints to be Responded to within a
Maximum of 72 Hours from the Date of Receipt the
Complaints
PIN Change shall be Provided Free of Charge
Throughout the Entire Value Chain
The ATM Downtime (Due to Technical Fault) is not more
than Seventy-Two (72) Hours Consecutively and
Helpdesk Contacts should be Adequately Displayed
All ATM Surcharges are to be fully Disclosed to
Customers
Every ATM shall have Cameras which shall View and
Record all Persons using the Machines and every
Activity at the ATM. Where the User of an ATM Blocks
His Image for Camera Capture, the ATM shall be
Capable of Aborting the Transaction.
Liability Shifts in the Event of ATM Fraud is Provided.
04/2010
4 Nigerian Uniform Bank Account Number (NUBAN) Standards:
-The Proposed NUBAN is a 10-digit Bank
Account Number format, with the Following
Structure:
- Account Serial Number
- A Check Digit constructed to support a Modulus
Check, which Enables the Presenting Bank to Perform Checks
The Check Digit is Derived from an Algorithm that
Operates on a Combination of the 3-Digit CBN-
Assigned Bank Code and the 9-Digit Account Serial
Number.
Every Bank is Required to Create and Maintain a
NUBAN Code for Every Customer Account (Current,
Savings, etc) in its Customers Records Database, and
the NUBAN Code should be the Only Account Number
to be used at all Interfaces with a Bank Customer.
The Bank Customer should be provided with only the
NUBAN Code Supplied by the Customer to the
Relevant Internal Account Number within the Bank‘s
Technology System.
Effective Date for the Implementation is 9 Months
19/8/2010
5 Circular on Interoperability and Interconnectivity of the
Payments System Infrastructure in Nigeria:
The Circular stipulated that all Parties to the Nigerian Switching
Infrastructure shall ensure that:
All Terminal Access Devices (POS and ATM etc) are
Configured to Accept and Process All Payment Cards
Schemes and other Electronic Payment Instruments
that are Acceptable in Nigeria on or before 1st
December 2010.
Their Switching Systems connect to the Nigeria Central
Switch and only One Other Private Switch of their
Choice as Determined by their Business Case. All
25/8/2010
APPEND
IX
D
APPEND
IX D

Central Bank of Nigeria Annual Report—2011
245
Participants with Multiple Connection to Private
Switches are hereby given till December 1, 2010 to
Terminate all multiple Connections as appropriate.
6 Circulars on the Need to Combat Card Fraud:
No Debit Card should be Issued on an Account without
a Written Request from the Account Holder.
Henceforth, DMBs shall bear Liability for any Fraud
Perpetrated with the Use of Cards Issued without
written Request from the Account Holder, and such
Card must be Delivered in such a Manner that the
Confidentiality of the Information is not Compromised.
DMBs should set and Implement Mandatory Daily Limits
for ATM Cash Withdrawals. All other related
Transactions, including POS and WEB Purchases should
be Subject to Stringent Limits as Agreed and
Documented between the DMBs and their Customers.
It is the Responsibility of the DMBs to Ensure that the
Agreements are Documented and that such Limits are
Embedded with the Card so as to Automatically initiate
a trigger when Limits are exceeded.
The Use of 2nd Level Authentication for Internet
Transactions is now Mandatory for all Payment Cards.
It is the responsibility of the Issuer to Ensure that
Transactions Emanating from its WEB Merchants are
Properly Scrutinized and Operations are Permitted Only
After 2nd Level Verification.
DMBs must Send SMS Alerts to the Telephone/emails
Addresses of Cardholders whenever there is a Debit
Transaction via Payment Card. Evidence of the
Dispatch of such Messages would be required in Cases
of no-receipt of the Alerts by Account Holders as a
Result of Telephone Network Failures.
Cardholders should be Provided with a Facility to Block
their Accounts Immediately from their Mobile Phones
whenever the SMS Alert is received in Respect of
Suspicious Transactions so as to Prevent Further
Fraudulent Transactions from being Perpetrated.
All Card Issuing Banks should deploy Fraud Monitoring
Tools that have the Capability to Monitor the normal
spending trends of a Card Holder as ell as
Automatically Stop Abnormal Transactions that are
Perceived to be Fraudulent. The Block shall only be
Lifted by Express Instruction by the Card Holder.
The Use of Temporary Staff, i.e Students on Industrial
Attachment/Vacation Job, NYSC Members and
Contract Staff for Card Management and
Issuance/Distribution of PIN Mailers should be stopped
forthwith.
30/8/2010
7 Circular on Compliance with Due Diligence in the Deployment
of Point of Sale (POS) Terminals:
The Circular Stipulated that the Deposit Money Banks should:
Conduct Proper KYC on all their Merchants with POS
Set Merchants Limits Based on the Volume of
Business/Commercial Activities
Set Customer Limit Based on Card Class
Instruct Merchants to Enforce Cardholder‘s
19/10/2010
APPEND
IX
D

Central Bank of Nigeria Annual Report—2011
246
Identification at the Point of Payment for Transactions
above a Specific Limit as Agreed Between the Bank
and the Merchant.
8 Circular to All Approved Mobile Payments Scheme Operators:
The Circular Stipulated that the Sixteen Mobile Payment
Scheme Operators should observe the following:
A four-month, closed pilot run in no more than four
Locations, one Urban Area and Three Rural Area
The Pilot run should be limited to not more than 5,000
Participants and not more than 100 agents.
Not to commence Media Campaign during the Pilot
Run.
13/12/2010
6. CURRENCY OPERATIONS
S/N Name of Circular Reference No. Date
Issued
1. List of Armoured Vehicles deployed by Deposit
Money Banks Issued 8th February, 2011:
The circular was issued to inform all Deposit
Money Banks and the Registered Cash-In-
Transit Companies that all existing bullet proof
and armoured cash in transit vans should
undergo a re-certification process with
Standards Organization of Nigeria (SON) to
ensure that they meet the requirements for
operations.
COD/DIR/GEN/CIT/04/048 8/2/2011
2. Approval of Registration of Cash-in-transit and
Currency Sorting Operators by the Central Bank of
Nigeria issued on the 23rd March, 2011:
The circular was issued to inform all Deposit
Money Banks that the under listed companies
have been given full registration and as cash-
in-transit operators and Approval-In-Principle
as Currency Sorting (Processing) Operators
with effect from November, 2010:
a Bankers Warehouse Limited
b Integrated Cash Management Limited (ICMS)
COD/DIR/GEN/CIT/04/052 23/3/2011
3. Industry Policy on Retail Cash Collection and
Lodgment (IITP/C/001) issued 20th April, 2011:
The goal of the policy was to reduce the high
usage of cash, moderate the cost of cash
management and also encourage the use of
electronic payment channels, particularly
Point of Sales (POS).
The circular stated a daily cumulative limit of
N150,000 and N1,000,000 of free cash
withdrawals and lodgment by individuals and
corporate customers respectively with DMBs.
COD/DIR/GEN/CIT/05/031 20/4/2011
APPEND
IX D

Central Bank of Nigeria Annual Report—2011
247
4. Modalities on Implementation of Cash Policy for
Cash-Less Lagos:
The circular provides clarifications on the
implementations strategy and other relevant
information of the Cash Policy for the Cash
Less Lagos Pilot Scheme which commenced
on 1st January 2012.
19/12/2011
APPEND
IX D

Central Bank of Nigeria Annual Report—2011
248
Mar Jun Sep Dec Mar Jun Sep Dec Mar Jun Sep Dec Mar Jun Sep Dec Mar Jun Sep Dec
Government Securities
Treasury Bill Issue Rate 6.85 6.59 7.10 7.75 8.50 8.30 8.80 8.70 4.00 7.40 6.40 6.40 1.49 3.05 5.23 9.10 8.89 8.83 9.32 15.67
Minimum Rediscount Rate
Monetary Policy Rate 3/ 10.00 8.00 8.00 9.50 9.50 10.25 9.75 9.75 9.75 8.00 6.00 6.00 6.00 6.00 6.25 6.25 7.50 8.00 9.25 12.00
Deposit Rates (Weighted Average)
Savings 4.30 3.78 3.05 3.19 2.94 2.79 2.75 2.92 2.62 2.67 2.36 3.33 3.03 1.95 1.49 1.51 1.41 1.40 1.46 1.41
Call 4.19 3.60 3.87 4.03 3.78 4.02 4.47 4.63 5.36 4.55 6.04 4.80 2.66 1.63 3.34 1.82 4.67 6.50 1.73 5.00
Term Deposits Maturing in:
7 days 5.55 5.74 6.12 5.82 6.46 5.98 5.92 6.64 5.90 6.71 6.08 5.77 2.91 2.64 1.80 1.77 2.04 2.06 2.13 3.39
1 month 10.48 10.25 10.43 10.18 10.61 11.26 12.13 11.65 12.92 11.69 11.12 12.73 7.36 4.51 3.58 3.66 4.21 4.52 4.71 6.58
3 months 10.46 10.24 10.37 10.29 10.40 11.96 12.81 12.26 12.84 12.63 12.17 13.15 8.60 4.98 5.16 4.63 5.36 5.14 5.49 6.80
6 months 10.00 10.00 9.49 9.53 9.72 11.76 13.06 12.45 12.57 13.12 12.42 13.34 7.59 4.85 4.40 3.50 4.44 5.26 4.79 5.63
12 months 8.30 8.02 8.12 7.92 10.01 11.95 12.95 12.41 11.44 12.67 13.25 12.17 5.55 4.90 3.68 3.53 4.25 4.68 4.47 7.12
Over 12 months 9.31 10.06 9.45 9.67 9.69 12.11 13.26 12.51 13.02 13.24 4.98 14.13 6.59 4.23 2.17 5.49 5.16 7.39 7.36 6.13
Lending Rates (Weighted Average)
Prime 17.18 16.92 16.46 16.46 15.23 15.17 14.77 15.26 19.19 19.08 18.91 19.55 19.03 17.65 16.66 15.74 15.81 15.76 15.87 16.75
Maximum 18.92 18.74 18.27 18.21 17.58 18.03 19.24 21.15 22.62 22.67 22.81 23.77 23.62 22.03 22.20 21.86 22.02 22.02 22.09 23.21
Average Term Deposit 9.02 9.05 9.00 8.90 9.48 10.83 11.69 11.32 11.45 11.68 10.00 11.88 6.43 4.35 3.47 3.76 4.25 4.84 4.82 5.94
Spread (Maximum Lending-Average Term Deposit) 9.91 9.69 9.28 9.31 8.09 7.19 7.55 9.83 11.17 10.99 12.81 11.89 17.19 17.68 18.74 18.09 17.77 17.18 17.27 17.27
Inter-bank call Rate (weighted average) 7.68 8.46 6.24 8.99 9.37 11.23 15.42 12.17 20.60 18.60 9.70 4.68 1.50 2.73 2.71 8.03 8.78 11.66 10.50 15.50
1/ Revised
2/ Provisional
3/ MRR was changed to MPR in December 2006
Source: Central Bank of Nigeria
2011 /2
Table 1
Selected Interest Rates
(Per cent)
2007 2008 2009 2010 /1

Central Bank of Nigeria Annual Report—2011
249
No
Amount
(N' Thousand) No
Amount
(N' Thousand) No
Amount
(N' Thousand) No
Amount
(N' Thousand) No
Amount
(N' Thousand) No
Amount
(N' Thousand) No
Amount
(N' Thousand)
LIVESTOCK
Poultry - - 11 170.0 223 16,800.5 258 45,338.0 2,144 1,433,279.9 2,636 1,495,588.4 5 14.7
Cattle - - 27 270.0 296 14,839.0 283 31,579.0 278 157,312.0 884 204,000.0 2 2.0
Sheep/Goat - - 6 85.0 239 11,000.0 40 3,609.5 99 47,148.5 384 61,843.0 1 0.6
Others - - - - 5 180.0 54 8,620.0 386 108,032.0 445 116,832.0 1 1.1
Sub-Total - - 44 525.0 763 42,819.5 635 89,146.5 2,907 1,745,772.4 4,349 1,878,263.4 8 18.4
FISHERIES - - 10 175.0 123 5,695.0 104 10,518.0 1,605 573,279.5 1,842 589,667.5 3 5.8
MIXED FARMING - - 257 33,180.0 536 37,180.0 394 56,985.0 896 223,880.0 2,083 351,225.0 4 3.4
FOOD CROPS
Vegetables - - 89 1,672.4 567 26,260.6 426 30,834.4 349 77,227.5 1,431 135,994.9 3 1.3
Beans - - - - 2 100.0 4 346.5 63 22,713.0 69 23,159.5 0 0.2
Soya Beans - - - - 14 680.0 3 260.0 48 13,314.0 65 14,254.0 0 0.1
Grains 50 235.00 3,794 60,539.3 10,586 452,718.0 10,812 904,048.9 10,738 2,775,254.6 35,980 4,192,795.8 64 41.1
Tuber/Roots - - 112 1,597.0 837 38,075.0 1,706 153,471.5 5,741 2,262,668.0 8,396 2,455,811.5 15 24.1
Sub-Total 50 235.00 3,995 63,808.7 12,006 517,833.5 12,951 1,088,961.3 16,939 5,151,177.1 45,941 6,822,015.7 82 66.9
CASH CROPS
Oil Palm - - 3 60.0 12 570.0 40 3,200.0 157 78,110.0 212 81,940.0 0 0.8
Rubber - - - - - - - - - - - - - -
Ginger - - - - - - - - 1 500.0 1 500.0 0 0.0
Cotton - - - - - - - - - - - - - -
Groundnuts - - 227 4,255.3 84 3,779.7 11 1,080.0 40 7,210.0 362 16,324.9 1 0.2
Cocoa - - - - 7 310.0 11 1,000.0 28 8,955.0 46 10,265.0 0 0.1
Sub-Total - - 230 4,315.3 103 4,659.7 62 5,280.0 226 94,775.0 621 109,029.9 1 1.1
OTHERS - - 4 75.0 245 11,175.0 240 20,167.5 907 412,228.3 1,396 443,645.8 2 4.4
Total 50 235.00 4,540 102,079.0 13,776 619,362.7 14,386 1,271,058.3 23,480 8,201,112.3 56,232 10,193,847.3 100.00 100.0
Table 2
Loans Guaranteed under ACGSF By Size and Purpose
(January - December, 2011)
Purpose
5,000 & Below 5,001 - 20,000 20,001 - 50,000 50,001 - 100,000 Above 100,000 Total Percentage of Total

Central Bank of Nigeria Annual Report—2011
250
Year Month Vault Cash
Currency
Outside Banks
Currency in
Circulation
2007 December 222.9 737.9 960.8
January 197.9 668.0 865.9
February 179.1 687.6 866.7
March 229.0 662.8 891.8
April 224.1 674.8 898.9
May 256.7 660.2 916.9
June 245.2 673.1 918.3
July 231.8 705.1 936.9
August 221.3 727.0 948.3
September 219.6 756.8 976.4
October 223.0 743.2 966.1
November 243.8 744.3 988.2
December 262.7 892.7 1,155.3
January 225.4 839.2 1,064.6
February 209.3 814.9 1,024.2
March 233.7 804.1 1,037.8
April 224.4 823.8 1,048.1
May 262.5 764.4 1,026.9
June 260.1 746.5 1,006.6
July 241.4 766.9 1,008.3
August 259.6 759.9 1,019.4
September 253.1 778.7 1,031.9
October 238.8 781.3 1,020.1
November 257.2 851.4 1,108.6
December 254.3 927.2 1,181.5
January 247.7 820.5 1,068.2
February 237.3 812.1 1,049.4
March 252.9 833.6 1,086.5
April 241.3 831.3 1,072.6
May 239.3 817.4 1,056.7
June 268.2 795.4 1,063.6
July 271.2 805.7 1,076.9
August 272.5 822.2 1,094.7
September 244.5 880.9 1,125.4
October 278.3 874.9 1,153.2
November 335.3 892.3 1,227.6
December* 295.8 1,082.3 1,378.1
January 307.0 1,033.4 1,340.4
February 312.2 1,024.7 1,336.8
March 303.7 1,112.7 1,416.4
April 351.2 1,141.1 1,492.3
May 346.6 1,055.2 1,401.8
2011 June** 337.5 1,016.4 1,354.0
July** 303.9 1,039.8 1,343.6
August** 319.2 1,060.5 1,379.7
September** 330.6 1,012.4 1,343.0
October** 321.4 1,038.2 1,359.6
November** 321.6 1,069.1 1,390.7
December** 320.9 1,244.8 1,565.8
* Revised
** Provisional
Table 3
Currency in Circulation (Naira Billion)
2008
2009
2010

Central Bank of Nigeria Annual Report—2011
251
Category Dec-07 Dec-08 Dec-09 Dec-10 1/ Dec-11 2/
1.Domestic Credit (net) 2,688,236.5 4,951,860.3 7,917,041.4 8,708,545.5 12,403,176.5
(a) Claims on Federal Government (net) -2,368,484.4 -3,107,688.6 -2,302,294.7 -1,121,798.6 -531,164.8
By Central Bank -4,074,422.8 -4,532,113.6 -3,731,603.8 -2,884,013.4 -3,548,750.3
By Deposits Money Banks 1,705,938.5 1,424,425.0 1,429,309.2 1,762,214.8 3,017,585.5
(b) Claims on Private Sector 5,056,720.9 8,059,548.9 10,219,336.1 9,830,344.1 12,934,341.3
By Central Bank 236,025.2 260,148.8 551,459.4 532,171.0 3,319,895.5
By Deposits Money Banks 4,820,695.7 7,799,400.1 9,667,876.7 9,198,173.1 9,614,445.8
(i) Claims on State and Local Governments 3/ 87,753.6 149,765.1 310,324.3 369,809.8 513,218.7
By Central Bank 0.0 0.0 0.0 0.0 0.0
By Deposits Money Banks 87,753.6 149,765.1 310,324.3 369,809.8 513,218.7
(ii) Claims on Non-Financial Public Enterprises 0.0 0.0 13,249.4 0.0 0.0
By Central Bank 0.0 0.0 13,249.4 0.0 0.0
By Deposits Money Banks
(iii) Claims on Other Private Sector 4,968,967.3 7,909,783.8 9,895,762.5 9,460,534.3 12,421,122.7
By Central Bank 236,025.2 260,148.8 538,210.1 632,171.0 3,319,895.5
By Deposits Money Banks 4,732,942.1 7,649,635.0 9,357,552.4 8,828,363.2 9,101,227.1
(2) Foreign Assets (net) 4/ 7,266,512.1 8,550,430.3 7,593,321.8 6,506,618.6 7,180,637.8
By Central Bank 6,570,263.7 7,270,807.4 6,522,239.5 5,372,285.8 5,865,759.3
By Deposits Money Banks 696,248.4 1,279,622.9 1,071,082.3 1,134,332.8 1,314,878.5
(3) Other Assets (net) -4,144,922.1 -4,335,455.3 -4,729,736.1 -3,689,633.7 -6,283,475.1
Total Monetary Assets 5,809,826.5 9,166,835.3 10,780,627.1 11,525,530.3 13,300,339.2
Quasi-Money 5/ 2,693,554.3 4,309,523.1 5,763,511.2 5,954,260.5 6,531,913.0
Money Supply 3,116,272.1 4,857,312.2 5,017,115.9 5,571,269.9 6,768,426.2
Currency Outside Banks 737,867.2 892,675.6 927,236.4 1,082,185.2 1,244,848.6
Demand Deposits 6/ 2,378,404.9 3,964,636.7 4,089,879.5 4,488,974.8 5,523,577.6
Total Monetary Liabilities 5,809,826.5 9,166,835.3 10,780,627.1 11,525,630.3 13,300,339.2
GROWTH RATE OVER THE PRECEDING DECEMBER (%)
Credit to the Domestic Economy (net) 276.4 84.2 59.9 10.0 42.4
Credit to the Private Sector 90.8 59.4 26.6 -3.8 31.6
Claims on Federal Government (net) -22.3 -31.2 25.9 51.3 52.7
By Central Bank -45.7 -11.2 17.7 22.7 -23.0
Claims on State and Local Governments 8.8 70.7 107.2 19.2 38.8
Claims on Non-Financial Public Enterprises -100.0 0.0 0.0 0.0
Credit to the Other Private Sector 94.3 59.2 25.1 -4.4 31.3
Foreign Assets (net) 15.2 17.7 -11.2 -14.3 10.4
Other Assets (net) -38.4 -4.6 -9.1 22.0 -70.3
Quasi-Money 54.2 60.0 33.7 3.3 9.7
Money Supply (M1) 36.6 55.9 3.3 11.1 21.5
Broad Money (M2) 44.2 57.8 17.6 6.9 15.4
NOTES :
1/ Revised
2/ Provisional
3/ For the purpose of monetary and credit survey, credit to government sector refers strictly to Federal Government and excludes state and local governments.
4/ External assets and liabilities were converted into naira at the official rate on the balance sheet date, except holdings purchased at the AFEM.
5/ Quasi-Money consists of Time, Savings and Foreign Currency Deposits of Deposit Money Banks excluding takings from Discount Houses.
6/ Demand Deposits consist of state, local and parastatals deposits at the CBN; state, local and private sector deposits as well as demand deposits of
non-financial public enterprises at Deposit Money Banks.
Source: Central Bank of Nigeria
Table 4
Money Supply and Its Determinants
(Naira million)
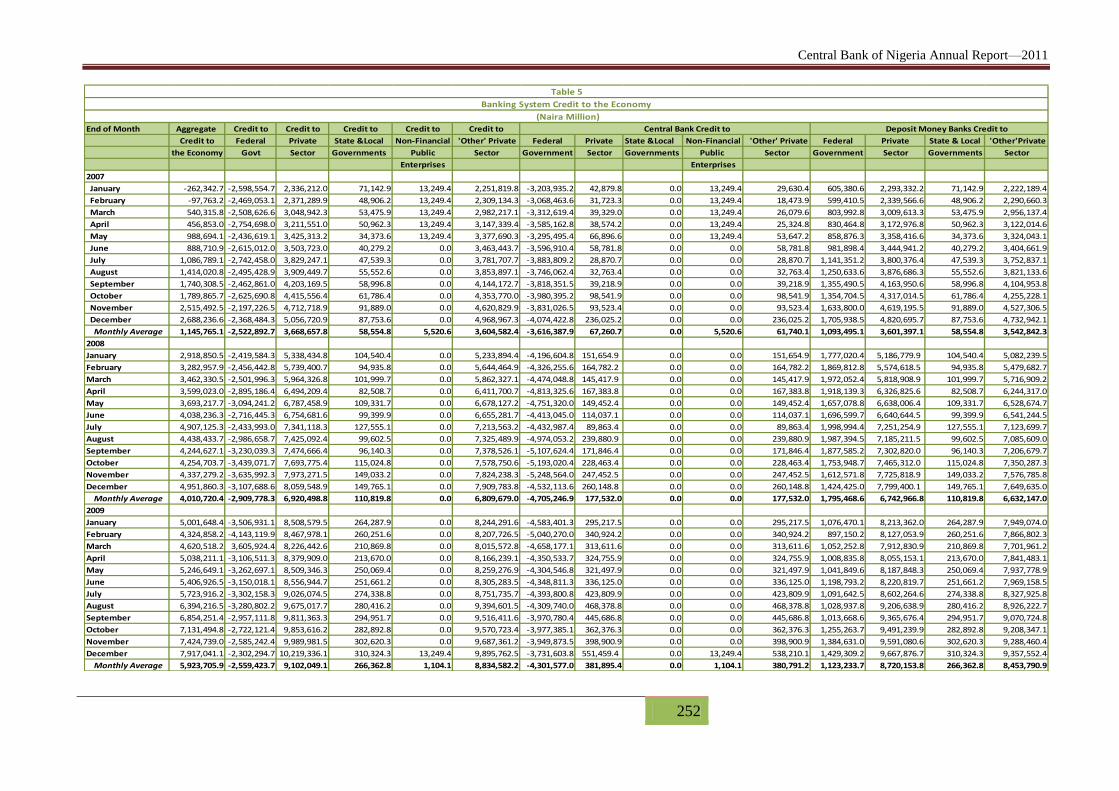
Central Bank of Nigeria Annual Report—2011
252
End of Month Aggregate Credit to Credit to Credit to Credit to Credit to
Credit to Federal Private State &Local Non-Financial 'Other' Private Federal Private State &Local Non-Financial 'Other' Private Federal Private State & Local 'Other'Private
the Economy Govt Sector Governments Public Sector Government Sector Governments Public Sector Government Sector Governments Sector
Enterprises Enterprises
2007
January -262,342.7 -2,598,554.7 2,336,212.0 71,142.9 13,249.4 2,251,819.8 -3,203,935.2 42,879.8 0.0 13,249.4 29,630.4 605,380.6 2,293,332.2 71,142.9 2,222,189.4
February -97,763.2 -2,469,053.1 2,371,289.9 48,906.2 13,249.4 2,309,134.3 -3,068,463.6 31,723.3 0.0 13,249.4 18,473.9 599,410.5 2,339,566.6 48,906.2 2,290,660.3
March 540,315.8 -2,508,626.6 3,048,942.3 53,475.9 13,249.4 2,982,217.1 -3,312,619.4 39,329.0 0.0 13,249.4 26,079.6 803,992.8 3,009,613.3 53,475.9 2,956,137.4
April 456,853.0 -2,754,698.0 3,211,551.0 50,962.3 13,249.4 3,147,339.4 -3,585,162.8 38,574.2 0.0 13,249.4 25,324.8 830,464.8 3,172,976.8 50,962.3 3,122,014.6
May 988,694.1 -2,436,619.1 3,425,313.2 34,373.6 13,249.4 3,377,690.3 -3,295,495.4 66,896.6 0.0 13,249.4 53,647.2 858,876.3 3,358,416.6 34,373.6 3,324,043.1
June 888,710.9 -2,615,012.0 3,503,723.0 40,279.2 0.0 3,463,443.7 -3,596,910.4 58,781.8 0.0 0.0 58,781.8 981,898.4 3,444,941.2 40,279.2 3,404,661.9
July 1,086,789.1 -2,742,458.0 3,829,247.1 47,539.3 0.0 3,781,707.7 -3,883,809.2 28,870.7 0.0 0.0 28,870.7 1,141,351.2 3,800,376.4 47,539.3 3,752,837.1
August 1,414,020.8 -2,495,428.9 3,909,449.7 55,552.6 0.0 3,853,897.1 -3,746,062.4 32,763.4 0.0 0.0 32,763.4 1,250,633.6 3,876,686.3 55,552.6 3,821,133.6
September 1,740,308.5 -2,462,861.0 4,203,169.5 58,996.8 0.0 4,144,172.7 -3,818,351.5 39,218.9 0.0 0.0 39,218.9 1,355,490.5 4,163,950.6 58,996.8 4,104,953.8
October 1,789,865.7 -2,625,690.8 4,415,556.4 61,786.4 0.0 4,353,770.0 -3,980,395.2 98,541.9 0.0 0.0 98,541.9 1,354,704.5 4,317,014.5 61,786.4 4,255,228.1
November 2,515,492.5 -2,197,226.5 4,712,718.9 91,889.0 0.0 4,620,829.9 -3,831,026.5 93,523.4 0.0 0.0 93,523.4 1,633,800.0 4,619,195.5 91,889.0 4,527,306.5
December 2,688,236.6 -2,368,484.3 5,056,720.9 87,753.6 0.0 4,968,967.3 -4,074,422.8 236,025.2 0.0 0.0 236,025.2 1,705,938.5 4,820,695.7 87,753.6 4,732,942.1
Monthly Average 1,145,765.1 -2,522,892.7 3,668,657.8 58,554.8 5,520.6 3,604,582.4 -3,616,387.9 67,260.7 0.0 5,520.6 61,740.1 1,093,495.1 3,601,397.1 58,554.8 3,542,842.3
2008
January 2,918,850.5 -2,419,584.3 5,338,434.8 104,540.4 0.0 5,233,894.4 -4,196,604.8 151,654.9 0.0 0.0 151,654.9 1,777,020.4 5,186,779.9 104,540.4 5,082,239.5
February 3,282,957.9 -2,456,442.8 5,739,400.7 94,935.8 0.0 5,644,464.9 -4,326,255.6 164,782.2 0.0 0.0 164,782.2 1,869,812.8 5,574,618.5 94,935.8 5,479,682.7
March 3,462,330.5 -2,501,996.3 5,964,326.8 101,999.7 0.0 5,862,327.1 -4,474,048.8 145,417.9 0.0 0.0 145,417.9 1,972,052.4 5,818,908.9 101,999.7 5,716,909.2
April 3,599,023.0 -2,895,186.4 6,494,209.4 82,508.7 0.0 6,411,700.7 -4,813,325.6 167,383.8 0.0 0.0 167,383.8 1,918,139.3 6,326,825.6 82,508.7 6,244,317.0
May 3,693,217.7 -3,094,241.2 6,787,458.9 109,331.7 0.0 6,678,127.2 -4,751,320.0 149,452.4 0.0 0.0 149,452.4 1,657,078.8 6,638,006.4 109,331.7 6,528,674.7
June 4,038,236.3 -2,716,445.3 6,754,681.6 99,399.9 0.0 6,655,281.7 -4,413,045.0 114,037.1 0.0 0.0 114,037.1 1,696,599.7 6,640,644.5 99,399.9 6,541,244.5
July 4,907,125.3 -2,433,993.0 7,341,118.3 127,555.1 0.0 7,213,563.2 -4,432,987.4 89,863.4 0.0 0.0 89,863.4 1,998,994.4 7,251,254.9 127,555.1 7,123,699.7
August 4,438,433.7 -2,986,658.7 7,425,092.4 99,602.5 0.0 7,325,489.9 -4,974,053.2 239,880.9 0.0 0.0 239,880.9 1,987,394.5 7,185,211.5 99,602.5 7,085,609.0
September 4,244,627.1 -3,230,039.3 7,474,666.4 96,140.3 0.0 7,378,526.1 -5,107,624.4 171,846.4 0.0 0.0 171,846.4 1,877,585.2 7,302,820.0 96,140.3 7,206,679.7
October 4,254,703.7 -3,439,071.7 7,693,775.4 115,024.8 0.0 7,578,750.6 -5,193,020.4 228,463.4 0.0 0.0 228,463.4 1,753,948.7 7,465,312.0 115,024.8 7,350,287.3
November 4,337,279.2 -3,635,992.3 7,973,271.5 149,033.2 0.0 7,824,238.3 -5,248,564.0 247,452.5 0.0 0.0 247,452.5 1,612,571.8 7,725,818.9 149,033.2 7,576,785.8
December 4,951,860.3 -3,107,688.6 8,059,548.9 149,765.1 0.0 7,909,783.8 -4,532,113.6 260,148.8 0.0 0.0 260,148.8 1,424,425.0 7,799,400.1 149,765.1 7,649,635.0
Monthly Average 4,010,720.4 -2,909,778.3 6,920,498.8 110,819.8 0.0 6,809,679.0 -4,705,246.9 177,532.0 0.0 0.0 177,532.0 1,795,468.6 6,742,966.8 110,819.8 6,632,147.0
2009
January 5,001,648.4 -3,506,931.1 8,508,579.5 264,287.9 0.0 8,244,291.6 -4,583,401.3 295,217.5 0.0 0.0 295,217.5 1,076,470.1 8,213,362.0 264,287.9 7,949,074.0
February 4,324,858.2 -4,143,119.9 8,467,978.1 260,251.6 0.0 8,207,726.5 -5,040,270.0 340,924.2 0.0 0.0 340,924.2 897,150.2 8,127,053.9 260,251.6 7,866,802.3
March 4,620,518.2 3,605,924.4 8,226,442.6 210,869.8 0.0 8,015,572.8 -4,658,177.1 313,611.6 0.0 0.0 313,611.6 1,052,252.8 7,912,830.9 210,869.8 7,701,961.2
April 5,038,211.1 -3,106,511.3 8,379,909.0 213,670.0 0.0 8,166,239.1 -4,350,533.7 324,755.9 0.0 0.0 324,755.9 1,008,835.8 8,055,153.1 213,670.0 7,841,483.1
May 5,246,649.1 -3,262,697.1 8,509,346.3 250,069.4 0.0 8,259,276.9 -4,304,546.8 321,497.9 0.0 0.0 321,497.9 1,041,849.6 8,187,848.3 250,069.4 7,937,778.9
June 5,406,926.5 -3,150,018.1 8,556,944.7 251,661.2 0.0 8,305,283.5 -4,348,811.3 336,125.0 0.0 0.0 336,125.0 1,198,793.2 8,220,819.7 251,661.2 7,969,158.5
July 5,723,916.2 -3,302,158.3 9,026,074.5 274,338.8 0.0 8,751,735.7 -4,393,800.8 423,809.9 0.0 0.0 423,809.9 1,091,642.5 8,602,264.6 274,338.8 8,327,925.8
August 6,394,216.5 -3,280,802.2 9,675,017.7 280,416.2 0.0 9,394,601.5 -4,309,740.0 468,378.8 0.0 0.0 468,378.8 1,028,937.8 9,206,638.9 280,416.2 8,926,222.7
September 6,854,251.4 -2,957,111.8 9,811,363.3 294,951.7 0.0 9,516,411.6 -3,970,780.4 445,686.8 0.0 0.0 445,686.8 1,013,668.6 9,365,676.4 294,951.7 9,070,724.8
October 7,131,494.8 -2,722,121.4 9,853,616.2 282,892.8 0.0 9,570,723.4 -3,977,385.1 362,376.3 0.0 0.0 362,376.3 1,255,263.7 9,491,239.9 282,892.8 9,208,347.1
November 7,424,739.0 -2,585,242.4 9,989,981.5 302,620.3 0.0 9,687,361.2 -3,949,873.5 398,900.9 0.0 0.0 398,900.9 1,384,631.0 9,591,080.6 302,620.3 9,288,460.4
December 7,917,041.1 -2,302,294.7 10,219,336.1 310,324.3 13,249.4 9,895,762.5 -3,731,603.8 551,459.4 0.0 13,249.4 538,210.1 1,429,309.2 9,667,876.7 310,324.3 9,357,552.4
Monthly Average 5,923,705.9 -2,559,423.7 9,102,049.1 266,362.8 1,104.1 8,834,582.2 -4,301,577.0 381,895.4 0.0 1,104.1 380,791.2 1,123,233.7 8,720,153.8 266,362.8 8,453,790.9
Table 5
Banking System Credit to the Economy
(Naira Million)
Central Bank Credit to Deposit Money Banks Credit to

Central Bank of Nigeria Annual Report—2011
253
End of Month Aggregate Credit to Credit to Credit to Credit to Credit to
Credit to Federal Private State &Local Non-Financial 'Other' Private Federal Private State &Local Non-Financial 'Other' Private Federal Private State & Local 'Other'Private
the Economy Govt Sector Governments Public Sector Government Sector Governments Public Sector Government Sector Governments Sector
Enterprises Enterprises
2010
January 7,767,070.1 -2,314,928.2 10,081,996.3 310,251.1 13,249.4 9,758,497.8 -3,892,223.4 489,199.3 0.0 13,249.4 489,199.3 1,577,295.2 9,579,549.7 310,251.1 9,269,298.5
February 8,160,595.3 -1,908,865.9 10,069,461.1 304,693.3 13,249.4 9,751,518.5 -3,577,465.3 418,836.0 0.0 13,249.4 405,586.6 1,668,599.4 9,650,625.1 304,693.3 9,345,931.9
March 8,401,200.1 -1,649,471.8 10,050,671.9 321,814.4 13,249.4 9,715,608.1 -3,434,395.3 438,681.9 0.0 13,249.4 425,432.6 1,784,923.4 9,611,990.0 321,814.4 9,290,175.6
April 8,627,031.1 -1,552,194.1 10,079,225.2 331,350.3 13,249.4 9,734,625.5 -3,424,015.6 375,827.9 0.0 13,249.4 375,827.9 1,871,821.4 9,690,148.0 331,350.3 9,358,797.7
May 8,895,874.0 -1,131,095.1 10,026,969.1 315,763.9 13,249.4 9,697,955.8 -3,043,976.1 362,234.9 0.0 13,249.4 362,234.9 1,912,881.0 9,651,484.7 315,763.9 9,335,720.8
June 8,612,940.0 -1,489,877.5 10,102,817.5 319,167.1 0.0 9,783,650.4 -3,272,806.1 396,545.3 0.0 0.0 396,545.3 1,782,928.5 9,706,272.2 319,167.1 9,387,105.1
July 8,595,036.6 -1,315,669.0 9,910,705.6 286,697.3 0.0 9,624,008.3 -3,270,122.2 488,181.4 0.0 0.0 488,181.4 1,954,453.2 9,422,524.2 286,697.3 9,135,826.9
August 9,326,102.8 -787,098.6 10,113,201.4 294,724.9 0.0 9,818,476.5 -2,748,070.5 493,564.1 0.0 0.0 493,564.1 1,960,971.9 9,619,637.3 294,724.9 9,324,912.4
September 9,309,837.5 -1,026,277.3 10,336,114.8 341,241.2 0.0 9,994,873.6 -3,037,356.8 564,780.9 0.0 0.0 564,780.9 2,011,079.5 9,771,333.9 341,241.2 9,430,092.7
October 9,460,245.2 -1,074,120.6 10,534,365.8 384,831.2 0.0 10,149,534.6 -2,894,776.9 664,063.8 0.0 0.0 664,063.8 1,820,656.3 9,870,302.1 384,831.2 9,485,470.8
November 9,547,259.2 -1,201,120.1 10,748,379.3 365,652.0 0.0 10,382,727.3 -2,976,072.8 683,581.8 0.0 0.0 683,581.8 1,774,952.7 10,064,797.6 365,652.0 9,699,145.6
December /1 8,708,545.6 -1,121,798.6 9,830,344.1 369,809.8 0.0 9,460,534.3 -2,884,013.4 63.2171.0 0.0 0.0 632,171.0 1,762,214.8 9,198,173.1 369,809.8 8,826,363.2
Monthly Average 8,784,311.5 -1,381,043.1 10,157,021.0 328,833.0 5,520.6 9,822,667.6 -3,204,607.8 488,681.6 0.0 5,520.6 498,430.8 1,823,564.8 9,653,069.8 328,833.0 9,324,070.1
2011 /2
January 8,685,737.1 -730,969.8 9,416,706.9 391,043.7 0.0 9,025,663.2 -2,823,207.4 532,558.4 0.0 0.0 532,558.4 2,092,237.5 8,884,148.5 391,043.7 8,493,104.9
February 8,614,160.0 -684,129.5 9,178,289.6 355,550.5 0.0 8,822,739.0 -2,965,983.0 424,370.6 0.0 0.0 424,370.6 2,301,853.5 8,753,919.0 355,550.5 8,398,368.4
March 8,206,788.3 -1,240,158.0 944,946.3 376,771.7 0.0 9,070,174.6 -3,401,443.7 437,507.5 0.0 0.0 437,507.5 2,161,285.8 9,009,438.9 376,771.7 8,632,667.2
April 9,121,783.4 -778,250.7 9,900,034.2 364,193.4 0.0 9,535,840.7 -2,544,344.0 447,451.8 0.0 0.0 447,451.8 1,766,093.2 9,542,582.4 364,193.4 9,088,388.9
May 8,963,191.4 -886,057.3 9,849,248.7 379,325.5 0.0 9,469,921.2 -2,718,423.3 633,818.1 0.0 0.0 633,818.1 1,832,366.0 9,215,430.6 379,327.5 8,836,103.1
June 8,908,469.3 -1,064,748.7 9,973,208.0 420,237.9 0.0 9,552,970.1 -2,730,017.1 741,650.6 0.0 0.0 741,650.6 1,665,268.4 9,231,557.4 420,237.9 8,611,319.4
July 8,142,218.6 -1,824,654.7 9,967,073.3 369,903.9 0.0 9,597,169.4 -3,460,542.2 807,873.6 0.0 0.0 807,873.8 1,635,687.5 9,159,199.5 369,903.9 8,789,295.6
August 9,990,749.2 -908,735.9 10,899,485.1 411,873.8 0.0 10,487,611.3 -2,988,275.1 832,612.0 0.0 0.0 838,612.0 2,079,539.1 10,060,873.1 411,873.8 9,646,999.3
September 9,981,560.4 -1,144,455.1 11,126,015.4 400,160.8 0.0 10,725,854.6 -3,244,660.3 885,611.9 0.0 0.0 885,611.9 2,100,205.3 10,240,403.5 400,160.8 9,840,242.7
October 10,848,392.8 -1,364,710.5 12,213,103.3 432,826.2 0.0 11,780,277.1 -3,988,605.4 2,720,191.7 0.0 0.0 2,720,191.7 2,623,894.9 9,492,911.7 432,826.2 9,060,085.5
November 11,226,977.1 -1,191,654.3 12,418,631.4 405,517.0 0.0 12,013,114.4 -3,668,978.8 2,705,242.0 0.0 0.0 2,705,242.0 2,477,324.5 9,713,389.4 405,517.0 9,307,872.4
December 12,403,176.5 -531,164.8 12,934,341.3 513,218.7 0.0 12,421,122.7 -3,548,750.3 3,319,895.5 0.0 0.0 3,319,895.5 3,017,585.5 9,614,445.8 513,218.7 9,101,227.1
Monthly Average 9,591,100.3 -1,029,140.8 9,901,757.0 401,718.6 0.0 10,208,538.2 -3,173,602.6 1,207,398.6 0.0 0.0 1,207,898.7 2,146,111.8 9,409,858.3 401,718.8 8,983,806.2
/1 Revised
/2 Provisional
Table 5 Cont.
Banking System Credit to the Economy
(Naira Million)
Central Bank Credit to Deposit Money Banks Credit to

Central Bank of Nigeria Annual Report—2011
254
Item
Reserves 659,631.3 910,673.4 655,864.4 583,822.1 1,287,075.1 -1.6 38.1 -28.0 -11.0 120.5
Aggregate Credit (Net) 7,076,493.0 9,897,796.2 11,340,061.5 11,217,244.8 12,878,259.1 74.0 39.9 14.6 -1.1 14.8
Loans and Advances 4,493,303.9 7,602,165.8 8,451,378.2 6,629,580.7 6,489,761.8 92.1 69.2 11.2 -21.6 -2.1
Total assets 10,981,693.6 15,919,559.8 17,522,858.2 17,331,559.0 19,396,633.8 53.1 45.0 10.1 -1.1 11.9
Total Deposit Liabilities 5,001,470.5 7,960,166.9 9,150,037.7 9,784,542.4 11,452,763.2 54.1 59.2 14.9 6.9 17.0
Demand deposits 2,307,916.2 3,650,643.9 3,386,526.5 3,830,282.0 4,920,850.2 54.1 58.2 -7.2 13.1 28.5
Time, Savings & Foreign Currencies Deposits 2,693,554.3 4,309,523.1 5,763,511.2 5,954,260.5 6,531,913.0 54.2 60.0 33.7 3.3 9.7
Foreign Assets (Net) 696,248.4 1,279,622.9 1,071,082.3 1,134,332.8 1,314,878.5 -1.2 83.8 -16.3 5.9 15.9
Credit from Central Bank 49,741.6 132,195.3 409,159.1 418,714.0 294,984.1 -21.0 165.8 209.5 2.3 -29.5
Capital Accounts 2,225,394.2 3,364,693.4 4,930,613.0 2,217,804.4 3,682,121.4 60.2 51.2 46.5 -55.0 66.0
Capital & Reserves 1,712,986.5 2,788,537.4 2,201,836.0 429,609.0 2,486,966.7 64.2 62.8 -21.0 -80.5 478.9
Other Provisions 512,407.7 576,156.0 2,728,777.1 1,788,195.5 1,195,154.7 48.2 12.4 373.6 -34.5 -33.2
Average Liquidity Ratio (%) /1 49.7 43.7 31.0 29.6 25.5 -30.5 -34.1 -15.8 -4.8 -13.8
Average Loan/Deposit Ratio (%) /1 71.6 82.8 88.0 76.9 46.9 -13.9 4.2 1.7 -12.1 -39.0
/1 Revised
/2 Provisional
(Naira Million) Growth Rate (%)
Table 6
Summary of Deposit Money Banks' Activities
2007 /1 2008 /1 2009 /1 2010 /1 2011 /2 2007 /1 2008 /1 2009 /1 2010 /1 2011 /2

Central Bank of Nigeria Annual Report—2011
255
Sources Application Sources Application Sources Application Sources Application Sources Application
Assets
Reserves -76,853.9 0.0 0.0 121,576.5 -23,657.6 0.0 -34,043.2 0.0 0.0 41,578.9
Foreign assets 0.0 22,375.2 0.0 500,156.8 -22,565.8 0.0 -11,164.1 0.0 -125,026.6 0.0
Claims on Central Government -543,510.5 0.0 -180,450.9 0.0 0.0 101,251.3 0.0 94,667.8 0.0 377,661.2
Claims on State & Local Government -8,126.1 0.0 0.0 732.0 0.0 19,727.4 0.0 4,157.8 0.0 107,701.7
Claims on Private Sector -767,665.0 0.0 0.0 72,849.2 0.0 80,113.3 -954,169.1 0.0 -206,645.2 0.0
Claims on Other Financial Institutions -363,309.2 0.0 0.0 196,518.0 -24,662.7 0.0 0.0 23,934.8 0.0 114,686.0
Unclassified Assets -776,739.9 0.0 0.0 294,468.3 0.0 92,228.6 -97,416.6 0.0 -184,403.4 0.0
Liabilities
Demand Deposits 0.0 -1,228,858.7 377,843.2 0.0 163,341.5 0.0 34,651.4 0.0 678,265.6 0.0
Time, Savings & Foreign Currency Deposits 0.0 -1,007,699.1 191,350.2 0.0 0.0 0.0 85,851.2 0.0 94,722.6 0.0
Money Market Instruments 0.0 -82,342.2 0.0 -2,924.6 43,709.2 0.0 0.0 -34,296.3 12,936.5 0.0
Bonds 0.0 -8,472.5 7,817.2 0.0 0.0 -3,340.6 843.6 0.0 2,966.2 0.0
Foreign Liabilities 26,106.9 0.0 0.0 -21,645.3 0.0 -38,197.9 393.6 0.0 41,827.1 0.0
Central Government Deposits 0.0 -63,505.6 7,695.9 0.0 0.0 -28,116.1 24,018.9 0.0 0.0 -162,599.8
Credit from Central Bank 21,237.3 0.0 1,319.5 0.0 0.0 -46,949.9 0.0 -45,589.9 51,554.2 0.0
Capital Accounts 0.0 -73,970.2 104,561.0 0.0 403,437.8 0.0 0.0 -1,131,709.7 0.0 -242,626.9
Unclassified Liabilities 0.0 -96,325.4 339,832.8 0.0 0.0 -268,206.2 91,804.6 0.0 0.0 -351,492.9
Funds Sourced & Used 2,583,548.8 2,583,548.9 1,210,870.6 1,210,870.6 681,374.5 681,374.5 1,334,356.4 1,334,356.4 1,398,347.5 1,398,347.5
/1 Revised
/2 Provisional
Table 7
Deposit Money Banks' Sources and Application of Funds
(Naira Million)
Item
2007 /1 2008 2009 /1 2010 2011

Central Bank of Nigeria Annual Report—2011
256
Item 2006 2007 2008 2009 2010 /1 2011 /2
Number of Licensed CBs/MFBs 757 709 745 828 801 821
Number of Reporting CBs/MFBs 757 709 745 828 801 821
Number of Non-Reporting CBs/MFBs
Capital and Reserves 12,619.90 14,250.70 33,361.30 45,258.60 43,997.50 47,332.20
Total Assets 55,056.10 55,616.10 115,124.50 158,795.90 170,338.90 190,721.20
Deposit Liabilities 34,008.80 33,088.30 58,481.30 72,750.60 75,739.60 86,044.00
Loans & Advances 16,498.60 16,450.80 42,024.40 55,818.90 52,867.50 67,632.40
Investments 3,868.20 2,592.40 7,317.70 7,753.60 8,674.20 11,855.50
Average Loan/ Deposit Ratio (%) 48.51 49.72 71.86 76.73 69.80 78.60
Percentage Change (%)
Number of Reporting Banks 4.41 -6.34 5.08 11.14 -3.26 2.50
Capital and Reserves 25.52 12.92 134.10 35.66 -2.79 7.58
Total Assets 19.52 1.02 107.00 37.93 7.27 11.97
Deposit Liabilities 18.40 -2.71 76.74 24.40 4.11 13.61
Loans & Advances 13.41 -0.29 155.46 32.82 -5.29 27.93
Investments 7.63 -32.98 182.28 5.96 11.87 36.68
Sectoral Distribution of Loans & Advances
(i) Agriculture and Forestry 956.10 2,961.57 5,957.80 5,102.90 4,600.90
(ii) Mining & Quarrying 405.00 345.28 491.98 520.40 579.00
(iii) Manufacturing 1,088.7 2,032.4 2,625.0 2,172.8 2,430.6
(iv) Real Estate and Construction 839.8 2,267.9 2,411.5 2,257.4 1,859.3
(v) Commerce 4,504.0 2,126.8 25,036.7 23,333.8 36,741.6
(vi) Transportation/Communication 2,087.4 2,649.2 3,357.0 2,642.1 2,973.5
(vii) Others 6,608.5 16,054.9 20,554.9 16,957.0 27,727.2
Deposits and Lending Rates (average %)
(i) Savings deposits Negotiable Negotiable Negotiable Negotiable Negotiable Negotiable
(ii) Time/Term deposits Negotiable Negotiable Negotiable Negotiable Negotiable Negotiable
(iii) Interest rate on Loan & Advances Negotiable Negotiable Negotiable Negotiable Negotiable Negotiable
/1 Revised
/2 Provisional
Table 8
Summary of Community Banks/Microfinance Banks' Activities
(Naira Million, unless otherwise stated)

Central Bank of Nigeria Annual Report—2011
257
Item 2007 2008 2009 2010 /1 2011 /2
ASSETS
CASH AND BALANCES WITH BANKS 635.6 7,240.0 2,398.3 5,917.8 2,415.5
i) Cash on hand 1.5 1.3 0.7 1.0 1.5
ii) Balances with CBN -5,133.6 2,099.2 695.8 1,090.2 1,282.6
iii) Balances with other banks 5,767.7 5,139.5 1,701.8 4,826.6 1,131.4
CLAIMS ON FEDERAL GOVERNMENT 178,572.8 217,303.1 230,233.2 261,044.8 223,277.5
i) Treasury Bills 115,365.9 45,578.1 52,366.0 60,883.4 60,768.4
ii) FGN Bonds 52,517.3 171,725.0 177,867.2 200,161.4 162,509.1
iii) Treasury Certificate Maturing 0.0 0.0 0.0 0.0 0.0
iv) Treasury Bonds 0.0 0.0 0.0 0.0 0.0
v) Eligible Development Stock 10,689.6 0.0 0.0 0.0 0.0
CLAIMS ON STATE GOVERNMENTS 0.0 0.0 0.0 1,350.6 5,186.8
CLAIMS ON BANKS 86,569.3 155,487.8 2,150.4 8,767.1 10,807.4
i) Money at Call 7,000.0 20,121.9 0.0 6,700.0 10,751.9
ii) Loans and Advances 0.0 5,601.2 0.0 500.0 0.0
iii) Commercial Bills: 79,569.3 129,764.7 2,150.4 1,019.9 0.0
a) Bankers Acceptances 0.0 0.0 0.0 0.0 0.0
b) Promissory Notes 0.0 0.0 0.0 0.0 0.0
c) Negotiable Certificate of Deposit 0.0 0.0 0.0 0.0 0.0
d) Stabilisation Securities 0.0 0.0 0.0 0.0 0.0
iv) Others 0.0 0.0 0.0 547.2 55.5
CLAIMS ON OTHER FINANCIAL INSTITUTIONS 1,784.2 0.0 0.0 0.0 0.0
Money at Call 0.0 0.0 0.0 0.0 0.0
Loans and advances 0.0 0.0 0.0 0.0 0.0
Commercial Bills: 0.0 0.0 0.0 0.0 0.0
a) Promissory Notes 0.0 0.0 0.0 0.0 0.0
b) Negotiable Certificate of Deposit/Others 1,784.2 0.0 0.0 0.0 0.0
CLAIMS ON OTHERS 21,102.5 23,057.7 88,269.1 60,375.5 35,048.4
i) Commercial Bills 15,835.2 17,529.3 67,770.2 40,134.5 12,553.2
ii) Loans and Advances 5,267.2 4,794.3 20,863.9 19,200.8 17,899.0
iii) Others 0.0 734.1 -365.0 1,040.3 4,596.2
OTHER ASSETS 9,038.0 13,401.0 22,250.1 23,745.4 42,436.2
FIXED ASSETS 563.6 665.0 653.1 1,207.4 1,581.3
TOTAL ASSETS 298,266.0 417,154.6 345,954.1 362,408.5 320,753.1
LIABILITIES
CAPITAL AND RESERVES 22,849.1 33,684.3 41,997.3 41,374.9 49,612.2
i) Paid-up Capital 11,086.5 11,544.6 14,590.6 15,590.6 15,645.2
ii) Statutory Reserves 4,217.4 5,828.8 7,873.9 8,553.2 10,535.8
iii) Share Premium 1,614.6 1,737.3 4,737.3 4,737.3 4,737.3
iv) Other Reserves 3,581.9 9,665.1 7,762.9 6,579.2 11,019.8
v) General Reserve 2,348.6 4,908.5 7,032.6 5,914.7 7,674.0
MONEY-AT-CALL 97,049.8 195,901.0 206,713.2 247,727.7 152,927.7
i) Commercial Banks 91,982.1 192,751.5 180,874.1 221,977.1 127,372.8
ii) Merchant Banks 0.0 0.0 0.0 0.0 0.0
iii) Non-Bank Financial Institutions 2,800.0 0.0 0.0 0.0 0.0
iv) Others 2,267.7 3,149.5 25,839.2 25,750.6 25,554.9
v) Associated Treasury Notes 0.0 0.0 0.0 0.0 0.0
OTHER AMOUNT OWING TO: 158,579.5 42,145.9 69,467.9 22,833.1 54,242.5
i) Commercial Banks 146,330.9 30,830.5 63,419.4 21,020.3 40,672.6
ii) Merchant Banks 0.0 0.0 0.0 0.0 0.0
iii) Non-Bank Financial Institutions 1,000.0 0.0 0.0 0.0 0.0
iv) Others 11,248.7 11,315.4 6,048.5 1,812.8 13,569.9
BORROWINGS 3,239.6 118,201.0 16.9 5,850.0 3,000.0
i) Central Bank of Nigeria 0.0 0.0 0.0 0.0 0.0
ii) Overdrafts 0.0 85.4 16.9 0.0 0.0
iii) Other Banks 3,239.6 118,115.6 0.0 5,850.0 3,000.0
OTHER LIABILITIES 16,548.0 27,222.4 27,758.8 44,622.9 60,970.7
TOTAL LIABILITIES 298,266.0 417,154.6 345,954.1 362,409.5 320,753.1
/1 Revised
/2 Provisional
Table 9
Discount Houses' Statement of Assets and Liabilities
(Naira Million)

Central Bank of Nigeria Annual Report—2011
258
Item 2007 /1 2008 /2 2009 /3 2010 /4 2011 /5
1 Cash and Cash Items 3,820.10 5,965.30 5,364.20 5,821.60 5,157.60
2 Investments 12,756.00 34,442.30 28,742.60 27,123.30 27,644.90
3 Due from other Finance Companies 11,458.90 21,792.00 27,648.10 22,044.00 24,029.60
4. Loans and Advances 26,779.10 50,387.80 32,345.60 30,646.30 31,939.70
5. Fixed Assets 3,687.6 6,881.2 7,593.4 9,046.5 9,697.8
6. Other Assets 7,302.9 14,711.5 16,442.5 19,099.9 19,124.1
Total Assets 65,804.6 134,180.1 118,136.4 113,781.6 117,593.7
1.Capital and Reserves 14,856.7 25,201.5 11,984.8 10,216.1 15,369.3
2. Share Deposits 0.0 0.0 0.0 0.0 0.0
3. Due to other Finance Companies 156.7 7,108.9 8,197.8 8,351.3 8,867.7
4. Borrowings 39,948.5 83,132.9 87,698.7 81,232.1 78,766.9
5. Other Liabilities 10,842.7 18,736.8 10,255.1 13,982.1 14,589.8
Total Liabilities 65,804.6 134,180.1 118,136.4 113,781.6 117,593.7
/1 81 Finance Companies out of 112 reported
/2 56 Finance Companies out of 113 reported
/3 75 Finance Companies out of 114 reported. 2009 data are revised.
/4 Revised
/5 Provisional
Summary of Assets and Liabilities of Finance Companies
Table 10
(N' Million)

Central Bank of Nigeria Annual Report—2011
259
2007 2008 2009 2010 /1 2011 /2
Treasury Bills 574,929.4 471,929.4 797,482.0 1,277,100.0 1,727,910.0
Treasury Certificates 0.0 0.0 0.0 0.0 0.0
Development Stocks 620.0 520.0 520.0 220.0 0.0
Certificates of Deposits 0.0 0.0 0.0 0.0 0.0
Commercial Papers 363,369.5 822,700.9 509,079.1 189,216.4 203,008.3
Bankers' Acceptances 81,834.0 66,398.7 62,243.6 79,172.3 73,406.1
FGN Bonds 1,186,150.5 1,445,999.6 1,974,930.0 2,901,600.0 3,541,200.0
Total 2,206,903.4 2,807,548.6 3,344,254.7 4,447,308.7 5,545,524.4
Growth (%)
Treasury Bills -18.0 -17.9 69.0 60.1 35.3
Treasury Certificates 0.0 0.0 0.0 0.0 0.0
Eligible Development Stocks -13.9 -16.1 0.0 -57.7 -100.0
Certificates of Deposits 0.0 0.0 0.0 0.0 0.0
Commercial Papers 77.6 126.4 -38.1 -62.8 7.3
Bankers' Acceptances 4.3 -18.9 -6.3 27.2 -7.3
FGN Bonds 84.2 21.9 36.6 49.9 22.0
Total 35.5 27.2 19.1 33.0 24.7
/1 Revised
/2 Provisional
Table 11
Value of Money Market Assets
(Naira Million)

Central Bank of Nigeria Annual Report—2011
260
2007
January 115,000.0 0.0 71,400.0 43,600.0
February 90,106.6 0.0 63,600.0 26,500.0
March 138,000.0 0.0 97,400.0 40,600.0
April 139,466.7 0.0 40,300.0 96,700.0
May 115,106.6 0.0 106,300.0 72,700.0
June 106,356.2 0.0 63,200.0 43,200.0
July 105,110.5 0.0 62,400.0 42,600.0
August 125,106.6 6,473,306.0 86,700.0 38,300.0
September 98,000.0 13,113,475.0 57,600.0 39,400.0
October 86,466.7 0.0 112,300.0 50,400.0
November 100,106.6 3,393,845.0 128,400.0 56,600.0
December 85,356.2 2,089,232.0 235,100.0 104,900.0
Total 1,304,182.4 25,069,858.0 1,124,700.0 655,500.0
Average 108,681.9 2,089,154.8 93,725.0 54,625.0
2008
January 100,110.4 159.4 57,147.0 42,804.1
February 75,106.6 0.0 37,756.2 37,350.3
March 78,000.0 6,217.4 33,250.2 38,532.4
April 76,466.7 1,197.9 30,750.1 44,518.7
May 89,451.5 0.0 28,701.8 60,749.7
June 75,356.2 2.3 27,931.2 47,422.7
July 60,110.5 0.0 30,104.5 30,006.0
August 50,761.6 0.0 19,599.6 31,162.0
September 54,344.9 0.0 23,233.1 31,111.9
October 101,466.7 1.0 58,528.8 42,936.9
November 85,106.6 6.5 57,476.6 27,623.5
December 70,000.0 0.0 48,291.5 21,708.5
Total 916,281.6 7,584.3 452,770.6 455,926.7
Average 76,356.8 632.0 37,730.9 37,993.9
2009
January 115,470.0 30.0 87,680.0 27,760.0
February 80,110.0 0.0 64,460.0 15,650.0
March 80,000.0 0.0 41,510.0 38,490.0
April 101,360.0 0.0 47,780.0 53,580.0
May 120,220.0 0.0 95,430.0 24,790.0
June 120,000.0 0.0 79,070.0 40,930.0
July 125,360.0 0.0 83,030.0 42,330.0
August 105,220.0 0.0 76,180.0 29,040.0
September 91,760.0 0.0 54,440.0 37,320.0
October 170,260.0 0.0 127,410.0 42,850.0
November 120,220.0 0.0 74,640.0 45,580.0
December 162,560.0 0.0 125,240.0 37,320.0
Total 1,392,540.0 30.0 956,870.0 435,640.0
Average 116,045.0 2.5 79,739.2 36,303.3
2010
January 149,830.0 0.0 140,590.0 9,240.0
February 100,220.0 0.0 97,910.0 2,310.0
March 65,000.0 0.0 54,960.0 10,040.0
April 160,490.0 0.0 127,420.0 33,070.0
May 100,220.0 0.0 93,530.0 6,690.0
June 158,700.0 0.0 116,150.0 42,550.0
July 250,910.0 0.0 185,640.0 65,270.0
August 141,160.0 0.0 130,260.0 10,900.0
September 206,570.0 0.0 165,740.0 40,830.0
October 167,010.0 0.0 151,870.0 15,140.0
November 205,930.0 0.0 175,890.0 30,040.0
December 297,910.0 0.0 239,910.0 58,000.0
Total 2,003,950.0 0.0 1,679,870.0 324,080.0
Average 166,995.8 0.0 139,989.2 27,006.7
2011
January 205,590.0 0.0 167,610.0 37,980.0
February 216,920.0 0.0 173,140.0 43,780.0
March 284,060.0 0.0 205,670.0 78,390.0
April 215,070.0 0.0 148,200.0 66,870.0
May 204,600.0 0.0 131,360.0 73,240.0
June 340,240.0 0.0 210,770.0 129,470.0
July 209,740.0 0.0 156,800.0 52,940.0
August 218,920.0 0.0 142,430.0 76,490.0
September 280,570.0 0.0 202,370.0 78,200.0
October 309,950.0 0.0 167,550.0 142,400.0
November 242,930.0 0.0 140,340.0 102,590.0
December 319,910.0 0.0 176,590.0 143,320.0
Total 3,048,500.0 0.0 2,022,830.0 1,025,670.0
Average 254,041.7 0.0 168,569.2 85,472.5
/1 Includes Discount houses, Government parastatals, Savings type institutions, etc.
Table 12
Treasury Bills: Issues and Subscriptions
( Naira Million)
Period
Issues
S u b s c r i b e r
Central Bank Deposit Money Banks Non-Bank Public /1

Central Bank of Nigeria Annual Report—2011
261
Period Total Outstanding
Central Bank
including
Rediscount
Deposit Money
Banks Others
2007 /1
January 690.00 22.94 505.92 161.14
February 675.11 20.60 521.17 133.33
March 698.11 16.39 547.16 134.55
April 732.57 13.86 547.21 171.51
May 727.57 14.00 662.26 51.31
June 716.93 0.62 647.72 68.58
July 705.93 0.58 646.98 58.37
August 705.93 0.67 663.16 42.10
September 677.93 0.65 676.94 0.34
October 625.93 0.14 615.79 10.00
November 600.93 3.61 591.32 6.00
December 574.93 5.94 551.42 17.57
Average 677.66 8.33 598.09 71.23
2008
January 574.93 5.21 524.31 45.40
February 574.93 2.75 525.48 46.70
March 574.93 3.15 559.57 12.21
April 574.93 3.55 519.67 51.72
May 574.93 3.55 519.67 51.72
June 574.93 6.32 495.29 73.32
July 534.93 6.91 452.01 76.00
August 500.58 7.96 446.67 45.95
September 471.93 7.10 400.83 64.00
October 471.93 7.44 382.68 81.81
November 471.93 4.27 388.93 78.73
December 471.93 0.41 352.41 119.11
Average 531.07 4.88 463.96 62.22
2009
January 532.40 0.62 386.79 144.98
February 521.93 0.00 404.43 117.50
March 546.93 2.94 400.96 143.03
April 561.93 3.77 376.28 181.88
May 601.93 1.26 408.69 191.98
June 641.93 23.42 417.14 201.37
July 676.93 3.11 476.53 197.28
August 711.93 5.69 539.59 166.65
September 753.58 2.08 559.72 191.78
October 787.48 1.38 650.34 135.76
November 792.48 1.53 667.32 123.63
December 797.48 1.90 644.78 150.80
Average 660.58 3.98 494.38 162.22
2010 660.58 3.98 494.38 162.22
January 837.32 0.00 710.97 126.35
February 837.32 0.00 645.32 192.00
March 837.32 0.00 634.30 203.02
April 837.32 0.00 511.34 325.98
May 837.32 0.00 578.96 258.36
June 901.02 0.00 785.23 115.79
July 977.03 0.00 679.85 297.18
August 1,017.97 0.00 764.25 253.72
September 1,064.27 24.48 658.32 381.47
October 1,106.34 24.48 729.58 352.28
November 1,191.12 24.48 698.25 468.39
December 1,277.10 24.48 925.32 327.30
Average 976.79 8.16 693.47 275.15
2011
January 205,590.00 0.00 178,590.00 27,000.00
February 216,920.00 0.00 198,920.00 18,000.00
March 284,060.00 0.00 245,060.00 39,000.00
April 215,070.00 0.00 186,070.00 29,000.00
May 204,600.00 0.00 165,600.00 39,000.00
June 340,240.00 0.00 260,240.00 80,000.00
July 209,740.00 0.00 162,740.00 47,000.00
August 218,920.00 0.00 158,920.00 60,000.00
September 280,570.00 0.00 226,570.00 54,000.00
October 309,950.00 0.00 204,950.00 105,000.00
November 242,930.00 0.00 163,930.00 79,000.00
December 319,910.00 0.00 215,910.00 104,000.00
Average 254,041.67 0.00 197,291.67 56,750.00
/1 Revised
Table 13
Holding of Treasury Bills Outstanding
(Naira Billion)

Central Bank of Nigeria Annual Report—2011
262
Total Bids Amount Sold
(N 'Million) (N 'Million)
2007
January 0.0 0.0 0 0.0
February 68,200.0 80,100.0 50 7.3
March 216,900.0 227,100.0 71 7.3
April 50,300.0 80,100.0 100 7.7
May 62,400.0 100,100.0 48 7.2
June 14,000.0 563,500.0 74 7.7
July 170.0 82,200.0 57 6.7
August 37,750.0 304,500.0 86 7.1
September 0.0 461,000.0 99 6.7
October 19,500.0 528,700.0 77 6.8
November 24,000.0 570,000.0 106 7.3
December 134,200.0 585,300.0 223 8.1
Total 627,420.0 3,582,600.0
Average 52,285.0 298,550.0 83 6.7
2008
January 0.0 148,300.0 229 213.0
February 0.0 174,770.0 265 249.0
March 0.0 210,350.0 206 213.0
April 10.0 291,650.0 160 159.0
May 24.0 205,530.0 168 168.0
June 0.0 439,200.0 160 159.0
July 0.0 760,080.0 171 169.0
August 0.0 101,460.0 194 191.0
September 0.0 0.0 0 0.0
October 0.0 0.0 0 0.0
November 0.0 0.0 0 0.0
December 0.0 0.0 0 0.0
Total 34.0 2,331,340.0
Average 2.8 194,278.3 129 126.8
2009
January 68,540.0 20,290.00 2 n/a
February 0.0 0.00 n/a n/a
March 71,000.0 42,000.00 3 n/a
April 128,150.0 95,150.00 4 n/a
May 77,100.0 39,250.00 4 n/a
June 126,850.0 57,800.00 5 n/a
July n/a n/a n/a n/a
August n/a n/a n/a n/a
September n/a n/a n/a n/a
October n/a n/a n/a n/a
November n/a n/a n/a n/a
December n/a n/a n/a n/a
Total 471,640.0 254,490.0 18
Average 78,606.7 42,415.0 4
2010 /1
January 0.0 0.0 0 0.0
February 0.0 0.0 0 0.0
March 0.0 0.0 0 0.0
April 280,500.0 120,000.0 186 2.4
May 116,942.0 40,000.0 130 2.4
June 200.0 2,000.0 44 1.2
July 0.0 0.0 0 0.0
August 0.0 0.0 0 0.0
September 70,250.0 24,000.0 79 5.1
October 2,000.0 2,000.0 181 8.6
November 47,250.0 29,500.0 240 10.0
December 99,181.0 53,250.0 148 7.4
Total 616,323.0 270,750.0
Average 51,360.3 22,562.5 84 3.1
2011
January 1,277.1 35.8 1241.32 0.0
February 1,337.1 55.2 1281.86 0.0
March 1,439.6 30.7 1408.93 0.0
April 1,499.6 29.6 1470.01 0.0
May 1,541.6 32.6 1508.99 0.0
June 1,561.4 19.4 1542 0.0
July 1,611.4 17.0 1594.43 0.0
August 1,641.4 13.3 1628.1 0.0
September 1,607.8 3.4 1604.41 0.0
October 1,710.8 79.3 1631.44 0.0
November 1,725.8 93.6 1632.14 0.0
December 1,727.9 69.3 1658.61 0.0
Average 1,556.8 39.9 1,516.85 0.0
/1 Revised
Table 14
Open Market Operations
PeriodAverage Tenor
(Days)Average Yield (%)

Central Bank of Nigeria Annual Report—2011
263
Items 2007 2008 2009 2010 /1 2011 /2
Volume of Stocks ('000)
Government 0.0 0.0 0.0 11.0 0.0
Industrial 2,869.9 3,571.2 412.8 0.0 6.7
Second-Tier Securities 257,208.5 201,514.0 1,127,466.5 1,369,489.4 243,633.0
Bonds 0.0 0.0 0.1 2.0 0.0
Equities 137,852,243.5 192,867,507.7 101,724,204.4 92,317,994.3 82,102,020.8
Total 138,112,321.9 193,072,592.9 102,852,083.8 93,687,496.7 82,345,660.5
Number of Deals
Government 0 0 0 5 0
Industrial 37 138 15 0 33
Second-Tier Securities 4,788 8,759 1,043 1,182 253
Bonds 0 0 1 2 0
Equities 2,610,195 3,526,734 1,738,306 1,924,125 1,235,181
Total 2,615,020 3,535,631 1,739,365 1,925,314 1,235,467
Value of Stocks (N' Million)
Government 0.0 0.0 0.0 14.1 0.0
Industrial 1,136.5 3,528.9 412.8 0.0 17.1
Second-Tier Securities 845.1 1,822.8 1,372.3 702.5 144.7
Bonds 0.0 0.0 0.1 0.0 0.0
Equities 1,074,038.8 1,673,791.9 683,932.1 799,194.3 622,443.9
Total 1,076,020.4 1,679,143.7 685,717.3 799,911.0 622,605.7
Market Capitalization (N' Million) 13,294,584.9 9,535,819.5 7,030,841.5 9,918,218.7 10,282,244.8
Value Index of Equities (1984 = 100) 57,990.2 31,450.8 20,827.2 24,770.5 20,730.6
/1 Revised
/2 Provisional
Source: Nigerian Stock Exchange
Table 15
Transactions on the Nigerian Stock Exchange

Central Bank of Nigeria Annual Report—2011
264
C A T E G O R Y 2007 2008 2009 2010 2011 /1
A G R I C U L T U R E 30,924,310.0 34,041,823.9 19,899,543.4 17,331,955.6 22,162,860.1
F I N A N C I A L 6,903,133,644.4 4,079,523,775.3 2,455,225,199.6 2,885,224,164.1 2,013,252,151.8
Banking 6,432,245,733.3 3,715,544,229.6 2,238,130,310.2 2,710,167,833.0 1,839,313,950.9
Managed Funds 6,620,913.4 0.0 0.0 0.0
Insurance 419,016,997.7 313,873,459.7 201,522,031.5 147,896,811.9 140,982,339.4
Other Financial Institutions 0.0 47,885,886.0 13,572,857.8 12,718,530.3 12,074,171.0
Real Estate Investment Trust 0.0 2,220,200.0 2,000,000.0 14,440,989.1 Re-classified
Mortgage 45,250,000.0 54,202,386.3 24,850,814.5 23,154,065.5 20,881,690.5
M A N U F A C T U R I N G 2,075,963,486.2 1,343,077,748.7 1,591,107,747.6 3,935,471,347.6 2,001,395,869.1
Breweries 569,614,151.5 472,657,836.3 599,067,028.7 881,806,021.9 1,100,737,056.1
Building Materials 498,299,115.8 177,229,727.7 300,124,243.6 2,063,168,046.6 Re-classified
Chemical & Paints 24,252,251.6 20,898,952.4 14,929,765.0 21,507,491.5 Re-classified
Food, Beverages & Tobacco 900,869,005.7 561,302,464.7 594,372,544.5 880,718,117.1 663,727,747.3
Industrial and Domestic Products 16,972,126.1 25,716,839.7 19,676,872.0 17,484,154.2 Re-classified
Packaging 15,952,014.0 43,535,290.1 25,210,330.2 28,712,726.8 Re-classified
Healthcare 46,519,124.7 38,576,816.5 36,124,724.1 41,442,326.5 Re-classified
Textiles 3,485,696.8 3,159,821.2 1,602,239.4 632,462.9 0.0
Automobile & Tyres 2,386,334.6
Household Durables 13,655,782.5
Household Products 220,888,948.5
HEALTHCARE 33,677,670.4
CONGLOMERATES 64,089,327.4
C O M M E R C I A L S 838,526,906.0 886,263,192.5 528,164,461.2 637,025,809.0 0.0
Automobile & Tyres 31,525,103.7 17,466,607.8 8,023,488.2 4,755,379.4 Re-classified
Conglomerates 317,563,740.0 178,921,497.3 233,275,243.2 294,157,765.4 Re-classified
Commercial / Services 27,431,138.3 83,170,810.3 28,099,539.9 14,613,343.0 0.0
Computer & Office Equipments 2,839,664.8 10,732,356.0 5,646,712.7 4,698,426.8 Re-classified
Footwear 415,811.3 1,315,303.0 298,898.9 244,170.9 0.0
Machinery (Marketing) 1,290.5 1,290.5 1,290.5 1,290.5 0.0
Petroleum (Marketing) 458,750,157.5 594,655,327.5 252,819,287.8 318,555,432.9 0.0
CONSTRUCTION/REAL ESTATE 129,352,427.9
INDUSTRIAL GOODS 1,912,341,706.0
NATURAL RESOURCES 8,326,882.1
OIL &GAS 217,464,195.0
S E R V I C E S 152,388,325.5 641,699,446.4 204,284,024.9 231,900,469.7 68,511,321.3
Construction 38,232,556.4 106,870,970.6 60,279,219.4 92,633,786.8 Re-classified
Real Estate 25,707,000.0 29,524,000.0 21,845,999.9 22,701,249.9 Re-classified
Advertising 2,017,748.6
Apparel Retailers 244,170.9
Engineering Technology 2,587,042.0 5,722,433.0 2,161,697.0 3,298,759.9 0.0
Airline Services 31,143,060.0 20,107,386.3 10,514,865.6 13,641,261.3 0.0
Printing & Publishing 18,254,066.7 8,323,289.5 10,476,916.0 10,187,738.3 5,865,418.5
Hotel,Hospitality & Tourism 16,337,480.9 28,764,850.0 9,956,087.1 17,291,774.9 38,013,335.4
Automobile and Auto Part s Retailers 1,195,959.2
Maritime 9,329,569.4 22,921,488.3 7,076,852.9 8,767,782.4 0.0
Aviation 1,740,000.0 1,740,000.0 1,740,000.0 0.0
Road Transport 3,993,550.0 2,818,090.0 1,145,320.0 798,710.0 753,500.0
Courier/Freight/Delivery 2,094,825.4
Employment Solutions 1,186,175.9
Speciality 5,439,797.9
Leasing 4,860,000.0 6,660,000.0 4,161,544.4 2,474,025.3 0.0
Information, Communications & Telecommunications 0.0 54,168,881.8 67,217,124.7 52,105,502.3 Re-classified
Media 0.0 26,480,000.0 7,708,397.8 6,259,878.5 4,000,000.0
Transport Related Services 7,700,389.4
ICT 62,009,178.3
ETFS 988,000.0
ASeM: ALTERNATIVE SECURITIES MARKET 4,072,137.0
The Foreign Listing 292,250,544.6 273,395,670.7 163,729,199.5 188,356,567.6 0.0
Total 10,293,187,216.7 6,957,453,501.0 4,989,385,147.5 7,913,752,224.6 6,537,643,726.3
/1 Provisional
Source: Nigerian Stock Exchange
Table 16
Market Capitalisation of Quoted Companies: Equities Only
(Naira Thousand)

Central Bank of Nigeria Annual Report—2011
265
2007 2008 2009 /1 2010 /1 2011 /2
A G R I C U L T U R E 174.22 153.9 83.1 54.3 70.3 68.4 -11.7 -46.0 -34.6 29.4
F I N A N C I A L 38891.2 18441.3 10248.8 9039.7 6383.9 173.0 -52.6 -44.4 -11.8 -29.4
Banking 36238.3 16795.9 9342.6 8491.3 5832.4 160.9 -53.7 -44.4 -9.1 -31.3
Managed Funds 37.3 0.0 90.7
Insurance 2360.7 1418.8 841.2 463.4 447.0 595.2 -39.9 -40.7 -44.9 -3.5
Other Financial Institutions 216.5 56.7 39.8 38.3 -73.8 -29.7 -3.9
Real Estate Investment Trust 10.0 8.3 45.2 Re-classified -16.8 442.0
Mortgage 254.9 245.0 103.7 72.5 66.2 -3.9 -57.7 -30.1 -8.7
M A N U F A C T U R I N G 11695.7 6071.3 6641.8 12330.3 6346.4 52.0 -48.1 9.4 85.6 -48.5
Breweries 3209.1 2136.6 2500.7 2762.8 3490.4 11.4 -33.4 17.0 10.5 26.3
Building Materials 2807.3 801.2 1252.8 6464.1 Re-classified 20.8 -71.5 56.4 416.0
Chemical & Paints 136.6 94.5 62.3 67.4 Re-classified 164.2 -30.9 -34.0 8.1
Food, Beverages & Tobacco 5075.4 2537.3 2481.1 2759.4 2104.7 132.4 -50.0 -2.2 11.2 -23.7
Industrial and Domestic Products 95.6 116.3 82.1 54.8 Re-classified 124.8 21.6 -29.3 -33.3
Packaging 89.9 196.8 105.2 90.0 Re-classified 240.4 119.0 -46.5 -14.5
Healthcare 262.1 174.4 150.8 129.8 Re-classified 52.7 -33.5 -13.5 -13.9
Textiles 19.6 14.3 6.7 2.0 0.0 39.0 -27.3 -53.2 -70.4 -100.0
Automobile & Tyres 7.6
Household Durables 43.3
Household Products 700.4
HEALTHCARE 106.8
CONGLOMERATES 203.2
C O M M E R C I A L S 4724.1 4006.3 2204.7 1995.9 0.0 19.0 -15.2 -45.0 -9.5
Automobile & Tyres 177.6 79.0 33.5 14.9 150.1 -55.5 -57.6 -55.5
Conglomerates 1789.1 808.8 973.8 921.6 -17.3 -54.8 20.4 -5.4
Commercial / Services 154.5 376.0 117.3 45.8 29391.9 143.3 -68.8 -61.0
Computer & Office Equipments 16.0 48.5 23.6 14.7 146.9 203.3 -51.4 -37.5
Footwear 2.3 5.9 1.2 0.8 0.0 64.0 153.8 -79.0 -38.7
Machinery (Marketing) 0.0 0.0 0.0 0.0 0.0 -97.1 -19.8 -7.7 -24.9
Petroleum (Marketing) 2584.5 2688.1 1055.3 998.1 0.0 49.7 4.0 -60.7 -5.4
CONSTRUCTION/REAL ESTATE 410.2
INDUSTRIAL GOODS 6064.0
NATURAL RESOURCES 26.4
OIL &GAS 689.6
S E R V I C E S 858.5 2900.8 852.7 726.6 217.2 132.2 237.9 -70.6 -14.8 -70.1
Construction 215.4 483.1 251.6 290.2 100.2 124.3 -47.9 15.3
Real Estate 144.8 133.5 91.2 71.1 47.2 -7.8 -31.7 -22.0
Advertising 6.4
Apparel Retailers 0.8
Engineering Technology 14.6 25.9 9.0 10.3 0.0 548.7 77.5 -65.1 14.5
Airline Services 175.5 90.9 43.9 42.7 0.0 376.7 -48.2 -51.7 -2.6
Printing & Publishing 102.8 37.6 43.7 31.9 18.6 685.5 -63.4 16.2 -27.0 -41.7
Hotel, Hospitality and Tourism 92.0 130.0 41.6 54.2 120.5 144.1 41.3 -68.0 30.4 122.5
Automobile and Auto Part s Retailers 3.8
Maritime 52.6 103.6 29.5 27.5 0.0 474.7 97.1 -71.5 -7.0
Aviation 7.9 7.3 5.5 0.0 -7.7 -24.9
Road Transport 22.5 12.7 4.8 2.5 2.4 -43.4 -62.5 -47.7 -4.5
Courier/Freight/Delivery 6.6
Employment Solutions 3.8
Speciality 17.2
Leasing 27.4 30.1 17.4 7.8 0.0 10.0 -42.3 -55.4
Information, Communications
& Telecommunications 244.9 280.6 163.3 14.6 -41.8
Media 119.7 32.2 19.6 12.7 -73.1 -39.0 -35.3
Transport Related Services 24.4
ICT 196.6
ETFS 3.1
ASeM 12.9
The Foreign Listing 1646.5 1235.9 683.5 590.1 0.0 62.2 -24.9 -44.7 -13.7
Total 57990.2 31450.8 20827.2 24770.5 20730.6 74.7 -45.8 -33.8 18.9 -16.3
/1 Revised
/2 Provisional
Source: Nigerian Stock Exchange
Growth Rate (%)
Table 17
Value Index of All Common Stocks Listed by Sector on the Nigerian Stock Exchange
(1984 = 100)
Category 2007 2008 2009 /1 2010 /1 2011 /2

Central Bank of Nigeria Annual Report—2011
266
2007 2008 2009 2010 2011 1/
Total Revenue(Gross) 2/ 5,727.5 7,866.6 4,844.6 7,303.7 11,116.9
Oil Revenue (Gross) 4,462.9 6,530.6 3,191.9 5,396.1 8,879.0
Crude Oil / Gas Exports 1,851.0 2,251.4 897.8 1,696.2 2,287.9
PPT and Royalties etc. 1,500.6 2,812.3 1,256.5 1,944.7 3,976.3
Domestic Crude Oil Sales 1,094.6 1,462.5 953.0 1,746.3 2,608.8
Other Oil Revenue 16.8 4.4 84.5 8.8 6.0
Less:
Deductions 3/ 1,807.0 3,261.2 1,174.8 2,393.7 4,863.6
Oil Revenue (Net) 2,655.9 3,269.5 2,017.2 3,002.4 4,015.4
Non- Oil Revenue 1,264.6 1,336.0 1,652.7 1,907.6 2,237.9
Corporate Tax 327.0 416.8 568.1 657.3 700.5
Customs & Excise Duties 241.4 281.3 297.5 309.2 438.3
Value-Added Tax (VAT) 301.7 404.5 468.4 562.9 649.5
FG Independent Revenue 268.7 114.0 73.2 153.6 182.5
Education Tax 51.8 47.2 139.5 114.5 101.7
Custom Levies 74.1 72.2 98.5 103.4 156.8
National Information Technology Development Fund (NITDF) - - 7.5 6.8 8.6
Less:
Deductions 3/ 42.2 52.6 69.8 125.5 94.9
Non- Oil Revenue (Net) 1,222.5 1,283.4 1,582.9 1,782.0 2,143.0
Federally - collected revenue + Transfers 3,878.4 4,552.8 3,600.1 4,784.5 6,158.4
Less 684.2 621.7 768.4 918.6 1,073.1
Transfer to Federal Govt. Ind. Revenue 268.7 114.0 73.2 153.6 182.5
Transfer to VAT Pool Account 289.6 388.3 449.7 540.3 623.5
Other Transfers 4/ 125.9 119.4 245.6 224.7 267.1
Federally Collected Revenue (Net) 3,194.2 3,931.1 2,831.7 3,865.9 5,085.3
Memorandum Items:
Deductions: 1,849.1 3,313.8 1,244.5 2,519.2 4,958.5
Oil Revenue 1,807.0 3,261.2 1,174.8 2,393.7 4,863.6
JVC Cash calls 550.0 579.1 809.6 962.9 1,008.8
Excess Crude Proceeds 1,168.5 1,728.5 60.4 615.8 1,226.2
Excess PPT & Royalty 88.5 953.6 218.0 179.3 1,812.2
Others - - 86.7 635.7 816.4
Non -oil Revenue 42.2 52.6 69.8 125.5 94.9
4% FIRS collection cost 13.1 16.7 22.7 26.3 28.7
7% NCS collection cost 16.9 19.7 20.8 21.6 29.5
Cost of collection for VAT 12.1 16.2 18.7 22.5 26.0
Others 0.1 0.0 7.5 55.1 10.7
1/ Provisional
2/Includes other receipts from Education Tax, FGN Independent Revenue and Levies
3/ As contained in memorandum items
4/ Includes Education Tax and Customs levies
Source: Federal Ministry of Finance
Table 18
Federation Account Operations
(Naira Billion)

Central Bank of Nigeria Annual Report—2011
267
2007 2008 2009 2010 2011 1/
Federally Collected Revenue (Net) 3,194.2 3,931.1 2,831.7 3,865.9 5,085.4
Add
Other Revenue 797.0 1,637.0 1,706.1 1,365.3 1,856.5
Excess Crude 499.6 1,106.9 812.4 886.5 450.0
Share of Budgtary Difference 49.1 67.8 119.1 - 873.6
Revenue Augmentation 248.3 462.2 615.9 439.0 502.4
Exchange Rate Gain/NNPC Refund - - 158.7 39.9 30.5
Total Revenue 3,991.2 5,568.2 4,537.8 5,231.2 6,941.8
Distributed as Follows
Statutory Allocation 3,194.2 3,931.1 2,831.7 3,865.9 5,085.4
Federal Government 1,500.8 1,847.0 1,353.6 1,830.9 2,403.9
State Government 761.2 936.8 686.6 928.7 1,219.3
Local Government 586.9 722.3 529.3 716.0 940.0
13% Derivation 345.3 425.0 262.2 390.3 522.0
Excess Crude 499.6 1,106.9 812.4 886.5 450.0
Federal Government 229.0 249.3 296.8 405.0 206.2
State Government 116.1 395.7 265.0 225.6 104.6
Local Government 89.5 391.2 145.0 159.9 80.6
13% Derivation 64.9 70.7 105.6 96.0 58.5
Share of Diff.Btw. Provisional Distribution and Actual Budget 49.1 67.8 119.1 - 873.6
Federal Government 22.5 31.1 54.6 - 400.4
State Government 11.4 15.8 27.7 - 203.1
Local Government 8.8 12.2 21.3 - 156.6
13% Derivation 6.4 8.8 15.5 - 113.6
Federation Revenue Augmentation 248.3 462.2 615.9 439.0 502.4
Federal Government 113.8 211.9 282.3 201.2 230.3
State Government 57.7 107.5 143.2 102.0 116.8
Local Government 44.5 82.8 110.4 78.7 90.0
13% Derivation 32.3 60.1 80.1 57.1 65.3
NNPC REFUND TO SGs & LGs - - 158.7 39.9 30.5
Federal Government - - 72.7 18.3 -
State Government - - 36.9 9.3 15.0
Local Government - - 28.4 7.1 11.5
13% Derivation - - 20.6 5.2 4.0
VAT POOL 289.6 388.4 449.6 540.3 623.5
Federal Government 43.4 58.2 67.4 81.1 93.5
State Government 144.8 194.2 224.8 270.2 311.8
Local Government 101.4 135.9 157.4 189.1 218.2
Total Statutory Revenue and VAT Distribution 4,280.9 5,956.5 4,987.5 5,771.5 7,565.3
Federal Government 1,909.5 2,397.5 2,127.5 2,536.5 3,334.4
State Government 1,091.3 1,649.9 1,384.1 1,535.7 1,970.5
Local Government 831.1 1,344.4 991.8 1,150.8 1,497.1
13% Derivation 448.9 564.7 484.0 548.5 763.4
1/ Provisional
Sources: Federal Ministry of Finance and Central Bank of Nigeria.
Table 19
Federally Collected Revenue Distributions
(Naira Billion)

Central Bank of Nigeria Annual Report—2011
268
2007 2008 2009 2010 2011 1/
Total Revenue (Gross) 2/ 7,225.5 10,940.5 7,753.5 10,375.8 13,779.1
Oil Revenue (Gross) 4,462.9 6,530.6 3,191.9 5,396.1 8,879.0
Less:
Deductions 1,807.0 3,261.2 1,174.8 2,393.7 4,863.6
Oil Revenue (Net) 2,655.9 3,269.4 2,017.1 3,002.4 4,015.4
Add:
Revenue Augmentation from Excess Crude 685.1 1,679.8 1,706.1 1,334.8 1,856.4
Revenue from Oil Sources 3,341.0 4,949.2 3,723.2 4,337.2 5,871.8
Non-Oil Revenue (Gross) 2/ 1,264.6 1,336.0 1,652.7 1,907.6 2,237.9
of which: VAT 289.6 404.5 468.4 562.9 649.5
International Trade Taxes 241.4 281.3 297.5 309.2 438.3
Company Income Tax 327.0 416.8 568.1 657.3 700.5
Less:
Deductions 42.2 52.6 69.8 125.5 94.9
Non-Oil Revenue (Net) 1,222.4 1,283.4 1,582.9 1,782.1 2,143.0
Add:
SG Internally-Generated Revenue 3/ 305.7 441.1 461.2 757.9 495.3
LG Internally-Generated Revenue 4/ 21.3 23.1 26.1 27.2 41.3
Grants & Others 257.7 243.9 269.2 352.8 165.3
Revenue from Non-Oil Sources 1,807.1 1,991.5 2,339.4 2,920.0 2,844.9
Add:
Balances in FG Special Accounts for the Previous Year - - - 214.6 28.0
Others 228.2 686.0 446.3 384.8 75.9
Total Collected Revenue (Net) 5,376.3 7,626.7 6,508.9 7,856.6 8,820.6
Transfers:
Education Tax & Other Levies 144.9 119.4 245.6 224.3 258.5
Others 5/ - - - 49.7 75.6
TOTAL REVENUE 5,231.4 7,507.3 6,263.3 7,582.5 8,486.5
TOTAL EXPENDITURE 5,394.4 7,644.6 7,258.0 8,789.4 9,774.3
Recurrent Expenditure 3,133.7 3,972.6 3,925.8 5,222.8 6,011.9
Goods & Services 2,809.9 3,525.1 3,541.1 4,636.8 5,252.5
Personnel Cost 1,530.0 1,664.5 1,697.4 2,217.4 3,150.7
Pension 161.0 208.2 269.4 272.6 216.6
Overhead Cost 917.6 1,261.5 1,246.4 1,775.9 1,389.9
Others 201.3 390.9 327.9 371.0 495.3
Interest Payments 323.8 447.5 384.7 586.0 759.4
Foreign 103.2 59.0 37.2 39.9 41.8
Domestic 220.6 388.5 347.5 546.1 717.6
Capital Expenditure 1,757.9 2,979.2 2,800.0 2,942.9 2,715.5
Transfers 458.9 632.5 465.5 528.3 935.9
NDDC 24.0 60.1 51.3 44.9 56.1
NJC 43.0 58.5 78.0 91.0 95.0
UBE 35.3 44.0 39.3 46.1 64.6
Subnational Governments' Transfers 216.4 271.8 169.2 179.5 263.6
Special funds 140.2 198.1 124.1 147.5 260.1
Other Transfers - - 3.6 19.3 196.5
Others (incl. sub. govt. extrabudgetary exp.) 43.9 60.3 66.7 95.4 111.0
Balances
Current Balance 1,594.9 2,842.0 1,805.3 1,736.0 1,427.7
Primary Balance 160.8 310.3 (610.0) (620.9) (528.4)
OVERALL BALANCE (163.0) (137.2) (994.7) (1,206.9) (1,287.8)
FINANCING 163.0 137.2 994.7 1,206.9 1,287.8
Foreign (Net) 6.1 38.3 101.7 82.6 114.6
Domestic (Net) 156.9 98.8 893.0 1,124.3 1,173.2
Banking System 188.1 131.0 279.3 841.8 673.1
CBN/Sinking Fund - (4.2) 318.5 118.5 6.2
DMBs 188.1 135.2 (39.2) 723.3 666.9
Non-Bank Public 40.2 82.8 796.8 354.5 355.8
Other Funds (71.4) (114.9) (183.1) (72.0) 144.3
1/ Provisional
2/ Non-Oil Revenue (Gross) for 2007-2010 were revised to capture FG Independent Revenue
3/ This excludes SG statutory allocation to LGs in 2011
4/ This includes SG statutory allocation to LGs in 2011
5/ Includes Transfer to FCT and NITDF
Source: Federal Ministry of Finance
Table 20
Summary of General Government Finances
(N' Billion)

Central Bank of Nigeria Annual Report—2011
269
2007 2008 2009 2010 2011 1/
FEDERAL GOVERNMENT RETAINED REVENUE 2,333.7 3,193.4 2,643.0 3,089.2 3,553.5
Share of Federation Account 1,500.9 1,847.0 1,353.6 1,830.9 2,403.9
Share of VAT Pool Account 43.4 58.3 67.4 81.1 93.5
Federal Government Independent Revenue 268.7 114.0 73.2 153.6 182.5
Share of Excess Crude Account 299.1 492.2 815.4 464.1 836.9
Others 221.6 682.0 333.3 559.5 36.7
TOTAL EXPENDITURE 2,450.9 3,240.8 3,453.0 4,194.6 4,712.1
Recurrent Expenditure 1,589.3 2,117.4 2,128.0 3,109.4 3,314.5
Goods and Services 1,235.4 1,538.1 1,712.5 2,546.2 2,527.3
Personnel Cost 761.2 942.8 952.6 1,380.5 1,722.4
Pension 106.1 137.9 195.7 183.5 131.5
Overhead Cost 368.1 457.4 564.2 982.3 673.3
Interest Payments 213.7 381.2 251.8 415.6 527.2
Foreign 103.2 59.0 37.2 39.9 41.8
Domestic 110.5 322.2 214.5 375.8 485.4
Transfers 140.2 198.1 163.7 147.5 260.1
FCT & Others(Special funds) 140.2 198.1 163.7 147.5 260.1
Capital Expenditure & Net Lending 759.3 960.9 1,152.8 883.9 918.5
Domestic Financed Budget 759.3 960.9 1,152.8 883.9 918.5
Budgetary 759.3 960.9 1,152.8 883.9 918.5
Transfers 102.3 162.6 172.2 201.3 479.0
NDDC 24.0 60.1 51.3 44.9 56.1
NJC 43.0 58.5 78.0 91.0 95.0
UBE 35.3 44.0 39.3 46.1 64.6
Others 0.0 0.0 3.6 19.3 263.4
BALANCES
Primary Surplus(+)/Deficit(-) 96.5 333.8 (558.2) (689.8) (631.3)
Current Surplus(+)/Deficit(-) 744.4 1,076.1 515.0 (20.2) 239.0
OVERALL SURPLUS(+)/DEFICIT(-) (117.2) (47.4) (810.0) (1,105.4) (1,158.5)
FINANCING 117.2 47.4 810.0 1,105.4 1,158.5
Foreign (Net) - - 29.8 75.0 73.3
Domestic (Net) 212.3 150.7 577.6 1,110.5 855.3
Banking System 159.8 67.9 175.6 749.7 496.4
Central Bank 0.0 -4.2 - 118.5 6.2
Deposit Money Banks 159.8 72.1 175.6 631.3 490.2
Non-Bank Public 40.2 82.8 395.0 354.5 355.8
Privatization Proceed 12.3 0.0 7.0 6.4 3.0
Other Funds 3/ 95.1- -103.3 202.6 (80.2) 229.9
1/ Provisional
Source: Federal Ministry of Finance
Table 21
Summary of Federal Government Finances
(Naira Billion)

Central Bank of Nigeria Annual Report—2011
270
2007 2008 2009 2010 2011 1/
ADMINISTRATION 626.3 731.0 820.8 1,267.1 1,427.1
General Administration 310.1 369.6 437.9 694.5 699.2
National Assembly 62.8 68.7 106.4 149.7 164.7
Defence 72.1 95.8 54.8 198.7 283.2
Internal Security 181.3 196.9 221.7 224.2 280.0
ECONOMIC SERVICES 179.1 313.8 317.2 413.0 310.5
Agriculture 32.5 65.4 22.4 28.2 41.2
Roads & Construction 71.3 94.5 80.6 57.1 195.9
Transport & Communications 32.2 67.4 90.0 42.4 13.1
Others 43.1 86.5 124.1 285.3 60.3
SOCIAL & COMMUNITY SERVICES 256.7 332.9 354.2 550.9 620.7
Education 150.8 164.0 137.1 170.8 335.8
Health 81.9 98.2 90.2 99.1 231.8
Others 24.0 70.7 126.9 281.0 53.1
TRANSFERS 527.2 739.7 635.8 878.4 956.2
Public Debt Charges (Int) 213.7 381.2 251.8 415.6 527.2
Domestic 110.5 322.2 214.5 375.8 485.4
Foreign 103.2 59.0 37.3 39.9 41.8
Pensions & Gratuities 106.2 137.9 195.7 183.5 131.5
FCT & Others 178.0 198.1 163.7 147.5 260.1
Contingencies (Others) - - - - -
External Obligations - - - - -
Extra-Budgetary Expenditure - - - - -
Deferred Customs Duties - - - - -
Unspecified Expenditure - - - - -
Others 3/ 29.3 22.5 24.5 131.7 37.4
TOTAL 1,589.3 2,117.4 2,127.9 3,109.4 3,314.5
1/ Provisional
Sources: Federal Ministry of Finance, Office of the Accountant-General of the Federation
Central Bank of Nigeria
Table 22
Functional Classification of Federal Government Recurrent Expenditure
(Naira Billion)

Central Bank of Nigeria Annual Report—2011
271
2007 2008 2009 2010 2011 1/
ADMINISTRATION 227.0 287.1 315.9 264.6 232.6
General Administration 178.3 210.3 212.2 171.1 138.0
National Assembly 9.2 15.6 24.2 4.4 0.8
Defence 24.3 32.3 47.3 28.8 28.1
Internal Security 15.2 28.9 32.1 60.3 65.7
ECONOMIC SERVICES 358.4 504.4 506.0 412.2 386.5
Agriculture & Natural Resources 94.1 106.0 138.9 78.0 62.9
Manuf., Mining & Quarrying 8.1 12.7 31.0 20.6 7.6
Transport & Communications 31.4 80.1 106.2 68.9 58.8
Housing 5.8 8.9 - 20.4 22.0
Roads & Construction 105.7 126.9 138.5 195.4 150.7
National Priority Projects - - - - -
JVC Calls/NNPC Priority Projects - - - - -
PTF - - - - -
Counterpart Funding 1.6 2.0 3.4 - -
NDDC - - - - -
Others 111.7 167.8 88.1 29.0 84.4
SOCIAL & COMMUNITY SERVICES 150.9 152.1 120.7 147.4 91.9
Education 46.8 48.8 43.4 87.9 35.4
Health 96.9 97.2 52.5 35.0 39.5
Others 7.2 6.1 24.8 24.6 17.0
TRANSFERS 23.0 17.3 210.2 59.7 207.5
Financial Obligations - - - - -
Capital Repayments - - - - -
Domestic - - - - -
Foreign - - - - -
External Obligations - - - - -
Contingencies - - - - -
Capital Supplementation 23.0 17.3 210.2 59.7 207.5
Net Lending to States/L.G.s/Parast. -
Grants to States -
Others -
TOTAL 759.3 960.9 1,152.8 883.9 918.5
1/ Provisional
Sources: Federal Ministry of Finance, Office of the Accountant-General of the Federation
Central Bank of Nigeria
Table 23
Functional Classification of Federal Government Capital Expenditure
(Naira Billion)

Central Bank of Nigeria Annual Report—2011
272
2007 2008 2009 2010 2011 1/
Total Revenue plus Grants 2,065.4 2,934.8 2,590.7 3,162.5 3,410.1
Share of Federation Account 2/ 1,109.3 1,709.2 973.8 1,353.7 1,786.3
Share of Excess Oil Revenue 258.9 354.1 376.8 322.4 167.0
Budget Augmentation - - 272.8 162.9 510.7
Exchange Gain/NNPC Refund - - 58.9 14.8 18.9
Share of VAT 3/ 144.4 198.1 229.3 275.6 318.0
Internally Generated Revenue 305.7 441.1 461.2 757.9 509.3
Grants & Others 209.4 179.0 188.0 224.2 88.7
Share of Stabilization Fund 37.7 53.4 29.7 51.0 11.2
Total Expenditure 2,116.1 3,021.6 2,776.9 3,266.2 3,542.0
Recurrent Expenditure 1,217.4 1,505.6 1,426.1 1,648.4 2,055.8
Personnel Cost 361.9 380.3 438.5 505.3 680.2
Overhead Cost 328.8 448.5 353.5 402.8 484.9
CRF Charges 99.4 153.6 144.4 181.9 70.9
Pensions 54.9 70.3 73.7 89.1 85.1
Debt Charges 110.1 66.3 133.0 170.3 232.2
Transfer to LGs 112.2 145.5 101.7 106.8 68.9
Other Transfers 104.2 126.3 67.5 72.7 208.7
Others 45.9 114.8 113.8 119.5 224.8
Capital Expenditure 854.8 1,455.7 1,284.2 1,522.4 1,375.2
Extra-Budgetary Expenditure 3/ 43.9 60.3 66.7 95.4 111.0
Current Balance 4/ 848.0 1,429.2 1,164.6 1,514.1 1,354.4
Overall Balance 4/ (50.7) (86.8) (186.2) (103.7) (131.9)
Financing 50.7 86.8 186.2 103.7 131.9
External Loans 5.9 38.3 8.0 7.6 41.3
Internal Loans 25.7 60.2 162.3 88.1 170.4
Other Funds 19.1 (11.7) 16.0 8.0 (79.8)
1/ Prov isional and comprises 36 states and FCT
2/ Gross Statutory Allocation
3/ Includes contribution to external debt fund and other deductions at source
4/ positiv e (+) sign connotes surplus while negativ e (-) sign connotes deficit
Sources: State Gov ernments' Ministries of Finance and Office of the Accountant-General of the Federation's reports
Table 24
State Governments' and FCT Finances
(Naira Billion)

Central Bank of Nigeria Annual Report—2011
273
2007 2008 2009 2010 2011 1/
TOTAL EXPENDITURE 2,116.1 3,107.8 2,776.9 3,266.2 3,542.0
RECURRENT EXPENDITURE 1,217.4 1,591.8 1,426.1 1,648.4 2,055.8
ADMINISTRATION 318.0 465.0 321.7 427.9 378.7
General Administration 208.5 291.4 186.1 265.4 207.5
State Assembly 41.7 76.0 36.0 58.0 43.8
State Judiciary 33.7 51.8 45.1 51.0 34.3
Others 34.1 45.7 54.5 53.5 93.1
ECONOMIC SERVICES 226.6 324.5 486.4 401.6 546.9
Agriculture 30.8 44.3 59.3 52.8 42.5
Livestock 2.2 4.6 17.8 8.1 18.3
Forestry 2.3 3.7 12.6 6.4 10.4
Industry 9.5 15.7 35.5 21.9 13.7
Commerce 5.6 10.0 29.4 15.5 15.4
Finance 38.1 45.5 31.4 49.9 44.8
Transport 26.6 63.2 50.9 55.8 61.0
Cooperative/Supply 2.1 6.6 10.4 6.8 10.0
Power (Incl. Rural Electrification) 21.8 49.7 76.9 54.5 28.5
Works/Roads Construction 91.1 25.1 86.5
Others 87.5 81.2 71.2 104.8 215.8
SOCIAL SERVICES 238.4 279.2 381.5 351.1 462.9
Education 101.1 146.4 140.8 154.1 130.1
Health 54.7 58.4 77.3 75.0 75.8
Water Supply 22.7 28.0 47.7 37.5 20.4
Information & Culture 6.5 8.4 8.9 9.5 18.5
Social & Comm. Dev. 6.9 10.3 16.9 12.9 28.8
Housing 5.4 6.0 35.8 16.1 15.2
Town & Country Planning 7.1 5.9 18.2 11.5 10.6
Others 34.0 15.9 36.0 34.4 163.4
TRANSFERS 434.5 523.2 236.5 467.8 667.2
Debt Charges (Interest Payments) 110.1 66.3 134.0 170.3 232.2
Pensions & Gratuities 54.9 70.3 73.9 89.1 85.1
Others 269.5 386.6 28.6 208.4 350.0
CAPITAL EXPENDITURE 854.8 1,455.7 1,284.2 1,522.4 1,375.2
ADMINISTRATION 174.9 180.3 171.0 281.6 225.3
General Administration 134.0 140.3 112.0 206.5 90.2
State Assembly 28.0 23.2 11.1 33.2 13.8
State Judiciary 11.0 14.3 7.8 17.6 27.1
Others 1.8 2.5 40.0 24.3 94.3
ECONOMIC SERVICES 409.5 757.8 677.1 746.4 705.5
Agriculture 31.3 46.7 52.2 53.5 35.1
Livestock 4.2 6.4 9.3 8.1 3.3
Forestry 1.8 1.1 7.5 4.2 6.8
Industry 14.0 18.5 18.4 21.3 6.5
Commerce 39.8 52.5 26.3 51.1 54.5
Finance 14.4 40.3 26.8 31.8 27.2
Transport 107.5 131.7 90.8 141.9 59.5
Cooperative/Supply 6.9 4.5 5.7 7.8 8.6
Power (Incl. Rural Electrification) 47.5 54.8 48.0 64.5 66.4
Works/Roads Construction 113.7 355.8 339.4 310.6 263.7
Others 28.4 45.7 52.7 51.6 173.9
SOCIAL SERVICES 238.7 456.3 401.2 442.4 331.5
Education 63.2 88.3 93.5 101.9 82.4
Health 31.2 59.0 72.4 65.0 43.8
Water Supply 26.0 35.9 52.1 46.8 36.6
Information & Culture 16.6 11.1 10.8 17.8 18.4
Social & Comm. Development 11.2 19.5 19.8 20.5 14.0
Housing 31.6 33.3 28.0 40.6 14.0
Town & Country Planning 27.6 160.9 55.6 89.5 50.9
Others 31.3 48.3 69.0 60.3 71.4
TRANSFERS 31.7 61.3 34.9 52.0 112.9
Capital Repayments 2.3 8.5 6.1 6.7 26.3
Grants to LGs/Parastatals/Higher Inst. 27.7 43.4 23.7 39.2 68.9
Others 1.7 9.3 5.1 6.1 17.6
EXTRA-BUDGETARY EXPENDITURES 43.9 60.3 66.7 95.4 111.0
1/ Provisional and comprises 36 states and FCT
Table 25
Functional Classification of State Government Recurrent and Capital Expenditure
(Naira Billion)
Source: CBN/NBS/NCC 2011 collaborative fiscal survey, Federal Ministry of Finance & Office of the Accountant General of the Federation

Central Bank of Nigeria Annual Report—2011
274
(2) (3) (4) (5) (6)
1 Abia 34.1 9.0 2.9 0.4 6.4 31.2 - - - 84.1
2 Adamawa 32.8 8.6 2.8 0.4 6.7 6.6 3.7 - - 61.7
3 Akwa Ibom 162.8 53.7 16.9 1.1 8.5 12.1 - 0.6 0.5 256.2
4 Anambra 33.1 8.7 2.8 0.4 7.5 4.8 13.7 - 1.3 72.4
5 Bauchi 38.4 10.1 3.3 0.5 7.7 4.5 - - - 64.4
6 Bayelsa 127.9 40.5 13.7 1.2 5.9 4.4 3.2 - - 196.9
7 Benue 35.4 9.3 3.0 0.4 7.4 8.3 0.2 3.1 - 67.3
8 Borno 39.1 10.3 3.4 0.5 7.4 2.1 - - - 62.7
9 Cross River 35.3 9.6 3.1 0.4 6.5 7.6 - - - 62.5
10 Delta 145.8 48.4 16.2 1.2 8.5 15.6 - - - 235.7
11 Ebonyi 27.2 7.1 2.3 0.3 6.1 2.1 - - - 45.2
12 Edo 40.9 11.9 3.8 0.4 7.2 18.1 - - - 82.3
13 Ekiti 27.4 7.2 2.4 0.3 6.1 4.0 0.8 - - 48.2
14 Enugu 31.0 8.1 2.7 0.4 6.8 4.1 - - - 53.1
15 Gombe 29.1 7.6 2.5 0.4 6.1 7.5 8.3 - 2.6 64.1
16 Imo 39.3 10.8 3.5 0.5 7.2 6.1 0.3 - - 67.6
17 Jigawa 36.3 9.5 3.1 0.4 7.5 2.3 0.1 0.4 6.8 66.5
18 Kaduna 41.4 10.9 3.5 0.5 8.9 11.7 - - - 77.0
19 Kano 51.9 13.6 4.4 0.6 11.7 14.0 0.8 - - 97.0
20 Katsina 39.4 10.3 3.4 0.5 8.5 3.2 1.0 - - 66.4
21 Kebbi 33.0 8.7 2.8 0.4 6.8 3.5 - - - 55.1
22 Kogi 32.9 8.6 2.8 0.4 6.9 16.5 - - - 68.2
23 Kwara 30.0 7.9 2.6 0.4 6.1 11.7 1.7 - - 60.4
24 Lagos 46.8 12.3 4.0 0.6 57.0 147.1 - - - 267.9
25 Nassarawa 28.1 7.4 2.4 0.3 5.7 5.3 - - - 49.2
26 Niger 38.4 10.1 3.3 0.5 7.2 3.2 - - - 62.6
27 Ogun 32.1 8.4 2.8 0.4 7.1 22.2 1.4 - 3.0 77.4
28 Ondo 49.4 14.2 4.9 0.5 7.0 7.2 - - - 83.2
29 Osun 30.4 8.0 2.6 0.4 6.9 11.9 - - - 60.1
30 Oyo 38.3 10.1 3.3 0.5 8.6 13.4 - 3.5 1.1 78.7
31 Plateau 32.2 8.4 2.8 0.4 6.8 4.9 7.6 - 0.0 63.1
32 Rivers 167.3 54.0 17.8 1.6 11.2 62.9 - - - 314.7
33 Sokoto 34.2 9.0 2.9 0.4 7.1 3.1 - 3.7 1.2 61.7
34 Taraba 32.4 8.5 2.8 0.4 6.1 2.5 2.9 - - 55.5
35 Yobe 32.2 8.4 2.8 0.4 6.1 2.3 - - - 52.2
36 Zamfara 32.3 8.5 2.8 0.4 6.6 10.6 - - 0.0 61.1
37 FCT 44.9 12.0 3.9 - 6.2 10.3 26.5 - - 103.8
38 Escrow (Disputed Fund) 2.7 1.2 - 0.0 - - - - - 4.0
1,786.3 510.7 167.0 18.9 318.0 509.3 72.1 11.2 16.6 3,410.1 1/ Provisional and comprises fiscal survey returns from 25 states and est imates from 12
2/ Gross allocation.
3/ Posit ive (+) sign connotes decrease while (-) sign connotes increase in funds.
4/ This includes transfers from CRF and Miscellaneous receipts
Source: CBN/NBS/NCC 2011 collaborative fiscal survey, Federal Ministry of Finance & Office of the Accountant General of the Federation
(1)
TOTAL
S/N STATESGross Statutory
Allocation
2/
Distribution from
Excess Crude A/C
as Augmentation
Share of Excess
Oil Revenue
Exchange
Gain/NNPC
Refund
VAT
Internally
Gen. Rev .
(IGR)
GrantsStabilization
Fund & Others
REVENUE & OTHER RECEIPTS
Others TOTAL
Table 26
Summary of State Government and FCT Finances: State-By-State, 2011 1/
(Naira Billion)

Central Bank of Nigeria Annual Report—2011
275
Personnel
Cost
Overhea
d Cost
CRF
ChargesPensions
Debt
Charges
Transfer
to LGs
Other
TransfersOthers Internal External Sub-Total
(7) (8) (9) (10) (11) (12) (13) (14) (15) (17) (18) (19)
1 Abia 10.0 15.9 0.1 5.6 18.4 - 8.2 6.0 64.2 22.5 2.7 89.5 19.8 (5.4) 17.3 0.9 18.2 (12.8) 5.4
2 Adamawa 12.1 25.7 1.0 4.3 1.4 - 2.3 2.7 49.6 28.1 1.8 79.5 12.0 (17.8) 7.6 0.4 8.0 9.8 17.8
3 Akwa Ibom 17.9 4.1 1.6 3.2 0.3 0.9 0.9 19.7 48.5 190.6 (0.0) 239.1 207.6 17.1 - 0.7 0.7 (17.7) (17.1)
4 Anambra 3.7 5.0 1.0 3.1 0.9 - 1.5 5.0 20.1 39.6 0.5 60.2 52.3 12.2 - 0.7 0.7 (12.9) (12.2)
5 Bauchi 18.6 26.8 0.0 1.3 - - - 11.2 57.9 18.4 3.4 79.7 6.5 (15.3) 15.5 1.8 17.3 (1.9) 15.3
6 Bayelsa 34.7 25.6 0.6 5.1 22.2 - 31.1 37.9 157.0 - 27.0 184.1 39.9 12.8 7.9 0.4 8.3 (21.1) (12.8)
7 Benue 14.9 8.4 0.3 0.8 3.5 - 0.7 4.6 33.1 35.7 4.5 73.3 34.2 (6.0) - 0.5 0.5 5.4 6.0
8 Borno 13.1 8.0 0.3 0.9 0.0 - 0.1 5.5 27.9 31.7 0.1 59.7 34.8 3.0 - 0.0 0.0 (3.0) (3.0)
9 Cross River 15.8 6.1 7.6 2.2 4.2 - - 0.9 36.8 23.8 1.4 61.9 25.8 0.6 0.2 0.3 0.5 (1.1) (0.6)
10 Delta 19.1 16.7 - 3.9 1.6 46.3 20.2 8.3 116.0 124.1 3.9 243.9 119.7 (8.3) - (0.0) (0.0) 8.3 8.3
11 Ebonyi 7.1 3.3 - 0.9 2.6 - 0.2 2.3 16.4 36.8 7.0 60.2 28.8 (15.0) - 1.3 1.3 13.6 15.0
12 Edo 20.2 13.3 0.1 3.0 9.9 - 10.3 11.1 67.9 - 4.5 72.4 14.5 9.9 4.5 0.5 5.0 (15.0) (9.9)
13 Ekiti 13.1 2.6 0.5 2.3 14.1 10.9 4.1 - 47.6 27.9 1.7 77.2 0.6 (29.0) 32.5 0.5 33.0 (4.0) 29.0
14 Enugu 10.7 6.4 0.5 1.2 0.1 0.0 3.2 1.6 23.7 26.1 0.5 50.3 29.4 2.8 - 1.5 1.5 (4.3) (2.8)
15 Gombe 9.1 29.1 0.2 1.3 5.0 - 4.6 0.2 49.5 31.3 1.2 82.0 14.6 (17.9) 5.9 0.6 6.5 11.3 17.9
16 Imo 8.1 18.4 13.6 - 23.0 - 10.4 0.1 73.6 11.5 5.9 91.0 (6.0) (23.4) 17.8 0.5 18.2 5.2 23.4
17 Jigawa 3.2 5.5 - 0.3 0.1 - 0.7 6.5 16.4 55.8 0.6 72.8 50.1 (6.3) - 1.1 1.1 5.2 6.3
18 Kaduna 18.8 21.2 0.2 5.3 0.6 - 0.0 1.1 47.4 31.8 3.6 82.7 29.6 (5.8) 20.0 5.1 25.1 (19.4) 5.8
19 Kano 58.4 14.0 1.0 3.8 - - 0.5 - 77.6 19.9 1.3 98.8 19.4 (1.8) - 1.4 1.4 0.4 1.8
20 Katsina 16.7 5.0 0.3 0.7 0.2 - 0.6 3.3 26.9 37.9 1.5 66.3 39.5 0.1 - (0.5) (0.5) 0.4 (0.1)
21 Kebbi 11.8 9.2 2.5 1.7 - - 9.4 0.4 35.0 38.4 0.8 74.2 20.1 (19.0) - 0.4 0.4 18.6 19.0
22 Kogi 20.2 8.7 16.1 2.4 1.8 - 4.3 - 53.6 27.9 1.2 82.7 14.6 (14.6) 2.0 0.4 2.4 12.2 14.6
23 Kwara 8.5 16.4 4.0 4.0 11.6 3.2 2.9 4.2 54.8 28.9 0.2 83.8 5.6 (23.4) 7.3 0.4 7.7 15.7 23.4
24 Lagos 32.7 37.2 - 3.0 3.6 0.0 14.3 9.7 100.5 177.4 7.2 285.1 167.4 (17.2) - 17.5 17.5 (0.2) 17.2
25 Nassarawa 8.2 16.7 - 1.6 10.2 - 8.6 - 45.4 - 4.5 49.9 3.8 (0.7) 1.5 0.9 2.4 (1.7) 0.7
26 Niger 19.5 18.2 - 2.5 4.9 1.4 - 1.9 48.3 3.7 5.3 57.2 14.4 5.4 - 0.2 0.2 (5.6) (5.4)
27 Ogun 34.1 9.9 - 5.0 12.8 - 0.1 0.0 61.9 26.0 0.4 88.3 15.5 (10.9) 24.3 2.7 27.0 (16.1) 10.9
28 Ondo 20.6 3.4 - 1.6 1.9 - 6.4 0.6 34.6 39.3 1.6 75.5 48.6 7.8 - (0.2) (0.2) (7.5) (7.8)
29 Osun 19.6 6.6 17.2 - - - - 1.7 45.1 16.4 0.5 62.0 15.0 (1.9) 2.7 0.4 3.1 (1.3) 1.9
30 Oyo 35.3 14.5 0.2 - 0.0 - 20.0 1.1 71.2 2.8 2.2 76.2 7.6 2.6 0.6 (0.8) (0.2) (2.4) (2.6)
31 Plateau 13.9 28.9 - 2.5 9.0 - 2.2 - 56.4 16.2 1.3 73.9 6.6 (10.8) 2.7 (0.4) 2.3 8.6 10.8
32 Rivers 62.5 15.2 0.5 7.8 33.8 - 15.0 45.0 179.8 104.4 5.4 289.6 134.9 25.1 - 0.0 0.0 (25.1) (25.1)
33 Sokoto 18.0 5.8 - 0.9 20.1 - 0.1 0.2 45.1 13.9 0.4 59.4 16.6 2.3 - 0.6 0.6 (2.8) (2.3)
34 Taraba 10.9 5.4 - 1.2 4.1 - 12.0 11.5 45.2 1.9 0.1 47.2 10.3 8.2 - 0.2 0.2 (8.4) (8.2)
35 Yobe 10.7 12.5 1.2 1.1 0.2 - - - 25.7 31.9 0.3 57.9 26.5 (5.8) - 0.6 0.6 5.1 5.8
36 Zamfara 20.0 9.5 0.1 0.7 9.8 - 1.3 3.4 44.9 7.7 2.6 55.1 16.2 6.0 - 0.4 0.4 (6.4) (6.0)
37 FCT 8.4 5.6 - - 0.2 6.3 12.5 17.2 50.4 45.0 1.9 97.2 53.5 6.6 - 0.5 0.5 (7.1) (6.6)
38
Escrow
(Disputed
Fund) - - - - - - - - - - 2.1 2.1 4.0 1.9 - - - (1.9) (1.9)
680.2 484.9 70.9 85.1 232.2 68.9 208.7 224.8 2,055.8 1,375.2 111.0 3,542.0 1,354.4 (131.9) 170.4 41.3 211.7 (79.8) 131.9 1/ Provisional
2/ Gross allocation.
3/ Posit ive (+) sign connotes decrease while (-) sign connotes increase in funds.
4/ This includes transfers from CRF and Miscellaneous receipts
Source: CBN/NBS/NCC 2011 collaborative fiscal survey, Federal Ministry of Finance & Office of the Accountant General of the Federation
TOTAL
TOTAL
CAPITALEXTRA-BUDGETARY
EXPENDITURE
TOTAL
EXPENDITURECurrent Overall
LOANSRECURRENT
SUB-TOTAL
BALANCE FINANCING
S/N STATES
EXPENDITURE & TRANSFERS
OTHER FUNDS
3/
Table 26 Cont.
Summary of State Government and FCT Finances: State-By-State, 2011 1/
(Naira Billion)

Central Bank of Nigeria Annual Report—2011
276
2010 2011 1/
Recurrent Capital Total Recurrent Capital Total Changes % Changes
Education 154.1 101.9 256.0 130.1 82.4 212.6 (43.4) -17.0 0.9 0.6
Health 75.0 65.0 140.0 75.8 43.8 119.6 (20.4) -14.6 0.5 0.3
Agriculture 67.3 65.8 133.1 71.2 45.1 116.4 (16.7) -12.6 0.5 0.3
Water Supply 37.5 46.8 84.3 20.4 36.6 57.0 (27.3) -32.4 0.3 0.2
Housing 15.2 40.6 55.8 15.2 14.0 29.2 (26.6) -47.7 0.2 0.1
TOTAL 1,648.4 1,522.4 669.2 2,055.8 1,375.2 534.8 2.3 1.5
TOTAL EXPENDITURE 3,266.2 3,542.0 275.81 8.4
1/ Provisional
Source: CBN/NBS/NCC 2011 collaborative fiscal survey, Federal Ministry of Finance, Office of the Accountant General of the Federation & National Bureau of Statistics
Table 27
State Governments' and FCT Expenditure on Selected Sectors
(Naira Billion)
SELECTED SECTORS
2010 2011 2011
As % of GDP

Central Bank of Nigeria Annual Report—2011
277
2007 2008 2009 2010 2011 1/
Total Revenue 832.3 1,379.0 1,069.4 1,359.2 1,603.8
Share of Federation Account 2/ 568.3 722.3 529.3 716.0 940.0
Share of VAT 105.1 135.9 157.4 189.1 218.2
Internally Generated Revenue 21.3 23.1 26.1 26.2 27.3
Grants and Others 3.8 0.3 20.3 36.2 44.1
Share of Stabilization Fund 3.7 4.4 11.4 12.6 21.3
State Allocation 3.0 6.8 19.7 12.7 14.0
Share of Excess Crude 127.1 486.1 145.0 158.9 80.7
FGN/NNPC Refunds to LGs - - - 121.6 11.5
Budget Augmentation - - 131.7 78.7 246.6
Exchange Gain - - 28.4 7.1 -
Total Expenditure 827.4 1,382.0 1,067.6 1,356.7 1,601.2
Recurrent Expenditure 683.6 819.4 704.6 823.7 1,179.4
Personnel Cost 406.9 341.4 306.3 316.5 748.1
Overhead Cost 220.7 355.6 328.7 395.0 231.7
CRFC & Others 56.0 122.5 69.7 112.2 199.6
Capital Expenditure 143.8 562.6 363.0 533.0 421.8
Administration 15.0 72.8 57.4 78.7 52.4
Economic Services 54.4 252.8 175.0 247.2 211.8
Social & Community Services 59.9 219.8 124.2 183.3 148.6
Transfers 14.5 17.2 6.5 23.8 9.0
Current Balance 148.7 559.6 364.8 535.5 424.4
Overall Balance 4.9 (3.0) 1.8 2.5 2.6
Financing (4.9) 3.0 (1.8) (2.5) (2.6)
External Loans 0.2 - - - -
Internal Loans 2.6 2.9 6.1 3.2 6.3
Opening Cash Balance 37.3 6.2 38.5 30.4 26.3
Other Funds 3/ (44.9) (6.1) (46.3) (36.1) (35.2)
1/ Prov isional
2/ Gross
3/ Includes Closing Balance
Table 28
Summary of Local Government Finances
(Naira Billion)
Sources: Federal Ministry of Finance, Office of the Accountant General of the Federation and Staff
Estimates

Central Bank of Nigeria Annual Report—2011
278
NNPC
Refunds
to LGs Tax Non-Tax Sub-Total
1 Abia 19.66 1.56 0.24 5.31 3.79 0.01 0.23 0.2 0.14 0.43 - 31.37
2 Adamawa 25.17 2.10 0.31 6.66 4.58 0.27 0.70 1.0 0.25 - - 40.1
3 Akwa Ibom 33.20 2.77 0.41 8.79 7.08 0.05 0.40 0.5 0.44 0.64 0.20 53.99
4 Anambra 24.95 2.09 0.31 6.61 5.10 0.01 0.16 0.2 - 0.25 - 39.46
5 Bauchi 28.86 2.41 0.35 7.64 5.10 0.00 0.36 0.4 - 6.07 0.23 51.02
6 Bayelsa 10.62 0.89 0.13 2.81 2.17 0.02 0.32 0.3 - 0.93 0.01 17.89
7 Benue 29.34 2.45 0.36 7.77 5.35 0.11 0.36 0.5 0.44 0.70 1.12 48.01
8 Borno 33.51 2.71 0.41 8.65 5.86 0.06 0.53 0.6 0.00 0.00 0.26 51.99
9 Cross River 20.96 1.75 0.26 5.55 3.99 0.01 0.31 0.3 0.23 0.48 0.01 33.54
10 Delta 27.70 2.31 0.34 7.33 6.22 0.00 0.40 0.4 3.62 0.55 0.16 48.64
11 Ebonyi 14.93 1.25 0.18 3.95 3.01 0.04 1.13 1.2 0.07 - - 24.58
12 Edo 20.98 1.75 0.26 5.55 4.43 0.00 0.36 0.4 - 0.35 - 33.68
13 Ekiti 17.06 1.43 0.21 4.52 3.45 0.01 0.06 0.1 0.02 1.94 - 28.70
14 Enugu 20.22 1.69 0.25 5.35 4.09 0.07 0.38 0.4 0.03 - - 32.07
15 Gombe 14.75 1.23 0.18 3.90 2.77 0.01 0.15 0.2 0.13 0.21 - 23.34
16 Imo 29.27 2.45 0.36 7.75 5.78 0.02 0.31 0.3 - - - 45.94
17 Jigawa 30.71 2.57 0.38 8.13 6.00 0.71 0.42 1.1 0.05 0.03 - 48.99
18 Kaduna 32.94 3.40 0.40 8.72 6.38 0.01 1.39 1.4 0.58 0.28 0.01 54.10
19 Kano 54.06 4.52 0.66 14.31 11.17 0.02 0.87 0.9 1.09 5.11 1.04 92.84
20 Katsina 39.52 3.30 0.49 10.46 7.65 0.07 1.05 1.1 0.54 - 0.01 63.10
21 Kebbi 24.55 2.05 0.30 6.50 4.63 0.06 3.69 3.7 0.19 5.27 - 47.24
22 Kogi 25.45 2.13 0.31 6.74 4.71 0.02 0.29 0.3 0.01 0.05 0.83 40.53
23 Kwara 19.54 1.63 0.24 5.17 3.49 0.01 0.20 0.2 0.51 0.16 - 30.97
24 Lagos 32.84 2.74 0.40 8.69 33.63 0.00 3.53 3.5 0.01 3.85 - 85.69
25 Nassarawa 15.64 1.31 0.19 4.14 2.74 0.01 0.31 0.3 0.08 0.34 - 24.76
26 Niger 31.69 2.65 0.39 8.39 5.51 0.10 0.76 0.9 0.63 - - 50.11
27 Ogun 23.45 1.96 0.29 6.21 4.72 0.00 0.73 0.7 0.01 - - 37.37
28 Ondo 21.65 1.81 0.27 5.73 4.32 0.01 0.21 0.2 0.16 0.21 0.03 34.38
29 Osun 29.50 2.47 0.36 7.81 5.96 0.01 0.26 0.3 0.44 0.29 - 47.09
30 Oyo 37.72 3.15 0.46 9.98 7.58 0.03 0.59 0.6 1.63 0.48 17.10 78.74
31 Plateau 23.73 3.61 0.29 4.22 4.16 0.11 0.23 0.3 - - - 36.35
32 Rivers 28.27 2.36 0.35 7.47 7.57 0.86 0.88 1.7 0.05 0.29 0.03 48.14
33 Sokoto 27.10 2.26 0.33 7.17 5.12 0.03 0.14 0.2 0.28 0.42 0.00 42.85
34 Taraba 21.57 1.80 0.26 5.71 3.43 0.12 0.42 0.5 - 1.82 - 35.14
35 Yobe 20.92 1.75 0.26 5.54 3.61 0.19 1.14 1.3 0.87 11.07 0.24 45.60
36 Zamfara 19.64 1.64 0.24 5.20 3.54 0.00 0.23 0.2 0.01 1.90 - 32.41
37 FCT 8.36 0.70 0.10 2.21 9.54 0.02 0.75 0.8 1.51 - - 23.19
940.0 80.6 11.5 246.6 218.2 3.1 24.3 27.3 14.0 44.1 21.3 1,603.8
1/ Provisional
2/ Gross
3/ Positive (+) sign connotes decrease while (-) sign connotes increase in funds.
#####Sources: Federal Ministry of Finance, Office of the Accountant General of the
Federation and Staff Estimates
Gross
Statutory
Allocation 2/
Share of
Excess Oil
Revenue
Budget
Augmentation VAT
Internally Gen. Rev. (IGR)
State
Allocation
Grants
and
Others
TOTAL
S/N STATES
REVENUE & OTHER RECEIPTS
Stabilization
Funds &
Others TOTAL
Table 29
SUMMARY OF LOCAL GOVERNMENT FINANCES (STATE BY STATE, 2011) 1/
(Naira Billion)

Central Bank of Nigeria Annual Report—2011
279
Personne
l Cost
Overhe
ad Cost
Transfer
s Others Internal External
Sub-
Total
1 Abia 13.18 1.65 1.64 1.76 18.2 4.05 22.3 13.1 9.1 0.39 - - - (9.5) (9.1) 0.52 - 0.52
2 Adamawa 23.18 2.58 0.43 0.04 26.2 5.13 31.4 13.8 8.7 0.21 0.6 - 0.6 (9.5) (8.7) 0.89 - 0.89
3 Akwa Ibom 18.36 4.63 12.99 1.63 37.6 11.29 48.9 16.4 5.1 0.12 0.0 - 0.0 (5.2) (5.1) 0.05 - 0.05
4 Anambra 19.63 1.79 0.80 0.74 23.0 6.45 29.4 16.5 10.1 1.75 - - - (11.8) (10.1) 0.21 - 0.21
5 Bauchi 21.28 7.42 19.06 - 47.8 7.77 55.5 3.3 (4.5) 0.11 0.3 - 0.3 4.1 4.5 0.80 - 0.80
6 Bayelsa 7.40 2.51 2.29 0.77 13.0 3.61 16.6 4.9 1.3 (0.01) 0.0 - 0.0 (1.3) (1.3) 0.06 - 0.06
7 Benue 21.46 5.04 8.90 - 35.4 10.74 46.1 12.6 1.9 0.22 1.9 - 1.9 (4.0) (1.9) 2.55 - 2.55
8 Borno 36.52 14.28 1.16 0.56 52.5 19.80 72.3 (0.5) (20.3) 0.33 - - - 20.0 20.3 8.76 - 8.76
9 Cross River 16.88 2.04 2.62 - 21.5 6.67 28.2 12.0 5.3 0.39 0.1 - 0.1 (5.8) (5.3) 0.28 - 0.28
10 Delta 27.72 7.88 0.64 0.00 36.3 8.68 44.9 12.4 3.7 0.49 - - - (4.2) (3.7) 3.87 - 3.87
11 Ebonyi 7.51 1.82 0.17 1.46 11.0 8.57 19.5 13.6 5.0 0.22 0.1 - 0.1 (5.3) (5.0) 0.23 - 0.23
12 Edo 14.76 4.95 4.00 0.07 23.8 7.45 31.2 9.9 2.4 1.50 0.0 - 0.0 (4.0) (2.4) 1.19 - 1.19
13 Ekiti 13.49 1.87 0.05 0.02 15.4 7.06 22.5 13.3 6.2 0.34 - - - (6.5) (6.2) 1.45 - 1.45
14 Enugu 14.35 2.81 0.34 - 17.5 11.58 29.1 14.6 3.0 1.12 - - - (4.1) (3.0) 0.75 - 0.75
15 Gombe 12.58 6.49 2.64 - 21.7 3.80 25.5 1.6 (2.2) 0.62 - - - 1.6 2.2 0.32 - 0.32
16 Imo 17.21 2.43 0.47 2.51 22.6 5.26 27.9 23.3 18.1 0.41 0.1 - 0.1 (18.6) (18.1) 0.79 - 0.79
17 Jigawa 26.64 23.25 8.25 0.04 58.2 19.48 77.7 (9.2) (28.7) 1.26 0.1 - 0.1 27.3 28.7 0.16 - 0.16
18 Kaduna 20.51 9.50 3.48 0.10 33.6 14.24 47.8 20.5 6.3 2.32 0.0 - 0.0 (8.6) (6.3) 0.72 - 0.72
19 Kano 37.19 25.63 3.34 - 66.2 8.98 75.1 26.7 17.7 1.14 0.0 - 0.0 (18.9) (17.7) 1.40 - 1.40
20 Katsina 22.16 11.60 5.48 0.09 39.3 22.25 61.6 23.8 1.5 1.30 - - - (2.8) (1.5) 1.28 - 1.28
21 Kebbi 23.35 5.11 25.48 0.03 54.0 41.78 95.7 (6.7) (48.5) 0.06 - - - 48.4 48.5 4.58 - 4.58
22 Kogi 29.80 5.04 2.28 0.28 37.4 6.16 43.6 3.1 (3.0) 1.52 0.0 - 0.0 1.5 3.0 3.36 - 3.36
23 Kwara 11.31 3.11 1.52 0.07 16.0 6.95 23.0 15.0 8.0 0.12 0.4 - 0.4 (8.6) (8.0) 0.30 - 0.30
24 Lagos 20.33 11.38 5.37 2.47 39.5 9.16 48.7 46.1 37.0 1.27 0.2 - 0.2 (38.5) (37.0) 3.91 - 3.91
25 Nassarawa 17.91 1.84 3.23 1.13 24.1 2.48 26.6 0.7 (1.8) 0.15 0.0 - 0.0 1.7 1.8 1.25 - 1.25
26 Niger 16.12 7.96 7.67 0.77 32.5 12.16 44.7 17.6 5.4 (0.06) 0.3 - 0.3 (5.7) (5.4) 0.88 - 0.88
27 Ogun 25.63 6.72 4.64 0.26 37.3 4.35 41.6 0.1 (4.2) (0.10) 0.3 - 0.3 4.1 4.2 1.41 - 1.41
28 Ondo 17.48 2.41 1.46 0.70 22.0 19.65 41.7 12.3 (7.3) 1.80 0.1 - 0.1 5.4 7.3 0.27 - 0.27
29 Osun 29.40 5.28 5.59 - 40.3 9.54 49.8 6.8 (2.7) 0.99 0.1 - 0.1 1.7 2.7 0.28 - 0.28
30 Oyo 45.69 9.05 0.59 0.14 55.5 32.39 87.9 23.3 (9.1) 2.45 0.0 - 0.0 6.7 9.1 0.05 - 0.05
31 Plateau 14.99 4.38 0.38 0.39 20.1 7.36 27.5 16.2 8.8 1.50 0.2 - 0.2 (10.5) (8.8) 2.85 - 2.85
32 Rivers 23.19 10.17 4.24 4.57 42.2 12.26 54.4 6.0 (6.3) 0.66 0.1 - 0.1 5.5 6.3 0.48 - 0.48
33 Sokoto 18.72 5.04 2.53 - 26.3 21.41 47.7 16.6 (4.8) 0.66 - - - 4.2 4.8 1.42 - 1.42
34 Taraba 24.09 4.73 5.14 - 34.0 9.79 43.7 1.2 (8.6) 0.74 0.1 - 0.1 7.8 8.6 1.62 - 1.62
35 Yobe 17.09 2.46 1.88 0.02 21.4 16.58 38.0 24.2 7.6 0.10 0.0 - 0.0 (7.7) (7.6) 1.10 - 1.10
36 Zamfara 10.63 3.99 12.13 - 26.7 9.70 36.5 5.7 (4.0) 0.07 0.9 - 0.9 3.1 4.0 1.01 - 1.01
37 FCT 10.37 2.83 16.11 - 29.3 7.19 36.5 (6.1) (13.3) 0.17 0.3 - 0.3 12.9 13.3 1.43 - 1.43
748.1 231.7 179.0 20.6 1,179.4 421.8 1,601.2 424.4 2.6 26.3 6.3 - 6.3 (35.2) (2.6) 52.5 - 52.5
1/ Provisional
2/ Gross
3/ Positive (+) sign connotes decrease while (-) sign connotes increase in funds.
-
OTHER
FUNDS 4/ TOTAL DomesticForeign TOTAL
TOTAL
CAPITAL
TOTAL
EXPENDITU
RE Current Overall
OPENING
BALANCE
LOANSRECURRENT
SUB-
TOTAL
BALANCE FINANCING OUTSTANDING DEBT
S/N STATES
EXPENDITURE & TRANSFERS
Table 29 Cont.
SUMMARY OF LOCAL GOVERNMENT FINANCES (STATE BY STATE, 2011) 1/
(Naira Billion)

Central Bank of Nigeria Annual Report—2011
280
Type 2007 2008 2009 2010 2011 1/
External Debt 438.9 523.3 590.4 689.8 896.8
Domestic Debt 2,169.6 2,320.3 3,228.0 4,551.8 5,622.8
Total 2,608.5 2,843.6 3,818.4 5,241.7 6,519.6
Item 2007 2008 2009 2010 2011 1/
COMPOSITION OF DEBT.
Instruments
Treasury Bills 574.9 471.9 797.5 1,277.1 1,727.9
Treasury Bonds 407.9 402.3 392.1 372.9 353.7
Development Stocks 0.6 0.5 0.5 0.2 -
FGN Bonds 1,007.7 1,445.6 1,974.9 2,901.6 3,541.2
Special FGN Bonds 178.4 - - - -
Promisory Notes 2/ - - 63.0 - -
HOLDERS
Banking System 1,703.6 1,771.5 1,882.5 3,092.5 4,286.0
Central Bank 293.6 289.4 323.2 343.1 348.0
Deposit Money Banks (DMBs) 1,410.0 1,482.2 1,274.6 2,605.0 3,790.8
Sinking Fund - - 284.7 144.4 147.2
Non-Bank Public 466.0 548.8 1,345.6 1,459.3 1,336.8
TENOR**
2 years and below 709.8 952.0 1,421.4 1,995.3 3,124.9
2-5 years 820.9 472.7 947.3 1,316.8 1,064.4
5-10 years 252.9 406.1 294.7 496.4 715.2
Over 10 years 386.0 489.5 564.6 743.3 718.3
Total Debt Outstanding 2,169.6 2,320.3 3,228.0 4,551.8 5,622.8
**Figures for 2010 have been revised
1/ Provisional
2/ Introduced 30th September, 2009
TABLE 30
Consolidated Debt of the Federal Government
(Naira Billion)
Domestic Public Debt (end - Period)

Central Bank of Nigeria Annual Report—2011
281
2007 2008 2009 2010 2011 1/ 2007 2008 2009 2010 2011 1/
Multilateral 3,080.9 3,172.9 3,504.5 4,217.8 4,568.9 374.3 464.6 524.2 635.4 723.1
Paris Club - - - - - - - - - -
London Club - - - - - - - - - -
Par Bonds - - - - - - - - - -
Promissory Notes - - - - - - - - - -
Others 2/ 573.3 547.5 442.8 361.0 1,097.7 64.6 58.7 66.2 54.4 173.7
Total Debt Outstanding 3,654.2 3,720.4 3,947.3 4,578.8 5,666.6 438.9 523.3 590.4 689.8 896.8
2007 2008 2009 2010 2011 1/ 2007 2008 2009 2010 2011 1/
Multilateral 392.8 380.6 260.5 212.6 172.3 47.9 31.0 38.8 32.0 26.5
I.B.R.D. 203.7 204.4 141.4 73.3 36.8 25.7 16.8 21.1 11.0 5.7
E.I.B. 3.9 1.9 - - 6.9 0.2 - - - 1.1
A.D.B. & Others 185.2 174.4 119.0 139.3 128.5 21.9 14.2 17.7 20.9 19.8
Paris Club - - - - - - - - - -
London Club 102.6 41.7 - - - 5.2 - - - -
Promissory Notes 476.6 - - - - - - - - -
Others 3/ 50.1 42.3 167.5 141.8 179.3 5.3 19.9 24.9 21.3 27.6
Total 1,022.0 464.6 428.0 354.4 351.6 58.5 50.9 63.7 53.3 54.1
1/ Provisional
2/ Includes Non-Paris Bilateral and Commercial debts and ICM (Euro-Bond)
3/ Includes Non-Paris Bilateral, Non-Paris Commercial, Oil Warrants and ICM (Euro Bond).
Source: Debt Management Office, The Presidency, Abuja.
External Debt Service Payments
Holder
US $ Milliom Naira Billion
Table 31
External Public Debt Outstanding
External Debt Stock
Holder
US $ Milliom Naira Billion

Central Bank of Nigeria Annual Report—2011
282
2007 2008 2009 2010 /1 2011 /2
1. Agriculture 266.5 283.2 299.8 317.3 335.4 42.0 42.1 41.7 40.9 40.2
(a) Crop Production 237.7 252.5 267.2 282.6 298.6 37.5 37.6 37.2 36.4 35.8
(b) Livestock 16.7 17.9 19.0 20.3 21.5 2.6 2.7 2.6 2.6 2.6
(c) Forestry 3.4 3.6 3.8 4.0 4.3 0.5 0.5 0.5 0.5 0.5
(d) Fishery 8.7 9.2 9.8 10.4 11.0 1.4 1.4 1.4 1.3 1.3
2. Industry 151.7 146.5 149.5 158.2 160.2 23.9 21.8 20.8 20.4 19.2
(a) Crude Petroleum 124.3 116.6 117.1 123.3 122.6 19.6 17.3 16.3 15.9 14.7
(b) Solid Minerals 1.9 2.1 2.4 2.7 3.0 0.3 0.3 0.3 0.3 0.4
(c) Manufacturing 25.5 27.8 30.0 32.3 34.7 4.0 4.1 4.2 4.2 4.2
3. Building & Construction 10.9 12.3 13.8 15.5 17.3 1.7 1.8 1.9 2.0 2.1
4. Wholesale & Retail Trade 102.6 117.0 130.4 145.1 161.5 16.2 17.4 18.1 18.7 19.4
5. Services 102.5 113.2 125.4 140.3 158.9 16.2 16.8 17.4 18.1 19.1
(a) Transport 17.0 18.2 19.4 20.8 22.2 2.7 2.7 2.7 2.7 2.7
(b) Communication 14.6 19.6 26.3 35.3 47.6 2.3 2.9 3.7 4.6 5.7
(c) Utilities 22.2 23.0 23.7 24.5 25.3 3.5 3.4 3.3 3.2 3.0
(d) Hotel & Restaurant 2.7 3.1 3.5 3.9 4.4 0.4 0.5 0.5 0.5 0.5
(e) Finance & Insurance 24.4 25.6 26.6 27.7 28.8 3.8 3.8 3.7 3.6 3.5
(f) Real Estate & Business Services 10.6 11.8 13.0 14.4 15.8 1.7 1.8 1.8 1.9 1.9
(h) Producers of Govt. Services 5.9 6.3 6.7 7.0 7.4 0.9 0.9 0.9 0.9 0.9
(I) Comm., Social & Pers. Services 5.1 5.6 6.2 6.8 7.4 0.8 0.8 0.9 0.9 0.9
TOTAL (GDP) 634.3 672.2 719.0 776.3 833.4 100.0 100.0 100.0 100.0 100.0
NON-OIL (GDP) 510.0 555.6 601.9 653.1 710.9 80.4 82.7 83.7 84.1 85.3
TOTAL GDP GROWTH RATE (%) 6.4 6.0 7.0 8.0 7.4
Of which Agriculture (%) 7.2 6.3 5.9 5.8 5.7
Industry (%) -2.2 -3.4 2.0 5.8 1.3
Services (%) 9.9 10.4 10.8 11.9 13.3
Finance & Insurance (%) 5.0 4.8 4.0 3.9 4.0
Manufacturing (%) 9.6 8.9 7.9 7.6 7.6
Mining and Quarying (%) 12.8 12.8 12.1 12.1 11.5
Communication (%) 32.9 34.0 34.2 34.4 34.8
OIL GDP GROWTH RATE (%) -4.5 -6.2 0.5 5.2 -0.6
NON-OIL GDP GROWTH RATE (%) 9.5 9.0 8.3 8.5 8.9
1/ Revised
2/ Provisional
Source: National Bureau of Statistics (NBS)
Table 32
Gross Domestic Product at 1990 Constant Basic Prices
( Naira Billion, unless otherwise stated)
Activity Sector 2007 2008 2009 2010 /1 2011 /2Share in Total (%)

Central Bank of Nigeria Annual Report—2011
283
2007 2008 2009 2010 /1 2011 /2
1. Agriculture 6,757.9 7,981.4 9,186.3 10,310.7 11,590.1 32.7 32.9 37.1 30.3 31.1
(a) Crop Production 6,024.4 7,114.8 8,200.9 9,196.0 10,320.3 29.2 29.3 33.1 27.1 27.7
(b) Livestock 434.2 512.9 583.6 662.1 756.1 2.1 2.1 2.4 1.9 2.0
(c) Forestry 83.8 99.0 111.1 124.3 140.2 0.4 0.4 0.4 0.4 0.4
(d) Fishery 215.5 254.6 290.7 328.2 373.6 1.0 1.0 1.2 1.0 1.0
2. Industry 8,085.4 9,719.5 8,071.1 15,194.6 16,022.8 39.1 40.0 32.6 44.7 43.0
(a) Crude Petroleum 7,533.0 9,097.8 7,418.1 14,505.8 15,275.7 36.5 37.4 29.9 42.7 40.9
(b) Solid Minerals 31.5 36.2 40.6 45.7 52.4 0.2 0.1 0.2 0.1 0.1
(c) Manufacturing 520.9 585.6 612.3 643.1 694.7 2.5 2.4 2.5 1.9 1.9
3. Building & Construction 266.5 306.6 347.7 394.7 456.0 1.3 1.3 1.4 1.2 1.2
4. Wholesale & Retail Trade 3,044.8 3,503.2 4,082.4 4,648.7 5,388.0 14.7 14.4 16.5 13.7 14.4
5. Services 2,502.8 2,785.7 3,106.8 3,436.2 3,846.4 12.1 11.5 12.5 10.1 10.3
(a) Transport 473.4 479.1 506.7 529.0 565.0 2.3 2.0 2.0 1.6 1.5
(b) Communication 243.6 249.9 256.0 262.6 293.7 1.2 1.0 1.0 0.8 0.8
(c) Utilities 45.8 52.7 62.1 70.3 80.7 0.2 0.2 0.3 0.2 0.2
(d) Hotel & Restaurant 72.8 86.1 99.0 113.8 130.8 0.4 0.4 0.4 0.3 0.4
(e) Finance & Insurance 340.9 392.0 444.2 507.8 574.3 1.7 1.6 1.8 1.5 1.5
(f) Real Estate & Business Services 925.6 1,064.4 1,213.0 1,348.2 1,515.3 4.5 4.4 4.9 4.0 4.1
(h) Producers of Govt. Services 193.4 223.4 255.4 292.7 333.1 0.9 0.9 1.0 0.9 0.9
(I) Comm., Social & Pers. Services 207.3 238.1 270.3 311.8 353.6 1.0 1.0 1.1 0.9 0.9
TOTAL (GDP) 20,657.3 24,296.3 24,794.2 33,984.8 37,303.4 100.0 100.0 100.0 100.0 100.0
NON-OIL (GDP) 13,124.3 15,198.6 17,376.1 19,479.0 22,027.7 63.5 62.6 70.1 57.3 59.1
TOTAL GDP GROWTH RATE (%) 11.3 17.6 2.0 37.1 9.8
Of which Agriculture (%) 13.8 18.1 15.1 12.2 12.4
Industry (%) 8.0 20.2 -17.0 88.3 5.5
Services (%) 16.8 11.3 11.5 10.6 11.9
Finance & Insurance (%) 14.9 15.0 13.3 14.3 13.1
Manufacturing (%) 8.9 12.4 4.6 5.0 8.0
Mining and Quarying (%) 15.3 15.1 12.2 12.6 14.6
Communication (%) 46.9 2.6 2.4 2.6 11.8
OIL GDP GROWTH RATE (%) 7.9 20.8 -18.5 95.5 5.3
NON-OIL GDP GROWTH RATE (%) 13.3 15.8 14.3 12.1 13.1
1/ Revised
2/ Provisional
Source: National Bureau of Statistics (NBS)
Table 33
Gross Domestic Product at Current Basic Prices
( Naira Billion, unless otherwise stated)
Activity Sector 2007 2008 2009 2010 /1 2011 /2Share in Total (%)
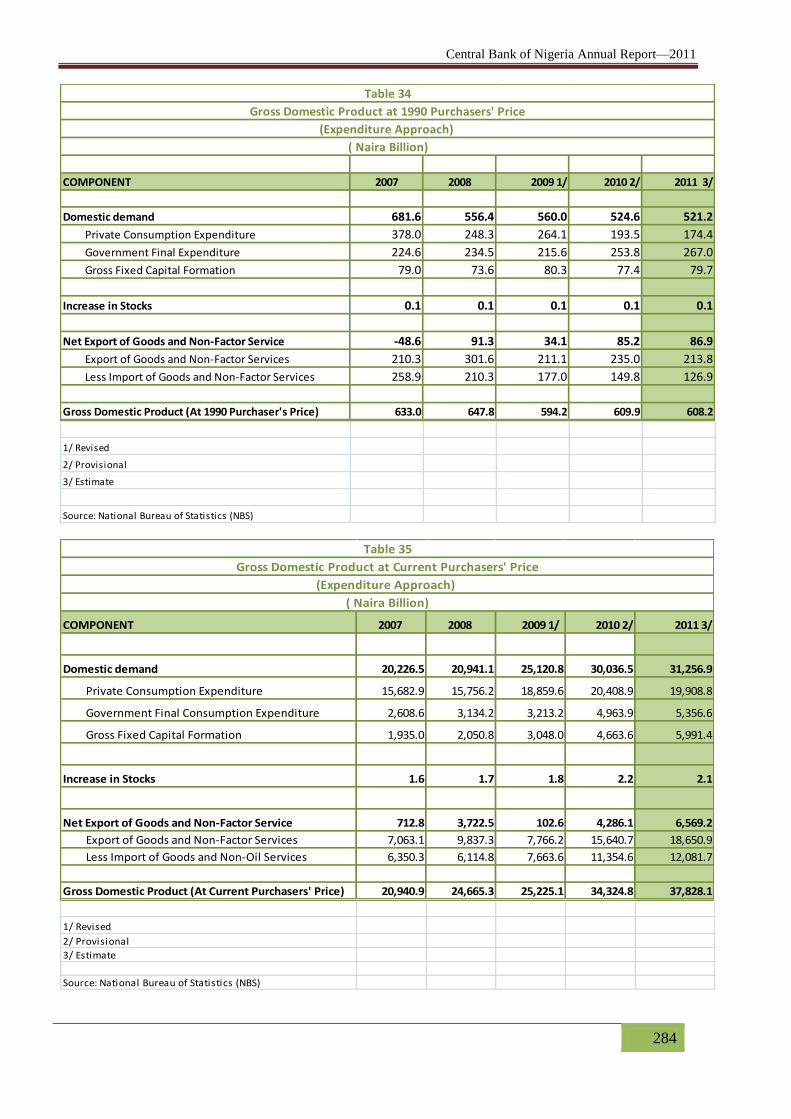
Central Bank of Nigeria Annual Report—2011
284
COMPONENT 2007 2008 2009 1/ 2010 2/ 2011 3/
Domestic demand 681.6 556.4 560.0 524.6 521.2
Private Consumption Expenditure 378.0 248.3 264.1 193.5 174.4
Government Final Expenditure 224.6 234.5 215.6 253.8 267.0
Gross Fixed Capital Formation 79.0 73.6 80.3 77.4 79.7
Increase in Stocks 0.1 0.1 0.1 0.1 0.1
Net Export of Goods and Non-Factor Service -48.6 91.3 34.1 85.2 86.9
Export of Goods and Non-Factor Services 210.3 301.6 211.1 235.0 213.8
Less Import of Goods and Non-Factor Services 258.9 210.3 177.0 149.8 126.9
Gross Domestic Product (At 1990 Purchaser's Price) 633.0 647.8 594.2 609.9 608.2
1/ Revised
2/ Provisional
3/ Estimate
Source: National Bureau of Statistics (NBS)
Table 34
Gross Domestic Product at 1990 Purchasers' Price
(Expenditure Approach)
( Naira Billion)
COMPONENT 2007 2008 2009 1/ 2010 2/ 2011 3/
Domestic demand 20,226.5 20,941.1 25,120.8 30,036.5 31,256.9
Private Consumption Expenditure 15,682.9 15,756.2 18,859.6 20,408.9 19,908.8
Government Final Consumption Expenditure 2,608.6 3,134.2 3,213.2 4,963.9 5,356.6
Gross Fixed Capital Formation 1,935.0 2,050.8 3,048.0 4,663.6 5,991.4
Increase in Stocks 1.6 1.7 1.8 2.2 2.1
Net Export of Goods and Non-Factor Service 712.8 3,722.5 102.6 4,286.1 6,569.2
Export of Goods and Non-Factor Services 7,063.1 9,837.3 7,766.2 15,640.7 18,650.9
Less Import of Goods and Non-Oil Services 6,350.3 6,114.8 7,663.6 11,354.6 12,081.7
Gross Domestic Product (At Current Purchasers' Price) 20,940.9 24,665.3 25,225.1 34,324.8 37,828.1
1/ Revised
2/ Provisional
3/ Estimate
Source: National Bureau of Statistics (NBS)
Table 35
Gross Domestic Product at Current Purchasers' Price
(Expenditure Approach)
( Naira Billion)

Central Bank of Nigeria Annual Report—2011
285
COMPONENT 2007 2008 2009 1/ 2010 2/ 2011 3/
1. Gross Domestic Product
(At Constant Market Prices) 633.0 647.8 594.2 609.9 608.2
LESS
Net Factor Income From Abroad -64.5 -51.7 -34.3 -34.6 -28.9
Other Current Transfers 66.7 67.9 73.0 44.2 37.1
2. Gross National Income 630.8 631.6 555.4 600.3 600.0
LESS
Consumption of Fixed Capital (Depreciation) 11.3 7.9 6.4 5.2 4.2
3. Net National Income (Market prices) 619.5 623.7 549.0 595.1 595.8
1/ Revised
2/ Provisional
3/ Estimate
Source: National Bureau of Statistics (NBS)
Table 36
National Income at Constant Market Prices
( Naira Billion)
Sub-Sector 2007 2008 2009 2010 /1 2011 /2
Crops 208.4 222.0 237.1 250.6 264.8
(a) Staples 229.5 245.9 268.2 283.4 299.5
(b) Other Crops 98.9 106.3 113.8 120.8 128.6
Livestock 279.7 299.0 319.4 340.0 361.9
Fishery 201.7 214.9 270.0 288.8 306.0
Forestry 138.4 147.4 155.5 163.0 172.6
Aggregate 212.8 226.7 242.1 255.9 270.6
/1 Revised
/2 Provisional
Source: Derived from data compiled by National Bureau of Statistics
Table 37
Index of Agricultural Production By Type of Activity
(1990 = 100)

Central Bank of Nigeria Annual Report—2011
286
2007 2008 2009 2010 /1 2011 /2 2007 2008 2009 2010 /1 2011/2
Crop Production 109,354.4 109,303.8 112,902.1 145,087.5 146,644.5 139,315.1 149,442.2 158,679.3 167,795.5 177,307.4
Staples 100,907.7 100,434.8 103,480.7 135,423.0 136,709.4 128,601.6 138,116.9 146,680.2 155,064.5 163,865.4
Maize 10,471.7 8,949.9 8,775.1 8,950.3 8,102.0 11,875.7 12,708.9 13,450.1 14,240.8 15,160.9
Millet 6,375.6 5,967.9 6,034.4 6,100.9 5,930.3 8,399.4 8,951.8 9,417.4 9,882.0 10,400.8
Guineacorn/Sorghum 10,105.2 9,545.9 9,680.3 9,352.2 9,139.7 11,892.6 12,600.7 13,316.7 13,849.6 14,599.6
Rice 3,878.7 3,235.0 3,143.6 33,124.2 32,756.6 4,522.9 4,852.5 5,213.9 5,420.2 5,690.2
Wheat 15.0 15.9 16.7 17.5 18.4 66.7 70.9 75.4 79.6 84.6
Acha 217.2 223.0 231.9 238.7 246.0 113.7 120.4 127.2 133.6 140.6
Beans/Cowpeas 10,331.0 10,679.7 11,123.9 11,504.5 11,900.9 5,128.2 5,497.6 5,793.0 6,146.0 6,546.0
Cassava Old 4,092.3 4,463.5 4,717.2 5,049.2 5,361.6 42,661.8 46,554.0 49,631.6 53,056.1 56,256.1
Potatoes 237.0 249.9 261.7 274.3 286.6 1,856.1 1,974.4 2,096.7 2,218.9 2,368.9
Yam 3,435.7 3,603.6 3,768.6 3,833.7 4,000.1 31,986.3 33,873.6 35,928.6 37,653.4 39,693.4
Cocoyam 50,350.8 51,983.0 54,125.5 55,268.1 57,155.4 2,857.0 3,067.0 3,304.0 3,455.9 3,585.9
Plantain 113.8 120.0 125.7 131.3 137.3 1,401.8 1,486.5 1,565.2 1,651.1 1,757.9
Vegetables 1,283.8 1,397.5 1,476.1 1,578.1 1,674.3 5,839.4 6,358.6 6,760.4 7,277.3 7,580.5
Other crops 8,446.7 8,869.0 9,421.5 9,664.6 9,935.1 10,713.5 11,325.3 11,999.1 12,731.0 13,563.0
Melon 395.1 405.6 421.6 437.7 450.9 574.4 608.4 640.2 673.8 740.5
Groundnnut/Peanut 3,501.8 3,576.5 3,712.5 3,807.7 3,913.0 4,036.2 4,256.0 4,489.2 4,728.5 4,999.4
Benniseed/Sesame 76.5 80.6 84.4 88.4 92.3 137.1 146.7 158.2 168.0 179.6
Soya Bean 2,596.9 2,647.2 2,746.4 2,813.0 2,887.8 1,728.5 1,826.5 1,928.6 2,090.1 2,270.7
Cotton 857.5 879.8 914.5 929.2 957.7 667.3 703.8 748.5 787.5 812.6
Oil Palm 80.6 87.3 92.1 108.2 114.0 233.1 254.0 272.1 294.6 323.1
Cocoa 1,091.5 1,106.0 1,145.5 1,165.0 1,192.0 240.2 253.6 272.0 289.9 314.1
Rubber 4.6 4.9 5.1 5.4 5.7 277.4 295.1 312.0 329.4 348.8
Sugarcane 140.7 148.2 155.2 162.5 169.7 2,601.2 2,750.8 2,932.4 3,106.9 3,292.6
Kolanut 115.5 118.0 122.5 124.7 128.2 87.8 92.7 99.4 107.1 115.8
Ginger 8.3 8.7 9.1 9.5 9.9 98.7 104.1 110.4 116.1 123.7
Cashew 5.7 5.9 6.2 6.4 6.6 23.2 24.5 26.5 28.5 30.6
Pinneaple 1.2 1.2 1.3 1.6 1.7 3.8 4.1 4.4 4.8 5.2
Palm Produce 4.5 4.8 5.0 5.3 5.6 4.6 4.9 5.3 5.7 6.1
Livestock Products 3,647.3 3,858.4 4,119.3 4,385.0 4,667.0
Poultry 122.9 129.4 139.3 166.5 175.1
Goat Meat 597.0 637.0 677.8 726.7 775.7
Mutton 556.3 587.9 625.4 663.6 709.6
Beef 275.8 298.8 317.0 345.3 375.3
Pork 73.1 76.7 81.3 84.8 89.2
Milk 1,390.2 1,468.9 1,567.0 1,648.8 1,744.8
Eggs 632.0 659.7 711.5 749.2 797.2
Fishery 635.2 668.7 709.7 759.2 804.2
(1) Artisanal Coastal and
Brackish Water Catches 262.7 274.5 291.9 305.0 315.5
(2) Artisanal Inland Rivers
and Lakes Catches 244.8 255.5 270.3 286.4 304.4
(3) Fish Farming 76.3 84.5 89.9 107.2 119.4
(4) Industrial (Trawling) Coastal
Fish & Shrimps 51.4 54.3 57.6 60.6 64.9
Forestry ('000 cu meteres) 145,593.1 148,747.6 157,449.4 165,085.6 174,809.0
Roundwood 143,072.1 146,169.8 154,709.8 161,886.2 170,981.6
Sawnwood 2,311.0 2,363.9 2,510.1 2,948.0 3,534.0
Wood Based Panels 181.7 184.7 198.4 215.0 248.0
Papers & Paperboards ('000MT) 28.3 29.2 31.1 36.4 45.4
1/ Revised
2/ Provisional
Source: National Bureau of Statistics
Table 38
Estimated Output of Major Agricultural Commodities
Item
Area Planted (Million) Production (Thousand Tonnes)

Central Bank of Nigeria Annual Report—2011
287
COMMODITY 2007 2008 2009 2010 2011
Cocoa 276.0 348.2 520.4 764.5 431.2
Coffee 282.7 284.0 207.3 218.9 377.2
Copra 123.0 173.7 154.6 169.1 502.9
Cotton 154.0 126.1 155.7 188.2 187.2
Palm Oil 223.9 337.6 381.5 501.3 335.6
Soya Beans 159.4 261.1 245.2 260.4 196.0
All Commodities 413.6 514.8 572.8 727.2 416.3
Source: Public Ledger and Financial Times (London)
Table 39
Indices of Average World Prices (C.I.F) of Nigeria's
Major Agricultural Export Commodities
( Dollar-based, 1990 = 100)

Central Bank of Nigeria Annual Report—2011
288
COMMODITY 2007 2008 2009 2010 2011
Cocoa 3,472.2 4,128.5 6,156.8 9,044.4 6,051.2
Coffee 3,312.2 3,196.2 2,333.2 2,463.9 7,244.5
Copra 2,105.3 2,591.6 2,280.6 2,445.2 9,583.7
Cotton 2,428.2 1,874.5 2,315.0 2,798.8 3,549.0
Palm Oil 1,189.2 1,720.8 1,946.6 2,557.8 7,255.0
Soya Bean 4,793.6 7,401.3 7,568.0 8,037.3 3,738.0
All Commodities 5,713.1 7,198.5 8,009.1 10,347.7 6,190.7
Table 40
Indices of Average World Prices (C.I.F) of Nigeria's Major Export Commodities
(Naira-based, 1990 = 100)
Source: Public Ledger and Financial Times (London)

Central Bank of Nigeria Annual Report—2011
289
COMMODITY 2007 2008 2009 2010 1/ 2011 2/
Benniseed 94,706.7 97,424.8 103,763.4 173,998.6 107,688.3
Cocoa 182,490.0 220,000.0 435,000.0 457,183.6 531,673.3
Coffee (Arabica) 172,003.6 181,665.2 193,795.4 205,355.8 204,279.9
Tea 308,406.7 335,546.5 390,854.7 432,859.9 427,383.9
Cotton 33,822.2 35,628.3 36,295.6 38,034.2 37,722.1
Groundnut (Unshelled) 26,281.6 26,903.4 27,499.5 28,110.6 28,112.8
Ginger (Peeled) 194,746.7 205,847.3 237,172.8 293,660.2 255,015.0
Palm Kernel 48,796.7 57,946.1 63,615.7 79,123.6 71,605.1
Palm Oil (Special) 161,358.2 179,398.0 194,530.0 257,727.2 211,600.5
Soya Beans 65,720.0 69,056.1 72,292.4 107,461.8 75,595.2
Rubber (100% Dry Lump top quality) 137,286.8 139,582.3 142,810.2 145,077.6 145,416.6
Cashew Nut 54,214.0 54,860.0 57,506.0 78,152.0 58,818.7
Wheat 67,136.7 68,768.1 75,064.1 129,310.5 78,250.4
1/ Revised
2/ Provisional
Sources: (i) CBN-NBS-NCC Socio-Economic Nationwide Survey
Table 41
Average Prices of Selected Cash Crops
(Naira Per Tonne)
(i i) Agricultural Projects Monitoring and Evaluation Unit (APMEU) Bulletin on prices
(i i i) NAERLS Bulletin on prices

Central Bank of Nigeria Annual Report—2011
290
Year/Quarter Manufacturing Mining Electricity Total (All Sectors)
2007 89.2 132.7 190.2 119.4
1st Quarter 89.4 132.0 189.7 120.3
2nd Quarter 89.6 132.2 190.3 120.1
3rd Quarter 89.0 133.1 190.1 119.5
4th Quarter 88.6 133.3 190.8 117.5
2008 91.2 129.6 198.2 117.8
1st Quarter 90.8 130.9 194.2 118.3
2nd Quarter 91.0 129.4 199.0 117.7
3rd Quarter 91.3 129.0 199.5 118.0
4th Quarter 91.7 129.0 200.0 117.2
2009 92.4 129.4 198.3 118.2
1st Quarter 91.6 127.2 198.0 116.9
2nd Quarter 92.3 129.5 195.9 118.1
3rd Quarter 92.8 130.5 199.3 118.9
4th Quarter 93.0 130.5 200.0 119.0
2010 1/ 94.2 131.7 200.7 122.1
1st Quarter 92.9 130.9 195.5 118.6
2nd Quarter 93.5 130.7 199.7 120.9
3rd Quarter 94.6 131.2 200.2 122.0
4th Quarter 96.0 134.0 207.3 126.9
2011 2/ 101.2 138.8 209.3 132.0
1st Quarter 94.3 132.9 206.4 125.7
2nd Quarter 98.3 136.0 208.5 129.5
3rd Quarter 102.0 140.5 210.4 134.1
4th Quarter 110.3 145.8 211.8 138.8
1/ Revised
2/ Provisional
Sources: Computed from data obtained from National Bureau of statistics (NBS), CBN Surveys,
NNPC, Federal Ministry of Power and Steel, and Ministry of Solid Minerals Development.
Table 42
Index of Industrial Production
(1990=100)

Central Bank of Nigeria Annual Report—2011
291
Year/Quarter
Sugar
Confectioner
Soft
Drinks
Beer,
Spirit &
Wine
Cotton
Textiles
Synthetic
Fabrics Foot Wear Paints
Refined
Petroleum Cement
Roofing
Sheets
Vehicle
Assembly
Soap &
Detergents
Elec &
Elect Appl Total
2007 51.3 53.0 131.7 79.8 46.3 96.5 187.1 129.9 113.5 39.2 64.9 138.0 27.8 89.2
1st Quarter 43.7 54.3 138.1 79.2 73.4 91.5 157.0 135.6 113.3 43.0 68.6 137.0 28.0 89.4
2nd Quarter 58.9 51.1 124.0 84.3 46.7 103.3 159.9 134.5 115.3 43.6 72.0 144.1 27.6 89.6
3rd Quarter 45.5 55.9 135.9 83.9 42.1 90.9 212.3 119.5 106.1 42.2 59.0 135.2 27.9 89.0
4th Quarter 57.0 50.8 128.9 72.0 23.0 100.4 219.3 130.0 119.1 28.2 60.2 135.5 27.9 88.6
2008 57.9 55.0 129.1 80.1 46.7 89.2 192.1 131.8 126.7 43.3 62.1 140.4 31.3 91.2
1st Quarter 54.3 54.3 127.1 79.2 70.7 90.3 169.9 130.6 124.0 40.8 68.8 140.9 29.9 90.8
2nd Quarter 56.9 55.9 128.9 84.3 50.3 89.2 180.2 131.8 126.5 44.6 60.4 144.1 30.2 91.0
3rd Quarter 56.1 56.9 129.7 83.9 42.1 89.0 200.8 131.9 127.3 44.9 59.0 135.2 30.3 91.3
4th Quarter 64.2 52.8 130.8 73.0 23.9 88.4 217.4 128.9 42.9 60.2 141.5 34.9 88.2
2009 65.3 57.2 131.0 69.2 41.4 88.1 200.1 128.8 138.1 48.0 58.5 141.4 34.5 92.4
1st Quarter 64.3 54.1 130.6 68.9 40.3 88.0 199.8 127.9 135.0 47.9 58.9 141.0 34.1 91.6
2nd Quarter 65.0 56.9 130.9 69.0 40.3 88.2 200.0 128.7 138.9 48.0 59.0 141.2 34.0 92.3
3rd Quarter 65.8 58.9 131.2 69.9 42.1 88.3 200.0 129.0 139.1 48.1 58.1 141.5 34.9 92.8
4th Quarter 66.0 59.1 131.4 68.9 43.0 88.0 200.8 129.7 139.3 48.1 58.0 142.0 35.1 93.0
2010 1/ 66.5 58.5 131.9 70.7 43.2 89.7 201.1 129.4 141.8 49.2 62.5 143.5 37.3 94.2
1st Quarter 65.8 55.6 131.2 68.9 42.7 88.6 199.9 128.8 139.8 48.6 58.9 142.3 36.9 92.9
2nd Quarter 66.0 57.0 130.9 69.8 43.0 89.8 200.9 128.7 140.9 48.8 60.6 142.7 37.0 93.5
3rd Quarter 66.5 58.9 131.2 71.2 43.2 90.0 201.8 129.0 142.6 49.1 64.8 143.9 37.3 94.6
4th Quarter 67.7 62.3 134.2 72.8 43.9 90.5 201.8 130.9 144.1 50.2 65.9 145.2 37.9 96.0
2011 2/ 69.9 67.4 140.0 73.5 45.1 95.1 206.1 128.5 167.0 57.9 69.8 151.2 44.2 101.2
1st Quarter 65.9 59.4 131.9 69.1 41.2 89.1 199.0 127.1 145.0 52.1 64.6 144.0 37.0 94.3
2nd Quarter 67.4 64.1 137.5 71.2 44.1 93.8 203.6 127.0 159.1 54.9 68.5 146.1 40.4 98.3
3rd Quarter 69.2 68.1 140.7 71.8 44.0 95.6 205.9 127.0 174.0 58.7 70.1 154.8 45.8 102.0
4th Quarter 77.0 77.9 149.9 81.9 51.0 101.9 216.0 132.9 190.0 65.8 76.0 160.1 53.7 110.3
1/ Revised
2/ Provisional
Source: Data Derived from NBS and CBN Surveys
Table 43
Index of Manufacturing Production
(Base Quarterly Average, 1990 = 100)

Central Bank of Nigeria Annual Report—2011
292
Solid Minerals 2007 2008 2009 2010 2011 Absolute Change
Between
Percentage Change
Between
1 2 3 4 5* 4&5 4&5
Baryte 18,046.6 926,419.0 514,313.9 470,899.0 525,376.8 54,477.8 11.6
Clay 233,932.5 108,499.6 153,676.4 139,298.6 155,468.7 16,170.0 11.6
Coal 27,310.0 38,512.1 40,612.1 45,713.1 39,213.4 -6,499.7 -14.2
Marble Aggregates 904,120.0 6,133.0 8,995.0 9,356.0 10,185.9 829.9 8.9
Sand 1,722,737.0 3,551,738.2 1,050,023.8 1,254,230.5 1,393,856.9 139,626.4 11.1
Stone Aggregates 2,923,642.0 3,583,215.6 3,762,376.4 3,672,796.0 4,074,350.9 401,554.9 10.9
Gold 582,868.0 2,890.0 1,350.0 2,518.0 2,787.7 269.7 10.7
Granite Aggregates 7,620,542.4 9,500,644.6 10,104,119.4 7,739,026.9 9,620,747.0 1,881,720.1 24.3
Lead/Zinc 581,509.0 2,267.0 1,867.0 2,400.0 2,680.5 280.5 11.7
Limestone 3,323,331.6 3,472,830.5 3,242,890.1 5,671,419.5 8,279,555.2 2,608,135.6 46.0
Iron Ore 57,900.0 61,779.3 99,424.2 62,799.6 69,692.8 6,893.2 11.0
Laterite 1,642,170.6 3,014,293.0 2,739,973.2 2,321,906.2 2,573,274.3 251,368.1 10.8
Shale 83,378.0 9,162,131.0 7,234,879.0 6,689,910.7 7,451,773.4 761,862.6 11.4
Cassiterite 229.0 27,853.0 58,986.0 79,409.0 85,775.8 6,366.8 8.0
Columbite 180.0 335,012.0 330,814.5 281,136.0 310,937.3 29,801.3 10.6
Other Minerals 15,897,342.2 10,004,291.4 15,437,675.0 19,810,898.5 19,014,203.9 -796,694.6 -4.0
Total 35,619,239.0 43,798,509.2 44,781,975.9 48,253,717.7 53,609,880.4
* Staff estimates
Source: Federal Ministry of Mines and Steel Development
Table 44
Production of Principal Solid Minerals
(Tonnes)

Central Bank of Nigeria Annual Report—2011
293
Type Weight 2007 /1 2008 /1 2009 /1 2010 /1 2011 /2
Coal 0.1 22,549.9 31,799.4 33,533.4 37,745.3 32,378.5
Percentage Share 0.1 0.1 0.2 0.2 0.2 0.2
Hydro - Power 0.9 3,113,567.2 3,669,824.5 3,675,254.5 3,582,840.0 3,305,962.9
Percentage Share 0.9 19.6 18.7 20.4 20.2 18.7
Natural Gas 0.0 1,740,535.1 1,854,259.7 1,066,913.7 1,691,261.5 1,582,246.4
Percentage Share 0.0 11.0 9.4 5.9 9.6 9.0
Petroleum Products 98.9 10,991,393.8 14,098,510.6 13,241,582.7 12,393,471.6 12,716,131.0
Percentage Share 98.9 69.3 71.7 73.5 70.0 72.1
Total 100.0 15,868,046.0 19,654,394.2 18,017,284.3 17,705,318.4 17,636,718.8
Percentage Share 100.0 100.0 100.0 100.0 100.0 100.0
Index of Energy Consumption(1990 = 100) 181.9 205.0 198.7 192.4 192.0
/1 Revised
/2 Provisional
Sources: Federal Ministry of Solid Mineral Development; Federal Ministry of Power & Steel, NNPC & PHCN
Table 45
Energy Consumption
(Tonnes of Coal Equivalent (TCE))
(1990 = 100)
Product 2007 2008 2009 /1 2010 /1 2011 /2
Liquefied Petroluem Gas or Cooking Gas 6,202.7 12,534.8 32,312.3 24,712.4 31,841.6
Premium Motor Spirit (PMS- Gasoline) 8,859,802.0 9,500,382.4 9,775,364.6 14,382,875.3 17,057,151.8
Dual Purpose Kerosine (DPK) 878,571.5 2,029,679.1 1,502,425.2 3,164,538.3 2,015,819.2
Automotive Gas Oil (AGO) and Diesel 1,384,956.4 1,517,521.3 1,130,444.6 3,293,401.7 2,865,205.3
Low Pour Fuel Oil (LPFO) 132,714.1 401,495.6 186,386.5 272,699.1 319,607.8
Bitumen/Asphalt 24,306.8 67,689.2 36,063.2 11,356.6 64.8
Others (Wax, Petroleum Jelly, Grease, Base Oil etc)140,158.8 185,132.7 107,275.5 61,243.3 51,432.9
Total 11,426,712.3 13,714,434.9 12,770,271.9 21,210,826.8 22,341,123.4
1/ Revised
2/ Provisional
Sources: Nigerian National Petroleum Corporation
Table 46
Consumption of Petroluem Products
(Tonnes)

Central Bank of Nigeria Annual Report—2011
294
Refined Products 2009 2010 2011
LPG 28,776.0 86,328.0 119,242.0
PMS 432,429.0 1,126,528.0 1,303,736.0
DPK 338,630.0 668,550.0 760,918.0
AGO 528,817.0 1,026,134.0 1,087,678.0
Fuel Oil 685,749.0 1,228,540.0 1,389,226.0
Asphalt 25,292.0 33,440.0
Fuel & Losses 222,110.0 337,776.0 153,561.0
Total 2,236,511.0 4,499,148.0 4,847,801.0
Source: Warri-RPC, Kaduna-RPC, Port-Harcourt Refining Company
RPC - Refining Petrochemical Company
Table 47
Contribution from Local Refineries (MT)
2007 2008 2009 2010 2011 /1
1 2 3 4 5
Gas Produced 2,415,649,040.7 2,282,440,394.6 1,837,278,307.3 2,392,838,898.9 1,945,814,102.0
Gas Used as Fuel 76,524,011.4 80,403,045.3 80,573,879.7 72,233,896.7 60,133,695.6
Gas Sold to Industries 770,164,987.0 766,420,825.3 470,050,282.1 883,612,846.0 680,510,740.5
Gas Sold to LNG 368,626,236.3 331,569,374.2 269,095,955.8 167,190,149.0 104,030,221.7
Gas Reinjected 354,610,374.4 391,075,575.0 409,848,717.6 493,309,826.1 350,209,825.1
Gas Lifted 51,053,728.0 58,560,235.3 55,956,115.8 169,057,005.2 155,055,002.1
Gas Converted to NGLs 34,980,978.0 23,222,765.0 42,401,451.0 25,866,822.0 23,756,722.0
Total Gas Utilised 1,655,960,315.1 1,651,251,820.1 1,327,926,401.9 1,811,270,545.0 1,373,696,207.0
Gas Utilised as % of Gas Produced 68.6 72.3 72.3 75.7 70.6
Gas Flared 789,546,171.8 631,188,574.5 509,351,905.4 581,568,353.9 572,117,895.0
Gas Flared as % of Gas Produced 32.7 27.7 27.7 24.3 29.4
1/ Provisional
Source: NNPC, DPR, CBN Estimates
Table 48
Gas Production, Utilisation and Disposal (mscf)

Central Bank of Nigeria Annual Report—2011
295
2007 2008 2009 2010 2011
1 2 3 4 5 (1)&(2) (2)&(3) (3)&(4) (4)&(5) (1)&(2) (2)&(3) (3)&(4) (4)&(5)
Supply
OPEC 36.2 37.1 33.4 33.9 35.1 0.9 -3.7 0.5 1.2 2.4 -10.0 1.6 3.4
Crudes 31.8 32.1 28.7 29.1 29.8 0.3 -3.4 0.4 0.7 0.9 -10.6 1.5 2.3
NGLs and condensates 4.4 5.0 4.7 4.8 5.3 0.6 -0.3 0.1 0.5 13.6 -6.0 2.1 10.2
TOTAL NON -OPEC 49.6 49.5 51.3 52.3 52.4 0.0 1.8 1.0 0.1 -0.1 3.6 1.9 0.3
Total World Supply 85.8 86.6 84.7 86.2 87.5 0.8 -1.9 1.5 1.3 1.0 -2.2 1.8 1.5
Demand
OECD 49.2 47.5 45.5 46.0 45.9 -1.7 -2.0 0.5 -0.1 -3.5 -4.2 1.1 -0.3
NON - OECD 36.6 38.3 39.4 40.2 42.0 1.7 1.1 0.8 1.8 4.6 2.9 2.0 4.4
Total World Demand 85.8 85.8 84.9 86.2 87.8 0.0 -0.9 1.3 1.7 0.0 -1.0 1.5 1.9
Nigeria
Output 2.2 2.0 1.8 2.1 2.2 -0.2 -0.2 0.3 0.0 -7.9 -8.1 17.0 1.9
Exports 1.7 1.5 1.4 1.7 1.7 -0.2 -0.2 0.3 0.0 -10.0 -10.5 22.6 2.4
Domestic Consumption 0.5 0.5 0.5 0.5 0.5 0.0 0.0 0.0 0.0 0.0 0.0 0.0 0.0
Source: OPEC, Reuters
Table 49
World Crude Oil Production and Consumption
(Million Barrels Per Day)
ABSOLUTE CHANGE BETWEEN PERCENTAGE CHANGE BETWEEN

Central Bank of Nigeria Annual Report—2011
296
Crude Type 2007 2008 2009 2010 2011
1 2 3 4 5 (1)&(2) (2)&(3) (3)&(4) (4)&(5) (1)&(2) (2)&(3) (3)&(4) (4)&(5)
Bonny Light 75.0 101.2 62.1 80.8 113.8 26.2 -39.1 18.7 33.0 34.9 -38.6 30.2 40.8
UK Brent 72.7 98.5 62.7 79.7 111.9 25.8 -35.8 17.0 32.2 35.4 -36.3 27.1 40.3West Texas
Intermediate(WTI) 72.1 100.8 63.5 79.1 94.7 28.6 -37.2 15.6 15.6 39.7 -37.0 24.6 19.7
Forcados 74.7 101.5 64.2 80.9 114.5 26.8 -37.3 16.7 33.6 35.9 -36.7 25.9 41.6
OPEC Basket 69.0 94.5 61.1 77.5 107.5 25.4 -33.4 16.4 30.0 36.8 -35.4 26.8 38.7
Source: Reuters
Table 50
Analysis of Average Spot Prices of Selected Crudes Traded at the International Oil Market
(US Dollar Per Barrel)
Absolute Change Between Percentage Change Between
2007 2008 2009 2010 2011
1 2 3 4 5 (1) & (2) (2) & (3) (3) & (4) (4) & (5)
All- Item 77.9 89.7 102.2 114.2 126.0 15.1 13.9 11.8 10.3
All- Item Less Farm Produce 82.6 91.2 101.5 112.6 124.8 10.4 11.2 10.9 10.8
All- Item Less Farm Produce & Energy 79.6 91.7 101.9 112.5 123.6 15.3 11.1 10.4 9.9
Imported Food 101.49 115.4 125.3 13.7 8.6
Food 75.1 88.6 102.4 115.4 128.1 18.0 15.5 12.7 11.0
Food & Non-Alcoholic Beverages 75.4 88.7 102.7 115.5 127.8 17.6 15.8 12.5 10.6
Alcoholic Beverage, Tobacco & Kola 94.4 97.5 101.9 111.9 119.0 3.3 4.5 9.8 5.5
Clothing & Footwear 86.5 96.9 101.5 113.7 122.3 12.1 4.7 12.0 7.6
Housing, Water, Electricity, Gas & other Fuel 83.6 93.5 100.2 113.2 131.9 11.7 7.2 12.9 16.5
Furnishing & household Equipment Maintenance 77.8 87.1 101.7 113.2 119.9 11.9 16.8 11.3 5.9
Health 84.3 96.1 101.8 112.7 122.8 14.0 6.0 10.7 9.0
Transport 89.8 90.9 101.8 112.9 128.7 1.2 12.0 10.9 14.0
Communication 94.6 97.1 100.0 102.4 106.5 2.6 3.0 2.4 4.0
Recreation & Culture 86.4 93.5 101.9 107.8 113.3 8.3 8.9 5.8 5.1
Education 74.2 87.6 101.5 109.1 114.6 18.1 15.9 7.5 5.0
Restaurant & Hotels 79.5 99.5 102.6 109.6 118.9 25.3 3.1 6.8 8.5
Miscellaneous goods & Services 80.8 92.9 101.7 112.1 122.7 15.0 9.5 10.2 9.5
CPI, End-December 77.9 89.7 102.2 114.2 126.0
Source: National Bureau of Statistics (NBS)
Note: Imported Food component was introduced in 2009.
Table 51
Composite Consumer Price Index
(November 2009 = 100)
percentage change between

Central Bank of Nigeria Annual Report—2011
297
2007 2008 2009 2010 2011
1 2 3 4 5 (1) & (2) (2) & (3) (3) & (4) (4) & (5)
All- Item 83.3 92.8 101.4 112.2 122.3 11.4 9.3 10.7 9.0
All- Item Less Farm Produce 90.7 97.8 101.3 111.2 122.0 7.8 3.6 9.8 9.7
All- Item Less Farm Produce & Energy 89.9 97.9 101.8 111.0 119.6 8.8 4.0 9.1 7.7
Imported Food 100.54 113.5 121.1 12.9 6.7
Food 78.9 89.6 101.6 113.4 124.5 13.6 13.4 11.6 9.8
Food & Non-Alcoholic Beverages 79.0 89.7 101.7 113.4 123.8 13.6 13.4 11.5 9.2
Alcoholic Beverage, Tobacco & Kola 101.2 97.5 99.9 109.7 115.2 -3.6 2.5 9.8 5.0
Clothing & Footwear 94.0 98.5 100.9 113.8 120.2 4.8 2.4 12.8 5.6
Housing, Water, Electricity, Gas & other Fuel 88.3 98.8 101.4 111.8 128.0 11.8 2.7 10.2 14.5
Furnishing & household Equipment Maintenance 89.9 96.2 100.8 111.5 119.2 7.0 4.8 10.6 6.9
Health 91.2 95.9 101.6 112.9 122.1 5.1 5.9 11.2 8.1
Transport 98.6 93.9 102.0 111.7 128.2 -4.8 8.6 9.5 14.8
Communication 101.4 99.3 99.2 100.8 104.6 -2.1 -0.1 1.6 3.8
Recreation & Culture 98.4 98.6 104.2 109.2 107.9 0.2 5.7 4.8 -1.2
Education 86.2 90.9 100.7 109.3 114.6 5.5 10.8 8.5 4.8
Restaurant & Hotels 91.0 102.7 103.2 111.3 121.1 12.8 0.5 7.8 8.8
Miscellaneous goods & Services 87.6 93.7 101.6 112.7 117.4 7.0 8.3 11.0 4.2
CPI, End-December 83.3 92.8 101.4 112.2 122.3
Source: National Bureau of Statistics (NBS)
Table 52
Urban Consumer Price Index
(November 2009 = 100)
Percentage change between
2007 2008 2009 2010 2011
1 2 3 4 5 (1) & (2) (2) & (3) (3) & (4) (4) & (5)
All- Item 75.4 88.2 102.8 115.9 129.0 17.0 16.6 12.8 11.3
All- Item Less Farm Produce 78.8 88.1 101.7 113.8 127.1 11.8 15.4 11.9 11.7
All- Item Less Farm Produce & Energy 74.5 88.7 102.1 113.7 127.0 19.1 15.1 11.4 11.7
Imported Food 102.3 117.0 128.8 14.4 10.1
Food 73.8 88.3 103.1 117.1 131.1 19.6 16.7 13.6 12.0
Food & Non-Alcoholic Beverages 74.2 88.3 103.5 117.2 131.1 19.1 17.2 13.2 11.9
Alcoholic Beverage, Tobacco & Kola 85.8 97.5 103.5 113.7 122.2 13.5 6.2 9.9 7.5
Clothing & Footwear 78.4 95.2 102.0 113.6 124.1 21.5 7.1 11.3 9.2
Housing, Water, Electricity, Gas & other Fuel 77.8 86.8 99.2 114.3 135.1 11.6 14.3 15.2 18.2
Furnishing & household Equipment Maintenance 70.3 81.4 102.4 114.7 120.6 15.8 25.7 12.0 5.1
Health 78.2 96.2 102.0 112.6 123.4 23.0 6.1 10.4 9.6
Transport 75.0 85.8 101.6 114.0 129.2 14.5 18.4 12.2 13.3
Communication 88.9 95.3 100.6 103.6 108.1 7.2 5.6 3.0 4.3
Recreation & Culture 79.1 90.5 99.9 106.6 117.9 14.4 10.4 6.7 10.6
Education 62.7 84.4 102.1 109.0 114.6 34.5 21.0 6.7 5.1
Restaurant & Hotels 72.8 97.7 102.0 108.2 117.0 34.2 4.4 6.0 8.1
Miscellaneous goods & Services 74.9 92.2 101.9 111.5 127.1 23.0 10.5 9.4 14.0
CPI, End-December 75.4 88.2 102.8 115.9 129.0
Source: National Bureau of Statistics (NBS)
Table 53
Rural Consumer Price Index
(November 2009 = 100)
Percentage change between

Central Bank of Nigeria Annual Report—2011
298
2007 2008 2009 2010 /1 2011 /2
CURRENT ACCOUNT 27,880.53 29,296.30 13,973.99 13,420.38 8,760.77
Goods 38,072.15 46,176.46 25,621.96 30,612.31 31,105.59
Credit 66,605.95 86,273.49 56,741.94 77,372.78 93,266.98
Debit (28,533.80) (40,097.03) (31,119.98) (46,760.47) (62,161.39)
Exports fob 66,605.95 86,273.49 56,741.94 77,372.78 93,266.98
Crude oil & gas 65,008.82 84,169.28 54,778.52 74,703.67 90,086.90
Crude oil 58,164.51 74,304.54 49,714.31 68,149.42 83,060.97
Gas 6,844.31 9,864.74 5,064.22 6,554.25 7,025.93
Non-oil 1,597.13 2,104.21 1,963.42 2,669.10 3,180.08
Imports fob (28,533.80) (40,097.03) (31,119.98) (46,760.47) (62,161.39)
Crude oil & gas/3 (5,603.45) (10,714.04) (6,910.77) (11,218.26) (19,349.55)
Non-oil (18,434.04) (29,382.99) (24,209.21) (35,542.20) (42,811.85)
Trading Partner Adjustment (4,496.31) - - - -
Services(net) (17,047.23) (22,253.37) (16,661.29) (18,472.20) (21,361.20)
Credit 1,455.26 2,278.12 2,242.42 3,117.70 3,414.81
Debit (18,502.49) (24,531.49) (18,903.71) (21,589.90) (24,776.01)
Transportation(net) (4,188.29) (5,695.93) (5,048.42) (6,601.58) (6,521.29)
Credit 836.68 1,216.81 1,110.41 1,993.58 1,600.67
Debit (5,024.97) (6,912.74) (6,158.83) (8,595.16) (8,121.96)
Of which: Passenger (958.82) (845.67) (1,046.65) (2,646.46) (2,893.43)
Credit 125.07 391.98 190.86 168.70 66.00
Debit (1,083.89) (1,237.65) (1,237.51) (2,815.16) (2,959.43)
Of which: Freight (3,478.76) (5,163.60) (4,185.53) (4,166.73) (3,820.04)
Credit 378.58 418.45 573.19 1,438.50 1,057.95
Debit (3,857.34) (5,582.05) (4,758.72) (5,605.23) (4,877.99)
Of which: Other 249.29 313.34 183.75 211.61 192.18
Credit 333.03 406.38 346.36 386.38 476.72
Debit (83.74) (93.04) (162.61) (174.77) (284.54)
Travel (5,421.84) (9,268.24) (4,459.14) (5,057.60) (6,025.08)
Credit 215.14 572.57 608.44 575.94 628.40
Debit (5,636.98) (9,840.81) (5,067.58) (5,633.54) (6,653.48)
Business travel (558.59) (933.92) (734.97) (764.41) (1,111.06)
Credit - - - - -
Debit (558.59) (933.92) (734.97) (764.41) (1,111.06)
Personal travel (4,863.25) (8,334.32) (3,724.17) (4,293.19) (4,914.02)
Credit 215.14 572.57 608.44 575.94 628.40
Debit (5,078.39) (8,906.89) (4,332.61) (4,869.13) (5,542.42)
Education related expenditure (2,545.99) (4,759.92) (2,192.70) (2,415.48) (2,694.31)
Credit - - - - -
Debit (2,545.99) (4,759.92) (2,192.70) (2,415.48) (2,694.31)
Health related expenditure (1,076.71) (1,804.74) (892.12) (1,008.99) (1,110.91)
Credit - - - - -
Debit (1,076.71) (1,804.74) (892.12) (1,008.99) (1,110.91)
Other Personal Travels (1,240.55) (1,769.66) (639.35) (868.72) (1,108.80)
Credit 215.14 572.57 608.44 575.94 628.40
Debit (1,455.69) (2,342.23) (1,247.79) (1,444.66) (1,737.20)
Insurance services (206.89) (1,020.00) (395.23) (506.53) (707.64)
Credit 4.58 0.37 0.77 1.02 1.66
Debit (211.47) (1,020.37) (396.00) (507.55) (709.30)
Communication services (185.37) (205.97) (309.96) (239.95) (180.94)
Credit 27.00 30.00 37.00 48.00 50.40
Debit (212.37) (235.97) (346.96) (287.95) (231.34)
Construction services (60.78) (67.53) (43.91) (130.51) (89.43)
Credit - - - - -
Debit (60.78) (67.53) (43.91) (130.51) (89.43)
Financial services 4.66 (17.00) (41.83) (20.14) (304.24)
Credit 13.50 15.00 8.17 13.99 16.11
Debit (8.84) (32.00) (50.00) (34.13) (320.36)
Computer & information services (201.22) (223.58) (188.20) (125.23) (166.28)
Credit - - - - -
Debit (201.22) (223.58) (188.20) (125.23) (166.28)
Royalties and license fees (174.14) (191.55) (210.72) (226.09) (214.98)
Credit - - - - -
Debit (174.14) (191.55) (210.72) (226.09) (214.98)
Other business services (4,145.13) (4,184.58) (4,181.84) (4,496.03) (6,034.85)
Credit 10.00 10.50 14.38 18.45 36.03
Debit (4,155.13) (4,195.08) (4,196.22) (4,514.48) (6,070.88)
Operational leasing services (824.58) (1,008.81) (1,197.82) (1,123.39) (1,884.37)
Credit - - - - -
Debit (824.58) (1,008.81) (1,197.82) (1,123.39) (1,884.37)
Misc. business, professional, and technical services (3,320.55) (3,175.77) (2,984.02) (3,372.64) (4,150.47)
Credit 10.00 10.50 14.38 18.45 36.03
Debit (3,330.55) (3,186.27) (2,998.40) (3,391.09) (4,186.51)
Table 54
Balance of Payments (US$' Million)
(US$' Million)

Central Bank of Nigeria Annual Report—2011
299
Personal, cultural & recreational services (0.39) (0.44) (11.48) (53.08) (79.74)
Credit - - - - -
Debit (0.39) (0.44) (11.48) (53.08) (79.74)
Government Services (2,467.84) (1,378.56) (1,770.55) (1,015.45) (1,036.73)
Credit 348.36 432.86 463.26 466.73 1,081.54
Debit (2,816.20) (1,811.42) (2,233.81) (1,482.18) (2,118.27)
Income(net) (11,848.37) (15,154.63) (14,562.85) (19,674.59) (22,972.33)
Credit 2,585.73 2,366.78 945.63 1,009.79 905.02
Debit (14,434.10) (17,521.41) (15,508.48) (20,684.38) (23,877.35)
Compensation of employees 191.83 92.58 120.79 149.57 138.33
Credit 219.83 127.84 139.63 168.59 181.96
Debit (28.00) (35.26) (18.84) (19.01) (43.63)
Investment income (12,040.20) (15,247.20) (14,683.64) (19,824.17) (23,110.66)
Credit 2,365.90 2,238.95 806.00 841.20 723.06
Debit (14,406.10) (17,486.15) (15,489.64) (20,665.37) (23,833.72)
Direct investment (13,146.33) (17,035.65) (15,101.83) (20,054.84) (22,982.82)
Credit 21.97 72.59 106.20 143.81 279.81
Debit (13,168.30) (17,108.25) (15,208.03) (20,198.65) (23,262.63)
Income on equity (13,072.33) (16,955.38) (15,079.33) (20,015.61) (22,937.03)
Credit 20.97 70.79 104.20 141.06 277.26
Debit (13,093.30) (17,026.18) (15,183.53) (20,156.67) (23,214.29)
Dividends and distributed branch profits (10,967.30) (13,736.93) (11,912.11) (17,189.39) (20,049.98)
Credit 14.00 62.93 92.62 128.23 252.06
Debit (10,981.30) (13,799.86) (12,004.73) (17,317.63) (20,302.04)
Reinvested earnings and undistributed branch profit (2,105.03) (3,218.45) (3,167.22) (2,826.22) (2,887.04)
Credit 6.97 7.87 11.58 12.82 25.21
Debit (2,112.00) (3,226.32) (3,178.80) (2,839.04) (2,912.25)
Income on Direct Investment Loans (interest) (74.00) (80.27) (22.50) (39.23) (45.79)
Credit 1.00 1.80 2.00 2.75 2.55
Debit (75.00) (82.07) (24.50) (41.98) (48.34)
Portfolio investment (536.08) (207.15) (141.73) (323.87) (402.16)
Credit 53.36 73.67 18.85 19.89 18.47
Debit (589.44) (280.82) (160.58) (343.76) (420.63)
Other investment 1,642.21 1,995.60 559.92 554.55 274.32
Income on debt (interest) 1,642.21 1,995.60 559.92 554.55 274.32
Credit 2,290.57 2,092.69 680.95 677.51 424.78
Debit (648.36) (97.09) (121.03) (122.96) (150.46)
Current transfers(net) 18,703.98 20,527.83 19,576.16 20,954.87 21,988.71
Credit 18,855.34 21,061.93 20,044.95 21,438.62 22,464.53
Debit (151.36) (534.09) (468.79) (483.76) (475.83)
General government 784.05 1,740.56 1,489.83 1,448.28 1,730.30
Credit /4 867.68 1,859.82 1,608.61 1,618.45 1,848.16
Debit (83.63) (119.26) (118.78) (170.17) (117.86)
Other sectors 17,919.93 18,787.27 18,086.33 19,506.59 20,258.40
Credit 17,987.66 19,202.11 18,436.34 19,820.17 20,616.37
Debit (67.73) (414.83) (350.01) (313.59) (357.97)
Workers' remittances 17,919.48 19,176.72 18,403.29 19,785.37 20,574.47
Credit 17,945.94 19,200.00 18,432.00 19,814.40 20,606.98
Debit (26.46) (23.28) (28.71) (29.04) (32.51)
Other Transfers 0.45 (389.45) (316.96) (278.78) (316.06)
Credit 41.72 2.11 4.34 5.77 9.40
Debit (41.27) (391.55) (321.30) (284.55) (325.46)
CAPITAL AND FINANCIAL ACCOUNT (13,357.85) (8,424.70) 12,647.50 2,057.57 (5,448.69)
Capital account(net) - - - - -
Credit - - - - -
Debit - - - - -
Capital transfers - - - - -
Credit - - - - -
General Government - - - - -
Debt Forgiveness - - - - -
Other Sector - - - - -
Debit - - - - -
Acquisition/disposal of nonproduced, nonfin assets - - - - -
Credit
Debit
Financial account(net) (13,357.85) (8,424.70) 12,647.50 2,057.57 (5,448.69)
Assets (25,110.30) (18,316.10) 1,685.38 (5,621.11) (20,292.63)
Direct investment (Abroad) (874.97) (1,058.27) (1,542.02) (922.72) (823.58)
Equity capital (868.00) (1,050.40) (1,530.44) (909.90) (798.37)
Claims on direct investment enterprises (868.00) (1,050.40) (1,530.44) (909.90) (798.37)
Liabilities to direct investors
Reinvested earnings (6.97) (7.87) (11.58) (12.82) (25.21)
Other capital - - - - -
Claims on direct investment enterprises
Liabilities to direct investors
Table 54 cont.
Balance of Payments (US$' Million)
(US$' Million)

Central Bank of Nigeria Annual Report—2011
300
Portfolio investment (1,859.11) (4,758.77) (830.77) (1,130.24) (1,622.92)
Equity securities (1,720.69) (4,066.69) (761.54) (1,036.06) (1,487.67)
Debt securities (138.42) (692.08) (69.23) (94.19) (135.24)
Long-term
Short-term (138.42) (692.08) (69.23) (94.19) (135.24)
Other investment (13,341.17) (10,831.86) (6,559.70) (13,611.38) (17,537.69)
Trade credits (7,222.99) (2,855.39) (6,726.67) (7,383.49) (7,146.37)
Loans (116.77) (291.92) (382.61) (227.47) (199.59)
Currency and deposits (6,001.41) (7,684.54) 549.58 (6,000.42) (10,191.72)
Monetary authorities
General government (1,273.84) (2,084.50) (2,304.64) (724.09) (1,429.53)
Banks (2,915.00) (3,477.57) 2,905.96 (143.21) (2,152.70)
Other sectors (1,812.57) (2,122.47) (51.74) (5,133.12) (6,609.49)
Other Assets
Reserve assets (9,035.05) (1,667.21) 10,617.87 10,043.24 (308.44)
Monetary Gold
SDRs (2,410.74)
Reserve Positions in the Fund
Foreign exchange (9,035.05) (1,667.21) 13,028.61 10,043.24 (308.44)
Other Claims
Liabilities 11,752.45 9,891.40 10,962.12 7,678.68 14,843.94
Direct Invesment in reporting economy 6,086.73 8,248.64 8,649.53 6,098.96 8,914.89
Equity capital 3,936.70 4,958.71 5,450.02 3,199.32 5,748.21
Claims on direct investors
Liabilities to direct investors 3,936.70 4,958.71 5,450.02 3,199.32 5,748.21
Reinvested earnings 2,112.00 3,226.32 3,178.80 2,839.04 2,912.25
Other capital 38.03 63.61 20.71 60.60 254.43
Claims on direct investors
Liabilities to direct investors 38.03 63.61 20.71 60.60 254.43
Portfolio Investment 2,665.50 1,334.30 481.69 3,747.90 5,192.80
Equity securities 1,459.49 (959.80) 492.67 2,179.28 2,592.28
Debt securities 1,206.01 2,294.10 (10.98) 1,568.62 2,600.52
Long-term 1,058.09 1,357.19 (92.10) 684.91 1,845.44
Short-term 147.92 936.91 81.12 883.71 755.08
Other investment liabilities 3,000.22 308.46 1,830.91 (2,168.19) 736.25
Trade credits - - - - -
Short-term - - - - -
Long-term - - - - -
Loans 2,150.22 582.14 (166.44) (1,942.90) (637.57)
General government (513.00) (26.00) 199.92 722.13 1,006.81
Long-term (513.00) (26.00) 199.92 722.13 1,006.81
Drawings 425.00 361.00 532.83 975.11 1,238.92
Repayments (938.00) (387.00) (332.91) (252.98) (232.11)
short-term
Monetary authorities
Banks 1,384.25 (224.41) (341.76) (93.18) 687.03
Other sectors 1,278.97 832.55 (24.60) (2,571.85) (2,331.41)
Long-term 1,278.97 832.55 (24.60) (2,571.85) (2,331.41)
Short-term - - - - -
Currency & Deposits 850.00 (273.68) (413.40) (225.29) 1,373.82
Monetary Authority - - - -
Banks 850.00 (273.68) (413.40) (225.29) 1,373.82
Other Liabilities -monetary authority SDR allocation 2,410.74 - -
NET ERRORS AND OMISSIONS (14,522.68) (20,871.60) (26,621.49) (15,477.95) (3,312.08)
Memorandum Items:
Current Account Balance as % of G.D.P 16.84 14.20 8.30 5.86 3.58
Capital and Financial Account Balance as % of G.D.P (8.07) (4.08) 7.51 0.90 (2.23)
Overall Balance as % of G.D.P 5.46 0.81 (6.31) (4.39) 0.13
External Reserves - Stock (US $ million) 51,333.15 53,000.36 42,382.49 32,339.25 32,639.78
Number of Months of Imports Equivalent 21.59 15.86 16.34 7.92 6.30
External Debt Stock (US$ million) 3,654.00 3,720.00 3,947.30 4,578.77 5,666.58
Debt Service Due as % of Exports of Goods and Non Factor Services - - - - -
Effective Central Exchange Rate (N/$) 124.76 117.78 147.27 148.51 152.59
Average Exchange Rate (N/$) 125.83 118.53 148.90 149.74 153.85
End-Period Exchange Rate (N/$) 117.97 132.56 149.58 150.66 158.27
/1 Revised
/2 Provisional
Source: Central Bank of Nigeria
Balance of Payments (US$' Million)
(US$' Million)
/3 Covers data on import of PMS under the Petroleum Support Fund Scheme from the PPPRA, import of PMS data from the NNPC as well as data
/4 The series on transfers to Government (credit) were revised using data on Official Development Assistance from the National Planning
Table 54 cont.

Central Bank of Nigeria Annual Report—2011
301
2007 2008 2009 2010 /1 2011 /2
CURRENT ACCOUNT 3,478,374.82 3,450,585.67 2,057,949.33 1,993,003.13 1,336,791.68
Goods 4,749,881.43 5,438,769.73 3,773,346.41 4,546,102.41 4,746,349.32
Credit 8,309,758.32 10,161,490.11 8,356,385.57 11,490,298.39 14,231,450.63
Debit (3,559,876.89) (4,722,720.38) (4,583,039.17) (6,944,195.99) (9,485,101.30)
Exports fob 8,309,758.32 10,161,490.11 8,356,385.57 11,490,298.39 14,231,450.63
Crude oil & gas 8,110,500.38 9,913,651.13 8,067,233.00 11,093,921.24 13,746,207.09
Crude oil 7,256,604.27 8,751,759.36 7,321,425.82 10,120,577.75 12,674,132.38
Gas 853,896.12 1,161,891.77 745,807.19 973,343.48 1,072,074.71
Non-oil 199,257.94 247,838.99 289,152.57 396,377.16 485,243.54
Imports fob (3,559,876.89) (4,722,720.38) (4,583,039.17) (6,944,195.99) (9,485,101.30)
Crude oil & gas/3 (699,086.42) (1,261,924.24) (1,017,748.81) (1,665,976.13) (2,952,514.62)
Non-oil (2,299,830.83) (3,460,796.14) (3,565,290.36) (5,278,219.85) (6,532,586.68)
Trading Partner Adjustment (560,959.64) - - - -
Services(net) (2,126,812.51) (2,621,053.04) (2,453,707.60) (2,743,227.07) (3,259,468.68)
Credit 181,558.24 268,321.83 330,241.49 462,996.66 521,060.52
Debit (2,308,370.75) (2,889,374.87) (2,783,949.09) (3,206,223.73) (3,780,529.20)
Transportation(net) (522,531.06) (670,879.62) (743,480.57) (980,372.87) (995,072.77)
Credit 104,384.20 143,318.68 163,530.08 296,057.57 244,243.51
Debit (626,915.26) (814,198.30) (907,010.65) (1,276,430.44) (1,239,316.28)
Of which: Passenger (119,622.38) (99,604.96) (154,139.41) (393,014.80) (441,503.56)
Credit 15,603.73 46,168.31 28,107.95 25,052.51 10,070.83
Debit (135,226.12) (145,773.26) (182,247.36) (418,067.31) (451,574.39)
Of which: Freight (434,010.10) (608,180.69) (616,402.29) (618,783.36) (582,893.62)
Credit 47,231.64 49,286.00 84,413.69 213,625.43 161,430.79
Debit (481,241.74) (657,466.69) (700,815.98) (832,408.79) (744,324.41)
Of which: Other 31,101.42 36,906.02 27,061.13 31,425.29 29,324.42
Credit 41,548.82 47,864.37 51,008.44 57,379.63 72,741.89
Debit (10,447.40) (10,958.35) (23,947.31) (25,954.34) (43,417.47)
Travel (676,428.76) (1,091,634.62) (656,697.55) (751,082.80) (919,356.63)
Credit 26,840.87 67,438.61 89,604.96 85,529.78 95,886.34
Debit (703,269.62) (1,159,073.24) (746,302.51) (836,612.58) (1,015,242.96)
Business travel (69,689.69) (109,999.25) (108,239.03) (113,519.54) (169,534.00)
Credit - - - - -
Debit (69,689.69) (109,999.25) (108,239.03) (113,519.54) (169,534.00)
Personal travel (606,739.07) (981,635.38) (548,458.52) (637,563.26) (749,822.63)
Credit 26,840.87 67,438.61 89,604.96 85,529.78 95,886.34
Debit (633,579.94) (1,049,073.99) (638,063.47) (723,093.04) (845,708.96)
Education related expenditure (317,637.71) (560,634.33) (322,918.93) (358,712.96) (411,120.21)
Credit - - - - -
Debit (317,637.71) (560,634.33) (322,918.93) (358,712.96) (411,120.21)
Health related expenditure (134,330.34) (212,566.43) (131,382.51) (149,840.02) (169,512.59)
Credit - - - - -
Debit (134,330.34) (212,566.43) (131,382.51) (149,840.02) (169,512.59)
Other Personal Travels (154,771.02) (208,434.63) (94,157.07) (129,010.28) (169,189.82)
Credit 26,840.87 67,438.61 89,604.96 85,529.78 95,886.34
Debit (181,611.88) (275,873.24) (183,762.03) (214,540.06) (265,076.16)
Insurance services (25,811.60) (120,137.73) (58,206.09) (75,223.00) (107,977.18)
Credit 571.40 43.85 112.88 151.27 253.03
Debit (26,383.00) (120,181.58) (58,318.97) (75,374.28) (108,230.21)
Communication services (23,127.14) (24,259.62) (45,647.14) (35,633.94) (27,609.33)
Credit 3,368.52 3,533.47 5,448.99 7,128.27 7,690.45
Debit (26,495.66) (27,793.09) (51,096.13) (42,762.22) (35,299.78)
Construction services (7,582.43) (7,953.72) (6,465.99) (19,381.48) (13,645.97)
Credit - - - - -
Debit (7,582.43) (7,953.72) (6,465.99) (19,381.48) (13,645.97)
Financial services 581.38 (2,002.30) (6,160.30) (2,990.82) (46,424.21)
Credit 1,684.26 1,766.73 1,203.20 2,078.27 2,458.67
Debit (1,102.88) (3,769.03) (7,363.50) (5,069.09) (48,882.88)
Computer & information services (25,104.12) (26,333.41) (27,716.75) (18,597.37) (25,372.38)
Credit - - - - -
Debit (25,104.12) (26,333.41) (27,716.75) (18,597.37) (25,372.38)
Royalties and license fees (21,725.71) (22,561.20) (31,032.73) (33,575.65) (32,803.43)
Credit - - - - -
Debit (21,725.71) (22,561.20) (31,032.73) (33,575.65) (32,803.43)
Other business services (517,146.42) (492,869.46) (615,860.29) (667,686.22) (920,846.84)
Credit 1,247.60 1,236.71 2,117.74 2,739.94 5,497.88
Debit (518,394.02) (494,106.17) (617,978.04) (670,426.16) (926,344.72)
Operational leasing services (102,874.60) (118,819.96) (176,403.67) (166,830.32) (287,533.00)
Credit - - - - -
Debit (102,874.60) (118,819.96) (176,403.67) (166,830.32) (287,533.00)
Misc. business, professional, and technical services (414,271.82) (374,049.49) (439,456.63) (500,855.90) (633,313.84)
Credit 1,247.60 1,236.71 2,117.74 2,739.94 5,497.88
Debit (415,519.42) (375,286.21) (441,574.37) (503,595.84) (638,811.72)
Table 55
Balance of Payments
(Naira Million)

Central Bank of Nigeria Annual Report—2011
302
Personal, cultural & recreational services (48.96) (51.35) (1,690.66) (7,882.68) (12,167.39)
Credit - - - - -
Debit (48.96) (51.35) (1,690.66) (7,882.68) (12,167.39)
Government Services (307,887.72) (162,370.01) (260,749.53) (150,800.23) (158,192.55)
Credit 43,461.39 50,983.77 68,223.64 69,311.55 165,030.64
Debit (351,349.11) (213,353.78) (328,973.17) (220,111.77) (323,223.18)
Income(net) (1,478,202.64) (1,784,946.61) (2,144,670.68) (2,921,789.13) (3,505,308.47)
Credit 322,595.67 278,765.18 139,263.22 149,959.67 138,095.92
Debit (1,800,798.32) (2,063,711.78) (2,283,933.91) (3,071,748.80) (3,643,404.39)
Compensation of employees 23,932.71 10,904.23 17,789.04 22,212.52 21,107.60
Credit 27,425.99 15,056.76 20,563.60 25,035.98 27,764.72
Debit (3,493.28) (4,152.53) (2,774.57) (2,823.46) (6,657.12)
Investment income (1,502,135.35) (1,795,850.84) (2,162,459.72) (2,944,001.65) (3,526,416.07)
Credit 295,169.68 263,708.42 118,699.62 124,923.69 110,331.20
Debit (1,797,305.04) (2,059,559.25) (2,281,159.34) (3,068,925.34) (3,636,747.26)
Direct investment (1,640,136.13) (2,006,498.17) (2,224,046.56) (2,978,258.30) (3,506,908.71)
Credit 2,740.98 8,550.39 15,640.07 21,356.30 42,696.40
Debit (1,642,877.11) (2,015,048.57) (2,239,686.64) (2,999,614.60) (3,549,605.11)
Income on equity (1,630,903.89) (1,997,044.06) (2,220,732.93) (2,972,431.87) (3,499,921.80)
Credit 2,616.22 8,338.39 15,345.53 20,947.91 42,307.30
Debit (1,633,520.11) (2,005,382.44) (2,236,078.46) (2,993,379.77) (3,542,229.10)
Dividends and distributed branch profits (1,368,280.35) (1,617,967.16) (1,754,296.44) (2,552,722.60) (3,059,392.64)
Credit 1,746.64 7,411.90 13,640.15 19,043.55 38,461.18
Debit (1,370,026.99) (1,625,379.05) (1,767,936.59) (2,571,766.15) (3,097,853.82)
Reinvested earnings and undistributed branch profit (262,623.54) (379,076.90) (466,436.49) (419,709.27) (440,529.16)
Credit 869.58 926.49 1,705.39 1,904.36 3,846.12
Debit (263,493.12) (380,003.39) (468,141.88) (421,613.62) (444,375.28)
Income on Direct Investment Loans (interest) (9,232.24) (9,454.11) (3,313.63) (5,826.43) (6,986.91)
Credit 124.76 212.01 294.54 408.39 389.10
Debit (9,357.00) (9,666.12) (3,608.17) (6,234.82) (7,376.01)
Portfolio investment (66,881.34) (24,398.43) (20,872.58) (48,097.19) (61,364.83)
Credit 6,657.19 8,676.77 2,776.04 2,953.29 2,818.89
Debit (73,538.53) (33,075.20) (23,648.62) (51,050.48) (64,183.72)
Other investment 204,882.12 235,045.77 82,459.42 82,353.84 41,857.47
Income on debt (interest) 204,882.12 235,045.77 82,459.42 82,353.84 41,857.47
Credit 285,771.51 246,481.25 100,283.51 100,614.10 64,815.91
Debit (80,889.39) (11,435.48) (17,824.09) (18,260.26) (22,958.44)
Current transfers(net) 2,333,508.54 2,417,815.59 2,882,981.21 3,111,916.92 3,355,219.50
Credit 2,352,392.22 2,480,722.52 2,952,020.30 3,183,757.61 3,427,824.86
Debit (18,883.67) (62,906.93) (69,039.09) (71,840.68) (72,605.36)
General government 97,818.08 205,007.16 219,407.26 215,077.84 264,024.17
Credit /4 108,251.76 219,053.88 236,899.99 240,349.05 282,007.59
Debit (10,433.68) (14,046.72) (17,492.73) (25,271.21) (17,983.43)
Other sectors 2,235,690.47 2,212,808.43 2,663,573.95 2,896,839.09 3,091,195.34
Credit 2,244,140.46 2,261,668.65 2,715,120.31 2,943,408.56 3,145,817.27
Debit (8,449.99) (48,860.22) (51,546.36) (46,569.47) (54,621.93)
Workers' remittances 2,235,634.32 2,258,678.19 2,710,252.52 2,938,239.48 3,139,422.99
Credit 2,238,935.47 2,261,420.16 2,714,480.64 2,942,551.34 3,144,383.44
Debit (3,301.15) (2,741.97) (4,228.12) (4,311.86) (4,960.44)
Other Transfers 56.14 (45,869.76) (46,678.57) (41,400.39) (48,227.66)
Credit 5,204.99 248.49 639.67 857.22 1,433.83
Debit (5,148.85) (46,118.25) (47,318.24) (42,257.61) (49,661.49)
CAPITAL AND FINANCIAL ACCOUNT (1,666,525.44) (992,280.30) 1,862,597.81 305,561.31 (831,406.39)
Capital account(net) - - - - -
Credit - - - - -
Debit - - - - -
Capital transfers - - - - -
Credit - - - - -
General Government - - - - -
Debt Forgiveness - - - - -
Other Sector - - - - -
Debit - - - - -
Acquisition/disposal of nonproduced, nonfin assets - - - - -
Credit - - - - -
Debit - - - - -
Financial account(net) (1,666,525.44) (992,280.30) 1,862,597.81 305,561.31 (831,406.39)
Assets (3,132,760.90) (2,157,312.27) 248,206.12 (834,766.15) (3,096,417.41)
Direct investment (Abroad) (109,161.26) (124,645.02) (227,093.29) (137,029.22) (125,668.71)
Equity capital (108,291.68) (123,718.53) (225,387.90) (135,124.86) (121,822.60)
Claims on direct investment enterprises (108,291.68) (123,718.53) (225,387.90) (135,124.86) (121,822.60)
Liabilities to direct investors - - - - -
Reinvested earnings (869.58) (926.49) (1,705.39) (1,904.36) (3,846.12)
Other capital - - - - -
Claims on direct investment enterprises - - - - -
Liabilities to direct investors - - - - -
Table 55 cont.
Balance of Payments
(Naira Million)

Central Bank of Nigeria Annual Report—2011
303
Portfolio investment (231,942.44) (560,498.52) (122,347.50) (167,847.68) (247,637.99)
Equity securities (214,673.16) (478,984.34) (112,152.00) (153,860.37) (227,001.49)
Debt securities (17,269.28) (81,514.19) (10,195.50) (13,987.31) (20,636.50)
Long-term - - - - -
Short-term (17,269.28) (81,514.19) (10,195.50) (13,987.31) (20,636.50)
Other investment (1,664,444.37) (1,275,800.90) (966,046.81) (2,021,367.65) (2,676,046.36)
Trade credits (901,140.23) (336,314.40) (990,636.50) (1,096,490.59) (1,090,453.18)
Loans (14,568.23) (34,383.30) (56,346.97) (33,781.22) (30,455.65)
Currency and deposits (748,735.91) (905,103.20) 80,936.66 (891,095.84) (1,555,137.54)
Monetary authorities - - - - -
General government (158,924.28) (245,517.20) (339,404.33) (107,531.49) (218,129.24)
Banks (363,675.40) (409,596.60) 427,960.74 (21,266.77) (328,477.46)
Other sectors (226,136.23) (249,989.40) (7,619.75) (762,297.58) (1,008,530.84)
Other Assets - - - - -
Reserve assets (1,127,212.84) (196,367.83) 1,563,693.71 1,491,478.39 (47,064.34)
Monetary Gold - - - - -
SDRs - - (355,029.68) - -
Reserve Positions in the Fund - - - - -
Foreign exchange (1,127,212.84) (196,367.83) 1,918,723.39 1,491,478.39 (47,064.34)
Other Claims - - - - -
Liabilities 1,466,235.46 1,165,031.97 1,614,391.69 1,140,327.46 2,265,011.02
Direct Invesment in reporting economy 759,380.43 971,543.79 1,273,815.79 905,730.77 1,360,307.91
Equity capital 491,142.69 584,048.27 802,623.95 475,117.39 877,109.59
Claims on direct investors - - - - -
Liabilities to direct investors 491,142.69 584,048.27 802,623.95 475,117.39 877,109.59
Reinvested earnings 263,493.12 380,003.39 468,141.88 421,613.62 444,375.28
Other capital 4,744.62 7,492.13 3,049.96 8,999.76 38,823.04
Claims on direct investors - - - - -
Liabilities to direct investors 4,744.62 7,492.13 3,049.96 8,999.76 38,823.04
Portfolio Investment 332,547.78 157,157.16 70,938.49 556,585.07 792,360.22
Equity securities 182,085.97 (113,047.22) 72,555.51 323,635.60 395,550.99
Debt securities 150,461.81 270,204.37 (1,617.02) 232,949.47 396,809.23
Long-term 132,007.31 159,852.96 (13,563.57) 101,712.87 281,593.01
Short-term 18,454.50 110,351.41 11,946.54 131,236.60 115,216.22
Other investment liabilities 374,307.25 36,331.02 269,637.41 (321,988.38) 112,342.88
Trade credits - - - - -
Short-term - - - - -
Long-term - - - - -
Loans 268,261.25 68,565.25 (24,511.09) (288,531.95) (97,285.73)
General government (64,001.88) (3,062.34) 29,442.22 107,240.42 153,627.43
Long-term (64,001.88) (3,062.34) 29,442.22 107,240.42 153,627.43
Drawings 53,023.00 42,519.41 78,469.87 144,809.39 189,044.70
Repayments (117,024.88) (45,581.75) (49,027.66) (37,568.97) (35,417.27)
short-term - - - - -
Monetary authorities - - - - -
Banks 172,698.83 (26,432.07) (50,330.47) (13,837.98) 104,832.74
Other sectors 159,564.30 98,059.65 (3,622.84) (381,934.38) (355,745.89)
Long-term 159,564.30 98,059.65 (3,622.84) (381,934.38) (355,745.89)
Short-term - - - - -
Currency & Deposits 106,046.00 (32,234.23) (60,881.18) (33,456.44) 209,628.61
Monetary Authority - - - - -
Banks 106,046.00 (32,234.23) (60,881.18) (33,456.44) 209,628.61
Other Liabilities -monetary authority SDR allocation - - 355,029.68 - -
NET ERRORS AND OMISSIONS (1,811,849.38) (2,458,305.37) (3,920,547.14) (2,298,564.44) (505,385.29)
Memorandum Items:
Current Account Balance as % of G.D.P 16.84 14.20 8.30 5.86 3.58
Capital and Financial Account Balance as % of G.D.P (8.07) (4.08) 7.51 0.90 (2.23)
Overall Balance as % of G.D.P 5.46 0.81 (6.31) (4.39) 0.13
External Reserves - Stock (US $ million) 51,333.15 53,000.36 42,382.49 32,339.25 32,639.78
Number of Months of Imports Equivalent 21.59 15.86 16.34 7.92 6.30
External Debt Stock (US$ million) 3,654.00 3,720.00 3,947.30 4,578.77 5,666.58
Debt Service Due as % of Exports of Goods and Non Factor Services - - - - -
Effective Central Exchange Rate (N/$) 124.76 117.78 147.27 148.51 152.59
Average Exchange Rate (N/$) 125.83 118.53 148.90 149.74 153.85
End-Period Exchange Rate (N/$) 117.97 132.56 149.58 150.66 158.27
/1 Revised
/2 Provisional
Source: Central Bank of Nigeria
Balance of Payments
(Naira Million)
/3 Covers data on import of PMS under the Petroleum Support Fund Scheme from the PPPRA, import of PMS data from the NNPC as well as data on
import of AGO, DPK and ATK by other markets from the NCS
/4 The series on transfers to Government (credit) were revised using data on Official Development Assistance from the National Planning Commission
(NPC)
Table 55 cont.

Central Bank of Nigeria Annual Report—2011
304
2007 2008 2009 2010 /1 2011 /2
CURRENT ACCOUNT 27,880.53 29,296.30 13,973.99 13,420.38 8,760.77
Goods 38,072.15 46,176.46 25,621.96 30,612.31 31,105.59
Exports (fob) 66,605.95 86,273.49 56,741.94 77,372.78 93,266.98
Oil and Gas 65,008.82 84,169.28 54,778.52 74,703.67 90,086.90
Non-oil 1,597.13 2,104.21 1,963.42 2,669.10 3,180.08
Imports (fob) (28,533.80) (40,097.03) (31,119.98) (46,760.47) (62,161.39)
Oil/3 (5,603.45) (10,714.04) (6,910.77) (11,218.26) (19,349.55)
Non-oil (18,434.04) (29,382.99) (24,209.21) (35,542.20) (42,811.85)
Unrecorded(TPAdj) (4,496.31) - - - -
Services(net) (17,047.23) (22,253.37) (16,661.29) (18,472.20) (21,361.20)
Credit 1,455.26 2,278.12 2,242.42 3,117.70 3,414.81
Transportation 836.68 1,216.81 1,110.41 1,993.58 1,600.67
Travel 215.14 572.57 608.44 575.94 628.40
Insurance Services 4.58 0.37 0.77 1.02 1.66
Communication Services 27.00 30.00 37.00 48.00 50.40
Construction Services - - - - -
Financial Services 13.50 15.00 8.17 13.99 16.11
Computer & information Services - - - - -
Royalties and License Fees - - - - -
Government Services 348.36 432.86 463.26 466.73 1,081.54
Personal, cultural & recreational services - - - - -
Other Bussiness Services 10.00 10.50 14.38 18.45 36.03
Debit (18,502.49) (24,531.49) (18,903.71) (21,589.90) (24,776.01)
Transportation (5,024.97) (6,912.74) (6,158.83) (8,595.16) (8,121.96)
Travel (5,636.98) (9,840.81) (5,067.58) (5,633.54) (6,653.48)
Insurance Services (211.47) (1,020.37) (396.00) (507.55) (709.30)
Communication Services (212.37) (235.97) (346.96) (287.95) (231.34)
Construction Services (60.78) (67.53) (43.91) (130.51) (89.43)
Financial Services (8.84) (32.00) (50.00) (34.13) (320.36)
Computer & information Services (201.22) (223.58) (188.20) (125.23) (166.28)
Royalties and License Fees (174.14) (191.55) (210.72) (226.09) (214.98)
Government Services (2,816.20) (1,811.42) (2,233.81) (1,482.18) (2,118.27)
Personal, cultural & recreational services (0.39) (0.44) (11.48) (53.08) (79.74)
Other Bussiness Services (4,155.13) (4,195.08) (4,196.22) (4,514.48) (6,070.88)
Income(net) (11,848.37) (15,154.63) (14,562.85) (19,674.59) (22,972.33)
Credit 2,585.73 2,366.78 945.63 1,009.79 905.02
Investment Income 2,365.90 2,238.95 806.00 841.20 723.06
Compensation of employees 219.83 127.84 139.63 168.59 181.96
Debit (14,434.10) (17,521.41) (15,508.48) (20,684.38) (23,877.35)
Investment Income (14,406.10) (17,486.15) (15,489.64) (20,665.37) (23,833.72)
Compensation of employees (28.00) (35.26) (18.84) (19.01) (43.63)
Current transfers(net) 18,703.98 20,527.83 19,576.16 20,954.87 21,988.71
Credit 18,855.34 21,061.93 20,044.95 21,438.62 22,464.53
General Government/4 867.68 1,859.82 1,608.61 1,618.45 1,848.16
Other Sectors 17,987.66 19,202.11 18,436.34 19,820.17 20,616.37
Workers Remittance 17,945.94 19,200.00 18,432.00 19,814.40 20,606.98
Debit (151.36) (534.09) (468.79) (483.76) (475.83)
General Government (83.63) (119.26) (118.78) (170.17) (117.86)
Other Sectors (67.73) (414.83) (350.01) (313.59) (357.97)
Workers Remittance (26.46) (23.28) (28.71) (29.04) (32.51)
CAPITAL AND FINANCIAL ACCOUNT (13,357.85) (8,424.70) 12,647.50 2,057.57 (5,448.69)
Capital account(net) - - - - -
Credit - - - - -
Capital Transfers(Debt Forgiveness) - - - - -
Debit - - - - -
Capital Transfers - - - - -
Financial account(net) (13,357.85) (8,424.70) 12,647.50 2,057.57 (5,448.69)
Assets (25,110.30) (18,316.10) 1,685.38 (5,621.11) (20,292.63)
Direct investment (Abroad) (874.97) (1,058.27) (1,542.02) (922.72) (823.58)
Portfolio investment (1,859.11) (4,758.77) (830.77) (1,130.24) (1,622.92)
Other investment (13,341.17) (10,831.86) (6,559.70) (13,611.38) (17,537.69)
Change in Reserve (9,035.05) (1,667.21) 10,617.87 10,043.24 (308.44)
Liabilities 11,752.45 9,891.40 10,962.12 7,678.68 14,843.94
Direct Invesment in reporting economy 6,086.73 8,248.64 8,649.53 6,098.96 8,914.89
Portfolio Investment 2,665.50 1,334.30 481.69 3,747.90 5,192.80
Other investment liabilities 3,000.22 308.46 1,830.91 (2,168.19) 736.25
NET ERRORS AND OMISSIONS (14,522.68) (20,871.60) (26,621.49) (15,477.95) (3,312.08)
Memorandum Items:
Current Account Balance as % of G.D.P 16.84 14.20 8.30 5.86 3.58
Capital and Financial Account Balance as % of G.D.P (8.07) (4.08) 7.51 0.90 (2.23)
Overall Balance as % of G.D.P 5.46 0.81 (6.31) (4.39) 0.13
External Reserves - Stock (US $ million) 51,333.15 53,000.36 42,382.49 32,339.25 32,639.78
Number of Months of Imports Equivalent 21.59 15.86 16.34 7.92 6.30
External Debt Stock (US$ million) 3,654.00 3,720.00 3,947.30 4,578.77 5,666.58
Debt Service Due as % of Exports of Goods and Non Factor Services - - - - -
Effective Central Exchange Rate (N/$) 124.76 117.78 147.27 148.51 152.59
Average Exchange Rate (N/$) 125.83 118.53 148.90 149.74 153.85
End-Period Exchange Rate (N/$) 117.97 132.56 149.58 150.66 158.27
/1 Revised
./2 Provisional
Source: Central Bank of Nigeria
Table 56
Balance of Payments Analytic Presentation
(US$' Million)
/3 Covers data on import of PMS under the Petroleum Support Fund Scheme from the PPPRA, import of PMS data from the NNPC as well as data on import of AGO, DPK
and ATK by other markets from the NCS
/4 The series on transfers to Government (credit) were revised using data on Official Development Assistance from the National Planning Commission (NPC)

Central Bank of Nigeria Annual Report—2011
305
2007 2008 2009 2010 /1 2011 /2
CURRENT ACCOUNT 3,478,374.82 3,450,585.67 2,057,949.33 1,993,003.13 1,336,791.68
Goods 4,749,881.43 5,438,769.73 3,773,346.41 4,546,102.41 4,746,349.32
Exports (fob) 8,309,758.32 10,161,490.11 8,356,385.57 11,490,298.39 14,231,450.63
Oil and Gas 8,110,500.38 9,913,651.13 8,067,233.00 11,093,921.24 13,746,207.09
Non-oil 199,257.94 247,838.99 289,152.57 396,377.16 485,243.54
Imports (fob) (3,559,876.89) (4,722,720.38) (4,583,039.17) (6,944,195.99) (9,485,101.30)
Oil/3 (699,086.42) (1,261,924.24) (1,017,748.81) (1,665,976.13) (2,952,514.62)
Non-oil (2,299,830.83) (3,460,796.14) (3,565,290.36) (5,278,219.85) (6,532,586.68)
Unrecorded(TPAdj) (560,959.64) - - - -
Services(net) (2,126,812.51) (2,621,053.04) (2,453,707.60) (2,743,227.07) (3,259,468.68)
Credit 181,558.24 268,321.83 330,241.49 462,996.66 521,060.52
Transportation 104,384.20 143,318.68 163,530.08 296,057.57 244,243.51
Travel 26,840.87 67,438.61 89,604.96 85,529.78 95,886.34
Insurance Services 571.40 43.85 112.88 151.27 253.03
Communication Services 3,368.52 3,533.47 5,448.99 7,128.27 7,690.45
Construction Services - - - - -
Financial Services 1,684.26 1,766.73 1,203.20 2,078.27 2,458.67
Computer & information Services - - - - -
Royalties and License Fees - - - - -
Government Services 43,461.39 50,983.77 68,223.64 69,311.55 165,030.64
Personal, cultural & recreational services - - - - -
Other Bussiness Services 1,247.60 1,236.71 2,117.74 2,739.94 5,497.88
Debit (2,308,370.75) (2,889,374.87) (2,783,949.09) (3,206,223.73) (3,780,529.20)
Transportation (626,915.26) (814,198.30) (907,010.65) (1,276,430.44) (1,239,316.28)
Travel (703,269.62) (1,159,073.24) (746,302.51) (836,612.58) (1,015,242.96)
Insurance Services (26,383.00) (120,181.58) (58,318.97) (75,374.28) (108,230.21)
Communication Services (26,495.66) (27,793.09) (51,096.13) (42,762.22) (35,299.78)
Construction Services (7,582.43) (7,953.72) (6,465.99) (19,381.48) (13,645.97)
Financial Services (1,102.88) (3,769.03) (7,363.50) (5,069.09) (48,882.88)
Computer & information Services (25,104.12) (26,333.41) (27,716.75) (18,597.37) (25,372.38)
Royalties and License Fees (21,725.71) (22,561.20) (31,032.73) (33,575.65) (32,803.43)
Government Services (351,349.11) (213,353.78) (328,973.17) (220,111.77) (323,223.18)
Personal, cultural & recreational services (48.96) (51.35) (1,690.66) (7,882.68) (12,167.39)
Other Bussiness Services (518,394.02) (494,106.17) (617,978.04) (670,426.16) (926,344.72)
Income(net) (1,478,202.64) (1,784,946.61) (2,144,670.68) (2,921,789.13) (3,505,308.47)
Credit 322,595.67 278,765.18 139,263.22 149,959.67 138,095.92
Investment Income 295,169.68 263,708.42 118,699.62 124,923.69 110,331.20
Compensation of employees 27,425.99 15,056.76 20,563.60 25,035.98 27,764.72
Debit (1,800,798.32) (2,063,711.78) (2,283,933.91) (3,071,748.80) (3,643,404.39)
Investment Income (1,797,305.04) (2,059,559.25) (2,281,159.34) (3,068,925.34) (3,636,747.26)
Compensation of employees (3,493.28) (4,152.53) (2,774.57) (2,823.46) (6,657.12)
Current transfers(net) 2,333,508.54 2,417,815.59 2,882,981.21 3,111,916.92 3,355,219.50
Credit 2,352,392.22 2,480,722.52 2,952,020.30 3,183,757.61 3,427,824.86
General Government/4 108,251.76 219,053.88 236,899.99 240,349.05 282,007.59
Other Sectors 2,244,140.46 2,261,668.65 2,715,120.31 2,943,408.56 3,145,817.27
Workers Remittance 2,238,935.47 2,261,420.16 2,714,480.64 2,942,551.34 3,144,383.44
Debit (18,883.67) (62,906.93) (69,039.09) (71,840.68) (72,605.36)
General Government (10,433.68) (14,046.72) (17,492.73) (25,271.21) (17,983.43)
Other Sectors (8,449.99) (48,860.22) (51,546.36) (46,569.47) (54,621.93)
Workers Remittance (3,301.15) (2,741.97) (4,228.12) (4,311.86) (4,960.44)
CAPITAL AND FINANCIAL ACCOUNT (1,666,525.44) (992,280.30) 1,862,597.81 305,561.31 (831,406.39)
Capital account(net) - - - - -
Credit - - - - -
Capital Transfers(Debt Forgiveness) - - - - -
Debit - - - - -
Capital Transfers - - - - -
Financial account(net) (1,666,525.44) (992,280.30) 1,862,597.81 305,561.31 (831,406.39)
Assets (3,132,760.90) (2,157,312.27) 248,206.12 (834,766.15) (3,096,417.41)
Direct investment (Abroad) (109,161.26) (124,645.02) (227,093.29) (137,029.22) (125,668.71)
Portfolio investment (231,942.44) (560,498.52) (122,347.50) (167,847.68) (247,637.99)
Other investment (1,664,444.37) (1,275,800.90) (966,046.81) (2,021,367.65) (2,676,046.36)
Change in Reserve (1,127,212.84) (196,367.83) 1,563,693.71 1,491,478.39 (47,064.34)
Liabilities 1,466,235.46 1,165,031.97 1,614,391.69 1,140,327.46 2,265,011.02
Direct Invesment in reporting economy 759,380.43 971,543.79 1,273,815.79 905,730.77 1,360,307.91
Portfolio Investment 332,547.78 157,157.16 70,938.49 556,585.07 792,360.22
Other investment liabilities 374,307.25 36,331.02 269,637.41 (321,988.38) 112,342.88
NET ERRORS AND OMISSIONS (1,811,849.38) (2,458,305.37) (3,920,547.14) (2,298,564.44) (505,385.29)
Memorandum Items:
Current Account Balance as % of G.D.P 16.84 14.20 8.30 5.86 3.58
Capital and Financial Account Balance as % of G.D.P (8.07) (4.08) 7.51 0.90 (2.23)
Overall Balance as % of G.D.P 5.46 0.81 (6.31) (4.39) 0.13
External Reserves - Stock (US $ million) 51,333.15 53,000.36 42,382.49 32,339.25 32,639.78
Number of Months of Imports Equivalent 21.59 15.86 16.34 7.92 6.30
External Debt Stock (US$ million) 3,654.00 3,720.00 3,947.30 4,578.77 5,666.58
Debt Service Due as % of Exports of Goods and Non Factor Services - - - - -
Effective Central Exchange Rate (N/$) 124.76 117.78 147.27 148.51 152.59
Average Exchange Rate (N/$) 125.83 118.53 148.90 149.74 153.85
End-Period Exchange Rate (N/$) 117.97 132.56 149.58 150.66 158.27
/1 Revised
./2 Provisional
Source: Central Bank of Nigeria
Table 57
Table 56: Balance of Payments Analytic Presentation (Naira Million)
(Naira Million)
/3 Covers data on import of PMS under the Petroleum Support Fund Scheme from the PPPRA, import of PMS data from the NNPC as well as data on import of AGO, DPK and ATK
by other markets from the NCS
/4 The series on transfers to Government (credit) were revised using data on Official Development Assistance from the National Planning Commission (NPC)
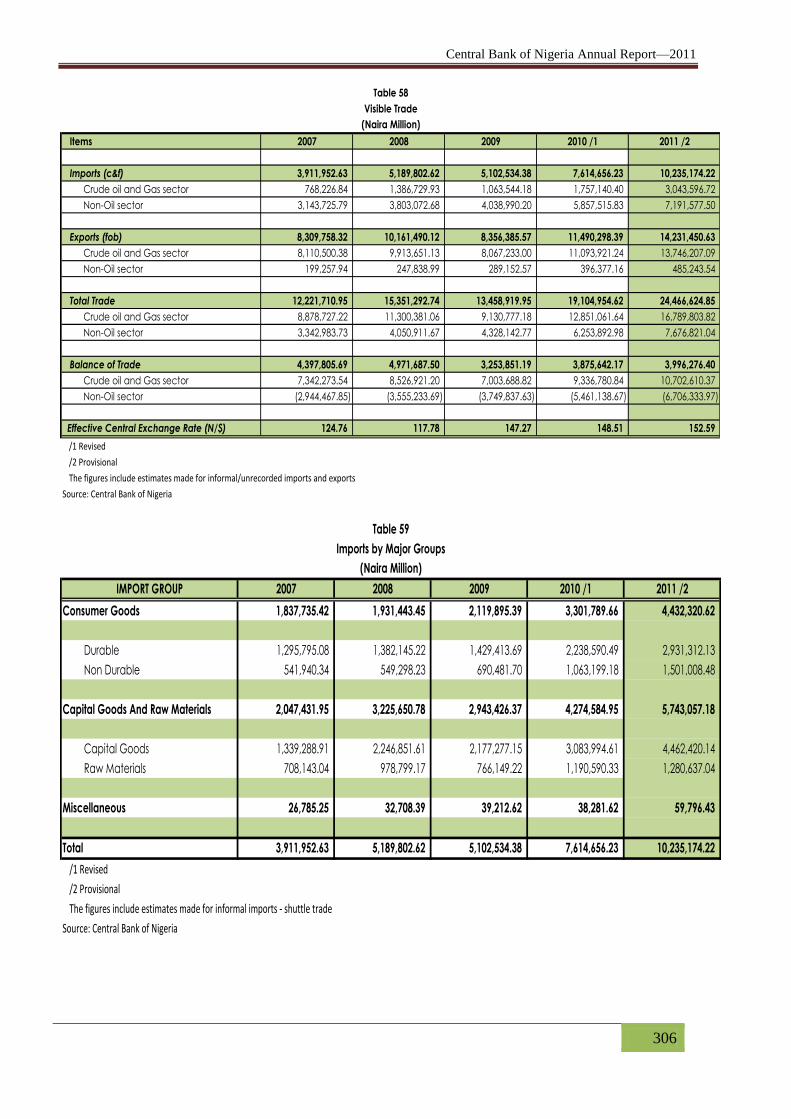
Central Bank of Nigeria Annual Report—2011
306
Items 2007 2008 2009 2010 /1 2011 /2
Imports (c&f) 3,911,952.63 5,189,802.62 5,102,534.38 7,614,656.23 10,235,174.22
Crude oil and Gas sector 768,226.84 1,386,729.93 1,063,544.18 1,757,140.40 3,043,596.72
Non-Oil sector 3,143,725.79 3,803,072.68 4,038,990.20 5,857,515.83 7,191,577.50
Exports (fob) 8,309,758.32 10,161,490.12 8,356,385.57 11,490,298.39 14,231,450.63
Crude oil and Gas sector 8,110,500.38 9,913,651.13 8,067,233.00 11,093,921.24 13,746,207.09
Non-Oil sector 199,257.94 247,838.99 289,152.57 396,377.16 485,243.54
Total Trade 12,221,710.95 15,351,292.74 13,458,919.95 19,104,954.62 24,466,624.85
Crude oil and Gas sector 8,878,727.22 11,300,381.06 9,130,777.18 12,851,061.64 16,789,803.82
Non-Oil sector 3,342,983.73 4,050,911.67 4,328,142.77 6,253,892.98 7,676,821.04
Balance of Trade 4,397,805.69 4,971,687.50 3,253,851.19 3,875,642.17 3,996,276.40
Crude oil and Gas sector 7,342,273.54 8,526,921.20 7,003,688.82 9,336,780.84 10,702,610.37
Non-Oil sector (2,944,467.85) (3,555,233.69) (3,749,837.63) (5,461,138.67) (6,706,333.97)
Effective Central Exchange Rate (N/$) 124.76 117.78 147.27 148.51 152.59
/1 Revised
/2 Provisional
The figures include estimates made for informal/unrecorded imports and exports
Source: Central Bank of Nigeria
Table 58
Visible Trade
(Naira Million)
IMPORT GROUP 2007 2008 2009 2010 /1 2011 /2
Consumer Goods 1,837,735.42 1,931,443.45 2,119,895.39 3,301,789.66 4,432,320.62
Durable 1,295,795.08 1,382,145.22 1,429,413.69 2,238,590.49 2,931,312.13
Non Durable 541,940.34 549,298.23 690,481.70 1,063,199.18 1,501,008.48
Capital Goods And Raw Materials 2,047,431.95 3,225,650.78 2,943,426.37 4,274,584.95 5,743,057.18
Capital Goods 1,339,288.91 2,246,851.61 2,177,277.15 3,083,994.61 4,462,420.14
Raw Materials 708,143.04 978,799.17 766,149.22 1,190,590.33 1,280,637.04
Miscellaneous 26,785.25 32,708.39 39,212.62 38,281.62 59,796.43
Total 3,911,952.63 5,189,802.62 5,102,534.38 7,614,656.23 10,235,174.22
/1 Revised
/2 Provisional
The figures include estimates made for informal imports - shuttle trade
Source: Central Bank of Nigeria
Table 59
Imports by Major Groups
(Naira Million)

Central Bank of Nigeria Annual Report—2011
307
2007 2008 2009 2010 /1 2011 /2 2007 2008 2009 2010 /1 2011 /2
Industrial Countries 1,251,476.97 1,500,683.37 1,396,527.90 2,051,879.72 2,553,877.65 39.8 39.5 34.6 35.0 35.5
United States of America 418,108.19 505,122.91 410,378.40 577,988.44 817,471.18 13.3 13.3 10.2 9.9 11.4
Japan 66,338.99 63,115.56 103,907.41 136,141.65 130,180.11 2.1 1.7 2.6 2.3 1.8
France 62,258.21 176,002.89 122,623.84 160,957.46 215,831.27 2.0 4.6 3.0 2.7 3.0
Germany 148,846.21 160,992.56 140,615.97 266,976.19 321,969.61 4.7 4.2 3.5 4.6 4.5
Switzerland 23,517.61 25,409.28 33,828.66 44,718.08 42,957.66 0.7 0.7 0.8 0.8 0.6
Belgium 170,848.66 164,680.80 137,194.77 212,984.73 250,130.33 5.4 4.3 3.4 3.6 3.5
Norway - 20,872.68 24,301.89 39,127.40 45,777.24 0.0 0.5 0.6 0.7 0.6
Italy 76,335.41 86,477.26 85,783.33 163,573.13 144,579.18 2.4 2.3 2.1 2.8 2.0
Netherlands 94,533.11 98,187.59 110,114.11 155,058.77 228,760.31 3.0 2.6 2.7 2.6 3.2
United Kingdom 190,690.59 199,821.84 227,779.53 294,353.88 356,220.76 6.1 5.3 5.6 5.0 5.0
African 80,896.75 96,347.07 111,109.07 157,120.74 149,873.43 2.6 2.5 2.8 2.7 2.1
Cote d'Ivoire - - - - - 0.0 0.0 0.0 0.0 0.0
Ghana - - - 58,617.77 - 0.0 0.0 0.0 1.0 0.0
Niger - - - - - 0.0 0.0 0.0 0.0 0.0
South Africa 80,896.75 66,337.91 76,497.35 98,502.98 149,873.43 2.6 1.7 1.9 1.7 2.1
Egypt - 19,991.24 19,130.60 - - 0.0 0.5 0.5 0.0 0.0
Swaziland - 10,017.91 15,481.13 - - 0.0 0.3 0.4 0.0 0.0
Others - - - - - 0.0 0.0 0.0 0.0 0.0
Asia (excluding Japan) 859,946.47 1,106,127.00 1,213,913.62 1,795,808.69 2,849,059.81 27.4 29.1 30.1 30.7 39.6
China, P.R 464,692.63 534,149.97 647,892.74 987,339.88 1,436,826.59 14.8 14.0 16.0 16.9 20.0
Hong Kong 32,171.64 28,860.26 33,056.19 33,009.93 - 1.0 0.8 0.8 0.6 0.0
India 172,935.72 139,986.15 177,796.48 282,178.82 448,477.42 5.5 3.7 4.4 4.8 6.2
Indonesia 21,617.21 23,009.41 26,551.87 37,055.65 55,426.81 0.7 0.6 0.7 0.6 0.8
Korea, Republic of 73,900.84 291,278.58 108,612.52 149,891.00 623,495.83 2.4 7.7 2.7 2.6 8.7
Singapore 25,012.90 26,625.75 45,961.79 64,322.12 - 0.8 0.7 1.1 1.1 0.0
Malaysia - 10,475.16 18,903.29 29,411.56 - 0.0 0.3 0.5 0.5 0.0
Thailand 38,387.13 21,792.94 96,110.50 141,122.42 215,605.43 1.2 0.6 2.4 2.4 3.0
Taiwan, Province of China 31,228.39 29,948.76 59,028.23 71,477.30 69,227.73 1.0 0.8 1.5 1.2 1.0
Others - - - - - 0.0 0.0 0.0 0.0 0.0
Others 951,405.59 1,099,915.24 1,317,439.61 1,852,706.70 1,638,766.61 30.3 28.9 32.6 31.6 22.8
Russia 26,236.14 30,611.64 35,534.45 39,277.74 49,891.66 0.8 0.8 0.9 0.7 0.7
Turkey - 15,463.27 28,563.94 54,176.03 73,951.23 0.0 0.4 0.7 0.9 1.0
Isreal - 13,339.48 10,497.65 - - 0.0 0.4 0.3 0.0 0.0
Ukraine 53,886.16 70,092.29 29,438.51 66,192.19 - 1.7 1.8 0.7 1.1 0.0
Lebanon 18,052.74 13,391.24 16,897.96 - 127,219.55 0.6 0.4 0.4 0.0 1.8
United Arab Emirates 73,048.94 65,102.75 103,951.71 153,768.05 117,062.19 2.3 1.7 2.6 2.6 1.6
Sweden - 44,527.72 47,455.67 55,593.86 85,578.61 0.0 1.2 1.2 0.9 1.2
Ireland 47,869.24 33,900.13 35,163.62 55,665.98 77,173.23 1.5 0.9 0.9 1.0 1.1
Spain 26,553.86 28,185.88 31,361.01 99,079.89 66,889.94 0.8 0.7 0.8 1.7 0.9
Greece - 27,441.05 16,106.23 31,287.75 - 0.0 0.7 0.4 0.5 0.0
Portugal - - - 38,374.48 - 0.0 0.0 0.0 0.7 0.0
Argentina 17,153.18 15,990.98 13,599.08 - - 0.5 0.4 0.3 0.0 0.0
Others 557,081.10 653,808.41 691,976.34 1,023,318.70 755,182.92 17.7 17.2 17.1 17.5 10.5
Saudi Arabia 21,170.41 - 11,378.96 27,542.70 49,589.17 0.7 0.0 0.3 0.5 0.7
Iceland - 11,084.84 12,895.00 - - 0.0 0.3 0.3 0.0 0.0
New Zealand 15,647.96 13,297.78 17,872.69 - - 0.5 0.3 0.4 0.0 0.0
Mauritania - - - 26,635.77 - 0.0 0.0 0.0 0.5 0.0
Finland - - 16,872.91 - - 0.0 0.0 0.4 0.0 0.0
Canada - - 14,560.33 - - 0.0 0.0 0.4 0.0 0.0
Poland - - 12,194.77 - - 0.0 0.0 0.3 0.0 0.0
Denmark - - 11,286.49 - - 0.0 0.0 0.3 0.0 0.0
Cyprus - - 10,182.69 - - 0.0 0.0 0.3 0.0 0.0
Chile 15,276.61 - 28,601.51 24,765.70 - 0.5 0.0 0.7 0.4 0.0
Latvia - 8,818.69 - - - 0.0 0.2 0.0 0.0 0.0
Brazil 79,429.26 54,859.09 121,048.09 157,027.85 236,228.12 2.5 1.4 3.0 2.7 3.3
TOTAL 3,143,725.79 3,803,072.68 4,038,990.20 5,857,515.85 7,191,577.50 100.00 100.00 100.00 100.0 100.0
1/ Revised
2/ Provisional
The figures include estimates made for informal imports - shuttle trade
Source: Central Bank of Nigeria
Table 60
Non-Oil Imports by Country of Origin (c&f)
Value (Naira million) Percentage (%)

Central Bank of Nigeria Annual Report—2011
308
2007 2008 2009 2010 /1 2011 /2 2007 2008 2009 2010 /1 2011 /2
CANADA 15,135 24,497 30,115 37,436 53,785 138,704.06 295,922.27 286,640.63 452,137.59 794,568.39
U.S.A 416,222 318,069 246,875 252,315 250,386 3,814,417.55 3,842,297.03 2,349,831.60 3,047,345.91 3,698,989.06
SUB-TOTAL: NORTH AMERICA 431,357 342,566 276,990 289,751 304,171 3,953,121.62 4,138,219.30 2,636,472.24 3,499,483.50 4,493,557.45
ARGENTINA - 7,534 8,941 6,840 15,946 - 91,006.70 85,104.46 82,615.53 235,566.63
URUGUAY - - 50,361 - 61,911 - - 479,355.13 - 914,621.79
BRAZIL 59,398 48,527 15,615 84,017 1,270 544,349.41 586,215.08 148,632.90 1,014,719.34 18,765.62
PERU 3,899 949 3,046 12,370 4,993 35,731.50 11,467.48 28,991.65 149,404.74 73,758.44
CHILE 2,948 - - - - 27,013.21 - - - -
PUERTO RICO 5,929 4,572 999 - - 54,339.22 55,228.32 9,509.59 - -
VENEZUELA - - - - - - - - - -
SUB-TOTAL: SOUTH AMERICA 72,174 61,582 78,963 103,228 84,120 661,433.34 743,917.59 751,593.72 1,246,739.61 1,242,712.47
BAHAMAS - 1,541 301 - - - 18,612.34 2,863.37 - -
TRINIDAD & TOBAGO - 650 - - - - 7,849.83 - - -
SUB-TOTAL: CENTRAL AMERICA - 2,191 301 - - - 26,462.17 2,863.37 - -
VIRGIN ISLAND - - - - - - - - - -
SUB-TOTAL: CARRIBEAN ISLAND - - - - - - - - - -
GERMANY 10,870 11,451 8,516 950 5,396 99,614.69 138,322.97 81,053.08 11,472.36 79,718.39
FRANCE 23,408 36,027 30,947 - 39,001 214,518.44 435,204.37 294,562.53 - 576,162.91
ITALY 15,758 22,236 29,663 18,736 32,859 144,408.35 268,610.73 282,339.95 226,288.48 485,427.80
NETHERLANDS 9,876 33,613 23,849 36,152 59,915 90,507.30 406,047.02 227,006.42 436,628.97 885,137.14
POTUGAL 12,129 17,003 15,822 24,140 12,912 111,150.55 205,395.42 150,595.26 291,546.01 190,743.61
N, WE 4,843 5,048 - - 5,571 44,383.91 60,977.27 - - 82,301.20
SPAIN 34,670 36,132 36,704 38,216 48,343 317,732.09 436,473.65 349,355.94 461,552.66 714,184.29
UNITED KINGDOM 7,871 9,669 15,730 11,120 24,043 72,128.37 116,799.06 149,719.98 134,303.65 355,187.51
SWITZERLAND 1,697 - - 1,182 - 15,554.30 - - 14,273.83 -
SCOTLAND 524 - - - - 4,804.85 - - - -
TURKEY - - 1,998 962 - - - 19,016.25 11,614.79 -
WESTERN EUROPE - - - - - - - - - -
SWEDEN - 949 400 - - - 11,469.63 3,807.32 - -
SUB-TOTAL EUROPE 121,645 172,127 163,628 131,457 228,040 1,114,802.85 2,079,300.10 1,557,456.72 1,587,680.74 3,368,862.84
JAPAN 3,076 1,000 950 998 910 28,192.47 12,076.57 9,044.27 12,058.46 13,437.66
AUSTRALIA - - 2,856 959 19,952 - - 27,186.95 11,584.75 294,746.23
INDIA 75,298 74,151 87,160 153,745 111,844 690,058.50 895,744.03 829,617.16 1,856,859.27 1,652,278.91
INDONESIA 7,515 949 10,841 44,362 19,612 68,868.54 11,468.99 103,185.07 535,784.33 289,730.90
KOREA 2,706 - - - - 24,797.37 - - - -
TAIWAN 3,800 - 948 - 9,400 34,822.75 - 9,025.13 - 138,874.24
CHINA 5,356 - 8,615 20,494 4,062 49,080.62 - 82,003.65 247,517.83 60,002.11
NEW ZEALAND 850 - - - - 7,786.25 - - - -
SINGAPORE - - - - 4,100 - - - - 60,564.94
THAILAND - - - - - - - - - -
MALAYSIA - - - - 1,332 - - - - 19,682.65
ISREAL - - - - - - - - - -
U.A.E - 997 - - - - 12,046.40 - - -
SUB-TOTAL: ASIA & FAR EAST 98,600 77,097 111,371 220,559 171,211 903,606.50 931,335.99 1,060,062.23 2,663,804.64 2,529,317.64
GHANA 10,883 8,497 5,049 20,115 9,665 99,738.44 102,639.52 48,056.23 242,940.32 142,782.45
COTE D'IVOIRE 22,301 21,145 27,845 13,773 8,810 204,370.94 255,436.75 265,038.41 166,346.31 130,149.51
SENEGAL 3,934 6,997 5,947 10,835 6,487 36,053.94 84,521.09 56,610.01 130,862.29 95,835.52
CAMEROUN 7,537 7,563 8,851 1,961 13,657 69,070.83 91,363.02 84,247.80 23,678.44 201,749.72
MEDITERRANEAN - - - - - - - - - -
MOROCCO - - - - - - - - - -
EQUITORIAL GUINEA - 417 60,922 44,289 3,444 - 5,033.25 579,873.07 534,898.74 50,877.25
BENIN REPUBLIC - - 337 - 5,840 - - 3,204.11 - 86,275.94
SOUTH AFRICA 23,396 24,299 28,991 1,999 22,474 214,405.82 293,530.59 275,947.91 24,143.16 332,011.58
SUB-TOTAL: AFRICA 68,050 68,917 137,943 92,972 70,377 623,639.96 832,524.21 1,312,977.53 1,122,869.26 1,039,681.98
Total 791,827 724,480 769,195 837,967 857,918 7,256,604.27 8,751,759.36 7,321,425.82 10,120,577.75 12,674,132.38
/1 Revised/2 ProvisionalThe figures are Compiled from various editions of the NNPC Annual Statistics Bulletin Sources: Central Bank of Nigeria
Table 61
Direction of Crude Oil Exports
Region/countryQuantity (Thouand Barrels) Value (N Million)

Central Bank of Nigeria Annual Report—2011
309
2007 2008 2009 2010 /1 2011 /2
(1) Agricultural Produce 85,680.91 107,214.05 135,612.56 141,506.65 262,472.01 39.7 43.3 46.9 35.7 54.1
Cocoa Beans 37,061.98 46,376.31 43,372.89 51,529.03 124,788.88 18.6 18.7 15.0 13.0 25.7
Rubber 10,959.19 13,713.43 17,349.15 19,818.86 49,035.07 5.5 5.5 6.0 5.0 10.1
Fish/Shrimp 6,575.51 8,228.06 6,939.66 8,720.30 8,993.74 3.3 3.3 2.4 2.2 1.9
Cotton 3,985.16 4,986.70 28,915.26 19,818.86 12,173.50 2.0 2.0 10.0 5.0 2.5
Others 27,099.08 33,909.56 39,035.60 41,619.60 67,480.83 13.6 13.7 13.5 10.5 13.9
(2) Minerals 14,944.35 18,700.13 19,373.22 44,394.24 2,706.42 6.3 7.5 6.7 11.2 0.6
Aluminium/Carbonate 8,568.09 10,721.41 12,433.56 24,575.38 - 4.3 4.3 4.3 6.2 -
Other Minerals 6,376.25 7,978.72 6,939.66 19,818.86 2,706.42 3.2 3.2 2.4 5.0 0.6
(3) Semi-Manufactured 67,946.96 85,023.24 84,432.55 148,641.44 148,686.37 39.4 34.3 29.2 37.5 30.6
Processed Skins 49,017.45 61,336.41 68,818.31 110,192.85 87,740.15 24.6 24.7 23.8 27.8 18.1
Cocoa Products 7,173.29 8,976.06 - - 20,646.53 3.6 3.6 - - 4.3
Texture Yarn 1,992.58 2,493.35 4,048.14 6,738.41 1,751.91 1.0 1.0 1.4 1.7 0.4
Furniture/Processed Wood 5,579.22 6,981.38 3,758.98 13,080.45 830.50 2.8 2.8 1.3 3.3 0.2
Others 4,184.42 5,236.04 7,807.12 18,629.73 37,717.27 2.1 2.1 2.7 4.7 7.8
(4) Manufactured 23,313.18 27,676.19 26,312.88 22,989.88 53,634.47 10.3 11.2 9.1 5.8 11.1
Tyres/Tubes 1,195.55 1,496.01 - - - 0.6 0.6 - - -
Textiles 996.29 1,246.68 2,024.07 1,585.51 2,979.82 0.5 0.5 0.7 0.4 0.6
Others 21,121.34 26,429.51 24,288.82 21,404.37 50,654.66 10.6 10.7 8.4 5.4 10.4
(5) Other Exports 7,372.54 9,225.40 23,421.36 38,844.96 17,744.27 3.7 3.7 8.1 9.8 3.7
Total 199,257.94 247,838.99 289,152.57 396,377.16 485,243.54 100.0 100.0 100.0 100.0 100.0
1/ Revised
2/ Provisional
The figures include estimates made for informal/unrecorded exports
Source: Central Bank of Nigeria
Table 62
Non-Oil Exports by Products
(Naira Million)
Product 2007 2008 2009 2010 /1 2011 /2% Share in Total

Central Bank of Nigeria Annual Report—2011
310
S/N Exporter FOB Value (USD) Exported Products Destination
1 Olam Nigeria Limited 444,020,924.89 Nigerian Sesame Seeds (HPS), Good Fermented Superior Grade
Nigerian Cocoa Beans
Japan, Germany, US,
Netherlands, Italy, Syria, Spain,
Turkey, UK, China & Greece
2 Bolawole Enterprises Nig Limited 146,046,299.60 Good Fermented Nigerian Cocoa Beans (Crop 2011) Netherlands & Switzerland
3 Unique Leather Finishing Co Limited 124,043,625.34 Finished Leather (Goat and Sheep Skins) Grades 1, 2, 3 and 4 Italy
4 Imoniyame Holdings Limited 97,778,657.08 Nigerian Processed Crumb Rubber (TSR 20) Spain, United Kingdom, Canada,
Columbia & Netherlands
5 Saro Agro Allied Limited 79,456,653.00 Nigerian Origin Dried Cocoa Beans Netherlands
6 Sun and Sand Industries Limited 76,052,820.63 Lead Tin Alloy & Aluminium Alloys United Arab Emirates (UAE) &
Japan
7 British American Tobacco Nigeria Limited 75,985,683.12 Rothmans KS Niger Cigarettes, Craven A FF Niger Cigarettes, Craven
A FF, Rothmans KS, Concorde Menthol Benin Cigarettes, Concorde FF
& Menthol, Rothmans KS Benin Cigarettes, Rothmans Royals/King-
Size, Concorde FF/Menthol and Craven A FF (Togo), Dunhill
International and Craven A Lights Cote D'Ivoire Cigarettes, Various
Brand Of Cigarettes (Ghana), London FF and Rothmans KS Ghana &
Pall Mall FF 10S/Menthol 10S Ghana Cigarettes
Niger, Benin, Togo, Côte D’Ivoire
& Ghana
8 Eleme Petrochemicals Company Limited 75,746,943.45 HDPE Prime Film Grade - HFG00346 & LLDPE Prime Grade -
Rotomoulding - BRU04235
Ghana
9 Fata Tanning Limited 73,227,835.10 Finished Goat and Sheep Leather A-1021 Spain, Portugal, Italy, Turkey &
China
10 Rubber Estates Nigeria Limited 72,348,015.81 Technically Specified Natural Rubber (TSNR) Processed RENL 10 & 20 India, Italy, Poland, Netherlands,
Turkey, India, France, Spain &
Brazil
11 Agro Traders Limited 56,086,471.44 Nigerian Raw Cocoa Beans Netherlands & Germany
12 Atlantic Shrimpers Limited 36,615,567.93 Frozen Shrimps and Crabs, Seafrozen Swimming Crab Claw
(Callinectes Species)
Netherlands, China (Taiwan)
13 Tulip Cocoa Processing Limited 36,022,604.95 Nigerian Pure Prime Pressed Cocoa Butter, Nigerian Cocoa Shell,
Nigerian Cocoa Cake & Cocoa Dust and Liqour
Spain, China & Netherlands
14 West African Rubber Products (Nig) Limited 35,361,545.86 Assorted Bathroom Slippers The Republic Of Congo, Togo
15 Multi-Trex Integrated Foods Plc 34,943,165.33 Nigerian Pure Prime Pressed Cocoa Butter Netherlands
16 MINL Limited 32,929,022.60 Aluminium Corrugated Roofing Sheets & Aluminium Alloy Ingot Japan & Ghana
17 West African Tannery Company Limited 31,809,586.87 Finished Goat and Sheep Leather Italy, China & India
18 Enghuat Industries Limited 28,120,680.00 Nigerian Processed Rubber (TSR 10) Germany, Ukraine, Belarus &
China
19 The Okomu Oil Palm Company Plc 28,097,152.09 Nigerian Processed Natural Rubber (Noko 10 Spot) & Natural Rubber Malaysia, United States Of
America, Germany, Spain & Italy
20 Vakorede Nigeria Limited 24,798,752.94 Nigerian Sesame Seeds Turkey & Vietnam
21 Stanmark Cocoa Processing Co Limited 18,377,424.57 Nigerian Cocoa Butter & Alkalised Cocoa Cake South Africa, Spain, Germany,
Netherlands & United Kingdom
22 Maviga West Africa Limited 15,914,438.90 Nigerian Cleaned Sesame Seeds (Crop 2011) & Nigerian Dried Split
Ginger (Crop 2011)
Japan, Saudi Arabia, China, Egypt
& Syria
23 Armajaro Nigeria Limited 15,248,527.90 Nigerian Cotton, & Nigerian Cocoa Beans Indonesia, Germany, Vietnam &
Netherlands
24 Metal Recycling Industries Limited 14,823,408.54 Aluminium Ingots (ADC 12) & Copper Ingots Japan, Thailand & Belgium
25 Nestle Nigeria Plc 13,536,345.51 Maggi Crevette Tab 24 (60 X 10G) & Maggi Crayfish Tablet 24(60 X
10G)
Togo, Benin & Ghana
26 RMM Global Company Limited 13,482,999.20 Nigerian White Hulled Sesame Seeds, Double Optically Sorted
Premium Grade Sesame Seeds (Crop 2011-2012) Bauchi Type,
Nigerian Hibiscus Flowers (New Crop 2011/2012), Nigerian Gum
Arabic (Grade One), Nigerian Natural Sesame Seeds Benue Type
(Crop 2011/2012), Nigerian Natural Whitish Sesame Seeds Maiduguri
Type - Crop 2011/2012, Nigerian Hibiscus Siftings (Crop 2010/2011)
United Arab Emirates (UAE),
Lebenon, Jordan, Japan, Mexico,
Turkey & Germany
27 Yara Commodities Limited 12,608,457.24 Nigerian Raw Cocoa Beans Netherlands
28 De United Foods Industries Limited 11,895,532.75 Noodles Onion Chicken and Chicken Flavour Regular (70G 40 & 70G) Ghana
29 AIS Trades & Industries Limited 11,654,373.33 Nigerian Sesame Seeds (Maiduguri Type) & Nigerian Dried Hibiscus
Flower
Turkey, Japan & Mexico
30 Friesland Campina Wamco Nigeria Plc 10,998,875.60 Full Cream Unsweetened Evaporated Milk Peak (24 X 170G) Tins Ghana
31 Enkay Indo-Nigerian Industries Limited 10,916,633.38 Nigerian Hibiscus Flower & Nigerian Sheanuts Turkey & India
32 Mamuda Industries (Nig) Limited 10,622,225.00 Finished Leather Italy
33 Alkem Nigeria Limited 10,463,187.96 Polyester Staple Fibre Germany & United Kingdom
34 Notore Chemical Industries Limited 10,086,270.26 Fully Refrigerated Anhydrous Ammonia & Fertilizer - Urea Granular Morocco & Uruguay
35 Nure International Nigeria Limited 9,618,581.86 Good Fermented Nigerian Cocoa Beans (Crop 2011) France, Netherlands, & United
Kingdom
36 PZ Cussons Nigeria Plc 9,408,276.06 Nunu Milk Evaporated and Powder, Jet Detergent, CB Jelly and Robb
Ointment/Inhaler, Cosmetics, Refrigerator, Stabilizer, Washing
Machine and A/C
Togo, Ghana & Gabon
37 West African Cotton Co Limited 9,356,369.22 Nigerian Ginned Cotton Lint Indonesia & Vietnam
38 Beta Glass Plc 9,053,863.86 Empty (300ML) Multiproduct Bottles Guinea, Ghana & Sierra Leon
39 Starlink Global and Ideal Limited 8,750,311.25 Fully Fermented Nigerian Raw Cocoa Beans & Nigerian Raw Cocoa
Beans
Malaysia, Netherlands &
Germany
40 Asia Plastics Industry (Nigeria) Limited 8,322,778.08 Assorted Eva Slippers & Cut Sole and PVC Rope Central African Republic, Niger &
Chad
41 B & B Leather Limited 8,005,847.38 Nigerian Finished Sheep and Goat Skins Leather Italy
42 Armada International Limited 7,721,445.62 100 X 100 MM Billets Cameroon & Ghana
43 Unilever Nigeria Plc 7,454,470.04 Close Up Menthol Chill Toothpaste (8Ml X 240 & 100 X 50) & New
Sunlight Multiactive Detergent Powder (250G X 40,500G X 12 and 1Kg
X 10)
Côte D’Ivoire
Table 63
Top 100 Non-Oil Exporters in Nigeria in 2011

Central Bank of Nigeria Annual Report—2011
311
S/N Exporter FOB Value (USD) Exported Products Destination
44 Cocoa Products (Ile-Oluyi) Limited 6,930,976.00 Cocoa Cake Netherlands
45 Bissma Commodities Nigerian Limited 6,463,317.61 Nigerian Cleaned Sesame Seeds (Crop 2011-2012) Kano Type &
Nigerian Dried Hibiscus Siftings (Crop 2011-2012)
China, Germany, Turkey &
Vietnam
46 Alfa Systems & Commodity Company Limited 6,078,574.90 Good Fermented Nigerian Cocoa Beans & Nigerian Natural Cocoa
Cake
United States Of America & Spain
47 ORC Fishing & Food Processing Limited 5,994,672.00 Various Processed Shrimps and Crab Claws Netherlands & France
48 Kanotan S. A. Limited 5,839,654.91 Processed Sheep Crust and Goat Suede Leather Spain & China
49 Star Seed Nigeria Limited 5,418,849.53 Polished Natural Sesame Seeds (Maidugri, Bauchi, Benue & Kano
Type)- Season 2011/2012 - Purity 99% Min, Nigerian Hibiscus Flower
(HPS Quality) New Crop 2011/2012, Nigerian Dried Split Ginger (HPS
Quality) New Crop 2011/2012
Turkey, Mexico, Brazil,
Netherlands, Syria & Jordan
50 Olokun (Pisces) Limited 5,403,902.05 Frozen Shrimps Tiger, Sole Fillets and Crab Claws Clusters Belgium
51 Akeem & Kamoru (Nig) Limited 5,195,463.00 Nigerian Cocoa Beans Malaysia
52 Metafrique Limited 5,061,532.93 Re-Melted Lead Ingot Indonesia & India
53 Pamol (Nigeria) Limited 4,493,664.00 Nigerian Natural Crumb Rubber (TSR 10) & Technically Specified
Natural Rubber (TSR 10)
United Kingdom & Ukraine
54 Silver Stone Alloys Limited 4,335,291.72 Aluminium Ingots India
55 Everest Metal Nigeria Limited 4,155,449.32 Aluminium Alloy Ingots - AD12.1 & Remelted Lead Ingots Japan & India
56 Fullmark Commodities Limited 4,152,153.00 Nigerian Gum Arabic Accacia Sifting India
57 Viva Metal and Plastics Industries Limited 4,108,649.50 Assorted Polybags Central African Republic, Niger &
Chad
58 Flour Mills of Nigeria Plc 3,403,589.50 Wheat Bran Pellets Mexico
59 Guinness Nigeria Plc 3,235,728.49 Stout-325ML and 600ML (Fes, Small and Large Bottles) United Kingdom
60 Multitan Limited 3,201,434.90 Sheep Bompai Crust Natural, Sheep Bompai Crust Black, Sheep and Goat Crust (TR Grade)Italy & United Kingdom
61 Hakan Agro Nigeria Limited 2,879,456.20 Nigerian Sesame Seeds Turkey
62 Metalworld Recycling Limited 2,756,299.35 Aluminium Ingot, Lead Ingots & Processed Battery Plate/Lead Grid Profile and ConcentrateIndonesia, India & South Korea
63 Decent Bag Industries Limited 2,533,434.20 Assorted Polybags Central African Republic, Chad &
Niger
64 Cadbury Nigeria Plc 2,338,283.87 Confectioneries (Tom-Tom & Halls Ahomka Ginger) Ghana
65 African Foundries Limited 2,291,553.52 Prime Concast Steel Billets (100 X 100MM) Philippines
66 Highglory Solid Mineral Company Limited 2,238,630.00 Lead Ore & Zinc Ore China
67 Standard Plastics Industry (Nig) Limited 2,111,257.68 Assorted Eva Slippers Central African Republic, Chad &
Niger
68 Bally Plastics & Footwear Ind (Nig) Ltd 2,109,087.20 Assorted PVC Slippers Chad & Niger
69 Reckitt Benckiser Nigeria Limited 2,047,653.79 Soap Noodles (Natural Soap) & Dettol Liquid (Various Sizes) South Africa & Ghana
70 Bluebay Trading Company Limited 1,947,165.00 Nigerian Cocoa Beans Netherlands
71 Sodexmines Nigeria Limited 1,726,060.50 Nigerian Finished Sheep and Goat Skins Leather Malaysia
72 Spintex Mills (Nigeria) Limited 1,723,441.23 Cotton Yarn NE 16/1 OE Weaving Raw White Portugal, Egypt, Portugal, Poland,
Portugal, Spain & Portugal
73 Angel Spinning & Dyeing Limited 1,706,959.10 Textile Fabrics (Wax Print) 100% Cotton The Democratic Republic Of
Congo
74 Mel-Tech West Africa Limited 1,647,916.50 Copper Ingots China
75 Sfurna Global Limited 1,642,238.81 Aluminium Alloy Ingot - ADC 12 Malaysia & India
76 Sapele Integrated Industries Limited 1,619,452.80 Nigerian Specified Rubber (NSR 10) Spain
77 Standard Footwear (Nigeria) Limited 1,581,679.20 Assorted Beachcombers Central African Republic & Chad
78 Olatunde International Limited 1,511,973.40 Good Fermented Nigerian Cocoa Beans (Crop 2011) Germany
79 Precise Saviour Lndustries Limited 1,498,252.00 Precise Saviour Industries Limited India
80 Loquat Classic Nigeria Limited 1,247,700.00 Nigerian Hibiscus Flowers (New Crop 2011/2012), Nigerian Sesame
Seeds (New Crop 2011/2012) Admixture
Mexico & Egypt
81 Nosak Distilleries Limited 1,161,188.00 Litres Of Extra Neutral Ethyl Alcohol 96.0% V/V (Drums & Kegs) Cameroon
82 Nigerian Breweries Plc 1,107,061.32 Star and Gulder Beer (60CL X 12 Bottles) United Kingdom
83 Prosel Ultimate Limited 906,685.00 Nigerian Cocoa Beans Italy
84 Gongoni Company Limited 900,820.17 Insecticides, Rambo Aerosol Insecticide 300ML (1 X 24), Gasliter
Refill and Soap
Côte D’Ivoire, Ghana & Gabon
85 Plantation Industry Limited 890,131.50 Nigerian Pure Primed Pressed Cocoa Butter & Nigerian Cocoa Cake Spain & Germany
86 AA-Kkayz Resources Limited 869,662.89 Melted Lead Ingot United Arab Emirates (UAE)
87 West African Seasoning Company Limited 786,650.75 Monosodium Glutamate 99+% Pure Regular Crystal (RC) Sierra Leone, Senegal, Gambia &
Ghana
88 Oando Plc 710,791.31 Lubes Product Togo
89 African Textile Manufacturers Limited 642,600.00 100% Cotton Printed Fabrics France & Togo
90 Eastern Metals Limited 615,436.00 Remelted Lead Ingots Thailand
91 Vital Products Limited 546,110.00 Vitali Tomato Paste (70Gms Sachets) & Vitavite Multivitamin Fruit
Drink - Doypack
Benin
92 United Nigerian Textiles Plc 446,563.00 Other Printing Process Woven Fabrics Of Cotton (Nichem) Ghana
93 Holborn (Nigeria) Limited 439,314.70 Finished PVC Casing Pipes/Lldpe Tanks/PVC Ceiling Profile Chad
94 MST Investment Co Limited 404,250.00 Nigerian Peeled Sesame Seed Syria
95 Dangote Agrosacks Limited 396,750.00 Poly Propylene Recycled Pellets United States Of America
96 Ayafa Concepts Limited 333,721.60 Processed, Goat and Sheep Leather Italy
97 Crown Flour Mills Limted 310,000.00 Wheat Bran United Arab Emirates (UAE)
98 God's Little Tannery Limited 307,895.85 Processed Nigerian Goatskin Leather Italy
99 Clean State Commodities Limited 279,923.20 Assorted PVC Slippers Netherlands
100 Kolorkote Nigeria Limited 265,022.94 Coated Aluminium Coils (Bobine Aluminium Prelaquees) & Oven
Baked Colour Coated Diamond Embossed Aluminium Coils
Ghana & Benin
2,002,764,627.46
762,525,785.32
2,765,290,412.78
Source : Trade and Exchange Department
Grand
Table 63 Cont.
Top 100 Non-Oil Exporters in Nigeria in 2011
Total
Other Exports

Central Bank of Nigeria Annual Report—2011
312
2007 2008 2009 2010 2011 2007 2008 2009 2010 2011 2007 2008 2009 2010 2011
January 128.28 117.98 145.78 149.78 151.55 130.04 120.80 149.88 153.55 156.13 128.37 117.72 146.59 150.33 152.47
February 128.27 118.21 147.14 150.22 151.94 130.00 119.57 156.93 152.08 155.11 128.33 117.50 149.12 150.97 152.86
March 128.15 117.92 147.72 149.83 152.51 129.34 119.00 174.32 151.85 157.09 128.25 116.79 150.08 155.21
April 127.98 117.87 147.23 149.89 153.97 129.00 118.93 180.27 152.00 157.05 127.99 117.47 150.38 154.60
May 127.56 117.83 147.84 150.31 154.80 129.16 118.80 180.63 153.26 158.05 127.62 117.79 151.49 156.17
June 127.41 117.81 148.20 150.19 154.50 128.32 118.70 166.14 153.87 158.32 127.49 117.74 148.54 151.28 155.65
July 127.19 117.77 148.59 150.10 151.86 127.52 119.00 155.13 152.41 163.71 127.20 117.71 149.88 150.27 152.41
August 126.68 117.74 151.86 150.27 152.72 127.39 119.00 158.95 152.23 163.10 126.59 117.69 155.23 150.70 153.79
September 125.88 117.73 152.30 151.03 155.26 126.50 119.00 158.00 153.85 158.23 125.73 117.62 153.25 152.62 156.70
October 124.28 117.72 149.36 151.25 153.26 126.50 119.00 153.05 153.98 161.25 123.43 117.72 150.22 151.78 159.82
November 120.12 117.74 150.85 150.22 155.77 123.80 119.10 152.95 153.13 160.35 119.45 117.88 151.03 150.55 158.83
December 118.21 126.48 149.69 150.48 158.21 121.39 137.65 153.48 154.57 163.30 118.23 134.33 149.80 152.63 162.17
Average 125.83 118.57 148.88 150.30 153.86 127.41 120.71 161.64 153.06 159.31 125.72 119.00 150.40 151.09 155.89
End-Period 117.97 132.56 149.58 150.66 158.27 121.00 139.00 155.00 156.00 165.00 118.05 140.00 149.67 152.00 159.70
Notes: Exchange Rate from August, 2005 includes 1% commission
/1 There was no Interbank trade between 18th February - 28th May 2009.
Source: CBN, Statistics Department
TABLE 64
Exchange Rate Movements
(Naira per US Dollar)
Month
CBN DAS/WDAS Rate Bureaux de Change Interbank Rate /1

Central Bank of Nigeria Annual Report—2011
313
Type of Asset/Liability 2007 2008 2009 2010 /1 2011 /2
Net international investment position of Nigeria 8,786.67 14,665.88 (5,224.41) (9,772.48) (10,272.20)
ASSETS 75,505.24 91,275.85 80,804.65 83,935.26 98,279.48
Direct investment abroad 1,506.42 2,564.69 4,118.29 5,041.01 5,864.59
Equity Capital and Reinvested Earnings 1,506.42 2,564.69 4,118.29 5,041.01 5,864.59
Other Capital - - - - -
Portfolio investment abroad 6,208.32 10,967.09 11,797.86 12,739.73 14,092.16
Equity Securities 5,643.86 9,710.55 10,472.09 11,508.15 12,995.82
Monetary Authority - - - - -
General Government - - - - -
Banks 5,643.86 9,710.55 10,472.09 11,508.15 12,995.82
Other Sector - - -
Debt Securities 564.47 1,256.55 1,325.78 1,231.59 1,096.35
Bonds and Notes - - - - -
Monetary Authority - - - - -
General Government - - - - -
Banks - - - - -
Other Sector - - - - -
Money Market 564.47 1,256.55 1,325.78 1,231.59 1,096.35
Monetary Authority - - - - -
General Government - - - - -
Banks 564.47 1,256.55 1,325.78 1,231.59 1,096.35
Other Sector - - - - -
Financial Derivatives - - - - -
Monetary Authority - - - - -
General Government - - - - -
Banks - - - - -
Other Sector - - - - -
Other Assets 16,457.34 24,743.70 22,506.00 33,815.27 45,682.95
Trade Credit 1,812.57 2,122.47 51.74 5,133.12 6,609.49
Monetary Authority - - - - -
General Government - - - - -
Banks - - - - -
Other Sector 1,812.57 2,122.47 51.74 5,133.12 6,609.49
Loans 1,167.69 1,459.61 1,842.22 2,069.69 2,269.28
Monetary Authority - - - - -
Long-term
Short-term
General Government - - - - -
Long-term
Short-term
Banks 1,167.69 1,459.61 1,842.22 2,069.69 2,269.28
Long-term
Short-term 1,167.69 1,459.61 1,842.22 2,069.69 2,269.28
Other Sector - - - - -
Long-term
Short-term
Currency and Deposits 13,477.08 21,161.62 20,612.04 26,612.46 36,804.18
Monetary Authority - - - - -
General Government 2,019.36 4,103.86 6,408.50 7,132.59 8,562.12
Banks 7,889.70 11,367.27 8,461.31 8,604.52 10,757.22
Other Sector 3,568.02 5,690.49 5,742.23 10,875.35 17,484.84
Reserve Assets 51,333.15 53,000.36 42,382.49 32,339.25 32,639.78
Gold
Special Drawing Rights 0.80 1.18 2,423.22 2,579.83 2,571.92
Reserve Position in the Fund (IMF)
Foreign Exchange 51,332.35 52,999.18 39,959.27 29,759.42 30,067.86
Table 65
International Investment Position of Nigeria
(US$' Millions)

Central Bank of Nigeria Annual Report—2011
314
LIABILITIES 66,718.57 76,609.97 86,029.06 93,707.74 108,551.68
Direct investment in Reporting Economy 37,329.54 45,578.18 54,227.71 60,326.67 69,241.56
Equity Capital and Reinvested Earnings 35,974.26 44,159.29 52,788.11 58,826.47 67,486.93
Other Capital 1,355.28 1,418.89 1,439.60 1,500.20 1,754.63
Portfolio investment in Reporting Economy 12,368.69 13,702.99 14,368.88 18,116.78 23,309.58
Equity Securities 6,794.49 5,834.69 6,327.36 8,506.64 11,098.92
Monetary Authority - - - - -
General Government - - - - -
Banks - - - - -
Other Sector 6,794.49 5,834.69 6,327.36 8,506.64 11,098.92
Debt Securities 5,574.20 7,868.30 8,041.52 9,610.14 12,210.66
Bonds and Notes 5,132.79 6,489.98 6,582.08 7,266.99 9,112.43
Monetary Authority - - - -
General Government 5,132.79 6,489.98 6,582.08 7,266.99 9,112.43
Banks - - - - -
Other Sector - - - - -
Money Market 441.41 1,378.32 1,459.44 2,343.15 3,098.23
Monetary Authority - - - - -
General Government - - - - -
Banks 441.41 1,378.32 1,459.44 2,343.15 3,098.23
Other Sector - - - - -
Financial Derivatives - - - - -
Monetary Authority - - - - -
General Government - - - - -
Banks - - - - -
Other Sector - - - - -
Other Liabilities 17,020.34 17,328.80 17,432.47 15,264.28 16,000.53
Trade Credit - - - - -
Monetary Authority - - - - -
General Government - - - - -
Banks - - - - -
Other Sector
Loans 10,556.11 11,138.25 11,655.32 9,712.42 9,074.85
Monetary Authority - - - - -
Long-term
Short-term
General Government 3,533.20 3,507.20 3,707.12 4,429.25 5,436.06
Long-term 3,533.20 3,507.20 3,707.12 4,429.25 5,436.06
Short-term - - - - -
Banks 2,468.71 2,244.30 2,586.05 2,492.87 3,179.90
Long-term 2,468.71 2,244.30 2,586.05 2,492.87 3,179.90
Short-term - - - - -
Other Sector 4,554.20 5,386.75 5,362.15 2,790.30 458.89
Long-term 4,554.20 5,386.75 5,362.15 2,790.30 458.89
Short-term - - - - -
Currency and Deposits 6,464.23 6,190.55 5,777.15 5,551.86 6,925.68
Monetary Authority - - - - -
General Government - - - - -
Banks 6,464.23 6,190.55 5,777.15 5,551.86 6,925.68
Other Sector - - - - -
/1 Revised /2 Provisional
Source: Central Bank of Nigeria
Table 65 cont.
International Investment Position of Nigeria
(US$' Millions)

Central Bank of Nigeria Annual Report—2011
315
Type of Asset/Liability 2007 2008 2009 2010 /1 2011 /2
Net international investment position of Nigeria 1,036,563.13 1,944,109.30 (781,467.93) (1,472,321.25) (1,625,780.94)
ASSETS 8,907,352.84 12,099,526.31 12,086,759.13 12,645,686.78 15,554,693.37
Direct investment abroad 177,712.37 339,975.31 616,013.82 759,478.08 928,188.15
Equity Capital and Reinvested Earnings 177,712.37 339,975.31 616,013.82 759,478.08 928,188.15
Other Capital - - - - -
Portfolio investment abroad 732,395.98 1,453,797.98 1,764,724.50 1,919,368.32 2,230,366.80
Equity Securities 665,805.87 1,287,230.18 1,566,414.85 1,733,817.50 2,056,848.04
Monetary Authority - - - - -
General Government - - - - -
Banks 665,805.87 1,287,230.18 1,566,414.85 1,733,817.50 2,056,848.04
Other Sector - - - - -
Debt Securities 66,590.11 166,567.80 198,309.65 185,550.82 173,518.76
Bonds and Notes - - - - -
Monetary Authority - - - - -
General Government - - - - -
Banks - - - - -
Other Sector - - - - -
Money Market 66,590.11 166,567.80 198,309.65 185,550.82 173,518.76
Monetary Authority - - - - -
General Government - - - - -
Banks 66,590.11 166,567.80 198,309.65 185,550.82 173,518.76
Other Sector - - - - -
Financial Derivatives - - - - -
Monetary Authority - - - - -
General Government - - - - -
Banks - - - - -
Other Sector - - - - -
Other Assets 1,941,472.78 3,280,025.30 3,366,447.96 5,094,608.96 7,230,240.90
Trade Credit 213,828.88 281,354.62 7,739.27 773,355.86 1,046,083.98
Monetary Authority - - - - -
General Government - - - - -
Banks - - - - -
Other Sector 213,828.88 281,354.62 7,739.27 773,355.86 1,046,083.98
Loans 137,752.39 193,485.90 275,559.27 311,820.13 359,159.61
Monetary Authority - - - - -
Long-term - - - - -
Short-term - - - - -
General Government - - - - -
Long-term - - - - -
Short-term - - - - -
Banks 137,752.39 193,485.90 275,559.27 311,820.13 359,159.61
Long-term - - - - -
Short-term 137,752.39 193,485.90 275,559.27 311,820.13 359,159.61
Other Sector - - - - -
Long-term - - - - -
Short-term - - - - -
Currency and Deposits 1,589,891.51 2,805,184.78 3,083,149.43 4,009,432.97 5,824,997.31
Monetary Authority - - - - -
General Government 238,223.90 544,007.68 958,583.43 1,074,596.01 1,355,126.73
Banks 930,748.29 1,506,845.74 1,265,643.23 1,296,356.73 1,702,544.95
Other Sector 420,919.32 754,331.35 858,922.76 1,638,480.23 2,767,325.63
Reserve Assets 6,055,771.71 7,025,727.72 6,339,572.85 4,872,231.41 5,165,897.52
Gold - - - - -
Special Drawing Rights 94.38 156.42 362,465.25 388,677.19 407,057.08
Reserve Position in the Fund (IMF) - - - - -
Foreign Exchange 6,055,677.33 7,025,571.30 5,977,107.61 4,483,554.22 4,758,840.44
Table 66
International Investment Position of Nigeria
(Naira Millions)

Central Bank of Nigeria Annual Report—2011
316
LIABILITIES 7,870,789.70 10,155,417.01 12,868,227.06 14,118,008.03 17,180,474.31
Direct investment in Reporting Economy 4,403,765.83 6,041,843.54 8,111,380.86 9,088,816.43 10,958,862.04
Equity Capital and Reinvested Earnings 4,243,883.45 5,853,755.48 7,896,045.49 8,862,795.97 10,681,156.41
Other Capital 159,882.38 188,088.06 215,335.37 226,020.46 277,705.63
Portfolio investment in Reporting Economy 1,459,134.36 1,816,468.35 2,149,297.07 2,729,474.63 3,689,207.81
Equity Securities 801,545.99 773,446.51 946,446.51 1,281,610.49 1,756,626.18
Monetary Authority - - - - -
General Government - - - - -
Banks - - - - -
Other Sector 801,545.99 773,446.51 946,446.51 1,281,610.49 1,756,626.18
Debt Securities 657,588.37 1,043,021.85 1,202,850.56 1,447,864.14 1,932,581.63
Bonds and Notes 605,515.24 860,311.75 984,547.53 1,094,844.53 1,442,224.11
Monetary Authority - - - - -
General Government 605,515.24 860,311.75 984,547.53 1,094,844.53 1,442,224.11
Banks - - - - -
Other Sector - - - - -
Money Market 52,073.14 182,710.10 218,303.04 353,019.61 490,357.53
Monetary Authority - - - - -
General Government - - - - -
Banks 52,073.14 182,710.10 218,303.04 353,019.61 490,357.53
Other Sector - - - - -
Financial Derivatives - - - - -
Monetary Authority - - - - -
General Government - - - - -
Banks - - - - -
Other Sector - - - - -
Other Liabilities 2,007,889.51 2,297,105.12 2,607,549.13 2,299,716.97 2,532,404.45
Trade Credit - - - - -
Monetary Authority - - - - -
General Government - - - - -
Banks - - - - -
Other Sector - - - - -
Loans 1,245,304.30 1,476,485.81 1,743,403.03 1,463,273.32 1,436,276.64
Monetary Authority - - - - -
Long-term - - - - -
Short-term - - - - -
General Government 416,811.60 464,914.43 554,511.01 667,310.81 860,365.22
Long-term 416,811.60 464,914.43 554,511.01 667,310.81 860,365.22
Short-term - - - - -
Banks 291,233.72 297,503.80 386,821.63 375,575.91 503,282.90
Long-term 291,233.72 297,503.80 386,821.63 375,575.91 503,282.90
Short-term - - - - -
Other Sector 537,258.97 714,067.58 802,070.40 420,386.60 72,628.52
Long-term 537,258.97 714,067.58 802,070.40 420,386.60 72,628.52
Short-term - - - - -
Currency and Deposits 762,585.21 820,619.31 864,146.10 836,443.65 1,096,127.82
Monetary Authority - - - - -
General Government - - - - -
Banks 762,585.21 820,619.31 864,146.10 836,443.65 1,096,127.82
Other Sector - - - - -
/1 Revised/2 Provisional
Source: Central Bank of Nigeria
Table 66 cont.
International Investment Position of Nigeria
(Naira Millions)