central arizona project thomas w. mccann january 7, 2015
TRANSCRIPT
Central Arizona ProjectThomas W. McCannJanuary 7, 2015

History
Physical System
Operation
Governance
Contracting
Finances
Central Arizona Project

CAWCD• Central Arizona Water Conservation District was
formed in 1971 by Maricopa, Pinal and Pima Counties to repay Arizona’s share of CAP construction costs
• U.S. had requested a single CAP repayment entity with ad valorem taxing authority
Evolution of CAWCD Responsibilities1972• CAWCD entered into Master Repayment Contract with
Reclamation providing for:• Delivery of CAP water supply
• Repayment of reimbursable project costs allocated to CAWCD
1982• Arizona Legislature granted CAWCD authority to contract
with U.S. to be the operating agent for the CAP
1983• CAWCD began performing CAP O&M under an interim
contract with Reclamation

CAWCD Mission• Operate and maintain the CAP system
• Deliver the remainder of Arizona’s Colorado River apportionment
• Repay reimbursable costs to U.S.
– Approx. $1.65 billion, plus interest
• Develop and operate recharge projects
• Operate the Central Arizona Groundwater Replenishment District
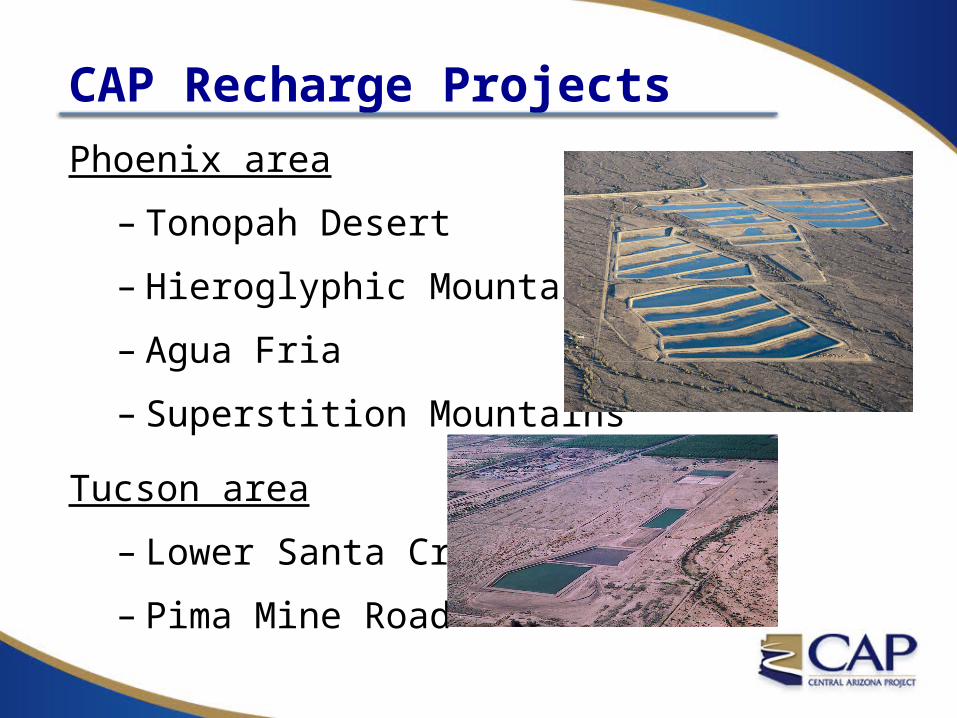
CAP Recharge ProjectsPhoenix area
– Tonopah Desert
– Hieroglyphic Mountains
– Agua Fria
– Superstition Mountains
Tucson area
– Lower Santa Cruz
– Pima Mine Road
CAGRD• Central Arizona Groundwater Replenishment
District is a function added to CAWCD by the Arizona Legislature in 1993– Governed by CAWCD Board– Separate funding from other CAP operations
• Provides a mechanism to comply with Arizona’s 100-year assured water supply rules
• Member Lands (subdivisions) • Member Service Areas (water providers)

CAWCD Governance• Not a State agency
• Governed by 15-member Board of Directors elected from the 3 counties that formed CAWCD
– 10 from Maricopa
– 4 from Pima
– 1 from Pinal
• Directors serve staggered 6 year terms
– 1/3 of Board elected every 2 years

CAWCD Funding• Not funded by State appropriations
• CAWCD revenues come from:
– Water service charges from sale of CAP water
– Ad valorem tax levied on all property in its 3-county service area
• CAWCD also receives benefit of revenues from sale of surplus power from the Navajo Generating Station

Contracting for CAP Water Service• CAWCD holds a master water service contract for
the entire CAP supply
–Nominally about 1.5 MAF per year
• Long-term entitlements to CAP water allocated by Secretary of the Interior
– 650,724 AF reserved for federal uses
– 764,276 AF allocated for non-Indian uses
• Allocation between federal and non-federal uses affects CAWCD repayment obligation

Contracting for CAP Water Service• Native American tribes contract directly
with U.S.
– CAWCD responsible for water deliveries
• Municipal & industrial users hold 3-party subcontracts for CAP water with CAWCD and U.S.
• Non-Indian agricultural users relinquished long-term CAP entitlements pursuant to Arizona Water Settlements Act of 2004

CAP Water Rates• Three main rate components:
– Fixed OM&R
• All costs of operating and maintaining the CAP
• Costs distributed evenly across all water deliveries
– Pumping Energy
• All costs for energy needed to pump CAP water
• Costs distributed evenly across all water deliveries
– Capital Charges
• Used to repay U.S. for CAP construction costs
• Only collected from M&I users
13
CAP Economic Study• What is the value of CAP to the state of Arizona?
• ASU study asked the question: What if CAP was never built and no CAP water was delivered?
• Two periods considered– Construction (1973-1993)
– Water delivery (1986-2010)
• Calculated impacts in 22 sectors of the economy– Gross state product
– Job-years of employment
14
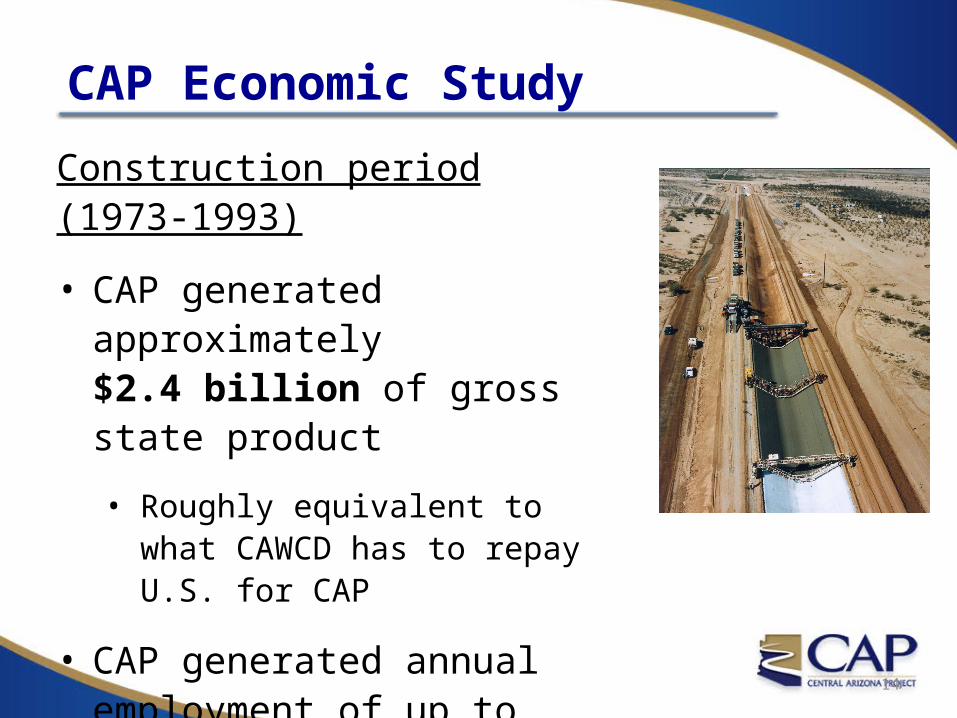
Construction period (1973-1993)
• CAP generated approximately $2.4 billion of gross state product
• Roughly equivalent to what CAWCD has to repay U.S. for CAP
• CAP generated annual employment of up to 9,400 job-years
CAP Economic Study

15
CAP Economic Study
CAP water deliveries (1986-2010) have accounted for more than $1 trillion of Arizona gross state product
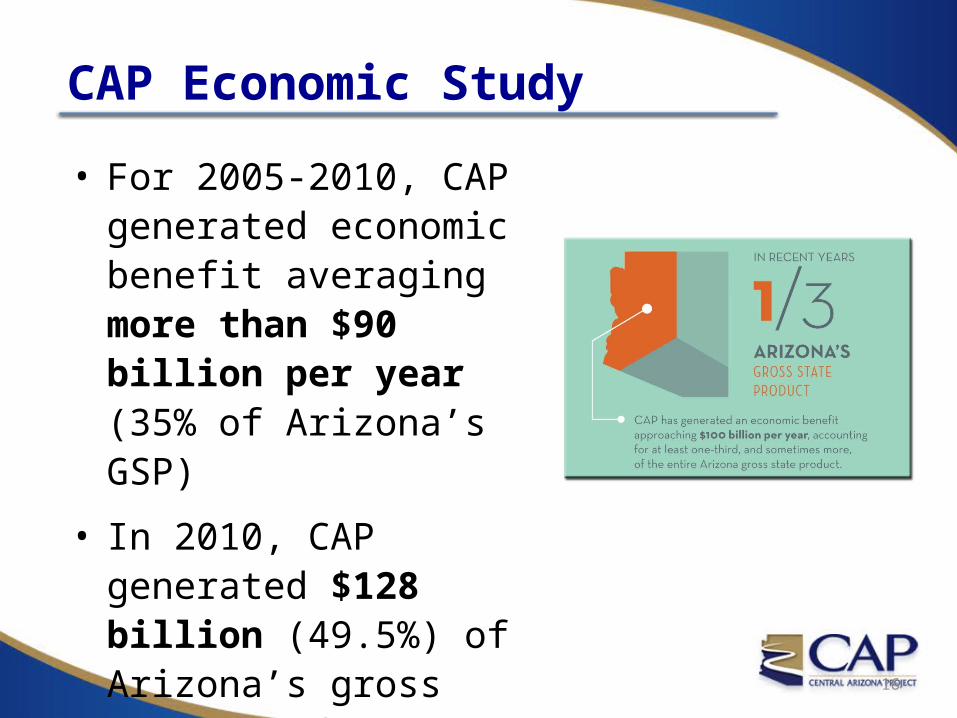
• For 2005-2010, CAP generated economic benefit averaging more than $90 billion per year (35% of Arizona’s GSP)
• In 2010, CAP generated $128 billion (49.5%) of Arizona’s gross state product
16
CAP Economic Study
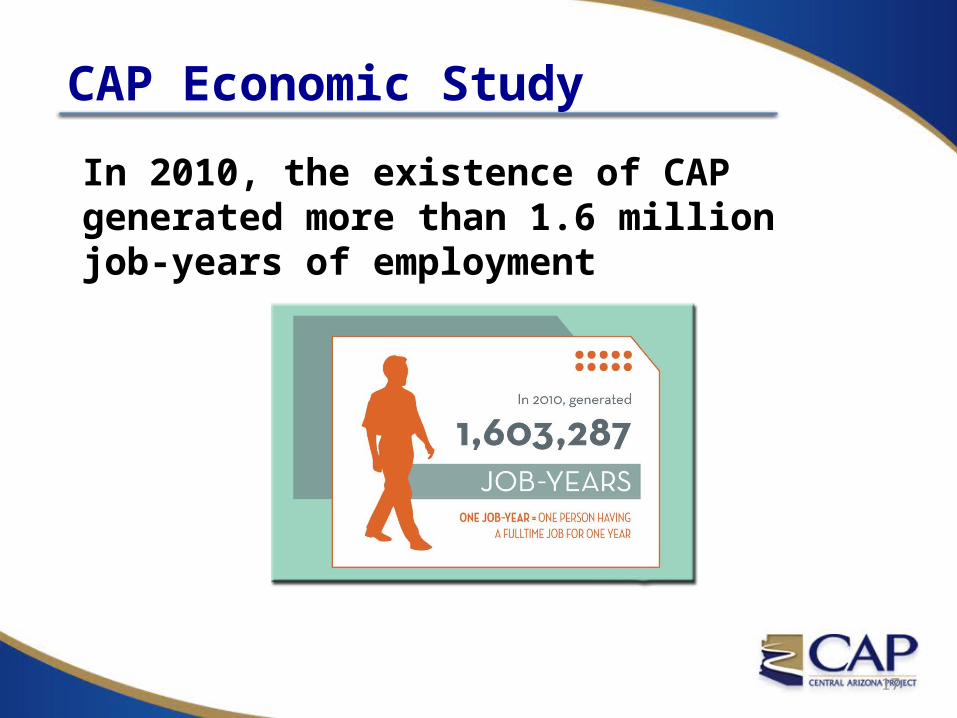
In 2010, the existence of CAP generated more than 1.6 million job-years of employment
17
CAP Economic Study
Questions?