center for turbulence research proceedings of the … a uni ed high-pressure drop model for spray...
TRANSCRIPT

Center for Turbulence ResearchProceedings of the Summer Program 2000
193
Toward a unified high-pressure drop model forspray simulations
By J. C. Oefelein and S. K. Aggarwal†
This research focuses on the development of a unified drop vaporization model for usein simulations of high-pressure spray combustion processes. Emphasis is placed on theanalysis of supercritical and transcritical processes. These processes occur when a liquiddrop that is initially at a subcritical temperature is injected into a high-pressure gaseousenvironment that exceeds the thermodynamic critical pressure of the interfacial mixture.For this situation the gas-liquid interface undergoes what is commonly referred to as atranscritical heating process. This process is dominated by thermodynamic nonidealitiesand transport anomalies. Classical models derived using the quasi-steady approximationfail in this limit because of the fundamental assumption that drop vaporization rates aredominated by quasi-steady convective processes. In the transcritical limit, drop vapor-ization rates are dominated by unsteady diffusion processes. These rate-limiting modesrepresent two extremes. Here we investigate these extremes by presenting the results froma series of direct numerical simulations. Emphasis is placed on the existence of two rate-limiting parameters and on obtaining a unified approach for modeling the transitionalbehavior of vaporizing drops over a range of pressures from atmospheric to supercritical.
1. Introduction
Transcritical drop vaporization occurs when the surface of a drop, initially at a subcrit-ical temperature, reaches the critical mixing state (where both phases of the interfacialmixture exist in equilibrium simultaneously) sometime during its lifetime. As a dropevolves in a supercritical ambient, its temperature starts increasing due to heat transferfrom the ambient, and vaporization is initiated. Since the drop surface has the highestliquid temperature, it attains the critical mixing state sometime during the drop lifetime.As the the surface approaches the critical mixing state, both surface tension and enthalpyof vaporization go to zero, solubility effects become important, and interfacial boundaryconditions change significantly. The subsequent drop regression process is qualitativelydifferent from that in the subcritical state.
A major difficulty in modeling transcritical vaporization stems from the fact that itis governed by processes which are fundamentally different from those which occur atsubcritical or “low-pressure” conditions. As a consequence, the classical, quasi-steady,low-pressure models (see for example Godsave (1953), Spalding (1953), Faeth (1977), Law(1982), Faeth (1983), Sirignano (1983), Aggarwal, Tong & Sirignano (1984), Faeth (1987))can not be used to describe this transcritical behavior. The fundamental difficulty withthe classical models in the transcritical limit can be best illustrated by examining the
† University of Illinois at Chicago

194 J. C. Oefelein & S. K. Aggarwal
quasi-steady equation for vaporization:
τl,LP =d2p
12Prs
νs
1ln(1 + BT ,LP)
(1.1)
where the thermal transfer number BT,LP is given by
BT ,LP =Cp(T∞ − Ts)
∆hvp(1.2)
Here d2p represents the drop diameter, Prs the Prandtl number defined at the drop surface,
and νs the kinematic viscosity at the drop surface. The terms Cp and ∆hvp in Eq. (1.2)represent the constant pressure specific heat and enthalpy of vaporization, respectively.The term T∞ represents the ambient temperature, and Ts the drop surface temperature.As the drop surface approaches the critical mixing state, Cp approaches infinity and ∆hvpapproaches zero, making the transfer number go to infinity. This condition implies thatthe vaporization rate becomes infinitely fast when in reality there is still a finite-rateeffect.
Other fundamental differences between classical low-pressure and high-pressure va-porization phenomena include thermodynamic nonidealities and transport anomalies inthe vicinity of gas-liquid interfaces. Interfacial mixture properties exhibit liquid-like den-sities and gas-like diffusivities. Solubility effects, which are typically negligible at lowpressures, become essential considerations at high pressures. Treatment of interfacialthermodynamics becomes significantly more complex and liquid mass transport in thedrop interior becomes important. The collective effect of these differences significantlyenhances transient effects and drop deformation processes, and the quasi-steady approx-imation becomes invalid. A quantitative investigation of the quasi-steady assumption forhigh-pressure conditions has been reported recently by Zhu, Reitz & Aggarwal (2001).
Several recent studies (Shuen, Yang & Hsiao (1992), Jia & Gogos (1993), Givler &Abrahm (1996), Zhu & Aggarwal (2000), Yang (2000)) have focused on transcritical andsupercritical vaporization phenomena and have considered many of the high-pressureeffects outlined above. Comprehensive reviews of these investigations are provided byGivler & Abrahm (1996) and Yang (2000). Generally, a transient, spherically-symmetricmodel has been formulated to simulate gas- and liquid-phase processes associated witha drop evaporating in an ambient whose pressure and temperature exceed the criticalvalues of the liquid. High-pressure effects such as gas-phase nonidealities, liquid-phasesolubility of gases, and liquid-vapor equilibrium have been represented using appropriatecubic equations of state, or modified Benedict-Webb-Rubin equations of state, along withconsistent sets of mixing rules for multicomponent mixtures.
The current investigation focuses on drops that are initially in a subcritical state andare introduced into a gaseous supercritical environment. For this set of conditions, dropsurface mixture properties undergo transient heating and mass exchange processes thatinitially exhibit the classical low-pressure trends given by Eq. (1.1), then, after a period oftime, transition to highly transient diffusion dominated processes. This transition occurswhen the drop surface attains the critical mixing state. At this point, Eq. (1.1) fails andtranscritical vaporization processes dominate at finite-rates.
The objective of this research is to characterize both modes of vaporization and thetime-history effect associated with the transition process between these modes. We con-sider n-hexane–nitrogen systems over the range of pressures, temperatures, and thermo-dynamic regimes given in Fig. 1. The approach is based on previous work done by Zhu,

Toward a unified high-pressure drop model for spray simulations 195
Temperature, K
Pre
ssur
e,at
m
300 600 900
20
40
60
80
kg/m3
800750700650600550500450400350300250200150100500
Critical Point(508,29.7)
TranscriticalRegime
SupercriticalRegime
Ideal, CaloricallyPerfect Regime
Figure 1. Contours of density as a function of pressure and temperature for n-hexane. Thecritical temperature and pressure is 508 K and 29.7 atm, respectively.
Reitz & Aggarwal (2001), Zhu & Aggarwal (2000), Yang (2000) and Oefelein (1997).We focus on two distinct issues. The first is on the development of a general correlationwhich is analogous to Eq. (1.1) and can be used to characterize vaporization rates aboveover a range of ambient conditions from atmospheric to supercritical. The second is onthe development of a model which characterizes the associated transitional time-historyeffects. The goal is to develop a model that is sufficiently simple so that it can be fea-sibly applied in large-scale spray simulations in a manner analogous to the widely usedlow-pressure models.
2. Theoretical-numerical framework
The analysis was conducted by performing a series of direct numerical simulations(DNS) using two established theoretical-numerical frameworks, one developed by Oefelein(1997), the other by Zhu & Aggarwal (2000). Both frameworks solve the fully-coupledconservation equations of mass, momentum, total energy, and species for both the gasand liquid phases and take full account of gas-liquid interface dynamics.
The framework developed by Oefelein (1997) uses an extended corresponding statesprinciple similar to that developed by Rowlinson & Watson (1969) to model thermophys-ical mixture properties over the relevant range of pressures and temperatures. A 32-termBenedict-Webb-Rubin (BWR) equation of state similar to that developed by Jacobsen& Stewart (1973) is used to predict PVT behavior for real gas, liquid, or gas-liquid mix-tures. Enthalpy, Gibbs energy, and the constant pressure specific heat are obtained as afunction of temperature and pressure using thermodynamic departure functions. Viscos-ity and thermal conductivity are obtained in a similar manner using the methodologiesdeveloped by Ely and Hanley Ely & Hanley (1981a), Ely & Hanley (1981b), Ely & Hanley(1981c). The effective mass diffusion coefficients are calculated using two models. Gasphase quantities, as dictated by phase equilibrium theory, are evaluated using the mixingrules given by Bird, Stewart & Lightfoot (1960) coupled with Chapman-Enskog theory,the Lennard-Jones intermolecular potential function Wilke & Lee (1955), and a high-pressure correction proposed by Takahashi (1974). Liquid phase quantities are evaluated

196 J. C. Oefelein & S. K. Aggarwal
1 atm
1020
305070100
Mole Fraction of Hexane
Tem
pera
ture
,K
0 0.25 0.5 0.75 1200
300
400
500
600
700
Figure 2. Vapor-liquid phase equilibrium composition for an n-hexane–nitrogen system atdifferent pressures. Symbols: , liquid; , vapor; ◦ , critical mixing state.
using the mixing rules proposed by Perkins and Geankoplis Reid, Prausnitz & Poling(1987) and Hayduk & Minhas (1982).
The framework developed by Zhu & Aggarwal (2000) uses a similar property evaluationscheme but with a Peng-Robinson (PR) equation of state to represent nonideal behavior.This framework uses an arbitrary Lagrangian-Eulerian (ALE) numerical method whichallows a dynamically adaptive mesh to be used to analyze interfacial time-history effectsas a function of various initial conditions. For this situation transport across the disconti-nuity is balanced by the continuity of mass and energy fluxes and the condition of phaseequilibrium. The accuracy of this scheme and that described above has been demon-strated in the works cited. Figure 1, for example, was obtained using the 32-term BWRequation of state with the corresponding states principle. This methodology has beenshown to model the PVT behavior of liquid, vapor, and gaseous hydrocarbon mixturesto factors well within 2% of measured values. It is particularly accurate in the difficultregion near the critical point. The PR equation of state exhibits similar accuracy but isslightly less accurate in its ability to map liquid-gas saturation properties.
3. Results and discussion
The modeled system is an isolated liquid-hexane drop surrounded by nitrogen gas in aspherically-symmetric domain. Calculations were performed by imposing two fundamen-tally different initial conditions at the drop surface. One set of results were obtained usingthe framework developed by Oefelein (1997) with the drop surface conditions initializedto the critical mixing state. A second set of results were obtained using the frameworkdeveloped by Zhu & Aggarwal (2000) with the drop surface conditions initialized usingjump conditions balanced by continuity of mass and energy fluxes and the condition ofphase equilibrium. These initial conditions represent the limiting extremes. The formeryields vaporization rates which are dominated by transient transcritical diffusion pro-cesses. The latter yields vaporization rates which are first dominated by quasi-steadysubcritical processes, then, after a period of time, become dominated by transient tran-scritical diffusion processes.
Modeling drop vaporization processes hinges on an accurate representation of the gas-liquid interface. At subcritical conditions, the interface is characterized by jump condi-tions due to the presence of surface tension. When the critical mixing state is reached,

Toward a unified high-pressure drop model for spray simulations 197
Critical Mixing State
Boiling Point of Hexaneat 1 atm (341.9 K)
Pressure, atm
Tem
pera
ture
,K
0 10 20 30 40 50 60 70 80 90 100200
300
400
500
600
Pressure, atm
Mol
eF
ract
ion
ofH
exan
e
0 10 20 30 40 50 60 70 80 90 1000.2
0.4
0.6
0.8
1
1.2
(a) (b)
Figure 3. Equilibrium mixture temperature (a) and composition (b) as a function of pressureshowing the boiling line and critical mixing line.
Time, ms
(dp/
d o)2
0 2 4 6 8 10 12 14 16 18 200
0.2
0.4
0.6
0.8
1
1.2
Time, ms
(dp/
d o)2
0 2 4 6 8 10 12 14 16 18 200
0.2
0.4
0.6
0.8
1
1.2
Time, ms
(dp/
d o)2
0 2 4 6 8 10 12 14 16 18 201
1.1
1.2
1.3
1.4
1.5
1.6
1.7
1.8
(a) (b)
Figure 4. Temporal variation of the dimensionless drop surface (a) and surface temperature (b)for an n-hexane–nitrogen system. The initial temperature is 300 K, ambient temperature is 1500K, and initial drop diameter is 100 µm. Attainment of the critical mixing state is representedwith symbols. (a): , 30; ◦ , 90, ; 100, � , 120; O, 150; B, 180; C, 220. (b): , 30;
, 90; , 150; , 220.
however, the drop surface becomes indistinguishable from the gas phase and subsequentdrop regression is characterized by the motion of the critical surface. This surface ischaracterized by assuming that the interfacial mixture is in a state of thermodynamicequilibrium. Figure 2 shows the calculated equilibrium composition for an n-hexane–nitrogen system over the relevant range of pressures. The dashed lines represent theliquid phase, the solid lines represent the vapor phase, and the symbols represent thecritical mixing state, which is the only point on the curve where both vapor and liquidcan exist in equilibrium simultaneously. The locus of points represent the critical mixingstate. These points are plotted in Fig. 3. The curve to the left of the critical pressuregives n-hexane boiling temperatures as a function of pressure. The curve to the right givesthe critical mixing state as a function of pressure. In this limit, all other thermophysicalsurface properties can be calculated as a function of these primitives.
Figure 4 shows the dual modes of vaporization that can occur when drop surfaceconditions are initialized using jump conditions. Here the temporal variation of the di-

198 J. C. Oefelein & S. K. Aggarwal
Pressure, atm
Diff
usiv
ity,m
2 /s
0 10 20 30 40 50 60 70 80 90 10010-8
10-7
10-6
10-5
10-4
Pressure, atm
Pr s,
Sc s,
Les
0 10 20 30 40 50 60 70 80 90 1000
1
2
3
4
(a) (b)
Figure 5. Mean variation in kinematic viscosity νs thermal diffusivity αs and mass diffusivityDij (a) and the corresponding Prandtl, Schmidt, and Lewis numbers (b) as a function of pressurefor an n-hexane–nitrogen system with initial liquid and ambient temperatures of 300 and 1500K, respectively. Symbols: (a) ◦ , νs; , αs; M, Dij . (b) ◦ , Prs; , Scs; M, Les.
mensionless surface area and surface temperature is given for a range of pressures whichincludes both the quasi-steady subcritical and the transient transcritical vaporizationregimes. These histories have been validated with measurements reported by Nomura,Ujiie, Rath, Sato & Kono (1996). The attainment of the critical mixing state is indicatedby respective symbols. Prior to reaching this state, drop vaporization rates are dominatedby quasi-steady convective processes that are characterized quite accurately by Eq. (1.1).Upon reaching the critical mixing state, however, a distinct change in the vaporizationrate occurs and Eq. (1.1) is no longer valid. The time associated with this transition canbe significant.
3.1. Correlation for transcritical vaporizationSubcritical vaporization rates are well characterized by Eq. (1.1). This classic equationimplies that drops vaporize according to a d2
p law and that the rate of vaporization fora fixed diameter is inversely proportional to the product of the thermal diffusivity atthe surface and the term ln(1 + BT ,LP), where BT,LP is the thermal transfer numbergiven by Eq. (1.2). BT,LP is directly proportional to the product of the constant pressurespecific heat and the temperature difference between the drop surface and ambient gas,and inversely proportional to the enthalpy of vaporization. Figures 5 and 6 show how thediffusion coefficients, enthalpy of vaporization, and surface tension vary as a function ofpressure for a representative n-hexane–nitrogen system.
Difficulties arise with Eq. (1.1) in the limit as the drop surface approaches the criti-cal mixing state. In this limit drop surface properties (as characterized by the pressure,temperature, and composition given in Fig. 3) become invariant with time and the dropsurface regression rate is determined by the rate at which the critical surface moves in-ward. The diffusion coefficients remain well behaved, but the enthalpy of vaporization(which dominates relative to the rise in Cp) becomes zero. This drives Eq. (1.2) toward in-finity, and, as a consequence, Eq. (1.1) incorrectly predicts the occurrence of an infinitelyfast vaporization rate. In reality finite-rate effects are still prevalent.
Yang (2000) has identified two rate limiting parameters which can be used to quantifyfinite-rate vaporization processes in the transcritical limit. The first is a correction dueto the spatial variation in thermal diffusivity which occurs between the ambient gas and

Toward a unified high-pressure drop model for spray simulations 199
Pressure, atm
Ent
halp
yof
Vap
oriz
aton
,kJ/
kg
0 5 10 15 20 25 300
50
100
150
200
250
300
350
400
Pressure, atm
Sur
face
Ten
sion
,N/m
(x103 )
0 5 10 15 20 25 300
5
10
15
20
(a) (b)
Figure 6. Mean variation in enthalpy of vaporization ∆hvp (a) and surface tension σs (b) as afunction of pressure for an n-hexane–nitrogen system with initial liquid and ambient tempera-tures of 300 and 1500 K, respectively.
drop. The second is a transfer number based on the critical mixing temperature:
BT ,HP =T∞ − TcmTcm − Tp
(3.1)
where T∞ represents the ambient temperature, Tcm the critical mixing temperature, andTp the temperature of the drop. The utility of these parameters has been validated forliquid-oxygen–hydrogen systems. The correction associated with the thermal diffusivitycharacterizes the limiting behavior of transient diffusion processes at the critical surface.Equation (3.1) characterizes the limiting behavior of energy exchange processes acrossthe drop surface.
To obtain a general correlation, an expression analogous to Eq. (1.1) was sought thatexhibited the correct limiting behavior over the interval 0 ≤ BT < ∞. This expressionwas obtained by solving the transient heat conduction equation for a solid sphere initiallyat a uniform temperature To in a quiescent ambient gas initially at a uniform temperatureT∞. After solving for the reduced temperature (T∞−T )/(T∞−To) as a function of timeand space, the resultant expression is integrated over the dimensionless time interval0 ≤ τ? ≤ τ?l to obtain an expression for the dimensionless drop life time:
τ?l =τl
d2o/αo
(3.2)
This solution is obtained in a manner consistent with the behavior of the critical inter-face by assuming that the surface temperature is constant. For this set of conditions,the reduced drop lifetime is only a function of the reduced interface temperature. Thisexpression is given as:
(T∞ − Tcm)/(T∞ − To) = BT,HP /(1 +BT,HP ) (3.3)
and, as shown above in Eq. (3.3), is directly related to the high-pressure transfer numberdefined by Eq. (3.1). The final solution is given by:
BT,HP1 +BT,HP
= erf
(1√4τ?l
)− 1√
πτ?lexp
(1√4τ?l
)(3.4)

200 J. C. Oefelein & S. K. Aggarwal
Table 1. Curve fit coefficients corresponding to Eqs. (3.5) (and (3.6)) for the interval0 ≤ BT <∞.
Set 1 Set 2 Set 3 Set 4a0 1.00 × 100 8.44× 10⁻¹ 5.37× 10⁻¹ 2.77 × 10⁻¹
a1 1.94 × 100 3.36× 10⁻¹ 3.07× 10⁻² 1.76 × 10⁻³
a2 1.12 × 101 1.78× 10⁻¹ 1.82× 10⁻³ 1.08 × 10⁻⁵
a3 5.22 × 101 6.88× 10⁻² 7.37× 10⁻⁵ 4.43 × 10⁻⁸
a4 1.63 × 10² 1.81× 10⁻² 1.99× 10⁻⁶ 1.20 × 10⁻¹⁰
a5 3.35 × 10² 3.21× 10⁻³ 3.58× 10⁻⁸ 2.18 × 10⁻¹³
a6 4.44 × 10² 3.76× 10⁻⁴ 4.23× 10⁻¹⁰ 2.58 × 10⁻¹⁶
a7 3.64 × 10² 2.78× 10⁻⁵ 3.14× 10⁻¹² 1.93 × 10⁻¹⁹
a8 1.68 × 10² 1.17× 10⁻⁶ 1.33× 10⁻¹⁴ 8.18 × 10⁻²³
a9 3.35 × 101 2.15× 10⁻⁸ 2.46× 10⁻¹⁷ 1.51 × 10⁻²⁶
Set 1: 0 ≤ 1/ ln(1 +BT ) < 1 1.718 × 100 ≤ BT <∞Set 2: 1 ≤ 1/ ln(1 +BT ) < 10 1.052 × 10⁻² ≤ BT < 1.718 × 100
Set 3: 10 ≤ 1/ ln(1 +BT ) < 100 1.005 × 10⁻² ≤ BT < 1.052 × 10⁻¹
Set 4: 100 ≤ 1/ ln(1 +BT ) < 1000 0 ≤ BT < 1.005 × 10⁻²
This equation establishes an analytic relation between the transfer number and the di-mensionless drop lifetime.
The roots of Eq. (3.4) must be obtained numerically. After performing this operationand analyzing various trends, a functional dependence of the form:
ln(1 + BT ) τ?l =9∑
n=0
(−1)nan
[ln(1 + BT )]n(3.5)
was obtained. The coefficients corresponding to this equation are given in Table 1. Thisequation approaches 0 in the limit as BT → 0, and 1 in the limit as BT →∞. It is alsointeresting to note that for a0 = 1 and an = 0 (n = 1–9), this equation reduces to thesame form as Eq. (1.1). These well bounded characteristics suggest a correlation of theform:
τl,HP =d2p
12Prs
νs
1ln(1 + BT ,HP )
f
(αsαp
) 9∑n=0
(−1)nan
[ln(1 + BT )]n(3.6)
where here the time constant in Eq. (3.2) was replaced with the ratio d2p/αs (with αs
represented above using the definition of the Prandtl number) and a correction factorof the form f(αs/αp) was applied to account for the spatial variation in the thermaldiffusivity. This variation is not accounted for in the analytic approximation.
To validate Eq. (3.6) a set of 43 simulations were performed. The matrix of casesconsiders pressures of 40, 50, 60, 70, 80, 90, and 100 atm with initial ambient temperaturesof 600, 900, 1200, 1500, 1800 and 2100 K. In all cases the initial drop temperature was300 K. Dimensional analysis shows that the initial drop diameter is the only length scaleand that the drop lifetime is proportional to the diameter-squared. Thus only dropswith an initial diameter of 100 µm are considered in the present analysis. The resultantdrop lifetimes are plotted in Fig. 7a. To analyze the effectiveness of Eq. (3.6), the droplifetimes plotted in Fig. 7a were compared to respective predictions using a fitted value
Toward a unified high-pressure drop model for spray simulations 201
Pressure, atm
Dro
pLi
fetim
e,m
s
40 50 60 70 80 90 1000
10
20
30
40
Correlation, ms
Sim
ulat
ion,
ms
0 10 20 30 40 500
10
20
30
40
(a) (b)
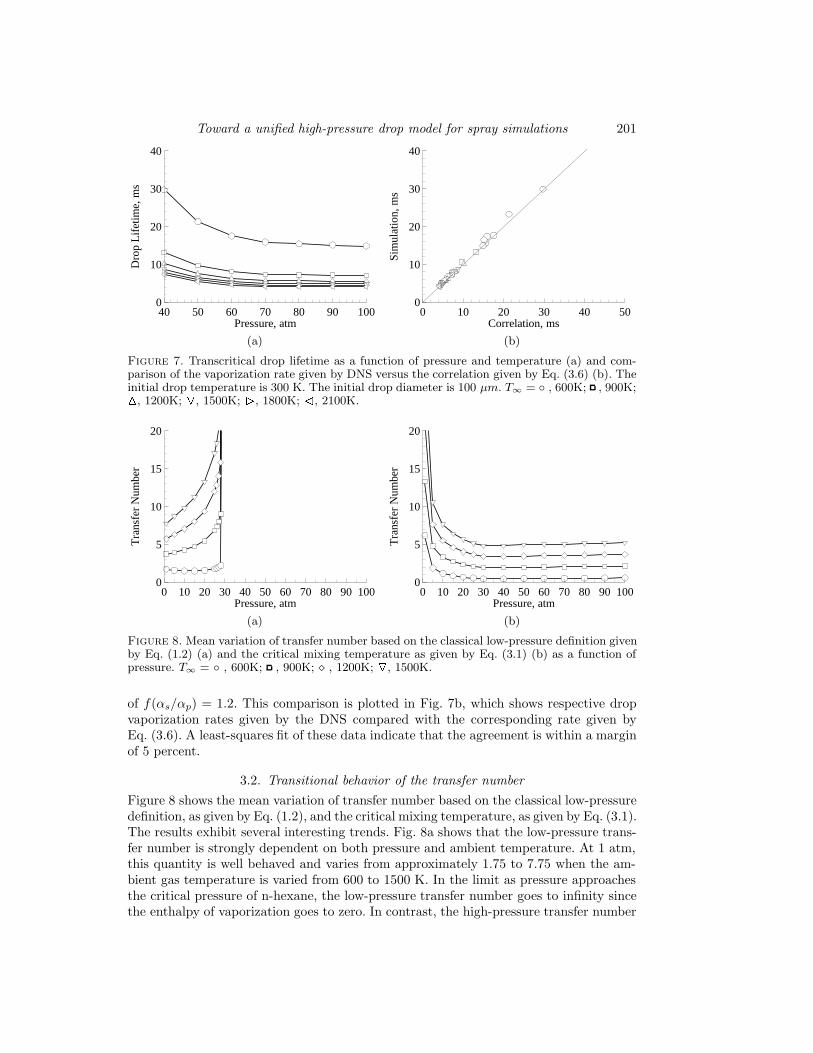
Figure 7. Transcritical drop lifetime as a function of pressure and temperature (a) and com-parison of the vaporization rate given by DNS versus the correlation given by Eq. (3.6) (b). Theinitial drop temperature is 300 K. The initial drop diameter is 100 µm. T∞ = ◦ , 600K; , 900K;M, 1200K; O, 1500K; B, 1800K; C, 2100K.
Pressure, atm
Tra
nsfe
rN
umbe
r
0 10 20 30 40 50 60 70 80 90 1000
5
10
15
20
Pressure, atm
Tra
nsfe
rN
umbe
r
0 10 20 30 40 50 60 70 80 90 1000
5
10
15
20
(a) (b)
Figure 8. Mean variation of transfer number based on the classical low-pressure definition givenby Eq. (1.2) (a) and the critical mixing temperature as given by Eq. (3.1) (b) as a function ofpressure. T∞ = ◦ , 600K; , 900K; � , 1200K; O, 1500K.
of f(αs/αp) = 1.2. This comparison is plotted in Fig. 7b, which shows respective dropvaporization rates given by the DNS compared with the corresponding rate given byEq. (3.6). A least-squares fit of these data indicate that the agreement is within a marginof 5 percent.
3.2. Transitional behavior of the transfer numberFigure 8 shows the mean variation of transfer number based on the classical low-pressuredefinition, as given by Eq. (1.2), and the critical mixing temperature, as given by Eq. (3.1).The results exhibit several interesting trends. Fig. 8a shows that the low-pressure trans-fer number is strongly dependent on both pressure and ambient temperature. At 1 atm,this quantity is well behaved and varies from approximately 1.75 to 7.75 when the am-bient gas temperature is varied from 600 to 1500 K. In the limit as pressure approachesthe critical pressure of n-hexane, the low-pressure transfer number goes to infinity sincethe enthalpy of vaporization goes to zero. In contrast, the high-pressure transfer number

202 J. C. Oefelein & S. K. Aggarwal
Pressure, atm
Tra
nsfe
rN
umbe
r
0 10 20 30 40 50 60 70 80 90 1000
2
4
6
8
10
Figure 9. Composite transfer number obtained by evaluating Eq. (3.7) using the data givenin Fig. 8. T∞ = ◦ , 600K; , 900K; � , 1200K; O, 1500K.
goes to infinity in the limit as pressure approaches zero, and it is well behaved as thepressure approaches infinity. At pressures above critical, there is a strong sensitivity tothe ambient gas temperature but not to pressure. Here a variation from approximately1 to 6 occurs when the ambient gas temperature is varied from 600 to 1500 K.
A last observation regarding Fig. 8 is that respective curves associated with the low andhigh transfer numbers intersect at the same pressure (7 atm for the conditions consideredhere). This implies that the transitional process from the low- to high-pressure transfernumbers is independent of both temperature and pressure and is only a function of thecritical mixing pressure. This suggests that the transition process can be handled byusing a transfer number defined as the minimum of the low-pressure and high-pressurevalues:
BT = min(BT ,LP ,BT ,HP ) (3.7)This equation incorporates transitional effects with the correct limiting behavior forpressure approaching 0 and ∞. It also peaks at the correct value of 7 atm; however, thismay represent an overprediction. This detail will be addressed in future work. Figure 9shows the composite transfer number corresponding the the results given in Fig. 8.
3.3. Transitional time-history effectsEquation (3.6) characterizes the transcritical mode of vaporization but not the time-history effects described above. The trends shown in Fig. 4 illustrated this effect quiteclearly. For the cases shown, the drop never attains the critical mixing state at pressuresbelow 90 atm. At pressures above 90 atm, the drop undergoes transcritical vaporizationsometime during its lifetime. As pressure increases, this transition or the attainment ofthe critical mixing state occurs progressively earlier in its lifetime. At 220 atm, the dropattains the critical mixing state almost instantaneously.
The total drop lifetime, defined here as τv, consists of 1) the time to reach the criticalmixing state τc, which decreases with pressure, and 2) the time associated with transcrit-ical regression, which also decreases with pressure. To characterize the effects of ambientand drop properties on the attainment of the critical mixing state, we examine the ratioof the time to attain the critical mixing state relative to the total drop lifetime. Figure 10shows the variation of this ratio as a function of pressure for different ambient temper-atures and initial drop diameters. As τc/τv goes to unity, the drop surface regression ischaracterized completely by a subcritical vaporization process. As this ratio goes to zero,

Toward a unified high-pressure drop model for spray simulations 203
Pressure, atm
τ c/τv
80 100 120 140 160 180 200 220 2400
0.2
0.4
0.6
0.8
1
1.2
Figure 10. Ratio of time for an n-hexane drop to reach the critical mixing state versus totallifetime. Symbols: ◦ , 100µm, 1500K; , 100µm, 2000K; � , 200µm, 1500K.
Temperature, K
Min
imum
Crit
ical
Pre
ssur
e,at
m
800 1000 1200 1400 1600 1800 200070
80
90
100
110
120
Figure 11. Minimum pressure required for an n-hexane drop to attain the critical mixingstate. Symbols: ◦ , dp = 100µm; , dp = 100µm.
the surface regression process is characterized completely by transcritical vaporizationprocesses. This ratio decreases with pressure, which implies that τc decreases faster thanτv. The time ratio parameter also decreases as the ambient temperature is increased andas the initial drop diameter is decreased. Both of these effects can be attributed to aninherent decrease in the drop heat-up time.
In Fig. 11, we plot the minimum pressure required for the attainment of critical mixingstate as a function of ambient temperature. In order to obtain a minimum pressurevalue at a fixed ambient temperature, simulations were performed for increasingly higherpressures until a critical mixing state is observed at the drop surface. Thus, the curve inFig. 11 represents a boundary between the subcritical and transcritical vaporization. Anypoint above the curve indicates that the critical mixing state will be reached sometimeduring the drop lifetime. The further a point is from the curve in the supercritical region,the smaller the ratio τc/τv, which implies the drop attains the critical mixing state earlierin its lifetime. On the other hand, any point below the curve corresponds to a condition ofsubcritical vaporization where τc/τv is one and the drop never attains the critical mixingstate. This relation is useful in identifying the subcritical and supercritical vaporizationregimes in a more quantitative manner. Another important observation from Fig. 11 is

204 J. C. Oefelein & S. K. Aggarwal
that the minimum pressure required for the attainment of the critical mixing state isindependent of the initial drop diameter.
4. Conclusions
This work represents a first step toward the development of a unified high-pressuredrop model for spray simulations. The key trends have been quantified and a generalcorrelation has been developed and validated for n-hexane–nitrogen systems. Key trendsassociated with the transfer number were also established over a relevant range of pres-sures and were shown to be bounded in the transcritical limit. Issues associated withsurface heating and ambient conditions were also identified and analyzed.
To complete the model, this work must be extended to establish the quantitativevariation in transfer number for mixing states in the transitional region that occurs atpressures between atmospheric and critical. The time-history associated with surfaceheating must be incorporated with companion correlations to account for convectiveeffects in the ambient gas and subcritical and transcritical drop deformation processes.
Acknowledgments
Partial support for this work was provided by the Center for Integrated TurbulenceSimulations under the U.S. Department of Energy Accelerated Strategic Computing Ini-tiative and by the Center for Turbulence Research.
REFERENCES
Aggarwal, S. K., Tong, A., & Sirignano, W. A. 1984 A comparison of vaporizationmodels in spray calculations. AIAA J. 22, 1448-1457.
Bird, R. B., Stewart, W. E. & Lightfoot, E. N. 1960 Transport phenomena. WileyNew York, New York.
Ely, J. F. & Hanley, H. J. M. 1981a An enskog correction for size and mass differenceeffects in mixture viscosity predictions. J. of Research of the National Bureau ofStandards. 86(6), 597-604.
Ely, J. F. & Hanley, H. J. M. 1981b Predictions of transport properties. 1. Viscosityof fluids and mixtures. Industrial and Engineering Chemistry Fundamentals. 20(4),323-332.
Ely, J. F. & Hanley, H. J. M. 1981c Predictions of transport properties. 2. Ther-mal conductivity of pure fluids and mixtures. Industrial and Engineering ChemistryFundamentals. 22(4), 90-97.
Faeth, G. M. 1977 Current Status of Droplet and Liquid Combustion. Prog. Energy &Combust. Sci. 3, 191-224.
Faeth, G. M. 1983 Evaporation and Combustion of Sprays. Prog. Energy & Combust.Sci. 9, 1-76.
Faeth, G. M. 1987 Mixing, Transport, and Combustion in Sprays. Prog. Energy &Combust. Sci. 13, 293-345.
Givler, S. D. & Abraham, J. 1996 Supercritical droplet vaporization and combustionstudies. Prog. Energy & Combust. Sci. 22, 1-28.
Godsave, G. A. E. 1953 Studies of the combustion of drops in a fuel spray - the burning

Toward a unified high-pressure drop model for spray simulations 205
of single drops of fuel. Fourth Symposium (International) on Combustion, Williamsand Wilkins, Baltimore, MD, 818-830.
Hayduk, W. & Minhas, B. S. 1982 Correlations for prediction of molecular diffusivitiesin liquid. Canadian J. of Chem. Eng. 60, 295-299.
Jia, H. & Gogos, G. 1993 High-pressure droplet vaporization; Effects of liquid-phasegas solubility. Int. J. Heat & Mass Transfer 36 4419-4431.
Jacobsen, R. T. & Stewart, R. B. 1973 Thermodynamic properties of nitrogenincluding liquid and vapor phases from 63K to 2000K with pressure to 10,000 bar.J. of Phys. and Chem. Ref. Data. 2(4), 757-922.
Law, C. K. 1982 Recent advances in droplet vaporization and combustion. Prog. Energy& Comb. Sci. 8, l71-201.
Matlosz, R. L., Leipziger, S., & Torda, T. P. 1972 Investigation of liquid dropevaporation in a high temperature and high pressure environment. Int. J. Heat &Mass Transfer. 15, 831-852.
Nomura, H., Ujiie, Y., Rath, H. J., Sato, J. & Kono, M. 1996 Experimental studyof high-pressure droplet evaporation using microgravity conditions. Twenty-SixthSymposium (International) on Combustion, The Combustion Institute, Pittsburgh,1267-1273.
Oefelein, J. C. 1997 Simulation and analysis of turbulent multiphase combustion pro-cesses at high pressures. Ph.D. Thesis, The Pennsylvania State University, UniversityPark, PA.
Reid, R. C., Prausnitz, J. M. & Poling, B. E. 1987 The properties of gases andliquids. McGraw-Hill Book Company.
Rowlinson, J. S. & Watson, I. D. 1969 The prediction of the thermodynamic prop-erties of fluids and fluid mixtures - I. The principle of corresponding states and itsextensions. Chem. & Eng. Sci. 24(8), 1565-1574.
Spalding, D. B. 1953 The combustion of liquid fuels. Fourth Symposium (International)on Combustion, Williams and Wilkins, Baltimore, 847-864.
Shuen, J. S., Yang, V., & Hsiao, C. C. 1992 Combustion of liquid-fuel droplets insupercritical conditions. Combust. & Flame. 89, 299-319.
Sirignano, W. A. 1983 Fuel droplet vaporization and spray combustion. Prog. Energy& Comb. Sci. 9, 291-322.
Takahashi, S. 1974 Preparation of a generalized chart for the diffusion coefficients ofgases at high pressures. Japanese J. of Chem. Eng. 7(6), 417-420.
Wilke, C. R. & Lee, C. Y. 1955 Estimation of diffusion coefficients for gases andvapors. Industrial Engineering Chemistry. 47, 1253-1257.
Yang, V. 2000 Modeling of supercritical vaporization, mixing, and combustion processesin liquid-fueled propulsion systems. Twenty-Eighth Symposium (International) onCombustion, The Combustion Institute, Pittsburgh, in print.
Zhu, G. S. & Aggarwal, S. K. 2000 Transient supercritical droplet evaporation withemphasis on the effects of equation of state. Int. J. Heat & Mass Transfer. 43, 1157-1171.
Zhu, G. S., Reitz, R. D. & Aggarwal, S. K. 2001 Gas-phase unsteadiness and itsinfluence on droplet vaporization in sub- and super-critical environments. To appearin Int. J. of Heat & Mass Transfer.