center for sustainable health...
TRANSCRIPT
Center for SuStainable HealtH Spending
HIGHLIGHTSs Health care prices in June 2014 were 1.7% higher than in June
2013, a tenth lower than the May year-over-year reading. The June 2014 12-month moving average rose to 1.3% from 1.2% in May, the highest average since December 2013.
s Year over year, hospital prices – a key price index driver – grew 1.9% in June, below the May rate of 2.1%. Physician and clini-cal services prices grew 0.5%, just below the May rate of 0.6%, and home health care prices continued a three-month rebound from a year-long negative growth trend, recording a 0.7% rate in June. Prescription drug prices rose 4.1%, up from the May 3.6% rate, and the highest rate since March 2012.
s Economy-wide price indexes were steady in June. The Con-sumer Price Index (CPI) remained at 2.1%, year over year; the Medical CPI fell to 2.6% from 2.8%; and the gross domestic product (GDP) deflator fell a tenth, to 1.5%.
s Combining price and health spending data shows implicit per capita health care utilization growth, year over year, at 1.7% in June, below its 12-month moving average gain of 2.3%.
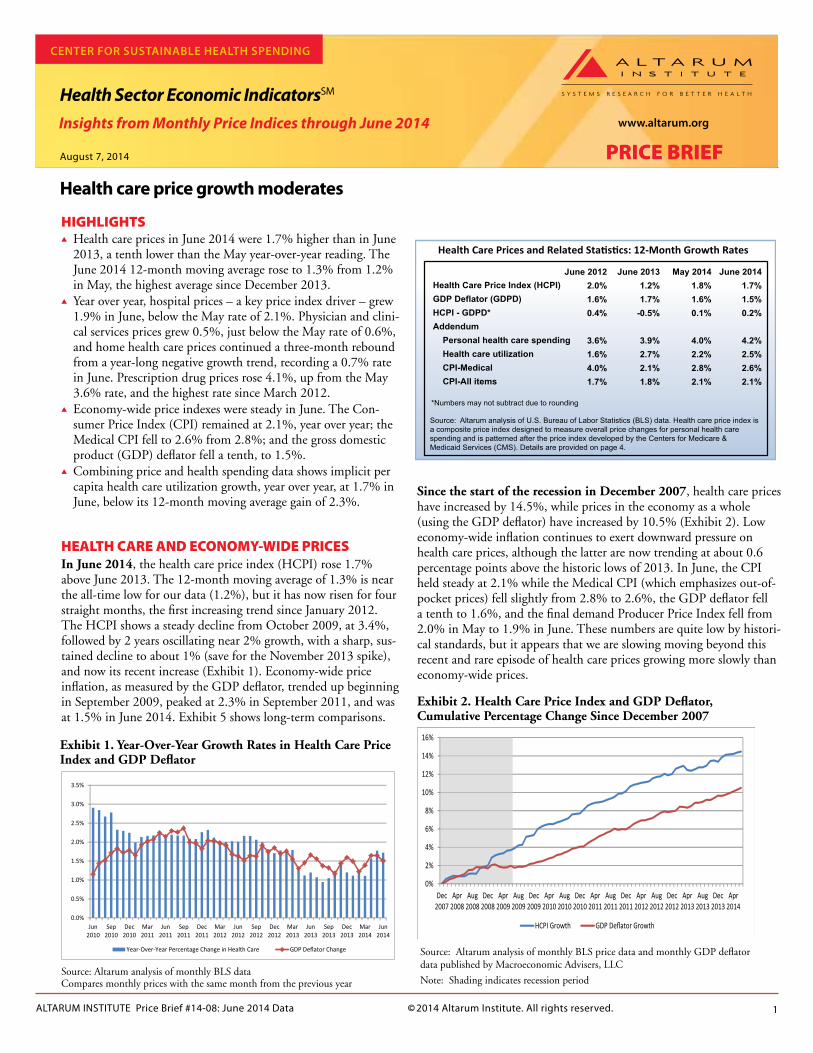
HEALTH CARE AND ECONOMY-WIDE PRICESIn June 2014, the health care price index (HCPI) rose 1.7% above June 2013. The 12-month moving average of 1.3% is near the all-time low for our data (1.2%), but it has now risen for four straight months, the first increasing trend since January 2012. The HCPI shows a steady decline from October 2009, at 3.4%, followed by 2 years oscillating near 2% growth, with a sharp, sus-tained decline to about 1% (save for the November 2013 spike), and now its recent increase (Exhibit 1). Economy-wide price inflation, as measured by the GDP deflator, trended up beginning in September 2009, peaked at 2.3% in September 2011, and was at 1.5% in June 2014. Exhibit 5 shows long-term comparisons.
Health care price growth moderates
Health Sector Economic IndicatorsSM
Health Care Prices and Related Sta�s�cs: 12-Month Growth Rates
Source: Altarum analysis of U.S. Bureau of Labor Statistics (BLS) data. Health care price index isa composite price index designed to measure overall price changes for personal health carespending and is patterned after the price index developed by the Centers for Medicare &Medicaid Services (CMS). Details are provided on page 4.
Health Care Price Index (HCPI)GDP Deflator (GDPD)HCPI - GDPD*Addendum Personal health care spending Health care utilization CPI-Medical CPI-All items
June 20122.0%1.6%0.4%
3.6%1.6%4.0%1.7%
June 20131.2%1.7%
-0.5%
3.9%2.7%2.1%1.8%
May 20141.8%1.6%0.1%
4.0%2.2%2.8%2.1%
June 20141.7%1.5%0.2%
4.2%2.5%2.6%2.1%
*Numbers may not subtract due to rounding
Source: Altarum analysis of monthly BLS dataCompares monthly prices with the same month from the previous year
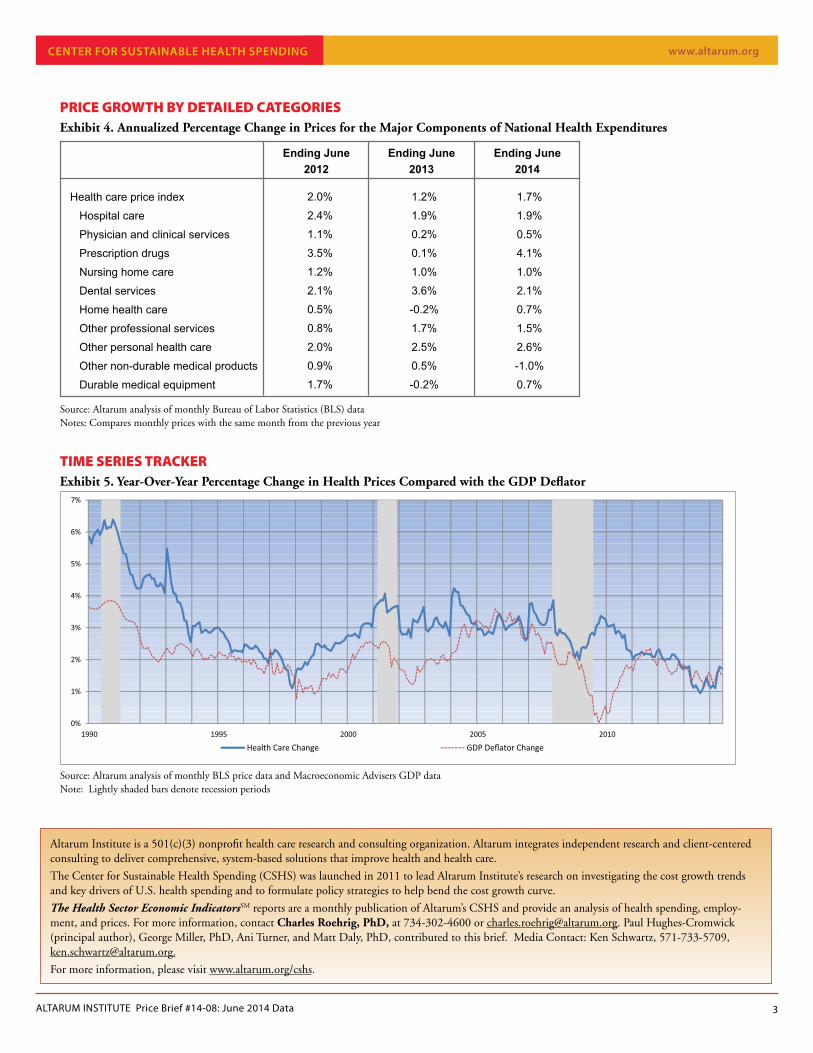
Since the start of the recession in December 2007, health care prices have increased by 14.5%, while prices in the economy as a whole (using the GDP deflator) have increased by 10.5% (Exhibit 2). Low economy-wide inflation continues to exert downward pressure on health care prices, although the latter are now trending at about 0.6 percentage points above the historic lows of 2013. In June, the CPI held steady at 2.1% while the Medical CPI (which emphasizes out-of-pocket prices) fell slightly from 2.8% to 2.6%, the GDP deflator fell a tenth to 1.6%, and the final demand Producer Price Index fell from 2.0% in May to 1.9% in June. These numbers are quite low by histori-cal standards, but it appears that we are slowing moving beyond this recent and rare episode of health care prices growing more slowly than economy-wide prices.
Exhibit 2. Health Care Price Index and GDP Deflator, Cumulative Percentage Change Since December 2007
www.altarum.org
ALTARUM INSTITUTE Price Brief #14-08: June 2014 Data 1
August 7, 2014
Source: Altarum analysis of monthly BLS price data and monthly GDP deflator data published by Macroeconomic Advisers, LLC
Note: Shading indicates recession period
Exhibit 1. Year-Over-Year Growth Rates in Health Care Price Index and GDP Deflator
PRICE BRIEF
© 2014 Altarum Institute. All rights reserved.
Insights from Monthly Price Indices through June 2014
0%
2%
4%
6%
8%
10%
12%
14%
16%
Dec2007
Apr2008
Aug2008
Dec2008
Apr2009
Aug2009
Dec2009
Apr2010
Aug2010
Dec2010
Apr2011
Aug2011
Dec2011
Apr2012
Aug2012
Dec2012
Apr2013
Aug2013
Dec2013
Apr2014
HCPI Growth GDP Deflator Growth0.0%
0.5%
1.0%
1.5%
2.0%
2.5%
3.0%
3.5%
Jun2010
Sep2010
Dec2010
Mar2011
Jun2011
Sep2011
Dec2011
Mar2012
Jun2012
Sep2012
Dec2012
Mar2013
Jun2013
Sep2013
Dec2013
Mar2014
Jun2014
Year-Over-Year Percentage Change in Health Care GDP Deflator Change

HEALTH CARE PRICES BY CATEGORY
Comparing June 2014 with June 2013, prescription drug price growth was the highest, at 4.1% (up from 3.6% last month and the highest rate since March 2012), followed by dental at 2.1% and hospital services at 1.9%. Physician price growth fell from 0.6% to 0.5%. Hospital price growth plays a dominant role in the HCPI due to its large spending weight, and its two-tenths drop in June helped to bring down the HCPI. Annual inflation rate com-parisons – June 2014 year over year versus June 2013 year over year – show a reversal from past months, where now price growth is higher for each category, except hospitals and dental care, for the recent year compared with a year earlier (Exhibit 3, with ad-ditional detail in Exhibit 4).
Price “momentum,” which highlights the latest 3 months of data (and may be a leading indicator), is mixed across the price categories, but substantially lower for hospitals, physicians and the aggregate HCPI. We could be in store for modest price growth in the near term.
Medicare and Medicaid prices usually grow more slowly than “other” prices (which include private payment). Hospital prices for Medicare and Medicaid patients rose by 1.8% and 0.1%, respectively (an increase of 0.2% from May for Medicaid, while Medicare held steady). For other patients, price growth fell to 2.6%, from 2.9% in May (data not shown). Analysts have been predicting higher prices from provider consolidation for some time, but this national data shows a narrowing of public vs. other price growth.
www.altarum.org
ALTARUM INSTITUTE Price Brief #14-08: June 2014 Data 2
-0.5% 0.0% 0.5% 1.0% 1.5% 2.0% 2.5% 3.0% 3.5% 4.0% 4.5%
Home health
Dental care
Nursing home care
Prescrip�on drugs
Physician services
Hospitals
June 2014 June 2013
Source: Altarum analysis of monthly BLS data
PRICES, SPENDING, AND UTILIZATIONTrends in health care utilization (and intensity) can be computed from the price data combined with Altarum’s monthly health spending esti-mates.1 s Exhibit 6 displays year-over-year growth rates in health care spending
broken out by price and utilization. The downward trend in health spending growth that began in 2002 was mainly due to declining uti-lization growth, followed by very low price growth, and now a more balanced mix of both factors. The readings for June 2014 are 4.2% spending growth and 2.5% utilization growth.
s Exhibit 7 shows per capita utilization growth through June and highlights the decline between 2002 and 2010 and its recent growth. Per capita utilization in June is rising at an annual rate of 1.7%, below its 12-month average of 2.3%; revised health care spending data show dramatically lower recent utilization growth, but this story may change when we get underlying spending data in September for the second quarter of 2014. On a 12-month average, utilization for hospi-tals has risen by 0.9%, home health has risen 3.6%, physician services has risen 3.6%, the prescription drug rate has risen 6.5%, nursing care has risen 0.7%, while dental utilization has declined by 2.7%.
DISCUSSION
In June 2014, the HCPI rose 1.7% above June 2013, a tenth lower than the May rate, although a fairly sharp increase from the first 3 months of 2014, averaging 1.1%. The 12-month moving average of 1.3% is only one-tenth above its historic low of 1.2%, achieved in March 2014, but this is the third month of increases for this series after steady declines since January 2012. Hospital price growth fell to 1.9% from 2.1% in May, and this was largely responsible for pushing the aggregate HCPI lower despite rapid prescription drug price growth. At 4.1% (up from 3.6% last month), it is the highest drug price growth reading since March 2012, and it follows negative growth as recently as July 2013. Price growth for the other categories showed little movement.
Signs abound of higher health care utilization as insurance coverage increases and the economy continues its slow expansion (although preliminary data for the second quarter of 2014, with a real GDP rise of 4.0%, contrasted markedly from negative growth in the first quarter).2 While the HCPI has risen from its recent (historic) lows, it remains well contained for now. Stingy public reimbursement rates and concerns over future low rates are, for now, keeping the lid on providers increasing their prices.3
Health care and economy-wide inflation are quite low for this stage of the business cycle recovery – June 2014 was the 60th month of econom-ic expansion following the recession. Nevertheless, while we don’t expect new price-growth lows in this cycle, we still seem to be a few months away from hitting the 2% growth rate that reigned for roughly 15 years before the HCPI hit 1.8% in November 2012.
1 Altarum Institute Spending Brief #14-08: June 2014 Data. Please note: The Spending Briefs cover all health care spending; this Price Brief covers only personal health care.2 Santangelo, Glen and Jeffrey Bailin (2014). Monthly Drug Tracker: June Rx Growth of 2.6% as Trend Begins to Normalize. Credit Suisse Equity Research, July 16. Available at: https://doc.research-and-analytics.csfb.com/docView?sourceid=em&document_id=x578424&serialid=7pkXpZqPfwNd9dnK8d%2fBXGdcjULUgF%2bBgytp5LbskOQ%3d 3 On August 4, the Centers for Medicare and Medicaid Services published the final rule for FY2015 Medicare Inpatient Hospital payment rates. They are projecting a net -0.6% cut to Medicare inpatient payments for fiscal year 2015, which begins on October 1, 2014.
Exhibit 3. Year-Over-Year Price Growth for Selected Health Categories
Follow us on Twitter: @ALTARUM_CSHS
Center for SuStainable HealtH Spending
www.altarum.org
ALTARUM INSTITUTE Price Brief #14-08: June 2014 Data 3
Source: Altarum analysis of monthly Bureau of Labor Statistics (BLS) dataNotes: Compares monthly prices with the same month from the previous year
Source: Altarum analysis of monthly BLS price data and Macroeconomic Advisers GDP dataNote: Lightly shaded bars denote recession periods
TIME SERIES TRACKERExhibit 5. Year-Over-Year Percentage Change in Health Prices Compared with the GDP Deflator
0%
1%
2%
3%
4%
5%
6%
7%
1990 1995 2000 2005 2010
Health Care Change GDP Deflator Change
PRICE GROWTH BY DETAILED CATEGORIESExhibit 4. Annualized Percentage Change in Prices for the Major Components of National Health Expenditures
Health care price index
Hospital care
Physician and clinical services
Prescription drugs
Nursing home care
Dental services
Home health care
Other professional services
Other personal health care
Other non-durable medical products
Durable medical equipment
2.0%
2.4%
1.1%
3.5%
1.2%
2.1%
0.5%
0.8%
2.0%
0.9%
1.7%
1.2%
1.9%
0.2%
0.1%
1.0%
3.6%
-0.2%
1.7%
2.5%
0.5%
-0.2%
1.7%
1.9%
0.5%
4.1%
1.0%
2.1%
0.7%
1.5%
2.6%
-1.0%
0.7%
Ending June2012
Ending June2013
Ending June2014
Altarum Institute is a 501(c)(3) nonprofit health care research and consulting organization. Altarum integrates independent research and client-centered consulting to deliver comprehensive, system-based solutions that improve health and health care.
The Center for Sustainable Health Spending (CSHS) was launched in 2011 to lead Altarum Institute’s research on investigating the cost growth trends and key drivers of U.S. health spending and to formulate policy strategies to help bend the cost growth curve.
The Health Sector Economic IndicatorsSM reports are a monthly publication of Altarum’s CSHS and provide an analysis of health spending, employ-ment, and prices. For more information, contact Charles Roehrig, PhD, at 734-302-4600 or [email protected]. Paul Hughes-Cromwick (principal author), George Miller, PhD, Ani Turner, and Matt Daly, PhD, contributed to this brief. Media Contact: Ken Schwartz, 571-733-5709, [email protected].
For more information, please visit www.altarum.org/cshs.
Center for SuStainable HealtH Spending

Exhibit 7. Year-Over-Year Change in Per Capita Personal Health Care Utilization
www.altarum.org
ALTARUM INSTITUTE Price Brief #14-08: June 2014 Data 4
0%
2%
4%
6%
8%
10%
12%
14%
1990 1995 2000 2005 2010
Price Component U�liza�on Component Health Care Spending
Source: Altarum calculations from Health Sector Economic Indicators dataNote: Lightly shaded bars denote recession periods
Source: Altarum calculations from Health Sector Economic Indicators dataNote: Lightly shaded bars denote recession periods
Methods. Altarum’s estimates for the monthly HCPI, a price index for personal health care spending within National Health Expen-ditures, are essentially monthly versions of the annual index developed by the CMS National Health Statistics Group (NHSG). The advantages of this measure over the medical care component of the consumer price index are well documented. Information on the CMS index is presented in: U.S. Department of Health and Human Services, National Health Expenditures Accounts: Methodology Paper, 2012-Definitions, Sources, and Methods, Washington, DC: Centers for Medicare & Medicaid Services, 2014. Retrieved from http://www.cms.gov/research-statistics-data-and-systems/statistics-trends-and-reports/nationalhealthexpenddata/downloads/dsm-12.pdf. The HCPI is calculated using BLS data on Producer Price Indices for hospital, physician, nursing home, and home health components, and Consumer Price Indices for prescription drugs, and other remaining items. Following NHSG, we use the GDP deflator rather than the Consumer Price Index as our measure of economy-wide inflation. While this brief focuses on prices, it also incorporates data from our spending brief and shows the power of looking at prices and spending together. In particular, it reveals the striking role of utilization in health spending growth trends.
-2%
-1%
0%
1%
2%
3%
4%
5%
6%
1990 1995 2000 2005 2010
Exhibit 6. Personal Health Care Spending Growth by Price and Utilization Components
Center for SuStainable HealtH Spending