center for demography and ecology - university of … · 2003-06-25 · center for demography and...
TRANSCRIPT
Center for Demography and Ecology
University of Wisconsin-Madison
A Four City Study of Black and White Spatial Isolation,1960-1980
Mario Sims
CDE Working Paper No. 96-24
A FOUR CITY STUDY OF BLACK AND WHITE SPATIAL ISOLATION,1960-1980
Mario Sims
Center for Demography and EcologyUniversity of Wisconsin-Madison
Room 4456 - Social Science Building1180 Observatory Drive
Madison, WI 53706-1393
September 1996
Research for this paper was supported by a grant for core support of population research from theNational Institute for Child Health and Human Development (P30 HD05876) to the Center fo rDemography and Ecology at the University of Wisconsin-Madison, while the author was a graduatetrainee in the center. The author is grateful to Franklin Wilson, Douglas Massey, Karl Taeuber, andJames Elliott for their helpful comments and suggestions.
Abstract
In this paper, I examine 1960 to 1980 trends in suburbanization and education segregation within the
black and white populations of four U.S. metropolitan areas. This analysi s provides a test of Wilson’s
(1987) social isolation thesis which claims that, during the 1960s and 1970s, middle-class black s
moved out of inner-city ghettos into suburbs, thereby isolating themselves from lower-class blacks.
Results show that support is found for Wilson’s thesis, in that highly educated blacks became more
suburbanized over time (more so than whites), and more spatially isolated from less educated blacks
than did highly educated whites from less educated whites over time.
1
Introduction
According to Wilson’s (1987) social isolation hypothesis, middle-class blacks, upo n
benefitting from affirmative action in employment in the 1960s and the Fair Housing Act of 1968 ,
moved out of inner-city ghettos away from lower-class blacks into other areas of central cities and
into the suburbs. Moreover, among other factors (i.e., the suburbanization of employment, th e
decline in manufacturing jobs, and the rise of the service economy), the out-migration of middle-class
families resulted in an isolated underclass that lived in ghettos lacking the resources, institutions, and
values necessary for success in a post-industrial society (Wilson, 1987).
In the context of testing Wilson’s (1987) thesis, this paper addresses two questions: (1) What
is the extent to which highly educated blacks increased their proportions in suburbs over time?, and
(2) What is the extent to which highly educated blacks increased their residential distance from less
educated blacks between 1960 and 1980? These questions are addressed by ref erencing changes from
a point before the legal basis of the civil rights revolution was established in the 1960s. For example,
we want to know if black education segregation was greater in 1980 than in 1960. Social status is
defined by measures of educational attainment. Analyses are derived from the 1960 and 198 0
decennial censuses on the spatial distribution of the black and white populations by education in a
case study of four cities. By testing Wilson’s thesis, I expect that as educational attainment increase,
suburbanization and segregation between education subgroups should increase as well.
The discussion is organized as follows. First, Wilson’s (1987) hypothesis is reviewed as it
pertains to the changing spatial relations among black social classes which have occurred over the last
thirty years. Second, a discussion of factors contributing to segregation between socioeconomi c
groups is provided. Third, the distinguishing features of the current analysis are reviewed. Fourth,
the methodology and results from an analysis of residential differentiation by education are provided.
2
Background
Wilson’s Social Isolation Hypothesis
Because of the racial residential segregation with which blacks were confronted in the 1940s
and 1950s, blacks of all social classes lived in closer physical proximity to one another than did white
social classes (Frazier, 1957). This means that because of discriminatory practices in the housin g
market and the racial prejudice blacks faced, middle-class blacks could not freely assert their clas s
status in a spatial manner by moving far away from lower-class blacks into better neighborhoods as
could middle-class whites from lower-class whites. In brief, racial-status determined the spatia l
mobility process for blacks, and it largely distinguished black class segregation from white clas s
segregation.
While the color of their skin confined blacks to segregated neighborhoods, Wilson (1987:7)
declares that, during the 1940s through the early 1960s, the very presence of middle- and working-
class blacks in inner-city neighborhoods provided social organization and economic stability for the
less advantaged blacks and the community as a whole. Social organization was manifested through
the maintenance of family values and social control which held together the black community (Wilson,
1987). Middle-class blacks provided economic stability to the black community, in that they were
able (through their financial resources invested in the local economy) to deflect neighborhood poverty
caused by economic dislocations (Wilson, 1987; Massey, 1990). In short, although all black classes
were confined to restrictive covenants by way of discriminatory practices in the housing market ,
middle-class blacks served the black community through their occupations and their presence as role
models for lower-class youths in particular, according to Wilson (1987).
However, the structural shifts in the U.S. economy during the 1970s (e.g ., the suburbanization
of employment, the closing of central city factories, and the mechanization of production), worsened
the economic conditions of lower-class blacks, because they were left without meaningful jobs or the
3
skills necessary to undergo economic success in a post industrial society. More important, th e
implementation of civil rights legislation in housing and employment in the 1960s, and the increased
number of blacks who attained secondary education and higher incomes during the same perio d
contributed to the growth of the black middle-class. As a result, this black middle-class was able to
spatially isolate itself from lower-class blacks who inhabited the core inner-city ghettos. This exodus
left less advantaged blacks with no role models or job contacts, and it left inner-city ghettos without
the social organization and economic stability they had during the 1940s and 1950s. Overall, th e
structural changes in the economy and the exodus of the middle-class blacks contributed to th e
worsening conditions of lower-class blacks who eventually grew into the urban underclass (Wilson,
1987).
Factors That Contribute to Class Segregation
Other than changes in housing legislation and the subsequent growth of the black middle -
class, other factors may have contributed to changes in black class segregation over time as well. For
example, households with high socioeconomic status (SES) might elect to live in neighborhoods with
people of similar prestige and status, where social and job contacts are established, and certain values
are reinforced (Reich, 1991). Guest (1977) refers to this form of segregation as “personalistic,” in
that individual desires determine where a household lives. High-status families might also prefer to
live in areas with higher quality and more spacious housing, better schools, more recreationa l
facilities, and safer environments than found in inner-city neighborhoods where members of certain
groups initially settled (Wilson, 1979). Guest (1977) refers to this type of segregation a s
“nonpersonalistic,” because such factors as family cycle, neighborhood amenities, and morphology
of the city influence the extent to which classes live apart. In the end, high-status households live in
better neighborhoods, while low-status households (who cannot afford housing packages an d
4
nonresidential amenities found in high-status areas) are more likely to live in neighborhoods plagued
by harsh social and economic conditions (Massey, 1990).
Racial discrimination [characterized as “personalistic segregation” by Guest (1977)] in th e
housing market might also contribute to varying levels of class segregation within racial groups. For
instance, middle-class blacks are more likely to be steered to neighborhoods closer to lower-clas s
blacks than middle-class whites are to lower-class whites (Massey and Denton, 1993). Consequently,
the extent to which middle-class blacks are segregated from lower-class blacks is smaller than that
among whites. Wilson (1987) mainly discussed racial discrimination as a factor that differentiated
black and white social class segregation in the 1940s and 1950s, before the black middle-clas s
“exodus.”
Overall, quality of a neighborhood, size of housing, quality of schools, recreational facilities,
safety, and discrimination in the housing market influence the degree to which classes are segregated
from each other in the urban landscape. These factors, in addition to changes in housing legislation
and the growth of the black middle-class, could have also contributed to the changes in the spatial
distribution of black population between the mid-1960s and the 1980s. Thus, Wilson’s (1987 )
inclusion of these factors could have strengthened his discussion of the changes in black clas s
segregation. The fact remains that racial-status continues to be the strongest factor that differentiates
black class segregation from that among whites.
In fact, research confirms that racial-status is a central reason black class segregation differs
from that among whites, as well as other groups. Erbe (1975) concluded that middle-class black s
were likely to live in neighborhoods with many impoverished blacks, thus losing one of the benefits
of status that accrues to prosperous whites. Similarly, 15 years later Massey and Eggers (1990 )
found that, because of their racial-status, the degree of class segregation among blacks was not as
extensive during the 1970s as that among whites, Hispanics, and Asians.
5
Current Analysis
Central to this analysis is Wilson’s claim that black suburbanization and class segregatio n
increased between the mid-1960s and 1980 to a point where residential contact between blac k
socioeconomic groups was minimal, and they were therefore isolated from one another. In testing
Wilson’s argument, this paper examines white class segregation as a reference to gauge the extent
and change in black suburbanization and education segregation. Comparing black and white spatial
inequality between 1960 and 1980 allows us to appreciate the degree of change blacks underwent.
Although class divisions were well established in the black community during the 1940s and 1950s,
middle-class blacks could not place as much spatial distance between themselves and lower-clas s
blacks as could middle-class whites from lower-class whites (Frazier, 1957). Therefore, if changes
in suburbanization and segregation among blacks and whites are of similar magnitude and in the same
direction, then claims of a large change among blacks since the 1960s would be less plausible. Using
segregation in 1960 as a baseline, allows us to evaluate the magnitude of changes in suburbanization
and education segregation associated with the passage of antidiscrimination laws in housing during
the 1960-1980 period. This broader time span provides a more complete temporal analysis tha n
studies that only use the 1970 decade, and it places us at a point in time when, according to Wilson,
the black community was more cohesive and socially organized.
Data and Methods
Data from the 1960 and 1980 census tract series of the U.S. Census of Population an d
Housing files (U.S. Bureau of the Census 1962, 1983) are utilized. The Atlanta, Chicago, Houston,
and Philadelphia Standard Metropolitan Statistical Areas (SMSAs) are analyzed because each ha d
large black populations in 1980 of over 400,000, and each is located in a different geographica l
region. The unit of analysis is a census tract, which is a geographic unit with approximately 4,000
people. In order to ensure tract and county comparability over time, 1980 tracts were matched with
ND 100 ( YsCXc XcCYs) (1)
6
1970 tracts, and those of 1970 were matched with 1960. Also, counties that were not in particular
SMSAs in 1960, but were in 1980, were added to the 1960 distribution to attain county consistency.
Social status is measured based on levels of educational attainment of persons 25 years and older ,
because, according to Massey, Condran, and Denton (1987), blacks are more able to translate high
levels of educational attainment than income into spatial mobility. The 1960 education categories are
adjusted to approximate 1980 categories. Those categories include elementary: 0 to 4 years, 5 to 7
years, and 8 years; high school: 1 to 3 years, and 4 years; college: 1 to 3 years, and 4 years or more.
In order to fully test Wilson’s social isolation thesis, the extent of black and whit e
suburbanization, and the extent to which black and white education segregation changed over time
are examined. The extent of suburbanization is measured in two phases. The first measures it as the
percentage of black and white education classes that lived in the suburban rings in 1960 and 1980,
and how their distributions changed over time. The second phase, called the index of net difference,
measures suburbanization as the likelihood that highly educated blacks and whites live in the suburbs
versus the central cities of each metropolitan area. This index is traditionally used in studies tha t
measure inequality between socioeconomic categories (see Lieberson, 1975), however, in this study
it is used to measure the degree of spatial advantage between the central city and suburban ring that
is attained by highly educated blacks and whites. The index of net difference is defined as:
where Y and X are the proportions of black/white education groups in the suburban ring (s) ands c
central city (c), and CY and CX are the cumulative proportions of black/white education groups ins c
the suburban ring and central city of each SMSA, respectively. Index of net difference scores range
from 100 to -100, where 100 means that the suburban ring is more likely to be inhabited by highly
educated black or whites than the central city, and -100 means that the central city is more likely to
Dxy .5 (xi/X) (yi/Y) (2)
7
be inhabited by highly educated blacks or whites than the suburban ring. Since Wilson’s (1987 )
hypothesis asserts that blacks moved out of central cities into suburbs between the mid 1960s an d
1980, the 1980 extent and the 1960 to 1980 change net difference scores are discussed.
Finally, education segregation is measured by the index of dissimilarity (D), which measures
the evenness of education groups across census tracts. This index is defined as:
where x and y equal the tract-level education numbers, while X and Y are the city-wide totals. Thisi i
symmetrical index ranges from zero (no segregation) to one (complete segregation), and it gives the
proportion to which two classes would have to shift tracts in order to obtain an equal distribution of
the two groups, which is no segregation. Since Wilson’s hypothesis centers around the changin g
spatial distributions between middle- and lower-class blacks, black and white education segregation
scores are analyzed comparing the residential separation between college graduates and above and
every other education group.
Results
Black and White Suburbanization
Wilson (1987) claimed that changes in housing and employment legislation enabled middle-
class blacks to move from the central cities to the suburbs. Thus, the first step in testing his thesis
involves examining the extent of suburbanization, which has two components: 1) the percentage of
suburbanization, and 2) the likelihood of living in the suburban ring rather than the central city.
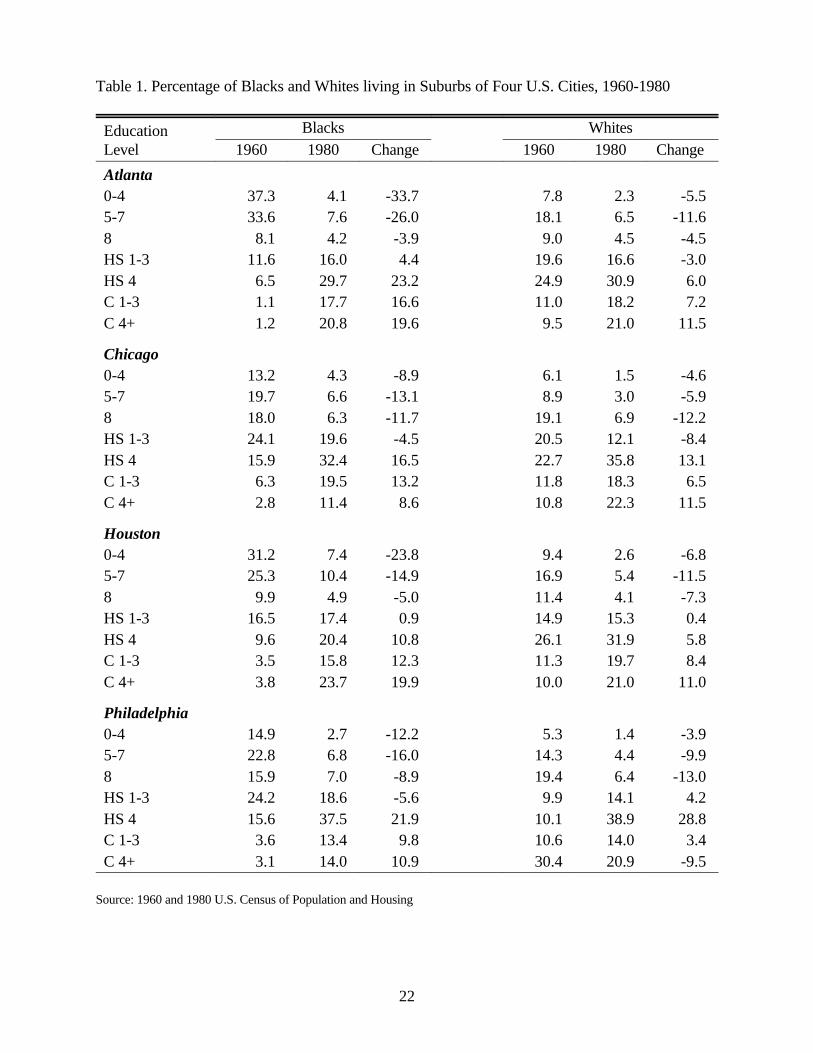
The first component is examined in table 1, which presents the percentages of black and white
educational attainment groups in the suburban rings of each metropolitan area for 1960, 1980, and
changes between 1960 and 1980. These results suggest that suburbanization could have resulte d
from a number of possible outcomes: central city-to-suburban ring movement, natural increase in the
8
population sizes of educational attainment groups in the suburban ring, or intermetropolitan migration
of highly educated groups from other SMSAs to any one of our four case study cities’ suburban rings.
The 1960 columns for blacks and whites reveal that whites lived in the suburbs more than did
blacks. The uneven 1960 distribution for blacks may be due to the fact that during this time thei r
population consisted of more less educated than highly educated blacks, because of the lack o f
educational opportunities brought on by racism in society. This skewed distribution may also be a
result of blacks living in nonmetropolitan areas, which in 1960 were defined as the suburban rings of
each city. This phenomenon is more striking for blacks with zero to seven years of schoolin g
completed in Atlanta (70.9 percent) and Houston (56.5 percent).
[Table 1 about here]
For 1980, the pattern is reversed: highly educated blacks were more suburbanized than less
educated blacks in all four SMSAs. This is a finding we would expect given the changes in th e
educational and occupational structures that occurred during the late 1960s and 1970s, which enabled
a growing black middle-class to increase in size in the suburbs, though not to the extent highl y
educated whites did. Black high school graduates were more suburbanized than the remaining groups
in each SMSA: Atlanta (29.7 percent), Chicago (32.4 percent), Houston (20.4 percent), an d
Philadelphia (37.5 percent). This phenomenon also occurred among the white populations in each
SMSA (see white section, 1980 column).
The findings in the change column are more pertinent to our testing of Wilson’s argumen t
which claims that middle-class blacks became more suburbanized over time. Within all metropolitan
areas, highly educated blacks became more suburbanized than did less educated blacks (i.e., thos e
with at least three years of high school completed and below) between 1960 and 1980. Blacks with
four years of high school completed and beyond increased their suburban populations more in Atlanta
(59.4 percent - this number is derived by adding together the values for HS 4, C 1-3, and C4+ )
9
followed by Houston (43.0 percent), Philadelphia (42.6 percent), and Chicago (38.3 percent). A
closer examination of intermetropolitan differences reveals that black college graduates in the south
became more suburbanized over time (Houston-19.9 percent, and Atlanta-19.6 percent) than those
in the north (Philadelphia-10.9 percent, and Chicago-8.6 percent). These findings suggest that highly
educated blacks in the southern cities were more able to match their high-status with residence in the
suburbs than were highly educated blacks in northern cities.
Regarding comparisons between black and white changes, highly educated blacks increased
their populations in the suburbs more so than did highly educated whites. The small 1960 to 1980
changes in white suburbanization might have occurred because whites had become largel y
suburbanized prior to 1960 (see the change column under the white section) more so than did blacks.
Overall, the percentages for the black population are consistent with Wilson’s claim that middle-class
blacks became more suburbanized over time as a result of housing legislation and employmen t
opportunities that enabled them to purchase homes in suburbs. As mentioned above, the percentage
of blacks and whites living in the suburbs captures more than the possibility of movement from the
central city to the suburban ring, which is central to Wilson’s argument. For this reason, we now turn
to our second phase in measuring the extent of suburbanization, the index of net difference, which
specifically captures the central city-suburban dichotomy.
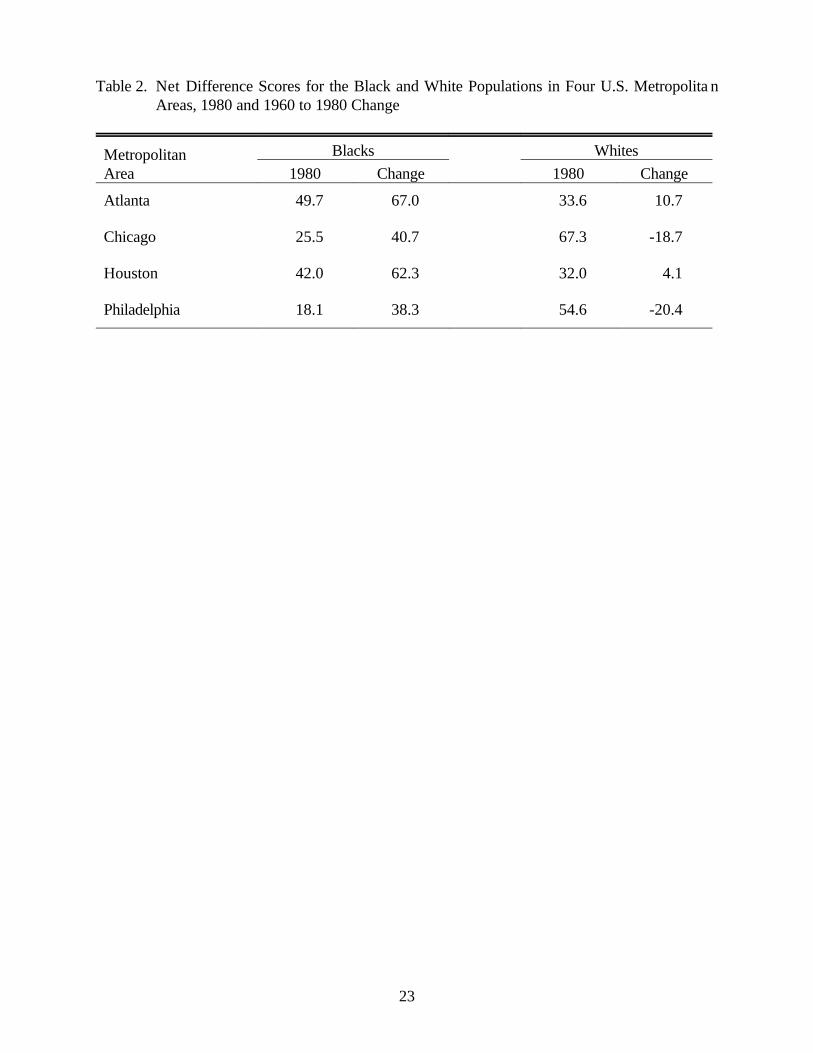
Table 2 presents the net difference scores for blacks and whites in each city for the 1980 and
1960 to 1980 periods. In 1980, within each SMSA, the suburban ring had a greater probability of
being inhabited by highly educated blacks than the central city. More specifically, highly educated
blacks in Atlanta and Houston had a greater chance of living in the suburbs (at 49.7 percent and 42
percent, respectively) than did blacks in Chicago (25.5 percent) and Philadelphia (18.1 percent). The
change column shows that, over time, highly educated blacks in Atlanta and Houston had a greater
chance of living in the suburbs (at 67 percent and 62.3 percent respectively) than blacks in Chicago
10
and Philadelphia (at 40.7 percent and 38.3 percent respectively). This means that the process of black
suburbanization was more apparent in the two southern cities than in the northern ones. Thes e
findings are consistent with patterns of increased black suburbanization we saw in table 1.
[Table 2 about here]
The values for the white population show that highly educated whites had a greater chance
of living in the suburbs than in the central cities of each metropolitan area in 1980, but greatest i n
Chicago, at 67.3 percent. Their change scores reveal that between 1960 and 1980, highly educated
whites in Chicago and Philadelphia had a greater probability of living in the suburbs in 1960 than in
1980 (-18.7 and -20.4 percent respectively), whereas in the southern cities, they had a greater chance
of living in the suburbs than central cities in 1980 than in 1960.
Overall, highly educated blacks displayed a greater probability of living in the suburbs than
whites between 1960 and 1980. Blacks in Atlanta and Houston especially displayed a greater chance
of living in the suburbs than in the central cities compared to whites. These indices reinforce those
findings in table 1, in that highly educated blacks showed the greatest chance of suburbanizatio n
compared to whites. They also demonstrate that suburbanization occurred because groups moved
from the central city to the suburbs, unlike the percentages found in table 1. In brief, support is found
for Wilson’s (1987) claim that highly educated blacks increased their population sizes in the suburbs
more than less educated blacks as well as whites, between 1960 and 1980. However, the following
question remains: how extensively did highly educated blacks segregate themselves from les s
educated blacks over time? This question is addressed below.
Levels and Trends in Education Segregation
This segment analyzes the final component of my evaluation of Wilson’s social isolatio n
thesis: the claim that middle-class blacks increased their residential distance from lower-class blacks.
For this reason, segregation indices were computed comparing the residential distance betwee n
11
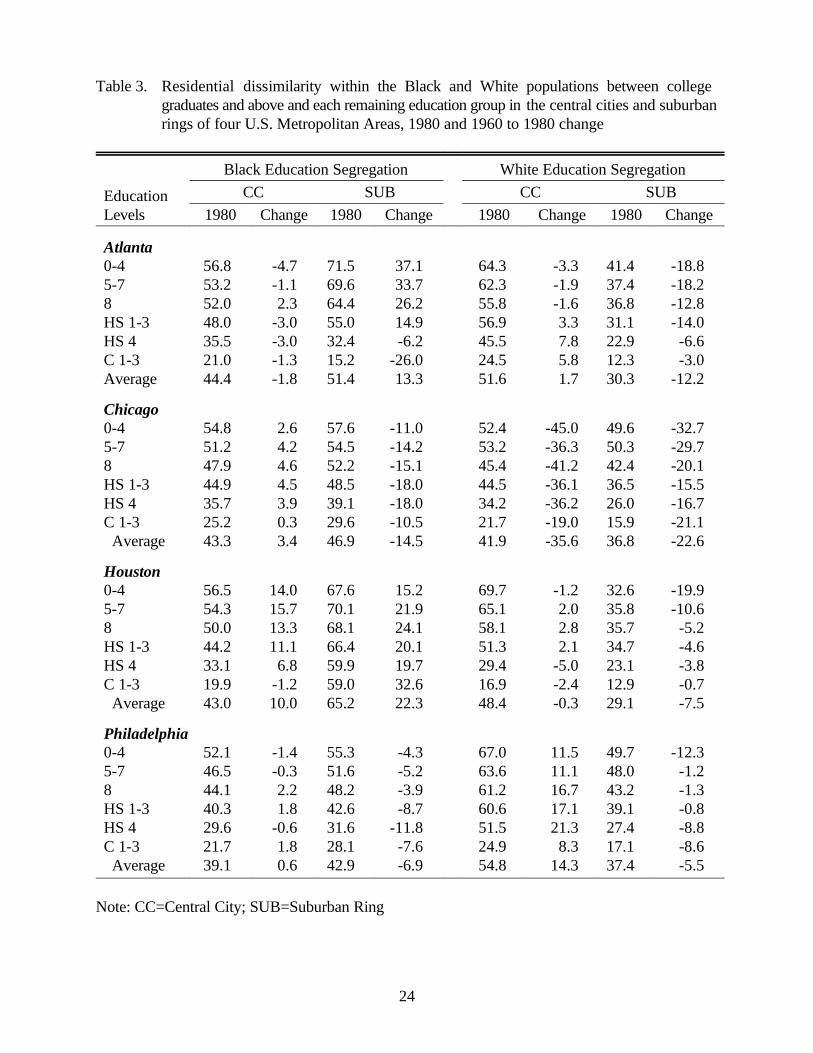
college graduates and above and each remaining education group. Table 3 presents the extent o f
black and white spatial distance in 1980 and how they changed between 1960 and 1980. Education
segregation, as measured by the index of dissimilarity, is evaluated at the central city and suburban
ring levels. The discussion of these findings proceeds as follows. First, within each SMSA, central
city and suburban segregation are compared first for blacks and then for whites. Second, black (and
then white) education segregation is compared across SMSAs. Throughout the discussion of these
findings, I will primarily focus on the segregation indices between extreme education groups (i.e. ,
those with zero to seven years of schooling completed and college graduates and above). Whe n
necessary, I will discuss the segregation values between those with four or more years of college and
other education classes.
[Table 3 about here]
Focusing on the Atlanta SMSA, black education segregation in 1980 between colleg e
graduates and those with at least four years of schooling completed is greater in the suburban ring
(71.5 percent) than in the central city (56.8 percent). These values mean that in the suburbs, 71.5
percent of either black college graduates or those with at least four years of schooling complete d
would have to shift census tracts in order to attain complete residential integration or zer o
segregation, while in the central city, 56.8 percent of those same groups would have to shift tracts
to eliminate segregation. According to Kantrowitz (1973), dissimilarity indices between 0 and 30 are
low, those between 30 and 60 are moderate, and values 60 and above are considered high. By these
standards, extreme black education groups were highly segregated from each other, but more so in
the suburban ring than in the central city. Suburban black college graduates were also mor e
segregated from other less educated blacks than in the central city (compare the first half of the 1980
columns under black education segregation). In addition, the average extent to which black college
graduates were segregated from all other groups is greater in the suburban ring (51.4 percent) than
12
in the central city (44.4 percent). Regarding the 1960 to 1980 changes in black educatio n
segregation, black college graduates, on average, increased their residential distance from othe r
groups in the suburbs (13.3 percent), while those in the central city decreased their distance (-1. 8
percent).
While black college graduates were more segregated from other blacks in the suburbs than
in the central city, white college graduates on average were more segregated in the central city (51.6
percent) than in the suburbs (30.3 percent). This pattern is reinforced by white extreme education
segregation. Changes in white segregation reveal that the spatial distance between white colleg e
graduates and less educated whites was greatly reduced, more in the suburbs than in the central city
(compare the central city and suburban ring change columns).
The Chicago panel reveals that the 1980 extent to which black college graduates wer e
segregated from every other black education group was slightly greater in the suburban ring than in
the central city (compare the pairwise indices in the 1980 central city and suburban ring columns and
the corresponding average values). On average, 46.9 percent of either college graduates or al l
education groups would have to shift tracts in the suburbs to eliminate segregation, while 43. 3
percent of those same groups would have to change residence in the central city, in order to attain
residential integration. Although black college graduates were more segregated from others in the
suburbs than in the central city, segregation values are considered high in both places. Considering
the changes in black education segregation in Chicago, the spatial distance between college graduates
and other groups declined in the suburbs (14.5 percent) and slightly increased in the central city (3.4
percent).
Regarding white Chicagoans, the average 1980 extent of education segregation was greater
in the central city (41.9 percent) than in the suburban ring (36.8 percent), a pattern opposite that of
blacks. While the average white education segregation between college graduates and other groups
13
substantially declined in the central city (35.6 percent) and suburban ring (22.6 percent), it declined
more in the central city.
Within the Houston SMSA, we see that the average extent of black education segregation was
greater in the suburban ring (65.2 percent) than in the central city (43.0 percent). For the most part,
black college graduates in the suburban ring were highly segregated from the remaining groups, while
in the central city they were moderately segregated from each other. For instance, black colleg e
graduates in the suburbs were segregated from blacks with 5 to 7 years of schooling by an index of
70.1, while college graduates in the central city were segregated from blacks with 5 to 7 years o f
schooling by an index of 54.3. The change columns show that black education segregation increased
between 1960 and 1980.
White education groups lived closer to each other in the suburban r ing of Houston (29.1) than
they did in the central city (48.4), as shown in the average row in the white section. White college
graduates were moderately to highly segregated from less educated whites in the central city, while
in the suburban ring their segregation indices were in the low to moderate range. The change sections
reveal that, on average, white education segregation slightly declined in the suburban ring (7. 5
percent) and central city (0.3 percent).
The values for the Philadelphia SMSA show that the average 1980 extent of black education
segregation was slightly greater in the suburban ring (42.9 percent) than in the central city (39. 1
percent). Like blacks in Chicago, the disparity between suburban and central city segregation was
not great. An examination of the change scores for the black population reveal that, on average ,
education segregation barely increased in the central city and slightly decreased in the suburban ring.
On average, white education segregation was greater in the central city of Philadelphia (54.8)
than it was in the suburban ring (37.4). Like the situation in the other cities, white college graduates
lived in closer residential propinquity to other groups in the suburbs than in the central city. Not only
14
was central city education segregation among whites more extensive than that in the suburban ring,
but it also increased by 14.3 percentage points between 1960 and 1980 in the central city and i t
slightly decreased over time in the suburban ring by 5.5 percentage points.
Within each metropolitan area, an interracial pattern emerged: white central city education
segregation was greater than black central city education segregation, and black suburban rin g
segregation was greater than that among whites. Additionally, 1960 to 1980 changes in central city
segregation were greatest for blacks (3.05, derived by taking a pooled average of change scores for
blacks in all SMSAs) than for whites (-4.98), whereas changes in suburban segregation were greater
for blacks (3.55) than for whites (-11.95). These values suggest that, over time, black colleg e
graduates were able to increase the residential distance between themselves and other blacks in the
central city and suburban ring more so than were white college graduates from other white education
groups in the central city and suburban ring.
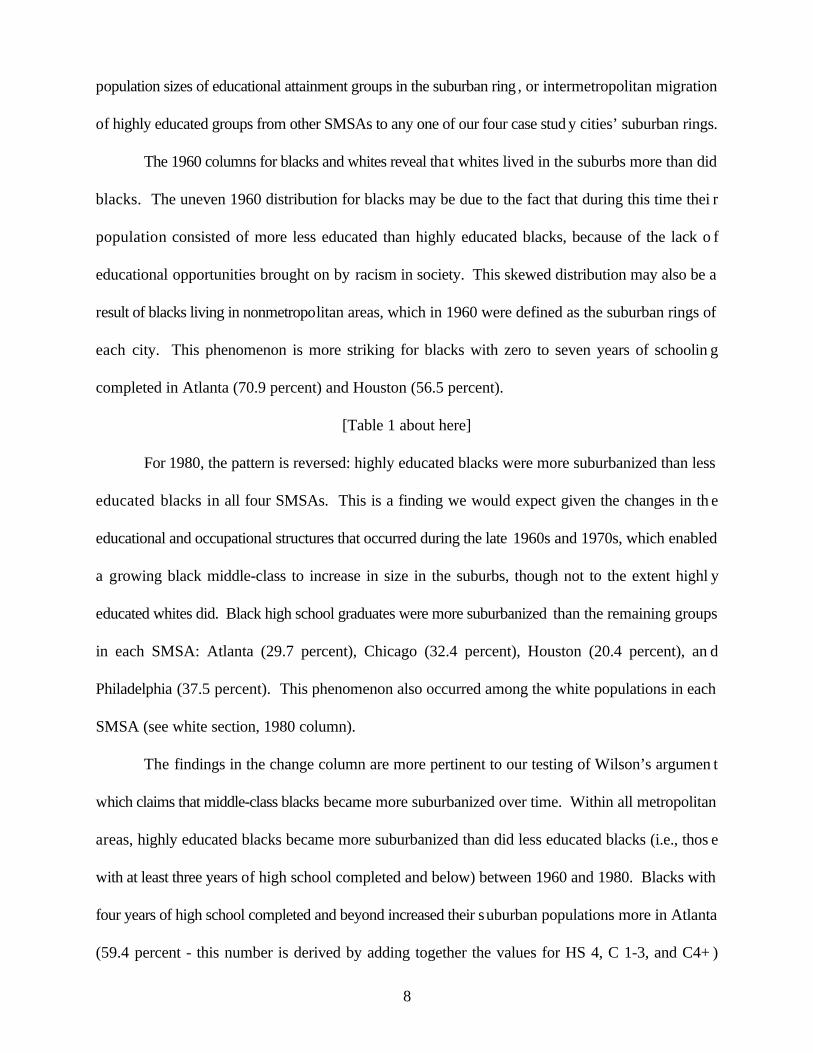
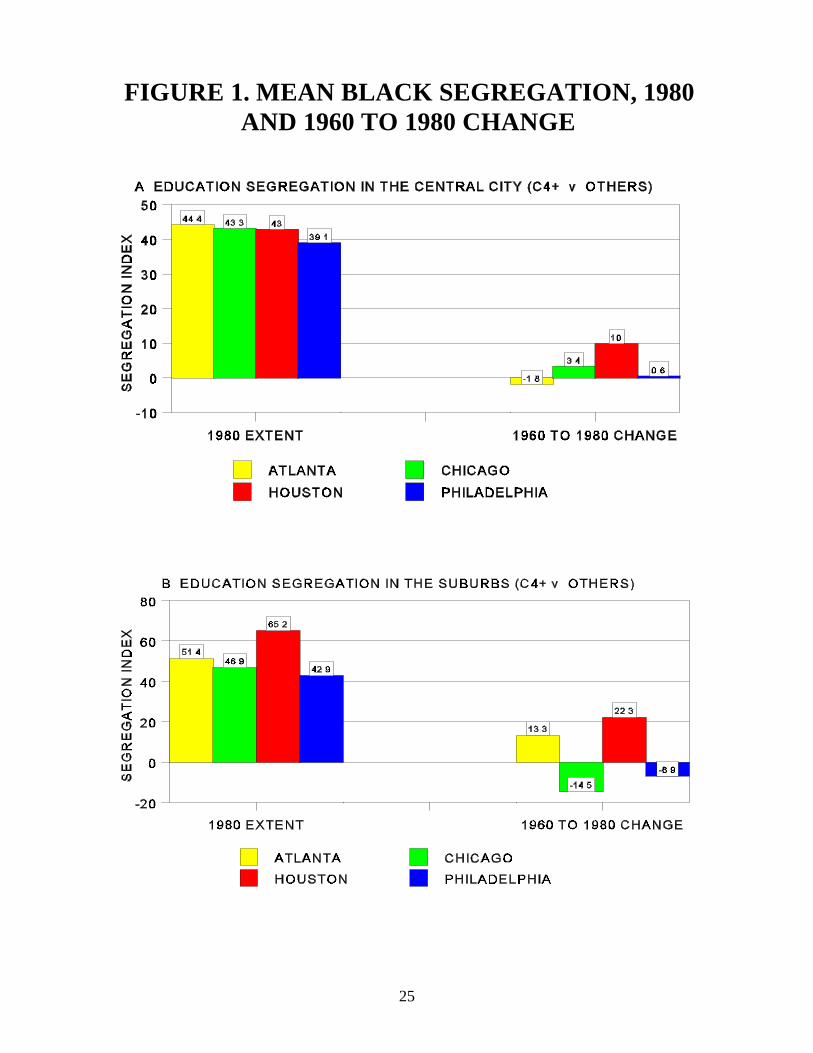
Intermetropolitan differences emerged among the black population. Figure 1 presents th e
1980 and 1960 to 1980 changes in mean education segregation among blacks. Panel A shows that
the 1980 extent of central city education segregation was similar across cities; however, it wa s
greatest in Atlanta, at 44.4 percent. The greatest change in spatial separation occurred in Houston,
at 10 percentage points. Panel B compares black suburban segregation across each city. The extent
to which black college graduates were segregated from other blacks was greatest in the two southern
SMSAs. Moreover, Atlanta and Houston experienced increases in suburban segregation, whil e
Chicago and Philadelphia underwent declines in the spatial separation between college graduates and
other blacks. These results suggest that there was more spatial mobility among the black population
in suburban rings of the southern SMSAs than in the northern cities.
[Figure 1 about here]
15
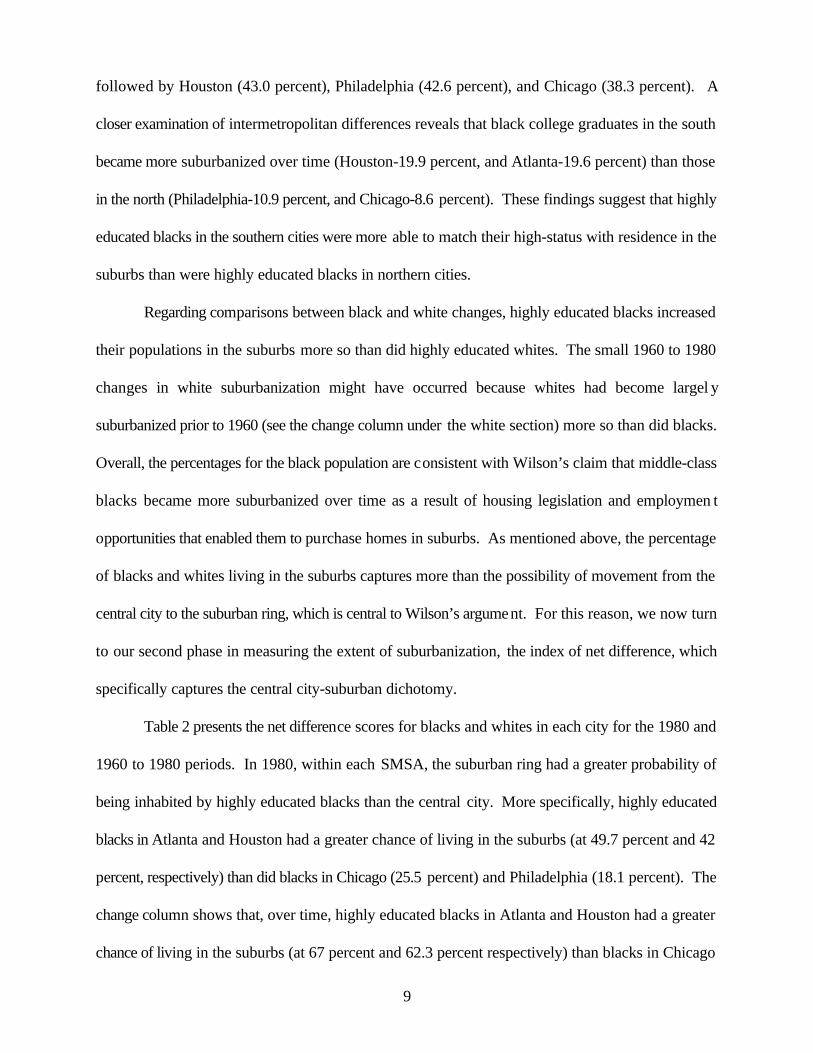
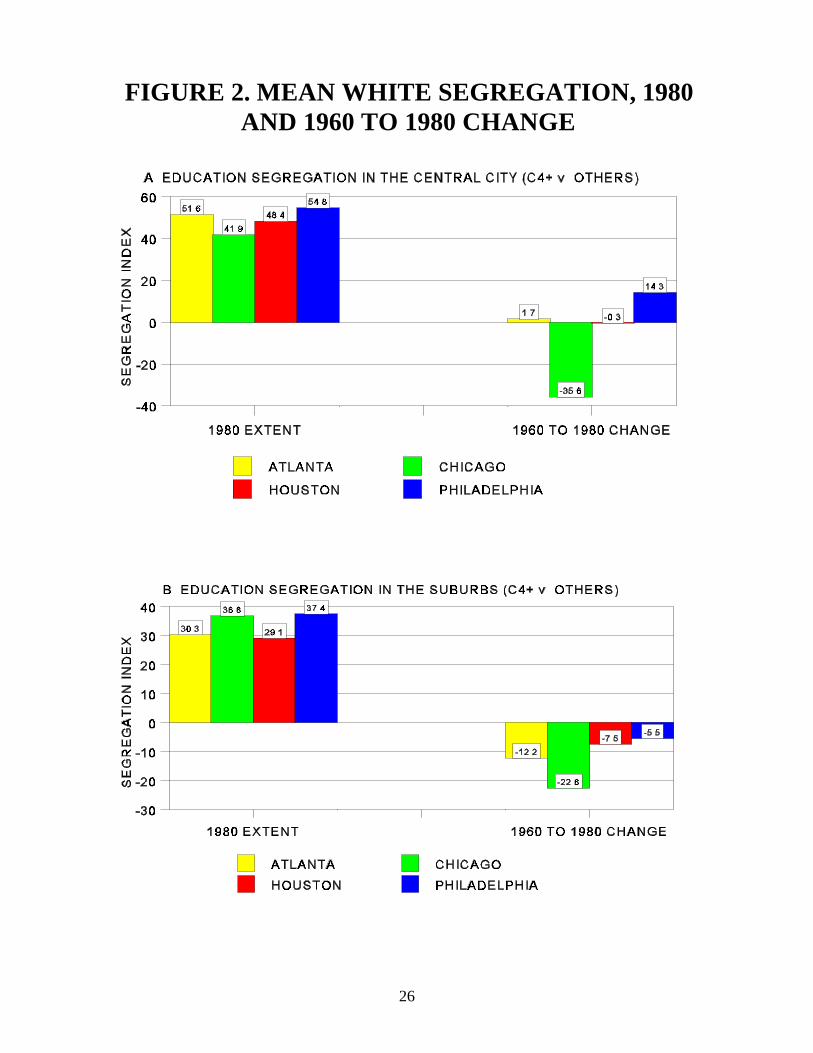
Figure 2 compares the mean extent and change in education separation among whites across
all cities. Overall, white central city segregation was moderate in all cities, but greatest in Atlanta and
Philadelphia (see panel A). Interestingly, the greatest changes in the segregation between whit e
college graduates and other whites took place in Chicago (-35.6 percent) and Philadelphia (14. 3
percent). The substantial decline in Chicago may be due to the gentrification process that occurred
in the central city, which enabled middle-class whites to move closer to lower-class whites thereby
decreasing the segregation between themselves (Nelson, 1988). Panel B reveals that although white
college graduates were moderately segregated from other education groups in all cities, they were
more segregated in northern cities than in the south. The segregated nature of northern cities might
contribute to this regional difference, in that the north is characterized by more spatial and social
[Figure 2 about here]
inequality than the south (Massey and Eggers, 1993), which are likely to influence highly educated
whites to place more distance between themselves other whites than in the south. Finally, regarding
changes in white suburban education segregation, there were declines in all metropolitan areas, but
they were greater in Chicago (22.6 percent) than the remaining cities.
This final component of my test of Wilson’s (1987) thesis, that middle-class black s
substantially increased the residential distance between themselves and lower-class blacks over time,
provides support for his claim. Black education segregation substantially increased between 1960
and 1980, particularly in the suburban rings of the southern metropolitan areas. Black colleg e
graduates were able to place more residential distance between themselves and other blacks than were
white college graduates from other whites during the period under study, especially in the suburbs.
16
Summary and Conclusions
In the context of evaluating Wilson’s (1987) social isolation thesis, we have addressed two
questions: (1) Did highly educated blacks become more suburbanized over time?, and (2) Did highly
educated blacks increase their spatial distance from less educated blacks?
The first question involved two measurements of suburbanization. The first procedure, which
captured the percentage of groups in the suburbs, found that highly educated blacks increased their
population sizes in the suburban rings of each metropolitan area, as Wilson (1987) claimed .
Suburbanization of high-status blacks was especially high for those in Atlanta and Houston. Since
whites were highly suburbanized prior to the 1960 decade, black suburbanization increased more than
did white suburbanization between 1960 and 1980.
The second component of suburbanization also found support for Wilson’s thesis, in tha t
highly educated blacks had a greater chance of living in the suburbs than in the central cities in 1980
and between 1960 and 1980. They were more suburbanized than highly educated whites as well .
This segment of the analysis provided an extension to the first question, in that we learned that the
process of suburbanization was due to residential movement of blacks and whites from the central
cities rather than natural increase of populations, or intermetropolitan migration into the suburbs of
these case study cities.
Finally, concerning the second question, support again is found for Wilson’s (1987) socia l
isolation hypothesis, in that highly educated blacks substantially increased the spatial distance between
themselves and less educated blacks, as shown by trends in education segregation. In addition, black
college graduates and above increased their residential distance from other black education groups
more than did white college graduates and beyond, especially in the southern suburbs. For thi s
reason, more support is found for Wilson’s argument in the suburban rings of the southern SMSAs
17
than in the northern ones, where all blacks were likely to face more segregated environments an d
restrictions to residential movement (Massey and Denton, 1993).
These findings suggest that with the passage of antidiscrimination laws and the elimination
of barriers in the housing market, blacks whose resources enabled them to live elsewhere in th e
central city or the suburban ring did so. Extensive black suburban class segregation indice s
(especially in the two Southern SMSAs) mean that highly educated blacks were able live far from less
educated blacks, and suburban blacks with some college and beyond were more spatially isolate d
from other blacks than they were in central cities. However, in Chicago and Philadelphia, blacks lived
in closer proximity to each other in the central cities and suburban rings than in Atlanta and Houston.
The ecological nature of these two older, northern cities (which are highly segregated by race) may
heavily influence where black social classes live in relation to each other. In addition, the high black-
white segregation these cities face (see Massey and Denton, 1993; Farley and Frey, 1994) might have
affected the extent to which high-status blacks were able to place residential distance betwee n
themselves and lower-status blacks. For example, if northern blacks were confronted with fewe r
housing opportunities, brought on mainly by racial discrimination, then high-status blacks are likely
to face barriers in their attempts to spatially segregate themselves from low-status blacks as well. By
contrast, if southern blacks experience greater opportunities in the housing market, then high-status
blacks are likely to move into more exclusive areas than other blacks, thereby isolating themselves
from low-status blacks more so than in the north.
While overall support was found for Wilson’s (1987) thesis, his study should have included
regional comparisons in black social-status segregation. He might have perhaps found, as this study
did, that high-status blacks in the south were able to place more distance between themselves an d
low-status blacks than in the north. Instead, his focus was mainly on the city of Chicago and other
18
northern urban areas that were hit hardest by structural changes in the U.S. economy over the past
thirty years.
Whereas we understand that black education segregation increased because high-status blacks
were able over time to translate their status into movement away from low-status blacks, we must
also understand why white education segregation largely decreased across SMSAs. This decline may
be associated with less educated whites moving into neighborhoods closer to more educated whites
between 1960 and 1980. This decrease might also be related to the process of gentrification that has
taken place over time, whereby high-status whites have moved back into the central cities closer to
low-status whites (Nelson, 1988). This reduction in white segregation (primarily in Chicago an d
Houston, where Hispanics in 1980 were highly represented) might also be associated with th e
changing size and growth of white Hispanics (Bean and Tienda, 1987). Hispanic class segregation
levels might have declined over time, which would in turn result in a decline in white educatio n
segregation. Finally, this decline may be related to a diversity of white ethnic groups who hav e
moved closer to other white ethnics in the suburbs of all four cities , and in the central city of Chicago.
Clearly, this issue is worth further study.
This paper not only finds support for Wilson’s (1987) social isolation hypothesis, but it also
contributes to the social isolation debate in the following ways. The inclusion of 1960 census data
enabled us to learn that, although the black community before the mid-1960s was less spatiall y
segregated by social class (Frazier, 1957; Wilson, 1987), over time its high-status blacks have been
able to assert their class in a spatial manner by moving out of central cities into the suburbs and hence
increasing their residential distance from low-status blacks. Substantial increases in black education
segregation mean that although racial-status still influences where high-status blacks live, it ha s
become less important than in the 1940s and 1950s in determining the extent to which they segregate
themselves from less educated blacks.
19
In the final analysis, to better understand changes in black spatial inequality, we coul d
compare them with socioeconomic segregation within the Hispanic and Asian populations i n
multiethnic metropolitan areas. Including such groups would enable us to understand the extent to
which antidiscrimination laws in housing have and have not benefitted the higher-status segments of
all minority groups. This approach would enable us to extend a test of Wilson’s (1987) socia l
isolation thesis to include other groups.
20
References
Bean, Frank B. and Marta Tienda. 1987. The Hispanic Population of the United States. New York:Russell Sage Foundation.
Erbe, Brigitte Mach. 1975. “Race and Socioeconomic Segregation.” American Sociological Review40:801-812.
Farley, Reynolds, and William H. Frey. 1994. “Changes in the Segregation of Whites From BlacksDuring the 1980s: Small Steps Toward A More Integrated Society.” American SociologicalReview 59:23-45.
Frazier, E. Franklin. 1957. Black Bourgeoisie: The Rise of the New Middle Class in the UnitedStates. New York: Collier Books.
Guest, Avery. 1977. “Residential Segregation In Urban Areas.” In Contemporary Topics In UrbanSociology. New Jersey: General Learning Press.
Kantrowitz, Nathan. 1973. Ethnic and Racial Segregation in the New York Metropolis. New York:Praeger.
Lieberson, Stanley. 1975. “Rank-Sum Comparisons Between Groups.” Pp. 276-91 in SociologicalMethodology 1976 edified by David Heise. San Francisco, Ca: Jossey-Bass.
Massey, Douglas S. 1990. “American Apartheid: Segregation and the Making of the Underclass. ”American Journal of Sociology 96:329-58.
Massey, Douglas S., Gretchen A. Condran, and Nancy A. Denton. 1987. “The Effect of ResidentialSegregation on Black Social and Economic Well-being.” Social Forces 66:29-56.
Massey, Douglas S., and Nancy A. Denton. 1993. American Apartheid: Segregation and the Makingof the Underclass. Massachusetts: Harvard University Press.
Massey, Douglas S., and Mitchell L. Eggers. 1990. “The Ecology of Inequality: Minorities and theConcentration of Poverty 1970-1980.” American Journal of Sociology 95:1153-88.
. 1993. “The Spatial Concentration of Affluence and Poverty During the 1970s.” UrbanAffairs Quarterly 29:299-315.
Nelson, Kathryn P. 1988. Gentrification and Distressed Cities: An Assessment of Trends inIntrametropolitan Migration. Madison, WI: University of Wisconsin Press.
Park, Robert E. 1926. “The Urban Community as a Spatial Pattern and A Moral Order,” in TheUrban Community, edited by Ernest W. Burgess, 3-18. Chicago: University of Chicago Press.
Reich, Robert. 1991. The Work of Nations: Preparing Ourselves For Capitalism in the 21st Century.New York: Knopf.

21
U.S. Bureau of the Census. 1962. 1960 Census of Population and Housing: Census tracts. FinalReport PHC(1)-1. U.S. Government Printing Office, Washington, D.C.
. 1983. 1980 Census of Population and Housing: Census tracts. Final Report PHC80-2-77.U.S. Government Printing Office, Washington, D.C.
Wilson, Franklin D. 1979. Residential Consumption, Economic Opportunity, and Race. New York:Academic Press.
Wilson, William J. 1987. The Truly Disadvantaged: The Inner City, the Underclass, and PublicPolicy. Chicago: The University of Chicago Press.
22
Table 1. Percentage of Blacks and Whites living in Suburbs of Four U.S. Cities, 1960-1980
EducationLevel 1960 1980 Change 1960 1980 Change
Blacks Whites
Atlanta0-4 37.3 4.1 -33.7 7.8 2.3 -5.55-7 33.6 7.6 -26.0 18.1 6.5 -11.68 8.1 4.2 -3.9 9.0 4.5 -4.5HS 1-3 11.6 16.0 4.4 19.6 16.6 -3.0HS 4 6.5 29.7 23.2 24.9 30.9 6.0C 1-3 1.1 17.7 16.6 11.0 18.2 7.2C 4+ 1.2 20.8 19.6 9.5 21.0 11.5
Chicago0-4 13.2 4.3 -8.9 6.1 1.5 -4.65-7 19.7 6.6 -13.1 8.9 3.0 -5.98 18.0 6.3 -11.7 19.1 6.9 -12.2HS 1-3 24.1 19.6 -4.5 20.5 12.1 -8.4HS 4 15.9 32.4 16.5 22.7 35.8 13.1C 1-3 6.3 19.5 13.2 11.8 18.3 6.5C 4+ 2.8 11.4 8.6 10.8 22.3 11.5
Houston0-4 31.2 7.4 -23.8 9.4 2.6 -6.85-7 25.3 10.4 -14.9 16.9 5.4 -11.58 9.9 4.9 -5.0 11.4 4.1 -7.3HS 1-3 16.5 17.4 0.9 14.9 15.3 0.4HS 4 9.6 20.4 10.8 26.1 31.9 5.8C 1-3 3.5 15.8 12.3 11.3 19.7 8.4C 4+ 3.8 23.7 19.9 10.0 21.0 11.0
Philadelphia0-4 14.9 2.7 -12.2 5.3 1.4 -3.95-7 22.8 6.8 -16.0 14.3 4.4 -9.98 15.9 7.0 -8.9 19.4 6.4 -13.0HS 1-3 24.2 18.6 -5.6 9.9 14.1 4.2HS 4 15.6 37.5 21.9 10.1 38.9 28.8C 1-3 3.6 13.4 9.8 10.6 14.0 3.4C 4+ 3.1 14.0 10.9 30.4 20.9 -9.5
Source: 1960 and 1980 U.S. Census of Population and Housing
23
Table 2. Net Difference Scores for the Black and White Populations in Four U.S. Metropolita nAreas, 1980 and 1960 to 1980 Change
MetropolitanArea 1980 Change 1980 Change
Blacks Whites
Atlanta 49.7 67.0 33.6 10.7
Chicago 25.5 40.7 67.3 -18.7
Houston 42.0 62.3 32.0 4.1
Philadelphia 18.1 38.3 54.6 -20.4
24
Table 3. Residential dissimilarity within the Black and White populations between college graduates and above and each remaining education group in the central cities and suburbanrings of four U.S. Metropolitan Areas, 1980 and 1960 to 1980 change
Black Education Segregation White Education Segregation
EducationLevels 1980 Change 1980 Change 1980 Change 1980 Change
CC SUB CC SUB
Atlanta0-4 56.8 -4.7 71.5 37.1 64.3 -3.3 41.4 -18.85-7 53.2 -1.1 69.6 33.7 62.3 -1.9 37.4 -18.28 52.0 2.3 64.4 26.2 55.8 -1.6 36.8 -12.8HS 1-3 48.0 -3.0 55.0 14.9 56.9 3.3 31.1 -14.0HS 4 35.5 -3.0 32.4 -6.2 45.5 7.8 22.9 -6.6C 1-3 21.0 -1.3 15.2 -26.0 24.5 5.8 12.3 -3.0Average 44.4 -1.8 51.4 13.3 51.6 1.7 30.3 -12.2
Chicago0-4 54.8 2.6 57.6 -11.0 52.4 -45.0 49.6 -32.75-7 51.2 4.2 54.5 -14.2 53.2 -36.3 50.3 -29.78 47.9 4.6 52.2 -15.1 45.4 -41.2 42.4 -20.1HS 1-3 44.9 4.5 48.5 -18.0 44.5 -36.1 36.5 -15.5HS 4 35.7 3.9 39.1 -18.0 34.2 -36.2 26.0 -16.7C 1-3 25.2 0.3 29.6 -10.5 21.7 -19.0 15.9 -21.1 Average 43.3 3.4 46.9 -14.5 41.9 -35.6 36.8 -22.6
Houston0-4 56.5 14.0 67.6 15.2 69.7 -1.2 32.6 -19.95-7 54.3 15.7 70.1 21.9 65.1 2.0 35.8 -10.68 50.0 13.3 68.1 24.1 58.1 2.8 35.7 -5.2HS 1-3 44.2 11.1 66.4 20.1 51.3 2.1 34.7 -4.6HS 4 33.1 6.8 59.9 19.7 29.4 -5.0 23.1 -3.8C 1-3 19.9 -1.2 59.0 32.6 16.9 -2.4 12.9 -0.7 Average 43.0 10.0 65.2 22.3 48.4 -0.3 29.1 -7.5
Philadelphia0-4 52.1 -1.4 55.3 -4.3 67.0 11.5 49.7 -12.35-7 46.5 -0.3 51.6 -5.2 63.6 11.1 48.0 -1.28 44.1 2.2 48.2 -3.9 61.2 16.7 43.2 -1.3HS 1-3 40.3 1.8 42.6 -8.7 60.6 17.1 39.1 -0.8HS 4 29.6 -0.6 31.6 -11.8 51.5 21.3 27.4 -8.8C 1-3 21.7 1.8 28.1 -7.6 24.9 8.3 17.1 -8.6 Average 39.1 0.6 42.9 -6.9 54.8 14.3 37.4 -5.5
Note: CC=Central City; SUB=Suburban Ring
25
FIGURE 1. MEAN BLACK SEGREGATION, 1980AND 1960 TO 1980 CHANGE
26
FIGURE 2. MEAN WHITE SEGREGATION, 1980AND 1960 TO 1980 CHANGE

Center for Demography and EcologyUniversity of Wisconsin
1180 Observatory Drive Rm. 4412Madison, WI 53706-1393
U.S.A.608/262-2182
FAX 608/262-8400email: [email protected]