census profile: new jersey’s asian american · pdf filecensus profile: new...
TRANSCRIPT
Asian American Federation of New York Census Information Center
Census Profile: New Jersey’s Asian American Population
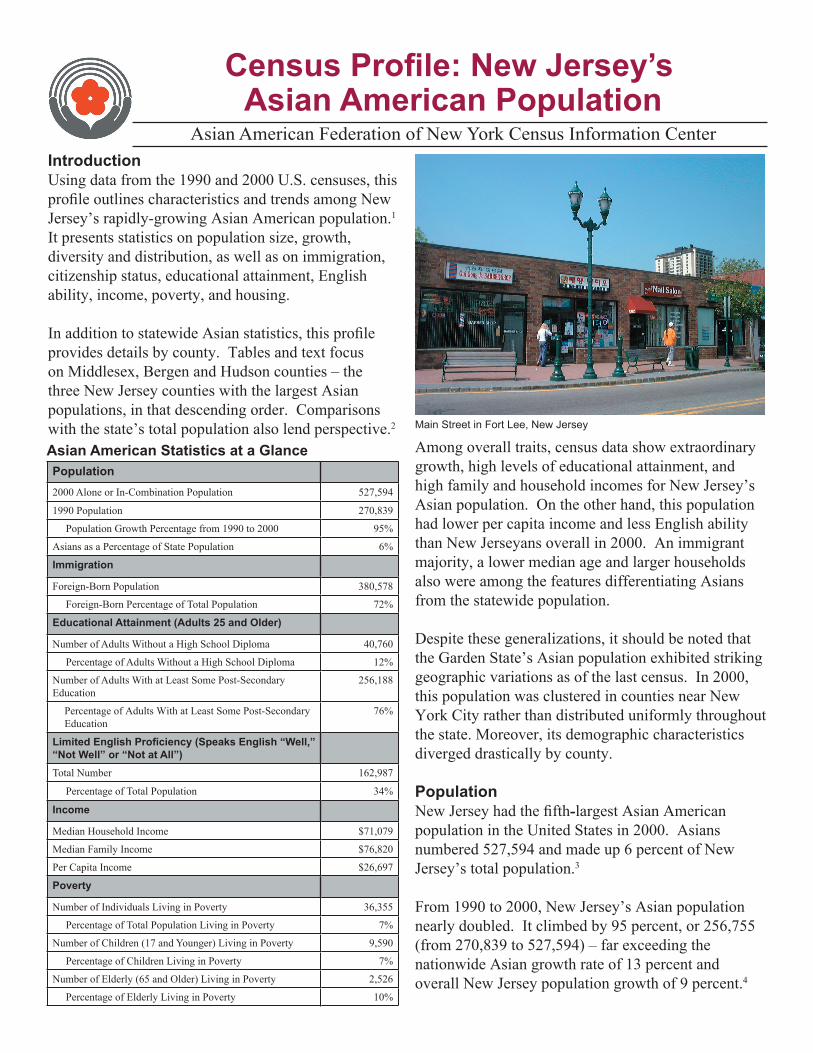
Main Street in Fort Lee, New Jersey
Asian American Statistics at a Glance Population2000 Alone or In-Combination Population 527,594
1990 Population 270,839
Population Growth Percentage from 1990 to 2000 95%
Asians as a Percentage of State Population 6%
Immigration
Foreign-Born Population 380,578
Foreign-Born Percentage of Total Population 72%
Educational Attainment (Adults 25 and Older)
Number of Adults Without a High School Diploma 40,760
Percentage of Adults Without a High School Diploma 12%
Number of Adults With at Least Some Post-Secondary Education
256,188
Percentage of Adults With at Least Some Post-Secondary Education
76%
Limited English Proficiency (Speaks English “Well,” “Not Well” or “Not at All”)Total Number 162,987
Percentage of Total Population 34%
Income
Median Household Income $71,079
Median Family Income $76,820
Per Capita Income $26,697
Poverty
Number of Individuals Living in Poverty 36,355
Percentage of Total Population Living in Poverty 7%
Number of Children (17 and Younger) Living in Poverty 9,590
Percentage of Children Living in Poverty 7%
Number of Elderly (65 and Older) Living in Poverty 2,526
Percentage of Elderly Living in Poverty 10%
IntroductionUsing data from the 1990 and 2000 U.S. censuses, this profile outlines characteristics and trends among New Jersey’s rapidly-growing Asian American population.1 It presents statistics on population size, growth, diversity and distribution, as well as on immigration, citizenship status, educational attainment, English ability, income, poverty, and housing.
In addition to statewide Asian statistics, this profile provides details by county. Tables and text focus on Middlesex, Bergen and Hudson counties – the three New Jersey counties with the largest Asian populations, in that descending order. Comparisons with the state’s total population also lend perspective.2
Among overall traits, census data show extraordinary growth, high levels of educational attainment, and high family and household incomes for New Jersey’s Asian population. On the other hand, this population had lower per capita income and less English ability than New Jerseyans overall in 2000. An immigrant majority, a lower median age and larger households also were among the features differentiating Asians from the statewide population.
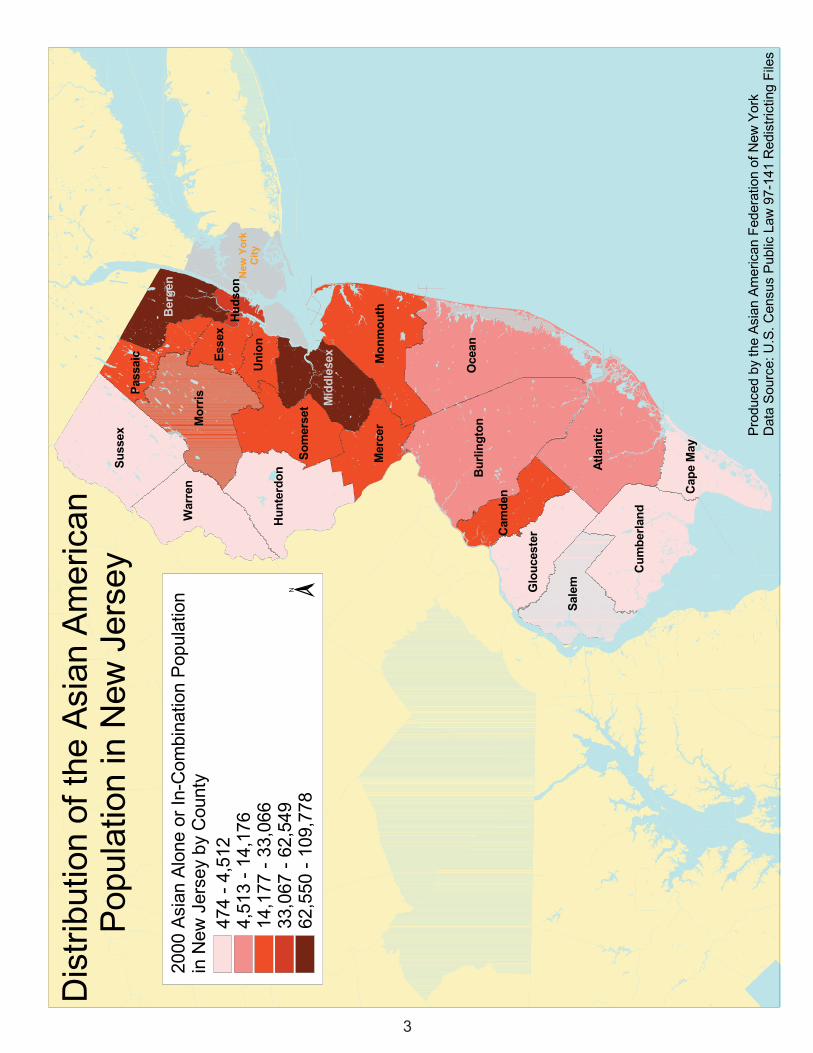
Despite these generalizations, it should be noted that the Garden State’s Asian population exhibited striking geographic variations as of the last census. In 2000, this population was clustered in counties near New York City rather than distributed uniformly throughout the state. Moreover, its demographic characteristics diverged drastically by county.
PopulationNew Jersey had the fifth-largest Asian American population in the United States in 2000. Asians numbered 527,594 and made up 6 percent of New Jersey’s total population.3
From 1990 to 2000, New Jersey’s Asian population nearly doubled. It climbed by 95 percent, or 256,755 (from 270,839 to 527,594) – far exceeding the nationwide Asian growth rate of 13 percent and overall New Jersey population growth of 9 percent.4
Indian Americans were the largest Asian ethnic group
in New Jersey.
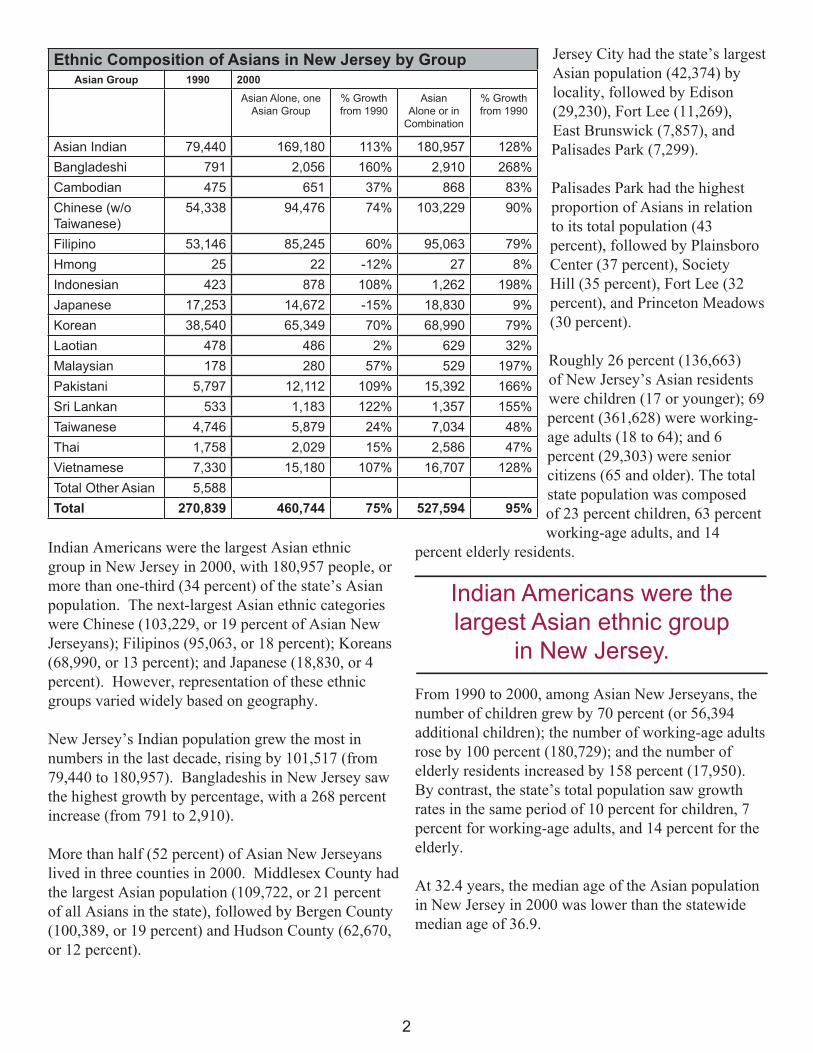
Ethnic Composition of Asians in New Jersey by GroupAsian Group 1990 2000
Asian Alone, one Asian Group
% Growth from 1990
Asian Alone or in
Combination
% Growth from 1990
Asian Indian 79,440 169,180 113% 180,957 128%Bangladeshi 791 2,056 160% 2,910 268%Cambodian 475 651 37% 868 83%Chinese (w/o Taiwanese)
54,338 94,476 74% 103,229 90%
Filipino 53,146 85,245 60% 95,063 79%Hmong 25 22 -12% 27 8%Indonesian 423 878 108% 1,262 198%Japanese 17,253 14,672 -15% 18,830 9%Korean 38,540 65,349 70% 68,990 79%Laotian 478 486 2% 629 32%Malaysian 178 280 57% 529 197%Pakistani 5,797 12,112 109% 15,392 166%Sri Lankan 533 1,183 122% 1,357 155%Taiwanese 4,746 5,879 24% 7,034 48%Thai 1,758 2,029 15% 2,586 47%Vietnamese 7,330 15,180 107% 16,707 128%Total Other Asian 5,588Total 270,839 460,744 75% 527,594 95%
2
Indian Americans were the largest Asian ethnic group in New Jersey in 2000, with 180,957 people, or more than one-third (34 percent) of the state’s Asian population. The next-largest Asian ethnic categories were Chinese (103,229, or 19 percent of Asian New Jerseyans); Filipinos (95,063, or 18 percent); Koreans (68,990, or 13 percent); and Japanese (18,830, or 4 percent). However, representation of these ethnic groups varied widely based on geography.
New Jersey’s Indian population grew the most in numbers in the last decade, rising by 101,517 (from 79,440 to 180,957). Bangladeshis in New Jersey saw the highest growth by percentage, with a 268 percent increase (from 791 to 2,910).
More than half (52 percent) of Asian New Jerseyans lived in three counties in 2000. Middlesex County had the largest Asian population (109,722, or 21 percent of all Asians in the state), followed by Bergen County (100,389, or 19 percent) and Hudson County (62,670, or 12 percent).
Jersey City had the state’s largest Asian population (42,374) by locality, followed by Edison (29,230), Fort Lee (11,269), East Brunswick (7,857), and Palisades Park (7,299).
Palisades Park had the highest proportion of Asians in relation to its total population (43 percent), followed by Plainsboro Center (37 percent), Society Hill (35 percent), Fort Lee (32 percent), and Princeton Meadows (30 percent).
Roughly 26 percent (136,663) of New Jersey’s Asian residents were children (17 or younger); 69 percent (361,628) were working-age adults (18 to 64); and 6 percent (29,303) were senior citizens (65 and older). The total state population was composed of 23 percent children, 63 percent working-age adults, and 14
percent elderly residents.
From 1990 to 2000, among Asian New Jerseyans, the number of children grew by 70 percent (or 56,394 additional children); the number of working-age adults rose by 100 percent (180,729); and the number of elderly residents increased by 158 percent (17,950). By contrast, the state’s total population saw growth rates in the same period of 10 percent for children, 7 percent for working-age adults, and 14 percent for the elderly.
At 32.4 years, the median age of the Asian population in New Jersey in 2000 was lower than the statewide median age of 36.9.
3

About 3 in 4 Asian adults in New Jersey had at least
some post-secondary education.
4
Immigration and CitizenshipNearly three-quarters (72 percent, or 380,578) of Asian New Jerseyans in 2000 were foreign-born, compared with 18 percent of all state residents. Reflecting Asian population distribution, Middlesex County had the largest number of Asian immigrants (36,918), followed by Bergen County (35,245) and Hudson County (22,014).
The naturalization rate for Asian immigrants in New Jersey was similar to the overall state rate. Slightly fewer than half (47 percent, or 177,227) of foreign-born Asians in the state were naturalized citizens in 2000, compared with 46 percent of all foreign-born New Jerseyans.
Of the state’s foreign-born Asians, the largest proportion (47 percent, or 179,987) immigrated from 1990 to March 2000; 32 percent (122,060) came to the United States from 1980 to 1989; and 21 percent (78,531) arrived before 1980. These statistics present a pattern of more recent immigration for Asians than for foreign-born New Jersey residents overall, of whom 42 percent immigrated from 1990 to March 2000; 27 percent entered this country from 1980 to 1989; and 32 percent came before 1980.
Educational AttainmentOn the whole, Asian New Jerseyans in 2000 had exceptionally high educational-attainment levels. However, these rates differed by county.5
Of New Jersey’s total Asian adult population, 12 percent (40,760) had not graduated from high school, compared with 18 percent of adults statewide. Also, 7 percent (22,357) of Asian New Jersey adults had less than a ninth-grade education, compared with 9 percent of all adults in the state.
Percentages of Asian adults without high school diplomas ranged from 6 percent in Somerset County to 30 percent in Atlantic County. The three New Jersey counties with the largest numbers of Asian adults who had not completed high school were Middlesex
(6,885), Hudson (6,674), and Bergen (5,601). At the high end of the educational spectrum, 76 percent (256,188) of Asian adults in New Jersey had some form of post-secondary education, compared with 53 percent of all adults in the state.
Percentages of Asian adults with post-secondary schooling varied from 50 percent in Atlantic County to 87 percent in Somerset County. The three New Jersey counties with the largest numbers of Asians with higher education were Middlesex (57,102), Bergen (50,807), and Hudson (29,790).
The vast majority of Asian school-aged children in the state (79 percent, or 91,604) were enrolled in the New Jersey public school system, compared with 82 percent of all New Jersey schoolchildren.
English Proficiency New Jersey’s Asian residents were more likely to have Limited English Proficiency (LEP) than the general population – both overall and by age group.6
Of the total Asian population in New Jersey, 34 percent (162,987) spoke English “well,” “not well” or “not at all,” compared with 11 percent of residents statewide. By age group, 36 percent (130,00) of Asian working-age adults and 60 percent (15,990) of Asian senior citizens had so-defined limited English ability, compared with 13 percent of working-age adults and 10 percent of senior citizens throughout the state.
Census data show the highest rate of LEP among Asians in New Jersey in Atlantic County, where 48 percent of Asian residents spoke English “well,” “not well” or “not at all.” Bergen County had the largest number of Asians facing LEP (39,745).
IncomeAsians in New Jersey had higher median household and median family incomes but lower per capita income than the state’s general population.7
The Asian median household income of $71,079 and median family income of $76,820 surpassed corresponding overall state figures of $55,146 and $65,370, respectively. However, Asian per capita income of $26,697 was slightly lower than $27,006 statewide.
1 in 10 elderly Asian Americans in New Jersey
lived in poverty.
With a median household income of $100,140, a median family income of $105,573, and per capita income of $35,946, Asians in Somerset County had the highest of all three income measures among Asian New Jersey residents.
On the other end of the scale, Asians in Cumberland County had the lowest median household and median family incomes for Asians in New Jersey ($48,438 and $51,181, respectively).
Meanwhile, the lowest Asian per capita income in New Jersey ($17,679) was found in Atlantic County, which also had the second-lowest median household income ($51,894) and second-lowest median family income ($57,240) for Asians in the state.
PovertyPoverty rates for Asians, in relation to the total New Jersey population, were lower for the general population and for children but higher for the elderly, as of the 2000 census.8 The incidence of poverty also differed from one county to another.
Of all Asians in the state, 7 percent (36,355) lived below the poverty line, compared with an overall New Jersey poverty rate of 8 percent. By age category, 7 percent (9,590) of the state’s Asian children lived in poverty, compared with 11 percent of all New Jersey children. On the other hand, 10 percent (2,526) of Asian senior citizens lived in poverty, exceeding the 8 percent poverty rate for the state’s entire elderly population. Poverty levels for Asians in New Jersey diverged greatly with geography. Overall Asian poverty rates ranged from 2 percent in Hunterdon County to 11 percent in Hudson County. Passaic County had the highest Asian child poverty rate (13 percent), while Bergen County had the largest number of Asian children living in poverty (2,152).
HousingAsian New Jersey residents in 2000 tended to have much larger households (averaging 3.23 people) than the overall state population (2.68). The larger household size helps explain Asians’ higher household income but lower per capita income compared with statewide statistics.
Although the majority of Asian New Jerseyans owned their homes, home ownership was less prevalent among Asians than among the total state population. According to the census, 54 percent of Asians in New Jersey owned their homes while 46 percent rented, compared with 66 percent homeowners and 34 percent renters in the state overall.
The Asian home-ownership rate was highest in Sussex County (83 percent) and lowest in Hudson County (34 percent). Middlesex County had the largest numbers of both Asian homeowners (16,855) and Asian renters (15,983).
Technical Note Race CategoriesThe 2000 census was the first decennial census in which respondents were allowed to mark more than one race. As a consequence, Census 2000 race information is far more complicated than such data from previous censuses. For example, 2000 data include results for single-race as well as multiple-race responses. “Asian Alone” corresponds to the respondents who reported exactly one Asian group and no other race category. “Alone” should be considered the minimum population size in any analysis that uses Census 2000 data. To be as inclusive as possible, this profile uses “Asian Alone or in Any Combination” numbers.
“Alone or in Any Combination” corresponds to the responses (not respondents) that included the selected Asian group, either alone or in any combination with other Asian groups or other race categories. If a respondent selected an Asian group and another racial group (e.g., Korean and black), that individual, while excluded from the “Asian Alone” count, was tallied in the “Alone or in Any Combination” count for the Asian group and the other racial group. Hence, some overlap in the “In Combination” numbers occurred. “Alone or in Any Combination” should be considered the maximum population size in any analysis that uses Census 2000 data.
5

Footnotes1 All numbers are from Summary Files (SF) One, Two, Three and Four of the U.S. census. However, SF One and SF Two refer to information collected from a 100 percent U.S. population survey, whereas SF Three and Four data represent a sample survey. 2 Rates and percentages for each data section of this profile are derived from the data universe related to the topic at hand. Therefore, population tallies for one particular subject will not necessarily correspond with those for another topic.3 In 2000, California had the largest Asian American population in the United States (3,697,513), followed by New York (1,044,976), Hawaii (703,232), and Texas (562,319).4 When compared with the Asian Alone category for the 1990 census, the population increased by 75 percent (203,989). 5 For education tabulations, adults are defined as individuals age 25 and older. 6 “Limited English Proficiency,” as used in the profile, refers to individuals who spoke English “well,” “not well” or “not at all”. 7 Household income refers to the combined income of all occupants of a housing unit. Family income refers to the earnings of a group of two or more people (one of whom is the householder) related by birth, marriage or adoption and residing together. 8 Families and individuals are classified as below the poverty line if their total family income or unrelated individual income was less than the poverty threshold specified for the applicable family size, age of householder, and number of related children younger than 18 present in 1999. For these thresholds, please see http://www.census.gov/hhes/poverty/threshld/thresh99.html.
About This ProfileThis is one of a series of Asian American population profiles prepared by the Asian American Federation of New York Census Information Center (CIC) to increase understanding of the rapidly-growing and diverse Asian American population in the New York metropolitan area.
The Asian American Federation of New York is a nonprofit leadership organization that works collaboratively to meet the critical needs of Asian Americans in the New York metropolitan area. The Federation strengthens community-based health and social services capacity by supporting its 35 member agencies and other grassroots organizations; amplifies the Asian American civic voice by defining, analyzing, and advocating for policies to address key community issues; encourages strategic, high-impact philanthropy within the Asian American community by increasing opportunities for connecting time, talent and financial resources with pressing community needs.
Data citations from this profile should include the following acknowledgement: “Data derived from analysis by the Asian American Federation Census Information Center.”
For More InformationFor more information regarding this profile, please contact the Asian American Federation of New York Census Information Center, at (212) 344-5878, x19 or [email protected], or visit www.aafny.org/cic/.
Funding support for this profile series has been provided generously by the Citigroup Foundation and the C.J. Huang Foundation.
© 2004 Asian American Federation of New YorkFirst Printing - May 2004 10/04 - Version 2.1
Asian American Federation of New York120 Wall Street, 3rd Floor, New York, NY 10005Tel: (212) 344-5878 | Fax: (212) 344-5636E-mail: [email protected] | Website: www.aafny.org
6

Asian American Statistics in Bergen, Hudson and Middlesex Counties at a Glance1
Population BergenCounty
Hudson County
Middlesex County
2000 Alone or In-Combination Population 101,030 63,388 110,7751990 Population 54,660 36,564 44,766 Population Growth Percentage from 1990 to 2000 85% 73% 147%Asians as a Percentage of Total County Population 11% 10% 15%ImmigrationForeign-Born Population 75,739 48,493 81,713 Foreign-Born Percentage of Total Asian Population 75% 77% 74%Educational Attainment (Adults 25 and Older)Number of Adults Without a High School Diploma 5,601 6,674 6,885 Percentage of Adults Without a High School Diploma 9% 16% 10%Number of Adults With at Least Some Post-Secondary Education 50,807 29,790 57,102 Percentage of Adults With at Least Some Post-Secondary Education
77% 72% 82%
Limited English Proficiency (Speaks English “Well,” “Not Well” or “Not at All”)Total Number 39,745 20,548 30,809 Percentage of Total Population 43% 35% 31%Total Number of Working-Age Adults Facing LEP 32,019 16,819 24,553 Percentage of Total Working-Age Adults 47% 37% 32%Total Number of Elderly Facing LEP 3,184 2,061 3,095 Percentage of Total Elderly Facing LEP 67% 59% 66%IncomeMedian Household Income $69,108 $53,123 $76,475 Overall County Median Household Income $65,241 $40,293 $61,446Median Family Income $73,753 $59,105 $79,833 Overall County Median Family Income $78,079 $44,053 $70,749Per Capita Income $27,180 $22,503 $27,024 Overall County Per Capita Income $33,638 $21,154 $26,535PovertyNumber of Individuals Living in Poverty 7,961 6,545 5,824 Percentage of Total Population Living in Poverty 8% 11% 5%Number of Children (17 and younger) Living in Poverty 2,152 1,619 1,343 Percentage of Children Living in Poverty 8% 12% 5%Number of Elderly (65 and Older) Living in Poverty 500 510 347 Percentage of Elderly Living in Poverty 10% 15% 8%HousingNumber of Asian Homeowners 15,078 6,660 16,855Home-Ownership Rate 50% 34% 51%
1Based on Asian Alone or In-Combination Numbers
7
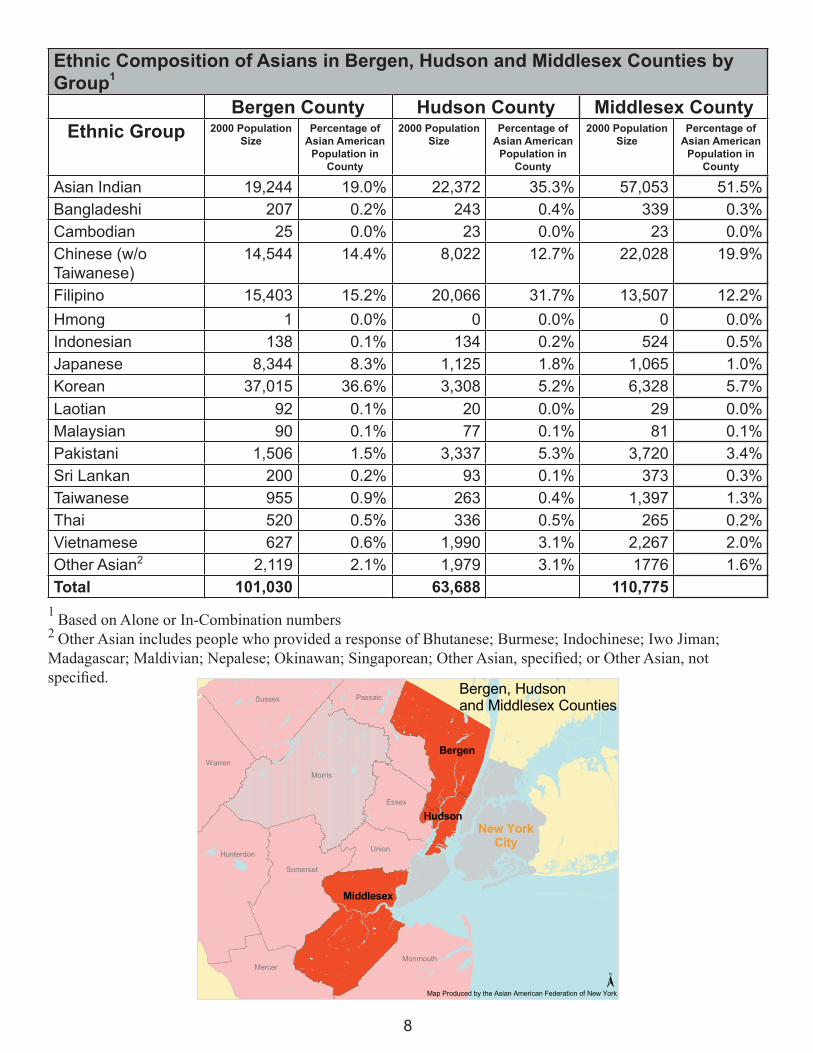
Ethnic Composition of Asians in Bergen, Hudson and Middlesex Counties by Group1
Bergen County Hudson County Middlesex CountyEthnic Group 2000 Population
SizePercentage of
Asian American Population in
County
2000 Population Size
Percentage of Asian American
Population in County
2000 Population Size
Percentage of Asian American
Population in County
Asian Indian 19,244 19.0% 22,372 35.3% 57,053 51.5%Bangladeshi 207 0.2% 243 0.4% 339 0.3%Cambodian 25 0.0% 23 0.0% 23 0.0%Chinese (w/o Taiwanese)
14,544 14.4% 8,022 12.7% 22,028 19.9%
Filipino 15,403 15.2% 20,066 31.7% 13,507 12.2%Hmong 1 0.0% 0 0.0% 0 0.0%Indonesian 138 0.1% 134 0.2% 524 0.5%Japanese 8,344 8.3% 1,125 1.8% 1,065 1.0%Korean 37,015 36.6% 3,308 5.2% 6,328 5.7%Laotian 92 0.1% 20 0.0% 29 0.0%Malaysian 90 0.1% 77 0.1% 81 0.1%Pakistani 1,506 1.5% 3,337 5.3% 3,720 3.4%Sri Lankan 200 0.2% 93 0.1% 373 0.3%Taiwanese 955 0.9% 263 0.4% 1,397 1.3%Thai 520 0.5% 336 0.5% 265 0.2%Vietnamese 627 0.6% 1,990 3.1% 2,267 2.0%Other Asian2 2,119 2.1% 1,979 3.1% 1776 1.6%Total 101,030 63,688 110,775
1 Based on Alone or In-Combination numbers 2 Other Asian includes people who provided a response of Bhutanese; Burmese; Indochinese; Iwo Jiman; Madagascar; Maldivian; Nepalese; Okinawan; Singaporean; Other Asian, specified; or Other Asian, not specified.
8