census of wholesale trade · by timothy braam. coordination of data ... x census of wholesale trade...
TRANSCRIPT

Census ofWholesale TradeWC92-S-2
SUBJECT SERIES
Measures of Value Produced,Capital Expenditures,Depreciable Assets,and Operating Expenses
U.S. Department of CommerceEconomics and Statistics AdministrationBUREAU OF THE CENSUS

Many persons participated in the various activities of the 1992 Assets and Expenditures Survey.The overall planning and review of the census operations were performed by the Economic CensusStaff of the Assistant Director for Economic and Agriculture Censuses.
This report was prepared in the Agriculture and Financial Statistics Division. Bobby E. Russell,Assistant Chief for Census Programs, Services Division, and Ruth A. Runyan, Assistant Chief forFinancial Statistics, Agriculture and Financial Statistics Division, were responsible for the overallplanning, management, and coordination of the assets and expenditures survey. Planning andimplementation were under the direction of Dennis L. Shoemaker, Economic Planning andCoordination Division, and Eddie J. Salyers, Chief, Company Statistics Branch, Agriculture andFinancial Statistics Division. Forms design, processing and tabulation procedures, and text weredeveloped by Sheldon G. Ziman, assisted by Mary Burke Dollar, John P. Seabold, Edward A.Cottrill, Amy Peregoy, Traci Gillespie-Brown, and Tammy Anderson .
Shirin A. Ahmed and John Guest, Economic Planning and Coordination Division, providedvaluable assistance in coordinating the current survey interface. Sample design and statisticalmethodology were developed under the general direction of Howard Hogan, Assistant Chief forResearch and Methodology, Services Division. Estimation and variance methodology was underthe supervision of Patrick Cantwell, Chief, Program Research and Development Branch, assistedby Timothy Braam.
Coordination of data collection efforts was under the direction of Judith N. Petty, Chief, DataPreparation Division, assisted by Kenny Miller, Carlene Bottorff, and Michael Lutz.
The computer processing systems were developed and coordinated in the EconomicStatistical Methods and Programming Division, Charles P. Pautler, Jr., Chief. H Ray Dennis, andSarah W. Baumgardner, Assistant Chiefs were responsible for the design and implementation ofthe computer systems. The computer programs were prepared under the supervision of Barry F.Sessamen, and Frank Bush, assisted by Laura A. Osborn, Ernesto Matos Jr., Robert S.Jewett, Clifton D. Exley, Carol Blatt, and Debbie Mullen.
The staff of the Administrative and Customer Services Division, Walter C. Odom, Chief,performed planning, design, composition, editorial review, and printing planning and procurementfor publications and report forms. Bernadette J. Gayle provided publication coordination andediting.
Special acknowledgment is also due the many businesses whose cooperation has contributedto the publication of these data.
If you have any questions concerning the statistics in this report, call 301-763-7596.
Acknowledgments

Census ofWholesale Trade
WC92-S-2
SUBJECT SERIES
Measures of Value Produced,Capital Expenditures,Depreciable Assets,
and Operating Expenses
Issued November 1996
U.S. Department of CommerceMichael Kantor, Secretary
Economics and Statistics AdministrationEverett M. Ehrlich, Under Secretary
for Economic Affairs
BUREAU OF THE CENSUSMartha Farnsworth Riche, Director
AGRICULTURE AND FINANCIAL STATISTICSDIVISIONEwen M. Wilson, Chief
BUREAU OF THE CENSUSMartha Farnsworth Riche , DirectorBryant Benton , Deputy Director
Paula J. Schneider , Principal AssociateDirector for ProgramsFrederick T. Knickerbocker , AssociateDirector for Economic ProgramsThomas L. Mesenbourg , Assistant Directorfor Economic Programs
ECONOMIC PLANNING AND COORDINATIONDIVISIONJohn P. Govoni , Chief
ECONOMICS
AND STATISTICS
ADMINISTRATION
Economics and StatisticsAdministrationEverett M. Ehrlich , Under Secretaryfor Economic Affairs
For sale by Superintendent of Documents, U.S. Government Printing Office, Washington, DC 20402.

Introduction tothe Economic Census
PURPOSES AND USES OF THE ECONOMICCENSUS
The economic census is the major source of facts aboutthe structure and functioning of the Nation’s economy. Itprovides essential information for government, business,industry, and the general public.
The economic census furnishes an important part of theframework for such composite measures as the grossdomestic product, input/output measures, production andprice indexes, and other statistical series that measureshort-term changes in economic conditions.
Policymaking agencies of the Federal Government usethe data, especially in monitoring economic activity andproviding assistance to business.
State and local governments use the data to assessbusiness activities and tax bases within their jurisdictionsand to develop programs to attract business.
Trade associations study trends in their own and com-peting industries and keep their members informed ofmarket changes.
Individual businesses use the data to locate potentialmarkets and to analyze their own production and salesperformance relative to industry or area averages.
AUTHORITY AND SCOPE
Title 13 of the United States Code (sections 131, 191,and 224) directs the Census Bureau to take the economiccensus every 5 years, covering years ending in 2 and 7.The 1992 Economic Census consists of the following eightcensuses:
x Census of Retail Trade
x Census of Wholesale Trade
x Census of Service Industries
x Census of Financial, Insurance, and Real EstateIndustries
x Census of Transportation, Communications, andUtilities
x Census of Manufactures
x Census of Mineral Industries
x Census of Construction Industries
Special programs also cover enterprise statistics andminority-owned and women-owned businesses. (The 1992Census of Agriculture and 1992 Census of Governmentsare conducted separately.) The next economic census isscheduled to be taken in 1998 covering the year 1997.
AVAILABILITY OF THE DATA
The results of the economic census are available inprinted reports for sale by the U.S. Government PrintingOffice and on compact discs for sale by the CensusBureau. Order forms for all types of products are availableon request from Customer Services, Bureau of the Census,Washington, DC 20233-8300. Amore complete descriptionof publications being issued from this census is on theinside back cover of this document.
Census facts are also widely disseminated by tradeassociations, business journals, and newspapers. Volumescontaining census statistics are available in most majorpublic and college libraries. Finally, State data centers inevery State as well as business and industry data centersin many States also supply economic census statistics.
WHAT’S NEW IN 1992
The 1992 Economic Census covers more of the economythan any previous census. New for 1992 are data oncommunications, utilities, financial, insurance, and realestate, as well as coverage of more transportation indus-tries. The economic, agriculture, and governments cen-suses now collectively cover nearly 98 percent of alleconomic activity.
Among other changes, new 1992 definitions affect theboundaries of about a third of all metropolitan areas. Also,the Survey of Women-Owned Businesses has now beenexpanded to include all corporations.
HISTORICAL INFORMATION
The economic census has been taken as an integratedprogram at 5-year intervals since 1967 and before that for1963, 1958, and 1954. Prior to that time, the individualsubcomponents of the economic census were taken sepa-rately at varying intervals.
The economic census traces its beginnings to the 1810Decennial Census, when questions on manufacturing wereincluded with those for population. Coverage of economic
INTRODUCTION IIIWHOLESALE TRADE—SUBJECT SERIES

activities was expanded for 1840 and subsequent cen-suses to include mining and some commercial activities. In1902, Congress established a permanent Census Bureauand directed that a census of manufactures be taken every5 years. The 1905 Manufactures Census was the first timea census was taken apart from the regular every-10-yearpopulation census.
The first census of business was taken in 1930, covering1929. Initially it covered retail and wholesale trade andconstruction industries, but it was broadened in 1933 toinclude some of the service trades.
The 1954 Economic Census was the first census to befully integrated—providing comparable census data acrosseconomic sectors, using consistent time periods, concepts,definitions, classifications, and reporting units. It was thefirst census to be taken by mail, using lists of firms providedby the administrative records of other Federal agencies.Since 1963, administrative records also have been used toprovide basic statistics for very small firms, reducing oreliminating the need to send them census questionnaires.The Enterprise Statistics Program, which publishes com-bined data from the economic census, was made possiblewith the implementation of the integrated census programin 1954.
The range of industries covered in the economic cen-suses has continued to expand. The census of constructionindustries began on a regular basis in 1967, and the scopeof service industries was broadened in 1967, 1977, and1987. The census of transportation began in 1963 as a setof surveys covering travel, transportation of commodities,and trucks, but expanded in 1987 to cover businessestablishments in several transportation industries. For1992, these statistics are incorporated into a broadenedcensus of transportation, communications, and utilities.Also new for 1992 is the census of financial, insurance, andreal estate industries. This is part of a gradual expansion incoverage of industries previously subjected to governmentregulation.
The Survey of Minority-Owned Business Enterpriseswas first conducted as a special project in 1969 and wasincorporated into the economic census in 1972 along withthe Survey of Women-Owned Businesses.
An economic census has also been taken in Puerto Ricosince 1909, in the Virgin Islands of the United States andGuam since 1958, and in the Commonwealth of theNorthern Mariana Islands since 1982.
Statistical reports from the 1987 and earlier censusesprovide historical figures for the study of long-term timeseries and are available in some large libraries. All of thecensus data published since 1967 are still available for saleon microfiche from the Census Bureau.
AVAILABILITY OF MORE FREQUENT ECONOMICDATA
While the census provides complete enumerations every5 years, there are many needs for more frequent data aswell. The Census Bureau conducts a number of monthly,quarterly, and annual surveys, with the results appearing inpublication series such as Current Business Reports (retailand wholesale trade and service industries), the AnnualSurvey of Manufactures, Current Industrial Reports, andthe Quarterly Financial Report. Most of these surveys,while providing more frequent observations, yield lesskind-of-business and geographic detail than the census.The County Business Patterns program offers annualstatistics on the number of establishments, employment,and payroll classified by industry within each county.
SOURCES FOR MORE INFORMATIONMore information about the scope, coverage, classifica-
tion system, data items, and publications for each of theeconomic censuses and related surveys is published in theGuide to the 1992 Economic Census and Related Statis-tics. More information on the methodology, procedures,and history of the census will be published in the History ofthe 1992 Economic Census. Contact Customer Servicesfor information on availability.
IV INTRODUCTION WHOLESALE TRADE—SUBJECT SERIES

Assets and Expenditures Survey
GENERAL
This report, which was prepared in conjunction with the1992 Census of Wholesale Trade, provides data on selectedcharacteristics of merchant wholesalers, including mea-sures of value produced, capital expenditures, depreciableassets, and operating expenses.
Data in this report are based on information collectedfrom a probability sample of merchant wholesalers used toproduce monthly national estimates of wholesale salespublished in theMonthlyWholesale Trade Survey.Adescrip-tion of the survey methodology, estimating procedures, andconcepts is presented in appendix A.
The 1992 statistics are summarized by kind-of-businessclassifications based on the Standard Industrial Classifica-tion Manual: 1987 (SIC). This report covers all merchantwholesale operations in the Nation. All major kinds ofbusiness in which merchant wholesalers operate are rep-resented and are described in appendix A.
DOLLAR VALUES
All dollar values presented in this report are expressedin current dollars; i.e., 1992 data are expressed in 1992dollars
SPECIAL TABULATIONS AND UNPUBLISHEDDATA
Special tabulations of data collected in the 1992 Assetsand Expenditures Survey may be obtained, depending onavailability of time and personnel, on computer disk, or intabular form. The data will be in summary form and subjectto the same rules prohibiting disclosure of confidentialinformation (including name, address, kind of business,or other data for individual business establishments orcompanies) as are the regular publications.
Special tabulations are prepared on a cost basis. Arequest for a cost estimate, as well as exact specificationson the type and format of the data to be provided, shouldbe directed to the Chief, Agriculture and Financial StatisticsDivision, Bureau of the Census, Washington, DC 20233.
To discuss a special tabulation before submitting speci-fications, call 301-763-7596.
Some estimates have not been published in this reportbecause their sampling variability or imputation is so highas to make them potentially misleading. Some unpublisheddata can be derived directly by subtracting appropriatepublished data from their respective totals. However, thefigures obtained by such subtraction would be subject tohigh sampling variability described above for unpublishedkinds of business, and their use would be subject to thesame hazards. Unpublished data may be obtained uponrequest from the Chief, Agriculture and Financial StatisticsDivision, Bureau of the Census, Washington, DC 20233.
ABBREVIATIONS AND SYMBOLSThe following abbreviations and symbols are used in this
publication:
* Measure of sampling variability not shownsince estimated data not published.
– Represents zero.(M) Less than $500,000.(NA) Not available.(S) Withheld because estimates did not meet
publication standards on the basis of eitherresponse rate, associated relative standarderror, or consistency review.
(V) Less than .05 percent.(X) Not applicable.n.e.c. Not elsewhere classified.pt. Part.SIC Standard industrial classification.
CENSUS OF WHOLESALE TRADE VWHOLESALE TRADE—SUBJECT SERIES

Users’ Guide for Locating Statistics in This Reportby Table Number
Information shown in tablesTable
1 2 3 4 5 6 7 8 9 10 11 12 13
Sales . . . . . . . . . . . . . . . . . . . . . . . . . . . . . . . . . . . . . . . X X X X XPurchases . . . . . . . . . . . . . . . . . . . . . . . . . . . . . . . . . . . X XCost of goods sold . . . . . . . . . . . . . . . . . . . . . . . . . . . X X
Inventories . . . . . . . . . . . . . . . . . . . . . . . . . . . . . . . . . . X
Gross margin . . . . . . . . . . . . . . . . . . . . . . . . . . . . . . . . X XValue added . . . . . . . . . . . . . . . . . . . . . . . . . . . . . . . . . X X
Net income produced at market prices . . . . . . . . . . X XNet income produced at factor cost. . . . . . . . . . . . . X X
Acquisition value of depreciable assetsat end of 1992 . . . . . . . . . . . . . . . . . . . . . . . . . . . . . . X X X X XBuildings and structures. . . . . . . . . . . . . . . . . . . . . X XMachinery and equipment . . . . . . . . . . . . . . . . . . . X X
Acquisition value of depreciable assetsat end of 1991 . . . . . . . . . . . . . . . . . . . . . . . . . . . . . . X X X XBuildings and structures. . . . . . . . . . . . . . . . . . . . . X XMachinery and equipment . . . . . . . . . . . . . . . . . . . X X
Deductions from depreciable assets . . . . . . . . . . . . X
Capital expenditures (other than land) . . . . . . . . . . X X X X XUsed capital expenditures . . . . . . . . . . . . . . . . . . . X XNew capital expenditures. . . . . . . . . . . . . . . . . . . . X XNew buildings and structures . . . . . . . . . . . . . . . . XNew highway vehicles . . . . . . . . . . . . . . . . . . . . . . XNew computer hardware and dataprocessing equipment . . . . . . . . . . . . . . . . . . . . . XAll other capital expenditures . . . . . . . . . . . . . . . . X
Annual payroll . . . . . . . . . . . . . . . . . . . . . . . . . . . . . . . X X X X X X
Employer cost for fringe benefits . . . . . . . . . . . . . . . X X XLegally required expenditures . . . . . . . . . . . . . . . . X XVoluntary expenditures . . . . . . . . . . . . . . . . . . . . . . X X
Taxes and license fees. . . . . . . . . . . . . . . . . . . . . . . . X
Depreciation charges . . . . . . . . . . . . . . . . . . . . . . . . . X XBuildings and structures. . . . . . . . . . . . . . . . . . . . . XMachinery and equipment . . . . . . . . . . . . . . . . . . . X
Lease and rental payments . . . . . . . . . . . . . . . . . . . . X XBuildings and structures. . . . . . . . . . . . . . . . . . . . . XMachinery and equipment . . . . . . . . . . . . . . . . . . . X
Purchased electricity. . . . . . . . . . . . . . . . . . . . . . . . . . X XPurchased fuels . . . . . . . . . . . . . . . . . . . . . . . . . . . . . . X XMiscellaneous utilities . . . . . . . . . . . . . . . . . . . . . . . . . X XCommunication services . . . . . . . . . . . . . . . . . . . . . . X
Office supplies . . . . . . . . . . . . . . . . . . . . . . . . . . . . . . . XPackaging and shipping materials . . . . . . . . . . . . . . XAdvertising services . . . . . . . . . . . . . . . . . . . . . . . . . . XCommissions paid . . . . . . . . . . . . . . . . . . . . . . . . . . . . XPayments for contract work. . . . . . . . . . . . . . . . . . . . X X
VI USERS’ GUIDE WHOLESALE TRADE—SUBJECT SERIES

Information shown in tablesTable
1 2 3 4 5 6 7 8 9 10 11 12 13
Legal services . . . . . . . . . . . . . . . . . . . . . . . . . . . . . . . XAccounting services . . . . . . . . . . . . . . . . . . . . . . . . . . XData processing. . . . . . . . . . . . . . . . . . . . . . . . . . . . . . X
Repairs . . . . . . . . . . . . . . . . . . . . . . . . . . . . . . . . . . . . . X XBuildings and structures. . . . . . . . . . . . . . . . . . . . . XMachinery and equipment . . . . . . . . . . . . . . . . . . . X
Other operating expenses . . . . . . . . . . . . . . . . . . . . . X
Total operating expenses . . . . . . . . . . . . . . . . . . . . . . X X X X X X
Estimated relative standard errors . . . . . . . . . . . . . . X
USERS’ GUIDE VIIWHOLESALE TRADE—SUBJECT SERIES

Users’ Guide for Locating Statistics in the1992 Census of Wholesale Trade Reports
Report and geographic area
Information shown in reports by kind of business or industry category
Numberof estab-
lish-ments
Sales($1,000)
Payroll($1,000)
Numberof em-ployees
Inven-tories
($1,000)
Oper-ating
expenses($1,000)
Com-modity
linesales
($1,000)
Salessize andemploy-
mentsize1
Legalform oforgani-zation
Petro-leum
bulk sta-tions andterminals
Selectedtopics
GEOGRAPHIC AREASERIES
United States . . . . . . . . . . . . . . X X X X X XState. . . . . . . . . . . . . . . . . . . . . . X X X X X XMA . . . . . . . . . . . . . . . . . . . . . . . X X X XCounty . . . . . . . . . . . . . . . . . . . . X X X XPlace . . . . . . . . . . . . . . . . . . . . . X X X X
ESTABLISHMENT ANDFIRM SIZE (INCLUDINGLEGAL FORM OFORGANIZATION)
United States . . . . . . . . . . . . . . X X 2X 2X 2X 2X X X
MEASURES OF VALUEPRODUCED, CAPITALEXPENDITURES,DEPRECIABLE ASSETS,AND OPERATINGEXPENSES
United States2 . . . . . . . . . . . . . X X X X X 3X
COMMODITY LINE SALES
United States . . . . . . . . . . . . . . X X XState4. . . . . . . . . . . . . . . . . . . . . X X XMA4 . . . . . . . . . . . . . . . . . . . . . . X X X
MISCELLANEOUSSUBJECTS
United States . . . . . . . . . . . . . . X X X X X X X 5XState. . . . . . . . . . . . . . . . . . . . . . X XCounty . . . . . . . . . . . . . . . . . . . . X X
1Establishments and firms.2Merchant wholesalers only.3Value produced, capital expenditures, depreciable assets, and selected operating expenses detail.4Available on CD ROM only.5Class of customer; employment by principal activity; detailed type of operation; inventory detail; commissions of agents and brokers; and gross
margins, gross profits, and their components of merchant wholesalers.
VIII USERS’ GUIDE WHOLESALE TRADE—SUBJECT SERIES

ContentsMeasures of Value Produced,Capital Expenditures,Depreciable Assets,and Operating Expenses
[Page numbers listed here omit the prefix thatappears as part of the number of each page]
Page
Introduction to the Economic Census III...............................................
Assets and Expenditures Survey V...................................................
Users’ Guide for Locating Statistics in This Report by Table Number VI...................
Users’ Guide for Locating Statistics in the 1992 Census of Wholesale Trade Reports VIII.....
Summary of Findings 2.............................................................
FIGURES
1. Distribution of Capital Expenditures of Merchant Wholesalers by Type: 1992 4.......
2. Fringe Benefits as Percent of Annual Payroll of Selected Wholesale Industries:1992 5.....................................................................
3. Measures of Value Produced for Merchant Wholesalers: 1992 6...................
TABLES
1. General Statistics: 1992 7.....................................................
2. Capital Expenditures and Acquisition Value of Depreciable Assets by Kind ofBusiness: 1992 7............................................................
3. Detailed Capital Expenditures by Kind of Business: 1992 8........................
4. Detailed Acquisition Value of Depreciable Assets, Depreciation Charges, and Leaseand Rental Payments by Kind of Business: 1992 8...............................
5. Sales, Annual Payroll, and Employer Costs for Fringe Benefits by Kind of Business:1992 9.....................................................................
6. Annual Payroll and Employer Costs for Fringe Benefits by Legal Form ofOrganization and Kind of Business: 1992 9.....................................
7. Operating Expenses by Type and Kind of Business: 1992 10.......................
8. Detailed Purchased Utilities by Kind of Business: 1992 11..........................
9. Detailed Repair Services by Kind of Business: 1992 12.............................
10. Sales, Cost of Goods Sold, and Measures of Value Produced by Kind of Business:1992 12.....................................................................
11. Sales, Cost of Goods Sold, Measures of Value Produced, and Annual Payroll byLegal Form of Organization: 1992 13............................................
12. Acquisition Value of Depreciable Assets, Capital Expenditures, Sales and TotalOperating Expenses of Corporations by Kind of Business: 1992 13.................
13. Estimated Relative Standard Errors by Kind of Business: 1992 14...................
APPENDIXES
A. General Explanation A–1........................................................
B. Sample Report Form B–1........................................................
C. Changes in Wholesale Trade Kind~of~Business Classifications for 1992 C–1............
Publication Program Inside back cover...................................................
WHOLESALE TRADEmSUBJECT SERIES ASSETS AND EXPENDITURES 2–1

Summary of Findings
Total sales in 1992 of all merchant wholesalers (includ-ing manufacturers’ sales branches of ferrous metal servicecenters) amounted to $1.8 trillion. Comparisons to 1987sales data for individual kinds of business can be madeusing the Census of Wholesale Trade, Geographic AreaSeries—United States Summary reports for the 2 years.The total cost of merchandise purchased for resale in 1992(net of returns, allowances, and trade and cash discounts)totaled $1.5 trillion, or 79.9 percent of total sales.Beginning inventories for merchant wholesalers in 1992amounted to $201.8 billion with ending inventories of$209.7 billion. Total sales, purchases, and inventories areintegral parts of the measures of value produced summa-rized below. Note that some data presented in this reportare not directly comparable to those in the 1987 report dueto changes in kind-of-business classifications.
MEASURES OF VALUE PRODUCEDThe gross margin of merchant wholesalers, which rep-
resents total sales less cost of goods sold, amounted to$380.5 billion in 1992. Value added, derived by deductingfrom gross margin the cost of office supplies, postage,electricity, fuels, packaging materials, and the cost ofcontract work done on materials owned by merchantwholesalers, amounted to $362.2 billion, representing 19.6percent of total sales. Subtracting all other purchasedservices from value added yields net income produced atmarket prices of $255.3 billion, or 13.8 percent of totalsales. This amount less depreciation, license fees, andtaxes (excluding income, payroll, and sales taxes) repre-sents net income produced at factor cost of $235.9 billion,or 12.8 percent of total sales.
As a percent of sales, measures of value produced weregenerally higher for durable goods than for nondurablegoods in 1992. Durable goods wholesalers reported agross margin of 25.0 percent of sales, compared with 16.3percent for nondurable goods wholesalers. Net incomeproduced at market prices amounted to 16.8 percent ofsales for durable goods, compared to 10.9 percent fornondurable goods. Likewise, net income produced at factorcost was higher for durable goods, 15.6 percent of sales,compared to 10.0 percent for nondurable goods.
CAPITAL EXPENDITURESTotal capital expenditures for depreciable assets of
merchant wholesalers amounted to $18.0 billion in 1992.Expenditures of $16.6 billion for new facilities, structures,
and equipment in 1992 accounted for 92.1 percent of thetotal. Capital expenditures in the durable goods tradetotaled $9.7 billion in 1992, while those for nondurablegoods wholesalers amounted to $8.3 billion.
DEPRECIABLE ASSETS
The gross (acquisition) value of depreciable assets ofmerchant wholesalers amounted to $161.9 billion at theend of 1991. After adding capital expenditures and deduct-ing assets sold, retired, scrapped, and destroyed, the year1992 ended with the gross value of depreciable assetsamounting to $173.3 billion, representing a 7.0 percentannual increase.
The kinds of business representing the highest value ofdepreciable assets at the end of 1992 were groceries andrelated products, with $23.5 billion; and machinery, equip-ment, and supplies, with $18.5 billion.
OPERATING EXPENSES
Total operatingexpensesofmerchantwholesalersamountedto $317.8 billion in 1992. Durable goods wholesalersaccounted for $190.0 billion, and $127.8 billion were attrib-utable to nondurable goods wholesalers. The followingsummarizes the findings for specific types of operatingexpenses.
Supplemental labor costs (employer cost for fringebenefits). Total supplemental labor costs for merchantwholesalers amounted to $28.4 billion in 1992. Legallyrequired supplemental labor costs such as employers’social security contributions, unemployment tax, workers’compensation insurance, and State disability insuranceprograms amounted to $14.4 billion, or 50.7 percent of thetotal. Voluntary labor costs, such as insurance premiumson hospital and medical plans, pension plans, and stockpurchase plans, amounted to $14.0 billion, or 49.3 percentof total supplemental labor costs.
Depreciation charges. Depreciation and amortizationcharges against depreciable assets totaled $14.4 billion in1992. Buildings and structures accounted for $2.8 billion,or 19.5 percent of the total, while machinery and equipmentamounted to the remaining $11.6 billion, or 80.5 percent.
2–2 SUMMARY OF FINDINGS WHOLESALE TRADE—SUBJECT SERIES

Lease and rental payments. Lease and rental paymentsin 1992 were $16.7 billion for merchant wholesalers repre-senting 5.2 percent of total operating expenses. Of thesepayments, $12.6 billion were for buildings, other structures,and office space and $4.0 billion were for machinery andequipment.
Communication and utility expenses. Communicationservices purchased by merchant wholesalers amounted to$6.4 billion, while purchased electricity totaled $3.9 billionand purchased fuels amounted to $1.3 billion. As a percentof total operating expenses, these utility costs represented
2.0 percent, 1.2 percent, and 0.4 percent, respectively.Note that these data represent only utilities which werepurchased by firms in 1992, and exclude those utility costswhich were part of normal lease and rental payments orfranchise fees.
Other operating expenses. Other operating expenses ofmerchant wholesalers in 1992 included $10.9 billion foradvertising; $7.6 billion for sales commissions paid toothers; and $5.5 billion for noncapitalized repair to build-ings, machinery, and equipment.
SUMMARY OF FINDINGS 2–3WHOLESALE TRADE—SUBJECT SERIES

Figure 1.Distribution of Capital Expenditures of Merchant Wholesalers by T ype: 1992
Used structuresand equipment
(7%)
Other new machineryand equipment
(49%)
New computers and dataprocessing equipment(14%)
New structures(16%)
New vehicles(14%)
Durable goods wholesalers
Nondurable goods wholesalers
WHOLESALE TRADE—SUBJECT SERIES2-4 ASSETS AND EXPENDITURES
Used structuresand equipment
(9%)
New computers and dataprocessing equipment(9%)
New structures(24%)
New vehicles(19%)Other new machinery
and equipment(39%)
Note: Data are subject to sampling variability.Source: U.S. Bureau of the Census, 1992 Assets and Expenditures Survey.

Figure 2.Fringe Benefits as Percent of Annual Payroll of Selected Wholesale Industries: 1992(Percent)
WHOLESALE TRADE—SUBJECT SERIES ASSETS AND EXPENDITURES 2-5
Motor vehicles and motorvehicle parts and supplies
(SIC 501)
Furniture and homefurnishings(SIC 502)
Professional andcommercial equipment and
supplies (SIC 504)
Metals and minerals, exceptpetroleum(SIC 505)
Electrical goods(SIC 506)
Paper and paperproducts (SIC 511)
Groceries and relatedproducts (SIC 514)
Farm-product raw materials(SIC 515)
Petroleum and petroleumproducts (SIC 517)
10.4 12.0
9.6 8.2
8.5 8.2
11.1 13.6
8.2 10.4
8.0 9.3
12.0 11.3
11.3 12.0
11.1 8.8
22.4
17.8
16.7
24.7
18.6
17.3
23.3
23.3
19.9
Note: Data are subject to sampling variability. Data are based on the 1987Standard Industrial Classification.Source: U.S. Bureau of the Census, 1992 Assets and Expenditures Survey.
Legally required benefits
Voluntary benefits
11.2 10.6 21.8Beer, wine, and distilledalcoholic beverages (SIC 518)

Figure 3.Measures of V alue Produced for Merchant Wholesalers: 1992(Dollar amounts are in millions)
WHOLESALE TRADE—SUBJECT SERIES2-6 ASSETS AND EXPENDITURES
Sales less cost ofgoods sold (beginning
inventory+ purchases –ending inventory)
Gross margin equals—
Gross margin less officesupplies, stationery,
postage; electricity; fuels;contract work
Value added less lease andrental; communications;
advertising; repairs;commissions; other (excluding
taxes, depreciation, andinterest on loans)
Net income produced atmarket prices less taxes;
depreciation charges
226,992
145,167
152,675
102,615
142,083
93,799
153,538
217,060
Note: Data are subject to sampling variability.Source: U.S. Bureau of the Census, 1992 Assets and Expenditures Survey.
Value added equals—
Net income produced atmarket prices equals—
Net income producedat factor cost equals—
Durables
Nondurables

Table 1. General Statistics: 1992[Dollar amounts are in millions. Data are shown only for establishments with payroll. For meaning of abbreviations and symbols, see introductory text]
SIC code Kind of business
Inventories1 Acquisition value ofdepreciable assets
Sales
Purchases ofmerchandise
for resaleEnd of
1992End of
1991Operating
expenses1Annualpayroll1
End of1992
End of1991
Capitalexpenditures
(other thanland)
Merchant wholesalers 2 1 849 798................ 1 477 166 209 675 201 777 317 813 144 792 173 269 161 942 18 030
50 Durable goods stores 2 908 916........................ 686 047 130 044 125 921 190 043 88 120 89 987 84 344 9 687
501 Motor vehicles and automotive parts andsupplies 170 849.................................... 137 886 24 195 24 213 26 402 10 119 13 934 13 160 1 094
502 Furniture and home furnishings 33 200................ 21 600 4 776 4 515 9 681 4 425 3 627 3 333 358503 Lumber and other construction materials 63 765........ 49 146 6 168 5 755 12 026 6 030 6 579 6 360 622504 Professional and commercial equipment and
supplies 139 629.................................... 96 708 17 094 16 841 37 726 17 896 11 627 10 946 1 679505 Metals and minerals, except petroleum2 76 745......... 61 045 10 101 10 127 11 717 5 483 9 848 9 420 747506 Electrical goods 115 387.............................. 88 069 17 110 16 047 22 294 10 045 11 005 9 828 1 561507 Hardware, and plumbing and heating equipment
and supplies 53 063................................ 38 786 8 707 8 286 12 640 6 697 4 428 4 159 462508 Machinery, equipment, and supplies 149 216............ 107 780 29 333 29 012 38 528 19 406 18 458 17 221 2 164509 Miscellaneous durable goods 107 063.................. 85 027 12 560 11 125 19 030 8 020 10 481 9 918 1 000
51 Nondurable goods 2 940 882........................... 791 119 79 631 75 856 127 769 56 671 83 281 77 598 8 343
511 Paper and paper products 54 802..................... 42 904 5 697 5 298 10 993 5 801 3 712 3 440 379512 Drugs, drug proprietaries and druggists’ sundries 67 069. 60 897 9 334 8 002 5 326 2 361 2 213 1 828 (S)513 Apparel, piece goods, and notions 67 905.............. 49 277 10 805 9 595 15 207 5 864 4 222 4 001 410514 Groceries and related products 279 217................ 238 400 16 582 16 142 36 997 16 901 23 541 22 086 2 315515 Farm~product raw materials2 106 224................... 96 066 10 792 10 859 7 460 2 731 11 405 10 800 748516 Chemicals and allied products 39 170................. 29 820 3 193 3 014 7 983 3 577 6 546 5 859 862517 Petroleum and petroleum products 142 651............. 129 785 4 572 4 691 10 611 4 332 12 497 11 699 1 306518 Beer, wine and distilled alcoholic beverages 50 397..... 38 118 4 044 4 335 8 525 3 938 4 166 3 827 (S)519 Miscellaneous nondurable goods 133 446............... 105 852 14 612 13 920 24 666 11 166 14 978 14 058 1 423
Note: Detail may not add to total because of rounding. See table 13 for estimated measures of sampling variability (coefficients of variation).
1Inventories, operating expenses, and payroll data are not the same as in other reports from the 1992 Census of Wholesale Trade due to their sample basis and inclusion of auxiliaries.2Sales data for SIC’s 5051 pt. and the 515 trade group are reported on a different basis than the 1992 Census of Wholesale Trade. For an explanation of these differences see Method of
Estimation in appendix A.
Table 2. Capital Expenditures and Acquisition Value of Depreciable Assets by Kind ofBusiness: 1992
[Dollar amounts are in millions. Data are shown only for establishments with payroll. For meaning of abbreviations and symbols, see introductory text]
SIC code Kind of business
Acquisition value of depreciable assets
End of 1992 End of 1991
Capital expenditures(other than land)
Total
Buildings,structures,
and relatedfacilities
Machinery,equipment,
and other Total
Buildings,structures,
and relatedfacilities
Machinery,equipment,
and other Total New Used
Deductionsfrom
depreciableassets
in 1992
Merchant wholesalers 1 173 269................... 56 471 116 798 161 942 53 293 108 650 18 030 16 601 1 429 6 764
50 Durable goods stores 1 89 987............................ 27 550 62 437 84 344 26 142 58 202 9 687 9 030 657 4 104
501 Motor vehicles and automotive parts and supplies 13 934... (S) 7 463 13 160 (S) 7 014 1 094 1 031 (S) 321502 Furniture and home furnishings 3 627................... (S) (S) 3 333 (S) (S) 358 309 (S) 65503 Lumber and other construction materials 6 579........... 2 035 4 544 6 360 1 917 4 443 622 588 (S) 402504 Professional and commercial equipment and
supplies 11 627....................................... 2 825 8 803 10 946 2 786 8 160 1 679 1 639 41 1 058505 Metals and minerals, except petroleum1 9 848............ 2 567 7 280 9 420 2 531 6 888 747 676 (S) (S)506 Electrical goods 11 005................................. 3 666 7 338 9 828 3 292 6 537 1 561 1 452 (S) 385507 Hardware, and plumbing and heating equipment and
supplies 4 428....................................... 1 710 2 718 4 159 1 517 2 643 462 437 26 194508 Machinery, equipment, and supplies 18 458............... 4 945 13 514 17 221 4 742 12 479 2 164 2 013 (S) 926509 Miscellaneous durable goods 10 481..................... 2 190 8 291 9 918 2 179 7 739 1 000 887 (S) (S)
51 Nondurable goods 1 83 281............................... 28 921 54 360 77 598 27 151 50 447 8 343 7 571 772 2 660
511 Paper and paper products 3 712........................ 1 126 2 587 3 440 974 2 466 379 346 (S) 106512 Drugs, drug proprietaries and druggists’ sundries 2 213.... (S) 1 420 1 828 566 1 263 (S) (S) 14 (S)513 Apparel, piece goods, and notions 4 222................. 1 481 2 741 4 001 1 391 2 610 410 372 (S) 189514 Groceries and related products 23 541.................... 7 682 15 859 22 086 7 642 14 444 2 315 2 138 (S) 859515 Farm~product raw materials1 11 405...................... 5 259 6 146 10 800 5 093 5 707 748 590 (S) 144516 Chemicals and allied products 6 546..................... 1 956 4 590 5 859 1 598 4 262 862 835 (S) 175517 Petroleum and petroleum products 12 497................ 3 904 8 593 11 699 3 677 8 022 1 306 1 206 (S) (S)518 Beer, wine and distilled alcoholic beverages 4 166........ 1 507 2 659 3 827 1 439 2 388 (S) (S) (S) (S)519 Miscellaneous nondurable goods 14 978.................. 5 213 9 765 14 058 4 772 9 286 1 423 1 249 (S) (S)
Note: Detail may not add to total because of rounding. See table 13 for estimated measures of sampling variability (coefficients of variation). Value of assets at end of 1991 plus 1992 capitalexpenditures minus asset deductions may not necessarily equal the value of assets at end of 1992 due to corporate mergers, exchange of stock, and other noncategorized acquisitions, not shownseparately.
1Sales data for SIC’s 5051 pt. and the 515 trade group are reported on a different basis than the 1992 Census of Wholesale Trade. For an explanation of these differences see Method ofEstimation in appendix A.
WHOLESALE TRADEmSUBJECT SERIES ASSETS AND EXPENDITURES 2–7

Table 3. Detailed Capital Expenditures by Kind of Business: 1992[Dollar amounts are in millions. Data are shown only for establishments with payroll. For meaning of abbreviations and symbols, see introductory text]
SIC code Kind of business
Capital expenditures (other than land)
New capital expenditures
Total Total
Buildings,structures,
and relatedfacilities
Highwayvehicles
Computerhardwareand data
processingequipment All other
Used buildings,structures,machinery,equipment,
and otherdepreciable
assets acquiredfrom others
Merchant wholesalers 1 18 030................... 16 601 3 571 2 949 2 119 7 962 1 429
50 Durable goods stores 1 9 687............................ 9 030 1 536 1 398 1 365 4 732 657
501 Motor vehicles and automotive parts and supplies 1 094... 1 031 (S) 188 (S) 334 (S)502 Furniture and home furnishings 358................... 309 (S) (S) (S) (S) (S)503 Lumber and other construction materials 622........... 588 (S) 198 33 270 (S)504 Professional and commercial equipment and
supplies 1 679....................................... 1 639 (S) (S) 331 847 41505 Metals and minerals, except petroleum1 747............ 676 99 78 49 450 (S)506 Electrical goods 1 561................................. 1 452 311 84 157 900 (S)507 Hardware, and plumbing and heating equipment and
supplies 462....................................... 437 99 105 78 154 26508 Machinery, equipment, and supplies 2 164............... 2 013 151 410 (S) (S) (S)509 Miscellaneous durable goods 1 000..................... 887 123 140 132 493 (S)
51 Nondurable goods 1 8 343............................... 7 571 2 035 1 551 754 3 231 772
511 Paper and paper products 379........................ 346 57 70 73 145 (S)512 Drugs, drug proprietaries and druggists’ sundries (S).... (S) (S) (S) 75 99 14513 Apparel, piece goods, and notions 410................. 372 80 (S) 58 219 (S)514 Groceries and related products 2 315.................... 2 138 557 521 217 842 (S)515 Farm~product raw materials1 748...................... 590 186 66 40 297 (S)516 Chemicals and allied products 862..................... 835 (S) 104 38 351 (S)517 Petroleum and petroleum products 1 306................ 1 206 323 225 59 600 (S)518 Beer, wine and distilled alcoholic beverages (S)........ (S) (S) (S) 36 92 (S)519 Miscellaneous nondurable goods 1 423.................. 1 249 180 327 157 (S) (S)
Note: Detail may not add to total because of rounding. See table 13 for estimated measures of sampling variability (coefficients of variation).
1Sales data for SIC’s 5051 pt. and the 515 trade group are reported on a different basis than the 1992 Census of Wholesale Trade. For an explanation of these differences see Method ofEstimation in appendix A.
Table 4. Detailed Acquisition Value of Depreciable Assets, Depreciation Charges, and Leaseand Rental Payments by Kind of Business: 1992
[Dollar amounts are in millions. Data are shown only for establishments with payroll. For meaning of abbreviations and symbols, see introductory text]
SIC code Kind of business
Acquisition value of depreciable assets
End of 1992 End of 1991Depreciation charges in 1992 Lease and rental payments
Total
Buildings,structures,
andrelated
facilities
Machinery,equipment,
and other Total
Buildings,structures,
andrelated
facilities
Machinery,equipment,
and other Total
Buildings,structures,
andrelated
facilities
Machinery,equipment,
and other Total
Buildings,structures,
andrelated
facilities
Machinery,equipment,
and other
Merchant wholesalers 1 173 269........... 56 471 116 798 161 942 53 293 108 650 14 420 2 811 11 608 16 651 12 645 4 006
50 Durable goods stores 1 89 987................... 27 550 62 437 84 344 26 142 58 202 8 110 1 402 6 707 9 810 7 900 1 910
501 Motor vehicles and automotive parts andsupplies 13 934.............................. (S) 7 463 13 160 (S) 7 014 1 126 290 836 1 291 1 074 217
502 Furniture and home furnishings 3 627........... (S) (S) 3 333 (S) (S) 265 44 221 634 570 65503 Lumber and other construction materials 6 579... 2 035 4 544 6 360 1 917 4 443 522 103 418 763 581 182504 Professional and commercial equipment
and supplies 11 627.......................... 2 825 8 803 10 946 2 786 8 160 1 351 214 1 137 1 716 1 463 254505 Metals and minerals, except petroleum1 9 848... 2 567 7 280 9 420 2 531 6 888 675 94 582 570 384 186506 Electrical goods 11 005........................ 3 666 7 338 9 828 3 292 6 537 963 160 803 1 028 775 253507 Hardware, and plumbing and heating
equipment and supplies 4 428................ 1 710 2 718 4 159 1 517 2 643 382 86 296 847 702 146508 Machinery, equipment, and supplies 18 458....... 4 945 13 514 17 221 4 742 12 479 1 858 290 1 568 1 830 1 430 399509 Miscellaneous durable goods 10 481............. 2 190 8 291 9 918 2 179 7 739 967 121 846 1 131 922 209
51 Nondurable goods 1 83 281...................... 28 921 54 360 77 598 27 151 50 447 6 311 1 410 4 901 6 841 4 745 2 096
511 Paper and paper products 3 712............... 1 126 2 587 3 440 974 2 466 317 45 271 662 539 123512 Drugs, drug proprietaries and druggists’
sundries 2 213.............................. (S) 1 420 1 828 566 1 263 213 (S) 171 248 192 56513 Apparel, piece goods, and notions 4 222........ 1 481 2 741 4 001 1 391 2 610 400 87 313 870 772 98514 Groceries and related products 23 541........... 7 682 15 859 22 086 7 642 14 444 1 997 386 1 610 1 947 1 071 876515 Farm~product raw materials1 11 405............. 5 259 6 146 10 800 5 093 5 707 564 230 334 283 151 132516 Chemicals and allied products 6 546............ 1 956 4 590 5 859 1 598 4 262 536 107 428 396 273 123517 Petroleum and petroleum products 12 497........ 3 904 8 593 11 699 3 677 8 022 886 226 660 628 448 180518 Beer, wine and distilled alcoholic
beverages 4 166............................ 1 507 2 659 3 827 1 439 2 388 322 70 251 405 248 157519 Miscellaneous nondurable goods 14 978......... 5 213 9 765 14 058 4 772 9 286 1 077 216 862 1 402 1 051 351
Note: Detail may not add to total because of rounding. See table 13 for estimated measures of sampling variability (coefficients of variation).
1Sales data for SIC’s 5051 pt. and the 515 trade group are reported on a different basis than the 1992 Census of Wholesale Trade. For an explanation of these differences see Method ofEstimation in appendix A.
2–8 ASSETS AND EXPENDITURES WHOLESALE TRADEmSUBJECT SERIES
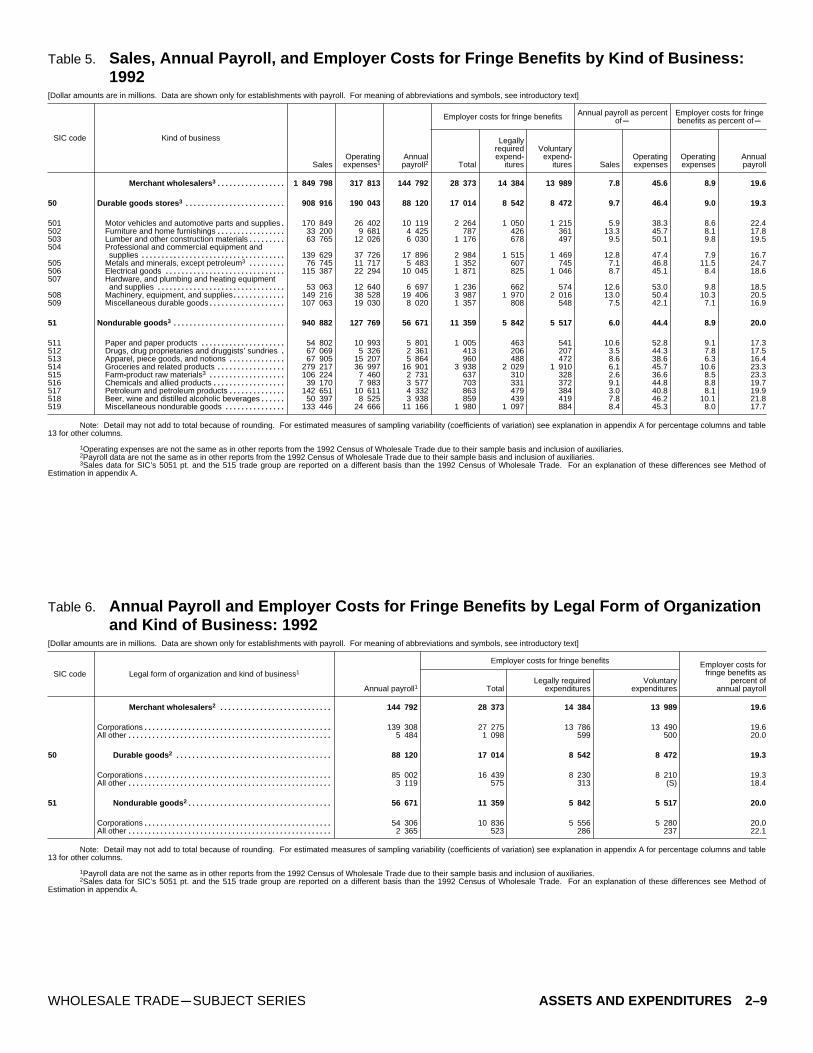
Table 5. Sales, Annual Payroll, and Employer Costs for Fringe Benefits by Kind of Business:1992
[Dollar amounts are in millions. Data are shown only for establishments with payroll. For meaning of abbreviations and symbols, see introductory text]
SIC code Kind of business
Employer costs for fringe benefits Annual payroll as percentofm
Employer costs for fringebenefits as percent ofm
SalesOperating
expenses1Annualpayroll2 Total
Legallyrequiredexpend~
itures
Voluntaryexpend~
itures SalesOperatingexpenses
Operatingexpenses
Annualpayroll
Merchant wholesalers 3 1 849 798................. 317 813 144 792 28 373 14 384 13 989 7.8 45.6 8.9 19.6
50 Durable goods stores 3 908 916......................... 190 043 88 120 17 014 8 542 8 472 9.7 46.4 9.0 19.3
501 Motor vehicles and automotive parts and supplies 170 849. 26 402 10 119 2 264 1 050 1 215 5.9 38.3 8.6 22.4502 Furniture and home furnishings 33 200................. 9 681 4 425 787 426 361 13.3 45.7 8.1 17.8503 Lumber and other construction materials 63 765......... 12 026 6 030 1 176 678 497 9.5 50.1 9.8 19.5504 Professional and commercial equipment and
supplies 139 629.................................... 37 726 17 896 2 984 1 515 1 469 12.8 47.4 7.9 16.7505 Metals and minerals, except petroleum3 76 745......... 11 717 5 483 1 352 607 745 7.1 46.8 11.5 24.7506 Electrical goods 115 387.............................. 22 294 10 045 1 871 825 1 046 8.7 45.1 8.4 18.6507 Hardware, and plumbing and heating equipment
and supplies 53 063................................ 12 640 6 697 1 236 662 574 12.6 53.0 9.8 18.5508 Machinery, equipment, and supplies 149 216............. 38 528 19 406 3 987 1 970 2 016 13.0 50.4 10.3 20.5509 Miscellaneous durable goods 107 063................... 19 030 8 020 1 357 808 548 7.5 42.1 7.1 16.9
51 Nondurable goods 3 940 882............................ 127 769 56 671 11 359 5 842 5 517 6.0 44.4 8.9 20.0
511 Paper and paper products 54 802..................... 10 993 5 801 1 005 463 541 10.6 52.8 9.1 17.3512 Drugs, drug proprietaries and druggists’ sundries 67 069. 5 326 2 361 413 206 207 3.5 44.3 7.8 17.5513 Apparel, piece goods, and notions 67 905.............. 15 207 5 864 960 488 472 8.6 38.6 6.3 16.4514 Groceries and related products 279 217................. 36 997 16 901 3 938 2 029 1 910 6.1 45.7 10.6 23.3515 Farm~product raw materials3 106 224................... 7 460 2 731 637 310 328 2.6 36.6 8.5 23.3516 Chemicals and allied products 39 170.................. 7 983 3 577 703 331 372 9.1 44.8 8.8 19.7517 Petroleum and petroleum products 142 651.............. 10 611 4 332 863 479 384 3.0 40.8 8.1 19.9518 Beer, wine and distilled alcoholic beverages 50 397...... 8 525 3 938 859 439 419 7.8 46.2 10.1 21.8519 Miscellaneous nondurable goods 133 446............... 24 666 11 166 1 980 1 097 884 8.4 45.3 8.0 17.7
Note: Detail may not add to total because of rounding. For estimated measures of sampling variability (coefficients of variation) see explanation in appendix A for percentage columns and table13 for other columns.
1Operating expenses are not the same as in other reports from the 1992 Census of Wholesale Trade due to their sample basis and inclusion of auxiliaries.2Payroll data are not the same as in other reports from the 1992 Census of Wholesale Trade due to their sample basis and inclusion of auxiliaries.3Sales data for SIC’s 5051 pt. and the 515 trade group are reported on a different basis than the 1992 Census of Wholesale Trade. For an explanation of these differences see Method of
Estimation in appendix A.
Table 6. Annual Payroll and Employer Costs for Fringe Benefits by Legal Form of Organizationand Kind of Business: 1992
[Dollar amounts are in millions. Data are shown only for establishments with payroll. For meaning of abbreviations and symbols, see introductory text]
SIC code Legal form of organization and kind of business1
Employer costs for fringe benefits
Annual payroll1 TotalLegally required
expendituresVoluntary
expenditures
Employer costs forfringe benefits as
percent ofannual payroll
Merchant wholesalers 2 144 792............................ 28 373 14 384 13 989 19.6
Corporations 139 308............................................... 27 275 13 786 13 490 19.6All other 5 484................................................... 1 098 599 500 20.0
50 Durable goods 2 88 120....................................... 17 014 8 542 8 472 19.3
Corporations 85 002............................................... 16 439 8 230 8 210 19.3All other 3 119................................................... 575 313 (S) 18.4
51 Nondurable goods 2 56 671.................................... 11 359 5 842 5 517 20.0
Corporations 54 306............................................... 10 836 5 556 5 280 20.0All other 2 365................................................... 523 286 237 22.1
Note: Detail may not add to total because of rounding. For estimated measures of sampling variability (coefficients of variation) see explanation in appendix A for percentage columns and table13 for other columns.
1Payroll data are not the same as in other reports from the 1992 Census of Wholesale Trade due to their sample basis and inclusion of auxiliaries.2Sales data for SIC’s 5051 pt. and the 515 trade group are reported on a different basis than the 1992 Census of Wholesale Trade. For an explanation of these differences see Method of
Estimation in appendix A.
WHOLESALE TRADEmSUBJECT SERIES ASSETS AND EXPENDITURES 2–9

Table 7. Operating Expenses by Type and by Kind of Business: 1992[Dollar amounts are in millions. Data are shown only for establishments with payroll. For meaning of abbreviations and symbols, see introductory text]
SICcode Kind of business
Annual payroll2 Employer costsfor fringe benefits
Taxes andlicense fees
Depreciation andamortization
charges
Lease andrental payments
Operatingexpenses1 Amount Percent Amount Percent Amount Percent Amount Percent Amount Percent
Merchant wholesalers 4 317 813..... 144 792 45.6 28 373 8.9 4 988 1.6 14 420 4.5 16 651 5.2
50 Durable goods stores 4 190 043.............. 88 120 46.4 17 014 9.0 2 483 1.3 8 110 4.3 9 810 5.2
501 Motor vehicles and automotive partsand supplies 26 402..................... 10 119 38.3 2 264 8.6 358 1.4 1 126 4.3 1 291 4.9
502 Furniture and home furnishings 9 681..... 4 425 45.7 787 8.1 (S) (S) 265 2.7 634 6.6503 Lumber and other construction
materials 12 026........................ 6 030 50.1 1 176 9.8 150 1.2 522 4.3 763 6.3504 Professional and commercial
equipment and supplies 37 726........... 17 896 47.4 2 984 7.9 (S) (S) 1 351 3.6 1 716 4.5505 Metals and minerals, except
petroleum4 11 717...................... 5 483 46.8 1 352 11.5 232 2.0 675 5.8 570 4.9506 Electrical goods 22 294................... 10 045 45.1 1 871 8.4 232 1.0 963 4.3 1 028 4.6507 Hardware, and plumbing and heating
equipment and supplies 12 640........... 6 697 53.0 1 236 9.8 130 1.0 382 3.0 847 6.7508 Machinery, equipment, and supplies 38 528. 19 406 50.4 3 987 10.3 433 1.1 1 858 4.8 1 830 4.7509 Miscellaneous durable goods 19 030....... 8 020 42.1 1 357 7.1 251 1.3 967 5.1 1 131 5.9
51 Nondurable goods 4 127 769................. 56 671 44.4 11 359 8.9 2 506 2.0 6 311 4.9 6 841 5.4
511 Paper and paper products 10 993.......... 5 801 52.8 1 005 9.1 141 1.3 317 2.9 662 6.0512 Drugs, drug proprietaries and
druggists’ sundries 5 326................ 2 361 44.3 413 7.8 66 1.2 213 4.0 248 4.6513 Apparel, piece goods, and notions 15 207... 5 864 38.6 960 6.3 (S) (S) 400 2.6 870 5.7514 Groceries and related products 36 997...... 16 901 45.7 3 938 10.6 559 1.5 1 997 5.4 1 947 5.3515 Farm~product raw materials4 7 460........ 2 731 36.6 637 8.5 153 2.0 564 7.6 283 3.8516 Chemicals and allied products 7 983....... 3 577 44.8 703 8.8 100 1.3 536 6.7 396 5.0517 Petroleum and petroleum products 10 611.. 4 332 40.8 863 8.1 (S) (S) 886 8.4 628 5.9518 Beer, wine and distilled alcoholic
beverages 8 525....................... 3 938 46.2 859 10.1 (S) (S) 322 3.8 405 4.8519 Miscellaneous nondurable goods 24 666.... 11 166 45.3 1 980 8.0 (S) (S) 1 077 4.4 1 402 5.7
SICcode Kind of business
Telephone and otherpurchased
communicationsPurchased utilities3 Purchased office
suppliesPurchased packagingand other materials Advertising services Commissions paid
Amount Percent Amount Percent Amount Percent Amount Percent Amount Percent Amount Percent
Merchant wholesalers 4 6 434..... 2.0 5 872 1.8 4 300 1.4 4 288 1.3 10 881 3.4 7 602 2.4
50 Durable goods stores 4 4 551.............. 2.4 2 948 1.6 2 626 1.4 2 158 1.1 7 856 4.1 4 365 2.3
501 Motor vehicles and automotive partsand supplies 494..................... 1.9 394 1.5 215 .8 265 1.0 2 849 10.8 273 1.0
502 Furniture and home furnishings 170..... 1.8 144 1.5 127 1.3 (S) (S) (S) (S) 469 4.8503 Lumber and other construction
materials 263........................ 2.2 260 2.2 148 1.2 132 1.1 178 1.5 (S) (S)504 Professional and commercial
equipment and supplies 1 249........... 3.3 336 .9 559 1.5 (S) (S) 1 705 4.5 711 1.9505 Metals and minerals, except
petroleum4 214...................... 1.8 286 2.4 114 1.0 (S) (S) 54 .5 108 .9506 Electrical goods 487................... 2.2 (S) (S) 331 1.5 140 .6 785 3.5 1 106 5.0507 Hardware, and plumbing and heating
equipment and supplies 321........... 2.5 195 1.5 219 1.7 101 .8 265 2.1 (S) (S)508 Machinery, equipment, and supplies 982. 2.5 536 1.4 667 1.7 401 1.0 701 1.8 813 2.1509 Miscellaneous durable goods 372....... 2.0 431 2.3 246 1.3 279 1.5 911 4.8 658 3.5
51 Nondurable goods 4 1 883................. 1.5 2 925 2.3 1 674 1.3 2 130 1.7 3 025 2.4 3 237 2.5
511 Paper and paper products 240.......... 2.2 172 1.6 152 1.4 (S) (S) 153 1.4 (S) (S)512 Drugs, drug proprietaries and
druggists’ sundries 96................ 1.8 81 1.5 93 1.7 81 1.5 (S) (S) (S) (S)513 Apparel, piece goods, and notions 189... 1.2 188 1.2 185 1.2 208 1.4 610 4.0 885 5.8514 Groceries and related products 421...... 1.1 1 062 2.9 401 1.1 (S) (S) 842 2.3 488 1.3515 Farm~product raw materials4 (S)........ (S) 385 5.2 80 1.1 86 1.2 58 .8 (S) (S)516 Chemicals and allied products 144....... 1.8 159 2.0 95 1.2 (S) (S) 100 1.3 114 1.4517 Petroleum and petroleum products 158.. 1.5 253 2.4 142 1.3 (S) (S) 101 1.0 226 2.1518 Beer, wine and distilled alcoholic
beverages 75....................... .9 120 1.4 78 .9 83 1.0 414 4.9 (S) (S)519 Miscellaneous nondurable goods 450.... 1.8 504 2.0 (S) (S) (S) (S) 572 2.3 (S) (S)
See footnotes at end of table.
2–10 ASSETS AND EXPENDITURES WHOLESALE TRADEmSUBJECT SERIES

Table 7. Operating Expenses by Type and by Kind of Business: 1992 mCon.[Dollar amounts are in millions. Data are shown only for establishments with payroll. For meaning of abbreviations and symbols, see introductory text]
SICcode Kind of business
Contract work Purchased repairservices
Cost of purchased legalservices
Cost of purchasedaccounting, auditing,
and bookkeepingservices
Cost of data processingand other computer~
related services
Other operatingexpenses
Amount Percent Amount Percent Amount Percent Amount Percent Amount Percent Amount Percent
Merchant wholesalers 4 4 533...... 1.4 5 506 1.7 2 434 .8 2 414 .8 1 296 .4 53 029 16.7
50 Durable goods stores 4 2 592.............. 1.4 2 638 1.4 1 460 .8 1 563 .8 837 .4 30 913 16.3
501 Motor vehicles and automotive partsand supplies (S)..................... (S) 286 1.1 219 .8 (S) (S) 151 .6 5 530 20.9
502 Furniture and home furnishings 360...... 3.7 97 1.0 58 .6 88 .9 25 .3 (S) (S)503 Lumber and other construction
materials 194........................ 1.6 289 2.4 94 .8 80 .7 (S) (S) 1 593 13.2504 Professional and commercial
equipment and supplies (S)........... (S) 353 .9 220 .6 217 .6 154 .4 6 644 17.6505 Metals and minerals, except
petroleum4 (S)....................... (S) 302 2.6 75 .6 72 .6 33 .3 1 536 13.1506 Electrical goods (S)................... (S) 205 .9 (S) (S) 167 .8 117 .5 4 092 18.4507 Hardware, and plumbing and heating
equipment and supplies (S)........... (S) 143 1.1 80 .6 113 .9 45 .4 1 628 12.9508 Machinery, equipment, and supplies (S).. (S) 516 1.3 278 .7 300 .8 216 .6 5 286 13.7509 Miscellaneous durable goods (S)........ (S) 447 2.3 225 1.2 176 .9 49 .3 3 232 17.0
51 Nondurable goods 4 1 941................. 1.5 2 868 2.2 974 .8 851 .7 459 .4 22 116 17.3
511 Paper and paper products (S).......... (S) 115 1.0 50 .5 74 .7 42 .4 1 566 14.2512 Drugs, drug proprietaries and
druggists’ sundries (S)................ (S) 57 1.1 55 1.0 (S) (S) (S) (S) 1 180 22.2513 Apparel, piece goods, and notions (S)... (S) 126 .8 169 1.1 124 .8 53 .3 3 133 20.6514 Groceries and related products (S)...... (S) 934 2.5 217 .6 178 .5 125 .3 5 814 15.7515 Farm~product raw materials4 106........ 1.4 393 5.3 (S) (S) 53 .7 (S) (S) (S) (S)516 Chemicals and allied products (S)....... (S) 191 2.4 60 .8 59 .7 (S) (S) 1 395 17.5517 Petroleum and petroleum products (S)... (S) 419 3.9 105 1.0 75 .7 47 .4 1 896 17.9518 Beer, wine and distilled alcoholic
beverages 13....................... .2 152 1.8 53 .6 48 .6 24 .3 1 595 18.7519 Miscellaneous nondurable goods (S).... (S) 482 2.0 186 .8 193 .8 77 .3 3 971 16.1
Note: Detail may not add to total because of rounding. For estimated measures of sampling variability (coefficients of variation) see explanation in appendix A for percentage columns and table13 for other columns.
1Operating expenses are not the same as in other reports from the 1992 Census of Wholesale Trade due to their sample basis and inclusion of auxiliaries.2Payroll data are not the same as in other reports from the 1992 Census of Wholesale Trade due to their sample basis and inclusion of auxiliaries.3These data represent only utilities which were purchased by firms in 1992, and exclude those utility costs which were part of normal lease and rental payments or franchise fees.4Sales data for SIC’s 5051 pt. and the 515 trade group are reported on a different basis than the 1992 Census of Wholesale Trade. For an explanation of these differences see Method of
Estimation in appendix A.
Table 8. Detailed Purchased Utilities by Kind of Business: 1992[Dollar amounts are in millions. Data are shown only for establishments with payroll. For meaning of abbreviations and symbols, see introductory text]
SIC code Kind of business
Cost of purchased utilities2
Operating expenses1 All utilities Electricity Fuels (nonhighway)Water, sewer, and
other utilities
Merchant wholesalers 3 317 813............................ 5 872 3 872 1 310 690
50 Durable goods stores 3 190 043.................................... 2 948 1 969 586 392
501 Motor vehicles and automotive parts and supplies 26 402............ 394 264 71 59502 Furniture and home furnishings 9 681............................ 144 99 30 16503 Lumber and other construction materials 12 026.................... 260 163 60 37504 Professional and commercial equipment and supplies 37 726........ 336 251 41 45505 Metals and minerals, except petroleum3 11 717.................... 286 190 (S) 29506 Electrical goods 22 294......................................... (S) (S) (S) (S)507 Hardware, and plumbing and heating equipment and supplies 12 640. 195 123 49 23508 Machinery, equipment, and supplies 38 528........................ 536 367 96 73509 Miscellaneous durable goods 19 030.............................. 431 248 114 69
51 Nondurable goods 3 127 769....................................... 2 925 1 902 724 298
511 Paper and paper products 10 993................................ 172 131 27 15512 Drugs, drug proprietaries and druggists’ sundries 5 326............ 81 59 15 7513 Apparel, piece goods, and notions 15 207......................... 188 128 39 22514 Groceries and related products 36 997............................ 1 062 700 247 115515 Farm~product raw materials3 7 460.............................. 385 (S) (S) (S)516 Chemicals and allied products 7 983............................. 159 98 36 24517 Petroleum and petroleum products 10 611......................... 253 160 65 29518 Beer, wine and distilled alcoholic beverages 8 525................. 120 75 (S) 12519 Miscellaneous nondurable goods 24 666.......................... 504 319 134 50
Note: Detail may not add to total because of rounding. See table 13 for estimated measures of sampling variability (coefficients of variation).
1Operating expenses are not the same as in other reports from the 1992 Census of Wholesale Trade due to their sample basis and inclusion of auxiliaries.2These data represent only utilities which were purchased by firms in 1992, and exclude those utility costs which were part of normal lease and rental payments or franchise fees.3Sales data for SIC’s 5051 pt. and the 515 trade group are reported on a different basis than the 1992 Census of Wholesale Trade. For an explanation of these differences see Method of
Estimation in appendix A.
WHOLESALE TRADEmSUBJECT SERIES ASSETS AND EXPENDITURES 2–11

Table 9. Detailed Repair Services by Kind of Business: 1992[Dollar amounts are in millions. Data are shown only for establishments with payroll. For meaning of abbreviations and symbols, see introductory text]
SIC code Kind of business
Purchased repair services
Operatingexpenses1 Total
Buildings,structures, andrelated facilities
Machinery,equipment,
and other
Acquisition valueof depreciable
assets atend of 1992
Capitalexpenditures (other
than land)
Merchant wholesalers 2 317 813.......................... 5 506 1 524 3 983 173 269 18 030
50 Durable goods stores 2 190 043.................................. 2 638 773 1 865 89 987 9 687
501 Motor vehicles and automotive parts and supplies 26 402.......... 286 114 172 13 934 1 094502 Furniture and home furnishings 9 681.......................... 97 31 67 3 627 358503 Lumber and other construction materials 12 026.................. 289 62 227 6 579 622504 Professional and commercial equipment and supplies 37 726....... 353 116 237 11 627 1 679505 Metals and minerals, except petroleum2 11 717................... 302 57 245 9 848 747506 Electrical goods 22 294........................................ 205 82 122 11 005 1 561507 Hardware, and plumbing and heating equipment and
supplies 12 640.............................................. 143 56 87 4 428 462508 Machinery, equipment, and supplies 38 528...................... 516 (S) (S) 18 458 2 164509 Miscellaneous durable goods 19 030............................ 447 75 372 10 481 1 000
51 Nondurable goods 2 127 769..................................... 2 868 751 2 118 83 281 8 343
511 Paper and paper products 10 993............................... 115 34 81 3 712 379512 Drugs, drug proprietaries and druggists’ sundries 5 326........... 57 18 39 2 213 (S)513 Apparel, piece goods, and notions 15 207........................ 126 34 92 4 222 410514 Groceries and related products 36 997.......................... 934 199 735 23 541 2 315515 Farm~product raw materials2 7 460............................. 393 152 241 11 405 748516 Chemicals and allied products 7 983........................... 191 41 151 6 546 862517 Petroleum and petroleum products 10 611....................... 419 114 305 12 497 1 306518 Beer, wine and distilled alcoholic beverages 8 525............... 152 38 115 4 166 (S)519 Miscellaneous nondurable goods 24 666......................... 482 122 360 14 978 1 423
Note: Detail may not add to total because of rounding. See table 13 for estimated measures of sampling variability (coefficients of variation).
1Operating expenses are not the same as in other reports from the 1992 Census of Wholesale Trade due to their sample basis and inclusion of auxiliaries.2Sales data for SIC’s 5051 pt. and the 515 trade group are reported on a different basis than the 1992 Census of Wholesale Trade. For an explanation of these differences see Method of
Estimation in appendix A.
Table 10. Sales, Cost of Goods Sold, and Measures of Value Produced by Kind of Business:1992
[Dollar amounts are in millions. Data are shown only for establishments with payroll. For meaning of abbreviations and symbols, see introductory text]
SIC code Kind of business
Net income produced atmGross margin Value added
Market prices Factor costAnnual payroll1
SalesCost of
goods sold AmountPercentof sales Amount
Percentof sales Amount
Percentof sales Amount
Percentof sales Amount
Percentof sales
Merchant wholesalers 2 1 849 798.............. 1 469 268 380 530 20.6 362 227 19.6 255 290 13.8 235 882 12.8 144 792 7.8
50 Durable goods stores 2 908 916...................... 681 924 226 992 25.0 217 060 23.9 152 675 16.8 142 083 15.6 88 120 9.7
501 Motor vehicles and automotive parts andsupplies 170 849.................................. 137 904 (S) (S) (S) (S) (S) (S) (S) (S) 10 119 5.9
502 Furniture and home furnishings 33 200.............. 21 339 11 861 35.7 11 114 33.5 7 776 23.4 7 392 22.3 4 425 13.3503 Lumber and other construction materials 63 765...... 48 733 15 032 23.6 14 335 22.5 10 883 17.1 10 211 16.0 6 030 9.5504 Professional and commercial equipment and
supplies 139 629.................................. 96 455 43 174 30.9 41 273 29.6 28 259 20.2 26 328 18.9 17 896 12.8505 Metals and minerals, except petroleum2 76 745....... 61 071 15 674 20.4 14 690 19.1 11 699 15.2 10 792 14.1 5 483 7.1506 Electrical goods 115 387............................ 87 006 28 381 24.6 27 440 23.8 19 198 16.6 18 004 15.6 10 045 8.7507 Hardware, and plumbing and heating
equipment and supplies 53 063.................... 38 365 14 698 27.7 14 087 26.5 10 503 19.8 9 991 18.8 6 697 12.6508 Machinery, equipment, and supplies 149 216.......... 107 459 41 757 28.0 39 906 26.7 28 912 19.4 26 621 17.8 19 406 13.0509 Miscellaneous durable goods 107 063................ 83 592 23 471 21.9 22 304 20.8 15 035 14.0 13 817 12.9 8 020 7.5
51 Nondurable goods 2 940 882......................... 787 344 153 538 16.3 145 167 15.4 102 615 10.9 93 799 10.0 56 671 6.0
511 Paper and paper products 54 802................... 42 505 12 297 22.4 11 815 21.6 8 567 15.6 8 110 14.8 5 801 10.6512 Drugs, drug proprietaries and druggists’
sundries 67 069................................. 59 565 7 504 11.2 7 207 10.7 5 232 7.8 4 953 7.4 2 361 3.5513 Apparel, piece goods, and notions 67 905............ 48 067 19 838 29.2 18 180 26.8 12 000 17.7 11 455 16.9 5 864 8.6514 Groceries and related products 279 217.............. 237 960 41 257 14.8 38 737 13.9 27 656 9.9 25 100 9.0 16 901 6.1515 Farm~product raw materials2 106 224................. 96 133 10 091 9.5 9 459 8.9 6 716 6.3 5 999 5.6 2 731 2.6516 Chemicals and allied products 39 170............... 29 641 9 529 24.3 8 981 22.9 6 461 16.5 5 826 14.9 3 577 9.1517 Petroleum and petroleum products 142 651........... 129 904 12 747 8.9 12 259 8.6 8 575 6.0 7 331 5.1 4 332 3.0518 Beer, wine and distilled alcoholic beverages 50 397... 38 409 11 988 23.8 11 707 23.2 8 881 17.6 8 260 16.4 3 938 7.8519 Miscellaneous nondurable goods 133 446............. 105 160 28 286 21.2 26 822 20.1 18 528 13.9 16 766 12.6 11 166 8.4
Note: Detail may not add to total because of rounding. For estimated measures of sampling variability (coefficients of variation) see explanation in appendix A for percentage columns and table13 for other columns.
1Payroll data are not the same as in other reports from the 1992 Census of Wholesale Trade due to their sample basis and inclusion of auxiliaries.2Sales data for SIC’s 5051 pt. and the 515 trade group are reported on a different basis than the 1992 Census of Wholesale Trade. For an explanation of these differences see Method of
Estimation in appendix A.
2–12 ASSETS AND EXPENDITURES WHOLESALE TRADEmSUBJECT SERIES

Table 11. Sales, Cost of Goods Sold, Measures of Value Produced, and Annual Payroll by LegalForm of Organization: 1992
[Dollar amounts are in millions. Data are shown only for establishments with payroll. For meaning of abbreviations and symbols, see introductory text]
SIC code Legal form of organization
Net income produced atmGross margin Value added
Market prices Factor costAnnual payroll1
SalesCost of
goods sold AmountPercentof sales Amount
Percentof sales Amount
Percentof sales Amount
Percentof sales Amount
Percentof sales
Merchant wholesalers 2 1 849 798.............. 1 469 268 380 530 20.6 362 227 19.6 255 290 13.8 235 882 12.8 144 792 7.8
Corporations 1 765 899................................ 1 408 702 357 198 20.2 340 108 19.3 238 043 13.5 219 644 12.4 139 308 7.9All other 83 898..................................... 60 566 23 332 27.8 22 119 26.4 17 247 20.6 16 238 19.4 5 484 6.5
50 Durable goods 2 908 916......................... 681 924 226 992 25.0 217 060 23.9 152 675 16.8 142 083 15.6 88 120 9.7
Corporations 877 893................................ 660 956 216 937 24.7 207 714 23.7 146 196 16.7 136 019 15.5 85 002 9.7All other 31 024..................................... 20 968 10 055 32.4 9 347 30.1 (S) (S) (S) (S) 3 119 10.1
51 Nondurable goods 2 940 882..................... 787 344 153 538 16.3 145 167 15.4 102 615 10.9 93 799 10.0 56 671 6.0
Corporations 888 007................................ 747 746 140 261 15.8 132 394 14.9 91 848 10.3 83 625 9.4 54 306 6.1All other 52 875..................................... 39 598 13 277 25.1 12 773 24.2 10 767 20.4 10 174 19.2 2 365 4.5
Note: Detail may not add to total because of rounding. For estimated measures of sampling variability (coefficients of variation) see explanation in appendix A for percentage columns and table13 for other columns.
1Payroll data are not the same as in other reports from the 1992 Census of Wholesale Trade due to their sample basis and inclusion of auxiliaries.2Sales data for SIC’s 5051 pt. and the 515 trade group are reported on a different basis than the 1992 Census of Wholesale Trade. For an explanation of these differences see Method of
Estimation in appendix A.
Table 12. Acquisition Value of Depreciable Assets, Capital Expenditures, Sales, and TotalOperating Expenses of Corporations by Kind of Business: 1992
[Dollar amounts are in millions. Data are shown only for establishments with payroll. For meaning of abbreviations and symbols, see introductory text]
SIC code Kind of business
Acquisition value of depreciable assetsatm
End of 1992 End of 1991
Capitalexpenditures
(other than land) Sales
Purchases ofmerchandise
for resaleOperating
expenses1
Merchant wholesalers 2 162 466.......................... 151 882 17 045 1 765 899 1 401 366 304 137
50 Durable goods stores 2 86 308.................................. 80 929 9 327 877 893 657 192 182 359
501 Motor vehicles and automotive parts and supplies 13 191.......... 12 459 1 037 164 836 127 306 24 890502 Furniture and home furnishings 3 475.......................... 3 206 331 31 892 20 658 9 299503 Lumber and other construction materials 6 276.................. 6 072 590 60 602 46 785 11 372504 Professional and commercial equipment and supplies 11 328....... 10 673 1 642 135 864 94 134 36 491505 Metals and minerals, except petroleum2 9 491................... 9 091 713 74 949 59 657 11 316506 Electrical goods 10 693........................................ 9 552 1 512 112 496 86 019 21 597507 Hardware, and plumbing and heating equipment and
supplies 4 275.............................................. 4 022 443 51 499 37 654 12 288508 Machinery, equipment, and supplies 17 610...................... 16 416 2 103 143 884 103 961 37 196509 Miscellaneous durable goods 9 968............................ 9 436 956 101 872 81 018 17 910
51 Nondurable goods 2 76 158..................................... 70 953 7 718 888 007 744 174 121 778
511 Paper and paper products 3 575............................... 3 307 372 53 266 41 642 10 644512 Drugs, drug proprietaries and druggists’ sundries 2 175........... 1 797 (S) 66 221 60 139 5 252513 Apparel, piece goods, and notions 4 083........................ 3 867 398 65 363 47 212 14 647514 Groceries and related products 22 283.......................... 20 971 2 145 261 317 222 074 35 188515 Farm~product raw materials2 8 928............................. 8 441 617 95 772 85 838 6 574516 Chemicals and allied products 6 458........................... 5 778 853 38 354 29 314 7 804517 Petroleum and petroleum products 11 836....................... 11 088 1 238 135 745 123 607 10 044518 Beer, wine and distilled alcoholic beverages 3 937............... 3 623 (S) 46 990 35 331 8 010519 Miscellaneous nondurable goods 12 883......................... 12 082 1 237 124 980 99 016 23 615
Note: Detail may not add to total because of rounding. See table 13 for estimated measures of sampling variability (coefficients of variation).
1Operating expenses are not the same as in other reports from the 1992 Census of Wholesale Trade due to their sample basis and inclusion of auxiliaries.2Sales data for SIC’s 5051 pt. and the 515 trade group are reported on a different basis than the 1992 Census of Wholesale Trade. For an explanation of these differences see Method of
Estimation in appendix A.
WHOLESALE TRADEmSUBJECT SERIES ASSETS AND EXPENDITURES 2–13

Table 13. Estimated Relative Standard Errors by Kind of Business: 1992[Coefficient of variation in percent. For meaning of abbreviations and symbols, see introductory text]
SIC code Kind of business
Capital expenditures (other than land)
Total
Newcapital
expend~itures
Newbuildings,
structures,and
relatedfacilities
Newhighwayvehicles
Newcomputerhardwareand data
processingequipment
All othernew capital
expend~itures
Usedcapital
expend~itures
Merchant wholesalers 1 2.7........... 2.8 5.9 3.6 4.6 4.0 7.1
50 Durable goods stores 1 4.0................... 4.0 6.7 4.2 6.8 6.2 11.5
501 Motor vehicles and automotive parts andsupplies 12.7............................... 13.2 * 10.9 * 17.6 *
502 Furniture and home furnishings 9.3........... 7.9 * * * * *503 Lumber and other construction materials 6.2... 6.1 * 11.1 8.3 6.7 *504 Professional and commercial equipment
and supplies 11.1........................... 11.3 * * 11.9 16.1 11.5505 Metals and minerals, except petroleum1 5.2.... 5.6 12.4 12.1 7.6 8.6 *506 Electrical goods 7.7......................... 7.8 8.4 12.7 8.9 8.9 *507 Hardware, and plumbing and heating
equipment and supplies 8.8................. 8.9 11.4 13.4 10.7 10.0 17.3508 Machinery, equipment, and supplies 12.0....... 11.8 10.6 8.3 * * *509 Miscellaneous durable goods 8.9............. 9.0 10.6 9.4 12.9 14.6 *
51 Nondurable goods 1 3.6...................... 3.6 9.1 5.7 4.1 4.1 8.7
511 Paper and paper products 6.4................ 6.0 6.4 16.2 8.1 9.3 *512 Drugs, drug proprietaries and druggists’
sundries *.............................. * * * 8.4 14.5 7.6513 Apparel, piece goods, and notions 5.6......... 5.5 14.1 * 7.6 6.6 *514 Groceries and related products 5.0........... 5.2 7.6 12.2 7.9 9.4 *515 Farm~product raw materials1 13.3.............. 12.8 16.1 17.4 14.6 12.9 *516 Chemicals and allied products 15.0............ 15.1 * 14.8 11.1 14.6 *517 Petroleum and petroleum products 7.1........ 6.9 14.5 10.3 7.9 6.9 *518 Beer, wine and distilled alcoholic
beverages *............................. * * * 17.8 17.6 *519 Miscellaneous nondurable goods 9.2.......... 8.7 12.1 9.1 13.3 * *
SIC code Kind of business
Acquisition value of depreciable assets
End of 1992 End of 1991Depreciation charges
Total
Buildings,structures,
andrelated
facilities
Machinery,equipment,
and other Total
Buildings,structures,
andrelated
facilities
Machinery,equipment,
and other
Deduc~tions from
depreci~able assets Total
Buildings,structures,
andrelated
facilities
Machinery,equipment,
and other
Merchant wholesalers 1 1.9........... 3.5 1.8 1.9 3.6 1.9 4.3 1.9 2.7 2.2
50 Durable goods stores 1 2.8................... 6.5 2.5 2.8 6.6 2.6 5.7 2.4 4.4 2.8
501 Motor vehicles and automotive parts andsupplies 12.1............................... * 6.4 12.2 * 6.5 15.7 5.4 16.4 6.1
502 Furniture and home furnishings 5.8........... * * 6.4 * * 9.1 5.3 6.9 5.9503 Lumber and other construction materials 4.5... 5.6 6.2 4.7 5.3 6.4 13.8 5.5 9.0 6.2504 Professional and commercial equipment
and supplies 8.6........................... 11.4 8.5 9.1 9.6 10.6 8.3 7.0 13.6 7.4505 Metals and minerals, except petroleum1 4.8.... 5.6 5.4 5.0 5.6 5.6 * 9.3 5.5 10.4506 Electrical goods 4.7......................... 5.6 5.7 4.7 5.8 5.8 15.0 5.8 5.0 6.4507 Hardware, and plumbing and heating
equipment and supplies 6.0................. 11.4 4.0 6.0 11.0 5.0 16.2 4.7 10.1 4.7508 Machinery, equipment, and supplies 5.9....... 9.3 5.9 5.4 9.5 5.1 12.6 5.6 7.0 6.7509 Miscellaneous durable goods 7.5............. 10.0 8.3 8.0 10.3 9.0 * 8.6 6.6 10.0
51 Nondurable goods 1 2.4...................... 2.9 2.6 2.4 3.1 2.7 6.4 3.0 3.3 3.4
511 Paper and paper products 3.7................ 6.6 3.9 4.1 7.1 4.5 12.2 5.7 10.6 6.3512 Drugs, drug proprietaries and druggists’
sundries 12.1.............................. * 9.4 9.2 15.3 9.4 * 10.4 * 10.5513 Apparel, piece goods, and notions 9.3......... 13.4 8.0 9.7 13.7 8.6 7.3 6.6 8.8 6.8514 Groceries and related products 4.8........... 4.2 5.6 5.1 4.9 6.4 10.7 7.7 6.6 8.6515 Farm~product raw materials1 6.1.............. 6.2 6.8 5.8 6.5 6.3 6.8 5.1 5.8 5.5516 Chemicals and allied products 6.9............ 6.8 8.2 7.5 7.4 7.9 16.3 8.5 8.5 10.4517 Petroleum and petroleum products 6.0........ 7.6 6.1 6.0 8.6 5.7 * 5.7 9.9 5.8518 Beer, wine and distilled alcoholic
beverages 8.4............................. 10.4 8.5 8.6 10.4 8.8 * 10.5 11.5 10.8519 Miscellaneous nondurable goods 7.4.......... 9.8 7.6 6.8 10.5 6.9 * 5.9 10.1 5.9
See footnotes at end of table.
2–14 ASSETS AND EXPENDITURES WHOLESALE TRADEmSUBJECT SERIES
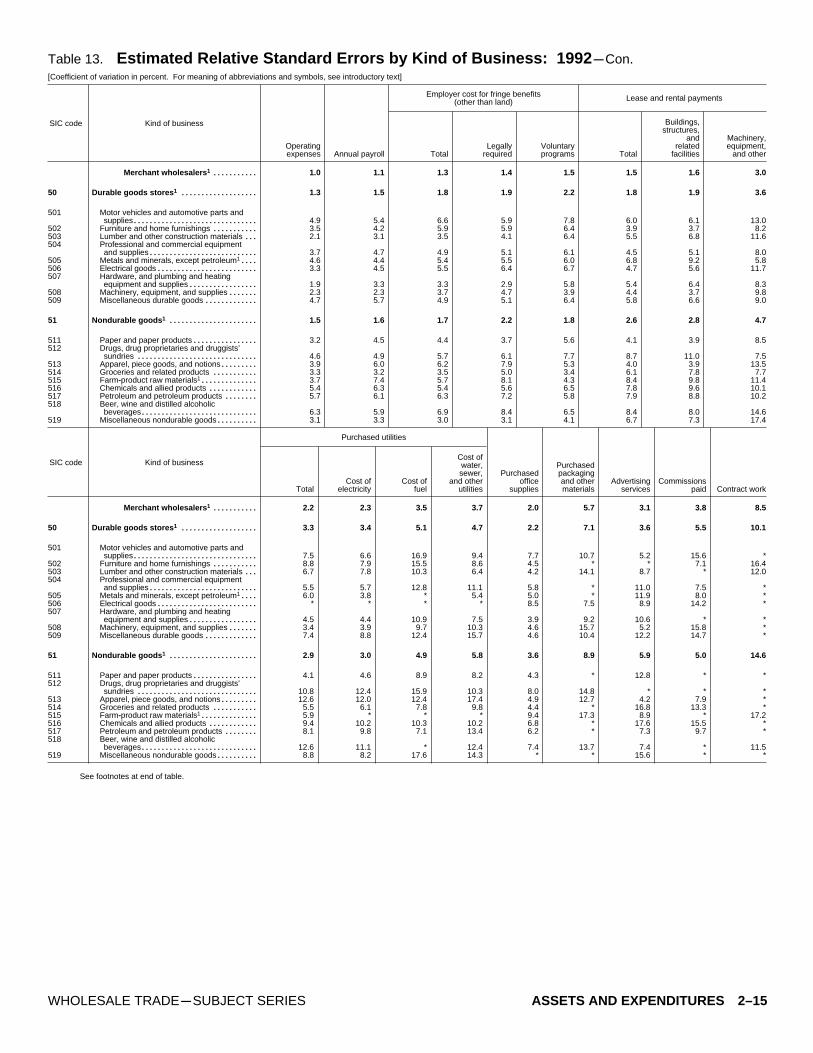
Table 13. Estimated Relative Standard Errors by Kind of Business: 1992 mCon.[Coefficient of variation in percent. For meaning of abbreviations and symbols, see introductory text]
SIC code Kind of business
Employer cost for fringe benefits(other than land) Lease and rental payments
Operatingexpenses Annual payroll Total
Legallyrequired
Voluntaryprograms Total
Buildings,structures,
andrelated
facilities
Machinery,equipment,
and other
Merchant wholesalers 1 1.0........... 1.1 1.3 1.4 1.5 1.5 1.6 3.0
50 Durable goods stores 1 1.3................... 1.5 1.8 1.9 2.2 1.8 1.9 3.6
501 Motor vehicles and automotive parts andsupplies 4.9............................... 5.4 6.6 5.9 7.8 6.0 6.1 13.0
502 Furniture and home furnishings 3.5........... 4.2 5.9 5.9 6.4 3.9 3.7 8.2503 Lumber and other construction materials 2.1... 3.1 3.5 4.1 6.4 5.5 6.8 11.6504 Professional and commercial equipment
and supplies 3.7........................... 4.7 4.9 5.1 6.1 4.5 5.1 8.0505 Metals and minerals, except petroleum1 4.6.... 4.4 5.4 5.5 6.0 6.8 9.2 5.8506 Electrical goods 3.3......................... 4.5 5.5 6.4 6.7 4.7 5.6 11.7507 Hardware, and plumbing and heating
equipment and supplies 1.9................. 3.3 3.3 2.9 5.8 5.4 6.4 8.3508 Machinery, equipment, and supplies 2.3....... 2.3 3.7 4.7 3.9 4.4 3.7 9.8509 Miscellaneous durable goods 4.7............. 5.7 4.9 5.1 6.4 5.8 6.6 9.0
51 Nondurable goods 1 1.5...................... 1.6 1.7 2.2 1.8 2.6 2.8 4.7
511 Paper and paper products 3.2................ 4.5 4.4 3.7 5.6 4.1 3.9 8.5512 Drugs, drug proprietaries and druggists’
sundries 4.6.............................. 4.9 5.7 6.1 7.7 8.7 11.0 7.5513 Apparel, piece goods, and notions 3.9......... 6.0 6.2 7.9 5.3 4.0 3.9 13.5514 Groceries and related products 3.3........... 3.2 3.5 5.0 3.4 6.1 7.8 7.7515 Farm~product raw materials1 3.7.............. 7.4 5.7 8.1 4.3 8.4 9.8 11.4516 Chemicals and allied products 5.4............ 6.3 5.4 5.6 6.5 7.8 9.6 10.1517 Petroleum and petroleum products 5.7........ 6.1 6.3 7.2 5.8 7.9 8.8 10.2518 Beer, wine and distilled alcoholic
beverages 6.3............................. 5.9 6.9 8.4 6.5 8.4 8.0 14.6519 Miscellaneous nondurable goods 3.1.......... 3.3 3.0 3.1 4.1 6.7 7.3 17.4
SIC code Kind of business
Purchased utilities
TotalCost of
electricityCost of
fuel
Cost ofwater,sewer,
and otherutilities
Purchasedoffice
supplies
Purchasedpackagingand othermaterials
Advertisingservices
Commissionspaid Contract work
Merchant wholesalers 1 2.2........... 2.3 3.5 3.7 2.0 5.7 3.1 3.8 8.5
50 Durable goods stores 1 3.3................... 3.4 5.1 4.7 2.2 7.1 3.6 5.5 10.1
501 Motor vehicles and automotive parts andsupplies 7.5............................... 6.6 16.9 9.4 7.7 10.7 5.2 15.6 *
502 Furniture and home furnishings 8.8........... 7.9 15.5 8.6 4.5 * * 7.1 16.4503 Lumber and other construction materials 6.7... 7.8 10.3 6.4 4.2 14.1 8.7 * 12.0504 Professional and commercial equipment
and supplies 5.5........................... 5.7 12.8 11.1 5.8 * 11.0 7.5 *505 Metals and minerals, except petroleum1 6.0.... 3.8 * 5.4 5.0 * 11.9 8.0 *506 Electrical goods *......................... * * * 8.5 7.5 8.9 14.2 *507 Hardware, and plumbing and heating
equipment and supplies 4.5................. 4.4 10.9 7.5 3.9 9.2 10.6 * *508 Machinery, equipment, and supplies 3.4....... 3.9 9.7 10.3 4.6 15.7 5.2 15.8 *509 Miscellaneous durable goods 7.4............. 8.8 12.4 15.7 4.6 10.4 12.2 14.7 *
51 Nondurable goods 1 2.9...................... 3.0 4.9 5.8 3.6 8.9 5.9 5.0 14.6
511 Paper and paper products 4.1................ 4.6 8.9 8.2 4.3 * 12.8 * *512 Drugs, drug proprietaries and druggists’
sundries 10.8.............................. 12.4 15.9 10.3 8.0 14.8 * * *513 Apparel, piece goods, and notions 12.6......... 12.0 12.4 17.4 4.9 12.7 4.2 7.9 *514 Groceries and related products 5.5........... 6.1 7.8 9.8 4.4 * 16.8 13.3 *515 Farm~product raw materials1 5.9.............. * * * 9.4 17.3 8.9 * 17.2516 Chemicals and allied products 9.4............ 10.2 10.3 10.2 6.8 * 17.6 15.5 *517 Petroleum and petroleum products 8.1........ 9.8 7.1 13.4 6.2 * 7.3 9.7 *518 Beer, wine and distilled alcoholic
beverages 12.6............................. 11.1 * 12.4 7.4 13.7 7.4 * 11.5519 Miscellaneous nondurable goods 8.8.......... 8.2 17.6 14.3 * * 15.6 * *
See footnotes at end of table.
WHOLESALE TRADEmSUBJECT SERIES ASSETS AND EXPENDITURES 2–15

Table 13. Estimated Relative Standard Errors by Kind of Business: 1992 mCon.[Coefficient of variation in percent. For meaning of abbreviations and symbols, see introductory text]
SIC code Kind of business
Repair work
Total
Buildings,structures,
andrelated
facilities
Machinery,equipment,
and other
Telephone andother
communicationservices
Cost ofpurchased
legal services
Cost ofpurchased
accounting,auditing, andbookkeeping
services
Cost ofpurchased data
processsingand othercomputer~
related services Other expenses
Merchant wholesalers 1 2.5........... 2.9 2.8 2.0 2.7 9.3 3.5 1.9
50 Durable goods stores 1 4.2................... 4.6 4.7 2.6 3.8 14.3 4.5 2.6
501 Motor vehicles and automotive parts andsupplies 8.3............................... 11.4 8.6 7.2 5.6 * 7.9 8.0
502 Furniture and home furnishings 5.4........... 6.4 6.7 3.1 10.5 9.5 8.6 *503 Lumber and other construction materials 8.4... 10.5 10.3 15.6 9.1 8.0 * 5.4504 Professional and commercial equipment
and supplies 7.6........................... 8.8 10.2 7.0 3.1 7.4 6.8 8.2505 Metals and minerals, except petroleum1 12.5.... 8.9 14.6 4.9 5.8 6.5 9.4 7.2506 Electrical goods 6.9......................... 10.4 7.2 3.7 * 11.0 12.3 4.1507 Hardware, and plumbing and heating
equipment and supplies 7.6................. 8.8 8.9 4.6 11.0 10.9 9.7 5.6508 Machinery, equipment, and supplies 16.1....... * * 5.0 9.2 7.0 12.0 4.9509 Miscellaneous durable goods 9.6............. 7.7 11.2 6.0 7.7 5.3 10.6 6.1
51 Nondurable goods 1 3.0...................... 3.7 3.3 2.6 3.6 3.8 5.4 2.5
511 Paper and paper products 4.6................ 5.5 6.5 11.4 11.8 14.2 14.5 6.7512 Drugs, drug proprietaries and druggists’
sundries 9.2.............................. 8.9 12.2 11.1 12.2 * * 9.0513 Apparel, piece goods, and notions 12.4......... 14.1 12.7 4.8 6.0 9.0 8.6 5.9514 Groceries and related products 6.1........... 9.1 6.7 4.8 10.0 10.6 13.8 7.0515 Farm~product raw materials1 6.9.............. 7.3 7.4 * * 11.3 * *516 Chemicals and allied products 6.7............ 12.6 7.1 6.6 14.8 8.1 * 6.3517 Petroleum and petroleum products 8.1........ 10.3 8.3 6.0 6.9 7.0 12.5 6.4518 Beer, wine and distilled alcoholic
beverages 9.2............................. 11.1 9.5 10.1 7.5 6.8 13.8 10.2519 Miscellaneous nondurable goods 8.2.......... 8.0 9.4 6.0 10.7 8.5 13.1 5.2
SIC code Kind of businessInventories
1992 1991
Purchases ofmerchandise
for resaleCost of goods
sold Gross margin Value added
Net incomeproduced at
market prices
Net incomeproduced at
factor cost
Merchant wholesalers 1 1.5........... 1.6 .5 .5 2.0 2.1 3.0 3.3
50 Durable goods stores 1 2.2................... 2.3 1.0 1.0 3.1 3.2 4.8 5.2
501 Motor vehicles and automotive parts andsupplies 7.4............................... 8.1 4.5 4.4 * * * *
502 Furniture and home furnishings 8.5........... 9.2 4.2 4.5 8.1 8.3 11.5 12.3503 Lumber and other construction materials 4.1... 3.0 .8 .9 3.0 3.2 4.2 4.4504 Professional and commercial equipment
and supplies 6.7........................... 5.4 2.2 2.3 5.1 5.4 7.4 7.7505 Metals and minerals, except petroleum1 3.8.... 4.0 1.2 1.6 6.3 6.3 7.6 7.8506 Electrical goods 4.2......................... 3.4 .9 1.1 3.3 3.3 4.9 5.0507 Hardware, and plumbing and heating
equipment and supplies 5.0................. 4.4 1.1 1.9 5.0 5.3 7.0 7.3508 Machinery, equipment, and supplies 4.6....... 5.9 1.2 1.5 3.8 3.9 5.0 5.4509 Miscellaneous durable goods 4.9............. 6.5 1.4 1.4 4.8 4.9 5.5 5.9
51 Nondurable goods 1 1.8...................... 1.5 .3 .3 1.7 1.8 2.2 2.4
511 Paper and paper products 6.5................ 5.8 1.0 1.1 3.7 3.7 4.7 4.9512 Drugs, drug proprietaries and druggists’
sundries 4.3.............................. 3.1 .6 .9 7.4 7.5 9.9 10.6513 Apparel, piece goods, and notions 7.1......... 4.0 1.4 1.9 4.7 5.6 7.5 7.7514 Groceries and related products 4.0........... 4.3 .6 .7 3.9 4.0 4.9 5.4515 Farm~product raw materials1 2.5.............. 3.0 .6 .7 6.3 6.5 9.0 9.9516 Chemicals and allied products 6.2............ 5.2 2.1 2.0 6.3 6.2 6.9 7.3517 Petroleum and petroleum products 6.7........ 2.7 .5 .7 7.1 7.2 8.3 9.4518 Beer, wine and distilled alcoholic
beverages 6.6............................. 9.0 2.0 2.3 7.4 7.5 8.7 9.4519 Miscellaneous nondurable goods 5.2.......... 3.8 .8 .9 3.4 3.3 3.7 4.1
Note: This table excludes estimated measures of sampling variability (coefficients of variation) for percentages shown in other tables. For an explanation of these measures see Limitations ofthe Data in appendix A.
1Sales data for SIC’s 5051 pt. and the 515 trade group are reported on a different basis than the 1992 Census of Wholesale Trade. For an explanation of these differences see Method ofEstimation in appendix A.
2–16 ASSETS AND EXPENDITURES WHOLESALE TRADEmSUBJECT SERIES

Appendix A.General Explanation
SAMPLE DESIGN
The 1992 Assets and Expenditures Survey sample forwholesale trade consists of the same sampling units usedto produce the monthly estimates of wholesale sales andinventories published in the Current Business Report SeriesBW, Monthly Wholesale Trade, for November and Decem-ber 1992 and January 1993. A subset of these samplingunits was also tabulated in the 1992 Annual Trade Survey.The sampling procedures for the monthly and annualwholesale trade surveys are described below.
The sample for the monthly survey consists of two fixedpanels of the larger businesses and three rotating panels ofsmaller businesses. One fixed panel consists of companiesand Employer Identification Numbers (EINs) selected withcertainty (i.e., with probability of selection = 1). The otherconsists of EINs selected originally in rotating panels thathave shown unusual growth since their selection. In themonthly survey, only one rotating panel plus the two fixedpanels are canvassed in any given month. In the annualtrade survey, the fixed panels and two of the three rotatingpanels are used.
The frame for the initial sample was constructed usinginformation from the Standard Statistical EstablishmentList (SSEL) as updated to December 31, 1989. The frameconsisted of two lists. One list was composed of companies(multiestablishment enterprises) as determined by the 1989Company Organization Survey. The other list was com-posed of all merchant wholesale EINs issued by theInternal Revenue Service (IRS) that (1) reported payroll inat least one quarter of 1989 and (2) were on thelatest available IRS mailing file of Federal Insurance Con-tributions Act (FICA) taxpayers. Each list contained infor-mation on sales, payroll, employment, name and address,kind-of-business classification, type-of-operation classifica-tion, etc.
Because the frame consisted of a list of companies anda list of EINs (some of which were associated with compa-nies on the first list) the sampling units consisted of bothcompanies and EINs. If a company had total merchantwholesale sales above a prescribed cutoff correspondingto its major kind of business, the company was selectedinto the sample with certainty. In this case, the company,which could consist of many EINs, was the sampling unit.Consequently, any new establishments that the companymight acquire, even if under new or different EINs, were inthe sample with certainty. All EINs associated with the
company were then removed from the second list to avoidduplication on the frame. After all certainty companies hadbeen selected, the unduplicated EIN frame was sampled.
All multiestablishment merchant wholesale companiesthatwerenot selectedwith certainty andall single-establishmentfirms were treated on an EIN basis; that is, the EIN was thesampling unit. The EINs were stratified according to theirmajor kind of business and their estimated sales. A sepa-rate determination of certainty EINs was performed usingthe same cutoffs as for companies. After certainty EINswere selected, the remaining EINs were subjected tosimple random sampling within strata. The sampling ratesfor these EINs varied between 1 in 3 to 1 in 809. Threesuch samples of EINs, called panels, were drawn.
For those EINs in the initial sample that were notclassified in a kind-of-business category and for all EIN‘‘births’’ after the frame creation, a two-phase selectionprocedure was used. EIN births, as used here, are newEINs recently assigned by the IRS that are also on thelatest available IRS mailing list for FICA taxpayers. Theymay be assigned a kind-of-business classification by theSocial Security Administration (SSA). In the first phase,births were stratified by kind of business (if available) andsize (expected employment or quarterly payroll). A rela-tively large sample was drawn and canvassed for morereliable and detailed information on the amount of sales intwo recent months and kind-of- business code.
Using this additional information, the cases selected inthe first phase were restratified and the final sample drawnwith probability-proportional-to-size sampling. The overallselection probabilities for the birth sampling are equivalentto those used in drawing the initial sample. Because of thelag in reporting births to the IRS and the SSA and the timeneeded to accomplish the two-phase birth-selection proce-dure carried out quarterly, births were actually tabulated inthe sample about 9 to 12 months after they began opera-tion.
METHOD OF ESTIMATION
Most data on wholesale sales presented in this reportare reproduced from the U.S. Summary report of the 1992Census of Wholesale Trade. All other data items arestatistical estimates which were developed from summa-tion of weighted information from the sampling units. Theweights used are the inverses of the probabilities ofselection of sampling units in the survey. Each weighted
APPENDIX A A-1WHOLESALE TRADE—SUBJECT SERIES

estimate was multiplied by a ratio of sales reported in the1992 Census of Wholesale Trade to sales reported in theannual trade survey except the farm product-raw materialsgroup.
In the 1992 Census of Wholesale Trade, establishmentsclassified in the farm product-raw materials group (SIC515) included as sales products purchased and transferredto other company establishments. In the monthly andannual surveys, intracompany transfers are not included insales. Because of these differences, sales for this SIC areobtained from the 1992 Annual Trade Survey with noadjustment applied.
For SIC 505, the monthly and annual trade surveysincluded merchant wholesalers as well as sales branchesof ferrous metals service centers with inventories. There-fore, their receipts are included in the 1992 census salesestimates used in this report.
Estimates at aggregate kind-of-business levels wereobtained by summing estimates computed at detail levels.
LIMITATIONS OF THE DATA
Because the estimates were based on a sample, exactagreement with the results that would be obtained from acomplete census of wholesale establishments using thesame enumeration procedures should not be expected.
However, because every merchant wholesale operationin the United States had a chance of being selected for thesample, and because the probability of selection for eachunit in the sample was known, it was possible to estimatethe sampling variability of the estimates made from thesample.
The sampling error, or standard error of the estimate, isa measure of variability among the estimates from allpossible samples of the same size and design and, thus, isa measure of the precision with which an estimate from aparticular sample approximates the results of a completeenumeration. The coefficient of variation is the standarderror of the estimate divided by the value being estimated.It is expressed here as a percent. Note that measures ofsampling variability, such as the standard error and thecoefficient of variation are estimates derived from thesample and are also subject to sampling variability.
The coefficients of variation permit certain confidencestatements about the sample estimates. The particularsample used in this survey was one of a large number ofsamples of the same size that could have been selectedusing the same design. In about 2 out of 3 of thesesamples, the estimate would differ from a complete enu-meration by less than the corresponding percentage forthat estimate shown in the sampling variability columns. Inabout 9 out of 10 samples, the estimates would differ fromthe results of a complete enumeration by less than 1.65times the percentages shown. To illustrate the computa-tions involved in the above confidence statements asrelated to dollar volume sales estimates, assume that anestimate of sales is $10,750 million and that the coefficientof variation for this estimate is 1.8 percent, or 0.018. First
obtain the standard error of the estimate by multiplying theestimate by the coefficient of variation. In this example,$10,750 million times 0.018 equals a standard error of$194 million. The 67 percent confidence interval for thisexample is $10,556 million to $10,944 million (i.e., $10,750million plus or minus $194 million). Bounds for a 90 percentconfidence interval are computed by adding or subtracting1.65 times the standard error from the estimate; conse-quently, the 90 percent confidence interval ranges from$10,430 million to $11,070 million. If corresponding 67percent confidence intervals were constructed for all pos-sible samples of the same size and design, approximately2 out of 3 (67 percent) intervals would contain the valueobtained from a complete enumeration. Similarly, for 90percent confidence intervals, 9 out of 10 of all possibleintervals would contain the value obtained in a completeenumeration.
Although coefficients of variation have not been calcu-lated for the percent estimates shown in this report, theywill be less than:
=CV2 ~VALUE IN DENOMINATOR! 1 CV2 ~VALUE IN NUMERATOR!
Coefficients of variation for all other published estimatesare presented in table 13.
RESPONSE AND OTHER NONSAMPLINGERRORS
The coefficients of variation shown in this report do notmeasure biases which might arise from nonsampling errorssuch as the failure of respondents to submit correct figureson time for tabulation. Nonsampling errors can be attrib-uted to many sources: inability to obtain information aboutall cases in the sample; response errors; definition difficul-ties; differences in the interpretation of questions; mistakesin recording or coding the data obtained; and other errorsof collection, response, coverage, and estimation for miss-ing data. These nonsampling errors also occur in completecensuses. Information is not available on the extent of biasthat may be due to reporting errors. To minimize nonsam-pling biases, all reports were reviewed for completenessand consistency.
Various ratios were calculated from the data of eachreport (e.g., employer contributions for plans required bylaw to total annual payroll). All extreme and unusual ratioswere verified or corrected where necessary. Some firms didnot report prior to the closeout of this survey. Data weretherefore imputed for these firms based on other availablerecords for like firms in the same kind of business. Impu-tation amounted to about 17.5 percent for capital expendi-tures, 20.4 percent for depreciable assets, and 22.7 per-cent for operating expenses.
COMPARABILITY OF THE 1987 AND 1992SURVEYS
The 1987 and 1992 surveys were conducted undersimilar conditions and procedures except for the following:
A-2 APPENDIX A WHOLESALE TRADE—SUBJECT SERIES

The 1987 publications for wholesale trade, retailtrade, and service industries all presented data limited toemployer business establishments. However, for 1992the retail and service reports include data on nonem-ployer establishments. It should be noted that in the1992 Census of Retail Trade, nonemployers accountedfor only 2.8 percent of total sales. In the 1992 Census ofService Industries, nonemployers accounted for only10.6 percent of total receipts.
It should also be noted that the 1987 publication usedkind-of-business definitions based on the Standard Indus-trial Classification Manual: 1972. This report uses kind-of-business definitions based on the Standard IndustrialClassification Manual: 1987. For a list of significantchanges in SIC codes from 1972 to 1987 see appendixC.
COMPARISONS WITH OTHER DATA
Data on sales presented in this report reflect thosepresented in other reports from the 1992 Census ofWholesale Trade. All other statistics shown are estimatesdeveloped from the sample of merchant wholesalersparticipating in the 1992 Annual Trade Survey. These itemsare comparable, in whole or in part, to statistics developedfrom other sources; notably the 1992 Census of WholesaleTrade, theAnnual Capital Expenditures Survey, the nationalincome and products accounts (NIPA) tables published inthe Survey of Current Business, and Statistics of Incomepublished by the Internal Revenue Service. Estimates fromthese varying sources may differ for reasons of samplingvariability and methodology. Broad descriptions of thedifferences in concept or methodology which should beobserved when comparing other data series to those fromthis report follow.
Annual Capital Expenditures Survey. This annual pub-lication of the Bureau of the Census provides detailedinformation on investment in structures and equipment bynonfarm businesses. The data are used to improve thequality of monthly and quarterly economic indicators ofinvestments and planned investments. These measurescontribute to improved quarterly estimates of the grossdomestic product from the Bureau of Economic Analysis(BEA). Differences in sampling methodology, independentprocessing and editing, variability in respondents complet-ing the forms, and timing of the data collection contribute tovariations in the estimates of capital expenditures.
Statistics of Income From the Internal Revenue Service(IRS). These annual publications and quarterly bulletins ofthe IRS provide information on business receipts, cost ofgoods sold, selected expense items, and depreciableassets compiled from the Federal income tax returns.However, the data are not in sufficient detail to provideincome-produced measures comparable with those pub-lished in this report. The cost of goods sold in Statistics ofIncome includes costs of materials used in manufacturing;
costs of goods purchased for resale; direct manufacturing;costs of goods purchased for resale; direct labor; andcertain overhead expenses, such as rent, utilities, supplies,maintenance, and repairs. Cost of goods sold in the assetsand expenditures survey excludes salaries and wages paidto the company’s employees, cost of packaging materials,and office and other supplies.
The Statistics of Income data for wholesale trade includeall types of wholesalers, whereas this report covers onlymerchant wholesalers. Morever, the company or subcom-pany level of reporting on income tax returns may not bethe same as used for reporting in the assets and expendi-tures survey. For example, manufacturing and other estab-lishments operated by firms which are primarily merchantwholesalers may be included in the IRS data. Merchantwholesale establishments operated by firms primarily engagedin other industries are not represented in the IRS statisticsfor wholesale trade.
National Income and Products Accounts From theBureau of Economic Analysis (BEA). As part of thenational income and product accounts, the BEA preparesestimates of value-added (also known as gross productoriginating or GPO) by industry. GPO can be definedequivalently either as industry gross output (sales pluschange in business inventories) less consumption of mate-rials and services purchased from other industries, or asthe sum of the industry’s factor payments (e.g., wages,interest, profits, etc.) and nonfactor costs (e.g., deprecia-tion). The latter definition is the basis for the current dollarestimates for industry GPO prepared by BEA that may becompared with the census estimates. These estimates arepublished annually in table 6.1 of the Survey of CurrentBusiness.
The BEA GPO measure for wholesale trade relatesconceptually to the value produced and operating expensesmeasures contained in this report in the following manner:GPO equals this report’s value-added less lease and rentalpayments, cost of communication, advertising and repairservices, other utilities, commissions to other firms, andsubsidies; plus sales and other taxes collected directlyfrom customers, and customs duties. GPO also equals thisreport’s net income produced at market prices plus cost ofuninsured casualty losses and bad debts losses lesssubsidies.
In addition, this report and the BEA GPO series differbecause the BEA factor payments and nonfactor costs thatare summed to estimate industry GPO are obtained from avariety of data sources, including the Bureau of LaborStatistics, the Internal Revenue Service, and the Bureau ofthe Census. The May 1993 Survey of Current Businessprovides a description of the sources and methods used forthe GPO estimates.
EXPLANATION OF TERMS
Sales. This item includes: merchandise sold for cash orcredit; receipts from customers for freight, installation,
APPENDIX A A-3WHOLESALE TRADE—SUBJECT SERIES

maintenance, repair, alteration, storage, and other ser-vices; excise taxes which are levied on the manufacturersand included in the cost of goods purchased by wholesal-ers; subsidy payments received for the sale of goods;gross value of sales made on a commission basis; andsales of goods which are shipped on a wholesaler’s ordersdirectly to customers. Sales are net after deductions fordiscounts and refunds and allowances for merchandisereturned by customers.
Sales exclude sales and excise taxes collected directlyfrom customers and paid directly to a local, State orFederal tax agency. Also excluded are receipts from cus-tomers for carrying or other credit charges, and nonoper-ating income from such sources as investments and rentalor sale of real estate. However, a portion of the datareported for capital expenditures, value of assets, depre-ciation and other operating expenses may pertain to realestate owned by the business and leased to others, eventhough corresponding data on sales exclude real estatelease receipts.
Most data on sales presented in this report are repro-duced from the U.S. Summary report of the 1992 Censusof Wholesale Trade. Preliminary estimates of all data itemsin this report other than sales were multiplied by a ratio ofsales compiled in the 1992 Census of Wholesale Trade tosales compiled in the 1992 Annual Trade Survey. SeeMethod of Estimation in appendix A for further explanation.
Purchases. Purchases represent the total cost, after deduc-tion of returns, allowances, and discounts, of merchandisewhich was acquired in 1992 for resale, whether or notpayment for the merchandise was made during the year.Purchases data include cash and credit purchases made atcentral offices and company warehouses, but excludedeliveries from central offices or warehouses, to the mer-chant wholesaler. Also included are: the cost of goods intransit where title has passed to the purchaser; amountsallowed for trade-ins; freight, delivery, and other transpor-tation costs; and import duties (if paid separately).
Companies engaged in both manufacturing and whole-sale operations were asked to report purchases at the costvalue of intercompany transfers from their plants or ware-houses to their wholesale locations. These companieswere also requested to report the cost of outside pur-chases.
Purchases exclude: expenditures for containers, wrap-ping, packaging, and other supplies or equipment intendedfor company use rather than for resale; the cost of rawmaterials or parts purchased for manufacture into a fin-ished product; and goods included in the purchase price ofa business. Also excluded are liquor and tobacco taxstamps, which would be included under operating expenses.
Data presented in this report on purchases were col-lected in the 1992 Annual Trade Survey.
Inventories. Inventories represent stocks of merchandiseowned by merchant wholesalers on December 31st andavailable for sale in the United States. A small amount of
inventories are reported at market value while most arereported on a cost basis. Goods held for consignment anditems not for sale such as fixtures, equipment and suppliesare not included. Inventories were reported as of the closeof the calendar year, except for some businesses whichused a fiscal year for accounting purposes and wereadjusted to a calendar year basis. All inventory datapresented in this report were collected in the 1992 AnnualTrade Survey.
Measures of Value Produced1. Cost of goods sold. This item was calculated for each
firm in the survey by adding all purchases of merchan-dise (net of returns, allowances, and discounts butincluding charges from freight, insurance, etc.) duringthe year to the beginning-of-year inventory, then deduct-ing the end-of-year inventory from the total. Firmswere instructed to exclude the cost of packaging,processing, shipping, and selling of goods from thecost of purchases but to report these items under‘‘operating expenses.’’
2. Gross margin. This item represents sales less cost ofgoods sold. Gross margin is equivalent to the cost ofall materials (as distinguished from goods to be resold)and services provided in merchant wholesale estab-lishments whether provided by the merchant wholesal-ing firm itself or purchased by it from others. To theextent that it includes cost of contract work done byothers on materials of the merchant wholesale firms,gross margin includes an element of value added bymanufacturing.
3. Value added. Value added is the gross margin (asdefined above) less the cost of supplies, materials, fueland other energy, and the cost of contract work onmaterials of the wholesaler.
4. Net income produced at market prices. This itemrepresents value added less lease and rental pay-ments; cost of communication, advertising, repair,legal, accounting, and computer related services; com-missions to other firms; and amounts set aside for baddebt losses and other losses not compensated byinsurance.
5. Net income produced at factor cost. This item repre-sents net income produced at market prices lessdepreciation, license fees, and taxes other than incometaxes. It includes payroll, employer contributions to theFICA, and unemployment insurance.
Operating expenses. The types of operating expensesrequested on the report form are:
1. Annual payroll. Payroll includes all salaries, wages,commissions, bonuses, and allowances for vacation,holiday, and sick leave paid to employees in 1992before payroll deductions. For corporations, it includesamounts paid to officers and executives; for unincor-porated businesses, it does not include payments to or
A-4 APPENDIX A WHOLESALE TRADE—SUBJECT SERIES
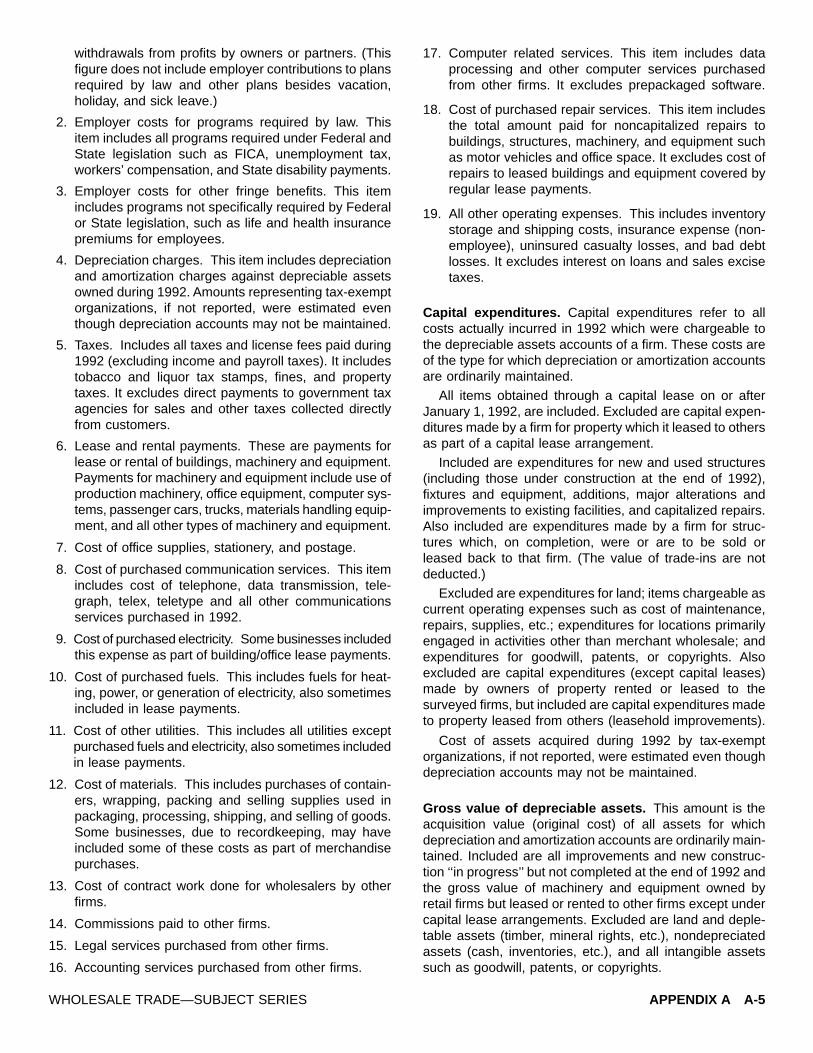
withdrawals from profits by owners or partners. (Thisfigure does not include employer contributions to plansrequired by law and other plans besides vacation,holiday, and sick leave.)
2. Employer costs for programs required by law. Thisitem includes all programs required under Federal andState legislation such as FICA, unemployment tax,workers’ compensation, and State disability payments.
3. Employer costs for other fringe benefits. This itemincludes programs not specifically required by Federalor State legislation, such as life and health insurancepremiums for employees.
4. Depreciation charges. This item includes depreciationand amortization charges against depreciable assetsowned during 1992. Amounts representing tax-exemptorganizations, if not reported, were estimated eventhough depreciation accounts may not be maintained.
5. Taxes. Includes all taxes and license fees paid during1992 (excluding income and payroll taxes). It includestobacco and liquor tax stamps, fines, and propertytaxes. It excludes direct payments to government taxagencies for sales and other taxes collected directlyfrom customers.
6. Lease and rental payments. These are payments forlease or rental of buildings, machinery and equipment.Payments for machinery and equipment include use ofproduction machinery, office equipment, computer sys-tems, passenger cars, trucks, materials handling equip-ment, and all other types of machinery and equipment.
7. Cost of office supplies, stationery, and postage.
8. Cost of purchased communication services. This itemincludes cost of telephone, data transmission, tele-graph, telex, teletype and all other communicationsservices purchased in 1992.
9. Cost of purchased electricity. Some businesses includedthis expense as part of building/office lease payments.
10. Cost of purchased fuels. This includes fuels for heat-ing, power, or generation of electricity, also sometimesincluded in lease payments.
11. Cost of other utilities. This includes all utilities exceptpurchased fuels and electricity, also sometimes includedin lease payments.
12. Cost of materials. This includes purchases of contain-ers, wrapping, packing and selling supplies used inpackaging, processing, shipping, and selling of goods.Some businesses, due to recordkeeping, may haveincluded some of these costs as part of merchandisepurchases.
13. Cost of contract work done for wholesalers by otherfirms.
14. Commissions paid to other firms.
15. Legal services purchased from other firms.
16. Accounting services purchased from other firms.
17. Computer related services. This item includes dataprocessing and other computer services purchasedfrom other firms. It excludes prepackaged software.
18. Cost of purchased repair services. This item includesthe total amount paid for noncapitalized repairs tobuildings, structures, machinery, and equipment suchas motor vehicles and office space. It excludes cost ofrepairs to leased buildings and equipment covered byregular lease payments.
19. All other operating expenses. This includes inventorystorage and shipping costs, insurance expense (non-employee), uninsured casualty losses, and bad debtlosses. It excludes interest on loans and sales excisetaxes.
Capital expenditures. Capital expenditures refer to allcosts actually incurred in 1992 which were chargeable tothe depreciable assets accounts of a firm. These costs areof the type for which depreciation or amortization accountsare ordinarily maintained.
All items obtained through a capital lease on or afterJanuary 1, 1992, are included. Excluded are capital expen-ditures made by a firm for property which it leased to othersas part of a capital lease arrangement.
Included are expenditures for new and used structures(including those under construction at the end of 1992),fixtures and equipment, additions, major alterations andimprovements to existing facilities, and capitalized repairs.Also included are expenditures made by a firm for struc-tures which, on completion, were or are to be sold orleased back to that firm. (The value of trade-ins are notdeducted.)
Excluded are expenditures for land; items chargeable ascurrent operating expenses such as cost of maintenance,repairs, supplies, etc.; expenditures for locations primarilyengaged in activities other than merchant wholesale; andexpenditures for goodwill, patents, or copyrights. Alsoexcluded are capital expenditures (except capital leases)made by owners of property rented or leased to thesurveyed firms, but included are capital expenditures madeto property leased from others (leasehold improvements).
Cost of assets acquired during 1992 by tax-exemptorganizations, if not reported, were estimated even thoughdepreciation accounts may not be maintained.
Gross value of depreciable assets. This amount is theacquisition value (original cost) of all assets for whichdepreciation and amortization accounts are ordinarily main-tained. Included are all improvements and new construc-tion ‘‘in progress’’ but not completed at the end of 1992 andthe gross value of machinery and equipment owned byretail firms but leased or rented to other firms except undercapital lease arrangements. Excluded are land and deple-table assets (timber, mineral rights, etc.), nondepreciatedassets (cash, inventories, etc.), and all intangible assetssuch as goodwill, patents, or copyrights.
APPENDIX A A-5WHOLESALE TRADE—SUBJECT SERIES

Cost of assets acquired by tax-exempt organizations, ifnot reported, were estimated even though depreciationaccounts may not be maintained.
Deductions from depreciable assets. This amount rep-resents the value of depreciable assets sold, retired,scrapped, or destroyed during 1992, and other adjust-ments (except depreciation).
Legal form of organization. The legal form of organiza-tion for firms in this survey was based on the response tothe organizational status inquiry on other economic censusor survey forms as well as administrative records of otherFederal agencies.
Auxiliary establishments. In consideration of recordkeep-ing practices and for consistency with the related salesdata collected for 1992 in the annual business surveys,each company in this survey was asked to include thoseauxiliary locations whose primary functions were to man-age, administer, service, or support the activities of themain establishments covered by the report. Data pre-sented in other reports from the 1992 Census of WholesaleTrade exclude such auxiliaries. Capital expenditures andother data for auxiliaries alone are released as part of the1992 Enterprise Statistics program.
KIND-OF-BUSINESS CLASSIFICATIONS
Wholesale trade, major groups 50 and 51 in the 1987SIC manual, includes establishments primarily engaged inselling merchandise to retailers; to industrial, commercial,institutional, farm, or professional business users; or toother wholesalers; or acting as agents or brokers in buyingmerchandise for or selling merchandise to such persons orcompanies.
The principal types of establishments included are:
1. Merchant wholesalers who take title to the goods theysell, such as wholesale merchants or jobbers, indus-trial distributors, voluntary group wholesalers, dropshippers, retailer cooperative warehouses, terminalelevators, and cooperative buying associations.
2. Manufacturers’ sales branches and offices (but notretail stores) maintained by manufacturing or miningenterprises apart from their plants or mines for thepurpose of marketing their products. Sales branchesand offices located at plants are included when sepa-rate records are available.
3. Agents, brokers, and commission merchants who buyor sell products owned by others on a commission oragency basis.
This survey is limited to merchant wholesalers (describedin category 1 above), which constitute the major portion ofwholesale trade. All kinds of business in which merchant
wholesalers operate are represented in this survey. Estab-lishments primarily engaged in the wholesale distribution ofused products are classified on the basis of the productsold. Establishments primarily engaged in selling merchan-dise to contractors are included in wholesale trade, with theexception of lumber yards and paint, glass, and wallpaperstores. These exceptions are classified in retail trade if theyconsider themselves retail, sell to the general public, andtheir sales to contractors and the general public is morethan half their total sales.
Establishments covered by the census were assignedkind-of-business classifications according to the industryclassifications defined in the 1987 SIC manual. When amore detailed classification than defined in the SIC manualwas needed, additional kinds-of-business were identifiedwithin an SIC industry.
Kind-of-business classifications are not interchangeablewith commodity classifications, because most businessessell several kinds of commodities. The kind-of-businesscode assigned generally reflects either the individual com-modity or the commodity group which is the primary sourceof the establishment’s receipts, or some mixture of com-modities which characterizes the establishment’s busi-ness. Thus, the classification of establishments by kind ofbusiness does not make it possible to determine either thenumber of establishments handling a particular commodityor the sales of that commodity. For example, the groceriesand related products classification excludes establishmentsselling food if the sale of food is not the primary source ofreceipts; moreover, even though establishments are clas-sified as groceries and related products, some of theirreceipts may be derived from the sale of nonfood products.Information on the extent to which commodities are handledby different kinds of business is available in the 1992Census of Wholesale Trade report, Commodity Line Sales(WC92-S-3). Descriptions of the 1992 Census of Whole-sale Trade kind-of-business classifications follow:
Durable Goods(SIC Major Group 50)
Thismajor group includes establishments primarily engagedin the wholesale distribution of durable goods.
Motor vehicles and motor vehicle parts andsupplies (SIC 501)
Automobiles and other motor vehicles (SIC 5012).Establishments primarily engaged in the wholesale distri-bution of new and used passenger automobiles, trucks,trailers, and other motor vehicles, including motorcycles,motor homes, and snowmobiles. Automobile distributorsprimarily engaged in selling at retail to individual customersfor personal use, and also selling a limited amount of newand used passenger automobiles and trucks at wholesale,are classified in Retail Trade, Industry 5511.
Motor vehicle supplies and new parts (SIC 5013).Establishments primarily engaged in the wholesale distri-bution of motor vehicle supplies, accessories, tools, andequipment; and new motor vehicle parts.
A-6 APPENDIX A WHOLESALE TRADE—SUBJECT SERIES

Tires and tubes (SIC 5014). Establishments primarilyengaged in the wholesale distribution of tires and tubes forpassenger and commercial vehicles.
Motor vehicle parts, used (SIC 5015). Establishmentsprimarily engaged in the wholesale distribution at whole-sale or retail of used motor vehicle parts. This industryincludes establishments primarily engaged in dismantlingmotor vehicles for the purpose of selling parts. Establish-ments primarily engaged in dismantling motor vehicles forscrap are classified in Industry 5093.
Furniture and homefurnishings (SIC 502)
Furniture (SIC 5021). Establishments primarily engaged inthe wholesale distribution of furniture, including bedsprings,mattresses, and other household furniture; office furniture;and furniture for public parks and buildings. Establishmentsprimarily engaged in the wholesale distribution of parti-tions, shelving, lockers, and store fixtures are classified inIndustry 5046.
Homefurnishings (SIC 5023). Establishments primarilyengaged in the wholesale distribution of homefurnishingsand housewares, including antiques; china; glassware andearthenware; lamps (including electric), curtains and drap-eries; linens and towels; and carpets, linoleum, and allother types of hard and soft surface floor coverings.Establishments primarily engaged in the wholesale distri-bution of other electrical household goods are classified inIndustry 5064, and those distributing precious metal flat-ware are classified in Industry 5094.
Lumber and other construction materials(SIC 503)
Lumber, plywood, millwork, and wooded panels (SIC5031). Establishments, with or without yards, primarilyengaged in the wholesale distribution of rough, dressed,and finished lumber (but not timber); plywood; reconsti-tuted wood fiber products; doors and windows and theirframes (all materials); wood fencing; and other wood ormetal millwork.
Brick, stone, and related construction materials (SIC5032). Establishments primarily engaged in the wholesaledistribution of stone, cement, lime, construction sand, andgravel; brick (except refractory); asphalt and concretemixtures; and concrete, stone, and structural clay products(other than refractories). Distributors of industrial sand andof refractory materials are classified in Industry 5085.Establishments primarily engaged in producing ready-mixedconcrete are classified in Manufacturing, Industry 3273.
Roofing, siding, and insulation materials (SIC 5033).Establishments primarily engaged in the wholesale distri-bution of roofing, siding (except wood), and insulationmaterials.
Construction materials, n.e.c. (SIC 5039). Establish-ments primarily engaged in the wholesale distribution ofmobile homes and of construction materials, not elsewhereclassified, including prefabricated buildings and glass. Estab-lishments selling construction materials to the generalpublic and known as retail in the trade are classified inRetail Trade, Industry 5211. Establishments primarily engagedin marketing heavy structural metal products are classifiedin Industry 5051.
Professional and commercial equipment andsupplies (SIC 504)
Photographic equipment and supplies (SIC 5043).Establishments primarily engaged in the wholesale distri-bution of photographic equipment and supplies. Establish-ments primarily engaged in the wholesale distribution ofphotocopy, microfilm, and similar equipment are classifiedin Industry 5044.
Office equipment (SIC 5044). Establishments primarilyengaged in the wholesale distribution of office machinesand related equipment, including photocopy and microfilmequipment, and safes and vaults. These establishmentsfrequently also sell office supplies. However, establish-ments primarily engaged in wholesaling most office sup-plies are classified in Industry Group 511. Establishmentsprimarily engaged in wholesaling office furniture are clas-sified in Industry 5021; and those wholesaling computersand peripheral equipment are classified in Industry 5045.
Computers and computer peripheral equipment andsoftware (SIC 5045). Establishments primarily engaged inthe wholesale distribution of computers, computer periph-eral equipment, and computer software. These establish-ments frequently may sell related supplies, but establish-ments primarily engaged inwholesaling supplies are classifiedaccording to the individual product (for example, computerpaper in Industry 5112). Establishments primarily engagedin the wholesale distribution of modems and other elec-tronic communications equipment are classified in Industry5065. Establishments primarily engaged in selling comput-ers and computer peripheral equipment and software forother than business or professional use are classified inRetail Trade, Industry 5734.
Commercial equipment, n.e.c. (SIC 5046). Establish-ments primarily engaged in the wholesale distribution ofcommercial and related machines and equipment, notelsewhere classified, such as commercial cooking andfood service equipment; partitions, shelving, lockers, andstore fixtures; electrical signs; and balances and scales,except laboratory.
Medical, dental, and hospital equipment and supplies(SIC 5047). Establishments primarily engaged in thewholesale distribution of surgical and other medical instru-ments, apparatus, and equipment; dentist equipment; arti-ficial limbs; operating room and hospital equipment; X-ray
APPENDIX A A-7WHOLESALE TRADE—SUBJECT SERIES

machines; and other electromedical equipment and appa-ratus used by physicians and in hospitals. Also included inthis industry are establishments primarily engaged in thewholesale distribution of professional supplies used bymedical and dental practitioners.
Ophthalmic goods (SIC 5048). Establishments primarilyengaged in the wholesale distribution of professional equip-ment and goods used, prescribed, or sold by ophthalmolo-gists, optometrists, and opticians, including ophthalmicframes, lenses, and sunglass lenses.
Professional equipment and supplies, n.e.c. (SIC 5049).Establishments primarily engaged in the wholesale distri-bution of professional equipment and supplies, not else-where classified, such as drafting instruments, laboratoryequipment, and scientific instruments.
Metals and minerals, except petroleum (SIC 505)
Metals service centers and offices (SIC 5051). Estab-lishments primarily engaged in marketing semifinishedmetal products, except precious metals. Establishments inthis industry may operate with warehouses (metals servicecenters) or without warehouses (metals sales offices).Establishments primarily engaged in marketing preciousmetals are classified in Industry 5094. Data shown in thereport include manufacturers’ sales branches for SIC 5051pt., Ferrous Metals Service Centers.
Coal and other minerals and ores (SIC 5052). Establish-ments primarily engaged in the wholesale distribution ofcoal and coke; copper, iron, lead, and other metallic ores,including precious metal ores; and crude nonmetalic min-erals (including concentrates), except crude petroleum.Establishments primarily engaged in the wholesale distri-bution of nonmetallic minerals used in construction, suchas sand and gravel, are classified in Industry 5032. Estab-lishments primarily engaged in the wholesale distribution ofcrude petroleum are classified in Industry Group 517.
Electrical goods (SIC 506)
This industry group includes establishments primarilyengaged in the wholesale distribution of electrical generat-ing, distributing, and wiring equipment. It also includeshousehold appliances, whether electrically, manually, ormechanically powered. This industry group does not includeelectrical commercial and industrial machines, in whichelectricity does the work directly, e.g., heating, turning ashaft, or ionizing a substance, or electrically poweredcommercial and industrial machines which are classified inIndustry Group 504 or 508.
Electrical apparatus and equipment, wiring supplies,and construction materials (SIC 5063). Establishmentsprimarily engaged in the wholesale distribution of electricalpower equipment for the generation, transmission, distri-bution, or control of electric energy; electrical construction
materials for outside power transmission lines and forelectrical systems and electric light fixtures and bulbs.Construction contractors primarily engaged in installingelectrical systems and equipment from their own stock areclassified in Construction, Industry 1731.
Electrical appliances, television and radio sets (SIC5064). Establishments primarily engaged in the wholesaledistribution of radio and television receiving sets, otherhousehold electronic sound or video equipment, self-containedair-conditioning room units, and household electrical appli-ances. Also included are establishments primarily engagedin the wholesale distribution of household gas and electriclaundry equipment and refrigerators and freezers.
Electronic parts and equipment, n.e.c. (SIC 5065). Estab-lishments primarily engaged in the wholesale distribution ofelectronic parts and electronic communications equipment,not elsewhere classified, such as telephone and telegraphequipment; radio and television broadcasting and commu-nications equipment; and intercommunications equipment.Establishments primarily engaged in the wholesale distri-bution of radio and television receiving sets, phonographs,CD-players, and other household sound or video equip-ment are classified in Industry 5064.
Hardware, and plumbing and heating equipmentand supplies (SIC 507)
Hardware (SIC 5072). Establishments primarily engagedin the wholesale distribution of cutlery and general hard-ware, including hand saws; saw blades; brads, staples,and tacks; and bolts, nuts, rivets, and screws. Establish-ments primarily engaged in the wholesale distribution ofnails, noninsulated wire, and screening are classified inIndustry 5051.
Plumbing and heating equipment and supplies (hydron-ics) (SIC 5074). Establishments primarily engaged in thewholesale distribution of hydronic plumbing and heatingequipment and supplies. Construction contractors primarilyengaged in installing plumbing and heating equipment fromtheir own stock are classified in Construction, Industry1711.
Warm air heating and air-conditioning equipment andsupplies (SIC 5075). Establishments primarily engaged inthe wholesale distribution of warm air heating and air-conditioning equipment and supplies. Construction contrac-tors primarily engaged in installing warm air heating andair-conditioning equipment are classified in Construction,Industry 1711.
Refrigeration equipment and supplies (SIC 5078).Establishments primarily engaged in the wholesale distri-bution of refrigeration equipment and supplies. Construc-tion contractors primarily engaged in installation of refrig-eration equipment from their own stock are classified inConstruction, Industry 1711.
A-8 APPENDIX A WHOLESALE TRADE—SUBJECT SERIES

Machinery, equipment, and supplies (SIC 508)
Construction and mining (except petroleum) machin-ery and equipment (SIC 5082). Establishments primarilyengaged in the wholesale distribution of construction ormining cranes, excavating machinery and equipment, powershovels, road construction and maintenance machinery,tractor-mounting equipment, and other specialized machin-ery and equipment used in the construction, mining, andlogging industries. Establishments engaged in marketingoil well machinery and equipment are classified in Industry5084.
Farm and garden machinery and equipment (SIC 5083).Establishments primarily engaged in the wholesale distri-bution of agricultural machinery and equipment for use inpreparation and maintenance of the soil, the planting andharvesting of crops, and other operations and processespertaining to work on the farm, lawn, or garden; and dairyand other livestock equipment.
Industrial machinery and equipment (SIC 5084). Estab-lishments primarily engaged in the wholesale distribution ofindustrial machinery and equipment, not elsewhere classi-fied.
Industrial supplies (SIC 5085). Establishments primarilyengaged in the wholesale distribution of industrial supplies,not elsewhere classified.
Service establishment equipment and supplies (SIC5087). Establishments primarily engaged in the wholesaledistribution of equipment and supplies for barber shops,beauty parlors, power laundries, dry-cleaning plants, uphol-sterers, undertakers, and related personal service estab-lishments.
Transportation equipment and supplies, except motorvehicles (SIC 5088). Establishments primarily engaged inthe wholesale distribution of transportation equipment andsupplies. Establishments primarily engaged in the whole-sale distribution of motor vehicles and motor vehicle partsare classified in Industry Group 501, and those distributingpleasure boats are classified in Industry 5091.
Miscellaneous durable goods (SIC 509)
Sporting and recreational goods and supplies (SIC5091). Establishments primarily engaged in the wholesaledistribution of sporting goods and accessories; billiard andpool supplies; sporting firearms and ammunition; andmarinepleasure craft, equipment and supplies. Establishmentsprimarily engaged in the wholesale distribution of motorvehicles and trailers are classified in Industry 5012; thosedistributing self-propelled golf carts are classified in Indus-try 5088; and those distributing athletic apparel and foot-wear are classified in Industry Group 513.
Toys and hobby goods and supplies (SIC 5092). Estab-lishments primarily engaged in the wholesale distribution ofgames, toys, hobby goods and supplies, and relatedgoods, such as fireworks and playing cards.
Scrap and waste materials (SIC 5093). Establishmentsprimarily engaged in assembling, breaking up, sorting, andwholesale distribution of scrap and waste materials. Thisindustry includes auto wreckers engaged in dismantlingautomobiles for scrap. However, those engaged in disman-tling automobiles for the purpose of selling secondhandparts at retail are classified in Industry 5015.
Jewelry, watches, precious stones, and precious met-als (SIC 5094). Establishments primarily engaged in thewholesale distribution of jewelry, precious stones andmetals, costume jewelry, watches, clocks, silverware, andjewelers’ findings. Establishments primarily engaged in thewholesale distribution of precious metal ores are classifiedin Industry 5052.
Durable goods, n.e.c. (SIC 5099). Establishments prima-rily engaged in the wholesale distribution of durable goods,not elsewhere classified, such as musical instruments andforest products, except lumber.
Nondurable Goods(SIC Major Group 51)
Thismajor group includes establishments primarily engagedin the wholesale distribution of nondurable goods.
Paper and paper products (SIC 511)
Printing and writing paper (SIC 5111). Establishmentsprimarily engaged in the wholesale distribution of printingand writing paper, including envelope paper; fine paper;and groundwood paper.
Stationery and office supplies (SIC 5112). Establish-ments primarily engaged in the wholesale distribution ofstationery and office supplies, including computer andphotocopy supplies, envelopes, typewriter paper, file cardsand folders, pens, pencils, social stationery, and greetingcards.
Industrial and personal service paper (SIC 5113).Establishments primarily engaged in the wholesale distri-bution of wrapping and other coarse paper, paperboard,and converted paper and related disposable plastic prod-ucts, such as bags, boxes, dishes, eating utensils, napkins,and shipping supplies.
Drugs, drug proprietaries, and druggists’sundries (SIC 512)
Drugs, drug proprietaries, and druggists’ sundries(SIC 5122). Establishments primarily engaged in thewholesale distribution of prescription drugs, proprietarydrugs, druggists’ sundries, and toiletries. Establishmentsprimarily engaged in the wholesale distribution of surgical,dental, and hospital equipment are classified in Industry5047.
APPENDIX A A-9WHOLESALE TRADE—SUBJECT SERIES
Apparel, piece goods, and notions (SIC 513)
Piece goods, notions, and other dry goods (SIC 5131).Establishments primarily engaged in the wholesale distri-bution of piece goods or yard goods of natural or man-made fibers, notions (sewing and hair accessories, etc.),and other dry goods. Converters who buy fabric goods(except knit goods) in the grey, have them finished oncontract, and sell at wholesale are included here. Convert-ers of knit goods are classified in Manufacturing, IndustryGroup 225. This industry does not include establishmentsprimarily engaged in the wholesale distribution of homefur-nishings which are classified in Industry 5023.
Men’s and boys’ clothing and furnishings (SIC 5136).Establishments primarily engaged in the wholesale distri-bution of men’s and boys’ apparel and furnishings, sports-wear, hosiery, underwear, nightwear, and work clothing.
Women’s, children’s, and infants’ clothing and acces-sories (SIC 5137). Establishments primarily engaged inthe wholesale distribution of women’s, children’s, andinfants’ clothing and accessories, including hosiery, linge-rie, millinery, and furs.
Footwear (SIC 5139). Establishments primarily engagedin the wholesale distribution of footwear (including athletic)made of leather, rubber, and other materials.
Groceries and related products (SIC 514)
Groceries, general-line (SIC 5141). Establishments pri-marily engaged in the wholesale distribution of a generalline of groceries. Establishments primarily engaged inroasting coffee, blending tea, or grinding and packagingspices are classified in Manufacturing Major Group 20.
Packaged frozen foods (SIC 5142). Establishments pri-marily engaged in the wholesale distribution of packagedquick-frozen vegetables, juices, meats, fish, poultry, past-ries, and other ‘‘deep freeze’’ products. Establishmentsprimarily engaged in the wholesale distribution of frozendairy products are classified in Industry 5143, and thosedistributing frozen poultry, fish, and meat which are notpackaged are classified in Industries 5144, 5146, and5147, respectively.
Dairy products, except dried or canned (SIC 5143).Establishments primarily engaged in the wholesale distri-bution of dairy products, such as butter, cheese, ice creamand ices, and fluid milk and cream. This industry does notinclude establishments primarily engaged in pasteurizingand bottling milk, which are classified in Manufacturing,Industry Group 202. Establishments primarily engaged inthe wholesale distribution of dried or canned dairy productsare classified in Industry 5149.
Poultry and poultry products (SIC 5144). Establish-ments primarily engaged in the wholesale distribution ofpoultry and poultry products, except canned and packaged
frozen products. This industry does not include establish-ments primarily engaged in the killing and dressing ofpoultry, which are classified in Manufacturing, Industry2015. Establishments primarily engaged in the wholesaledistribution of packaged frozen poultry are classified inIndustry 5142, and those distributing canned poultry areclassified in Industry 5149.
Confectionery (SIC 5145). Establishments primarilyengaged in the wholesale distribution of confectionery andrelated products, such as candy, chewing gum, fountainfruits, salted or roasted nuts, popcorn, fountain syrups, andpotato, corn, and similar chips.
Fish and seafoods (SIC 5146). Establishments primarilyengaged in the wholesale distribution (but not packaging)of fresh, cured, or frozen fish and seafoods, except cannedor packaged frozen. The preparation of fresh or frozenpackaged fish and other seafood, and the shucking andpacking of fresh oysters in nonsealed containers, areclassified in Manufacturing, Industry 2092. Establishmentsprimarily engaged in the wholesale distribution of cannedseafood are classified in Industry 5149, and those distrib-uting packaged frozen foods are classified in Industry5142.
Meats and meat products (SIC 5147). Establishmentsprimarily engaged in the wholesale distribution of fresh,cured, and processed (but not canned) meats and lard.Establishments primarily engaged in the wholesale distri-bution of frozen packaged meats are classified in Industry5142, and those distributing canned meats are classified inIndustry 5149.
Fresh fruits and vegetables (SIC 5148). Establishmentsprimarily engaged in the wholesale distribution of freshfruits and vegetables.
Groceries and related products, n.e.c. (SIC 5149). Estab-lishments primarily engaged in the wholesale distribution ofgroceries and related products, not elsewhere classified.Establishments primarily engaged in the wholesale distri-bution of soft drinks, and in bottling and distributing naturalspring and mineral waters, are classified in this industry,but establishments primarily engaged in bottling soft drinksare classified in Manufacturing, Major Group 20. Thisindustry does not include establishments primarily engagedin the wholesale distribution of farm-product raw materialsclassified in Industry Group 515, nor those distributingbeer, wine, and distilled alcoholic beverages of IndustryGroup 518.
Farm-product raw materials (SIC 515)
Grain and field beans (SIC 5153). Establishments prima-rily engaged in buying and/or marketing grain (such ascorn, wheat, oats, barley, and unpolished rice); dry beans;
A-10 APPENDIX A WHOLESALE TRADE—SUBJECT SERIES

soybeans, and other inedible beans. Country grain eleva-tors primarily engaged in buying or receiving grain fromfarmers are included, as well as terminal elevators andother merchants marketing grain. Establishments primarilyengaged in the wholesale distribution of field and gardenseeds are classified in Industry 5191.
Livestock (SIC 5154). Establishments primarily engagedin buying and/or marketing cattle, hogs, sheep, and goats.This industry also includes the operation of livestock auc-tion markets.
Farm-product raw materials, n.e.c. (SIC 5159). Estab-lishments primarily engaged in buying and/or marketingfarm products, not elsewhere classified. Establishmentsprimarily engaged in the wholesale distribution of milk areclassified in Industry 5143, and those distributing livepoultry are classified in Industry 5144.
Chemicals and allied products (SIC 516)
Plastics materials and basic forms and shapes (SIC5162). Establishments primarily engaged in the wholesaledistribution of plastics materials, and of unsupported plas-tics film, sheets, sheeting, rods, tubes, and other basicforms and shapes.
Chemicals and allied products, n.e.c. (SIC 5169). Estab-lishments primarily engaged in the wholesale distribution ofchemicals and allied products, not elsewhere classified,such as acids, industrial and heavy chemicals, dyestuffs,industrial salts, rosin, and turpentine. Establishments pri-marily engaged in the wholesale distribution of ammunitionare classified in Industry Group 509; those distributingagricultural chemicals and pesticides are classified in Indus-try 5191; those distributing drugs are classified in Industry5122; and those distributing pigments, paints, and var-nishes are classified in Industry 5198.
Petroleum and petroleum products (SIC 517)
This industry group includes establishments primarilyengaged in the wholesale distribution of crude petroleumand petroleum products. Included are establishments pri-marily engaged in the distribution of liquefied petroleumgas. Establishments primarily engaged in the transmissionand/or distribution of natural gas are classified in Utilities,Industry Group 492.
Petroleum bulk stations and terminals (SIC 5171).Establishments primarily engaged in the wholesale distri-bution of crude petroleum and petroleum products frombulk liquid storage facilities. These establishments have abulk liquid storage capacity of 10,000 gallons or more.
Petroleum and petroleum products wholesalers, exceptbulk stations and terminals (SIC 5172). Establishmentsprimarily engaged in the wholesale distribution of crudepetroleum and petroleum products. These establishmentsdo not have a bulk liquid storage capacity of 10,000 gallonsor more. Included are packaged and bottled petroleumproducts distributors, truck jobbers, and others marketingpetroleum and its products at wholesale.
Beer, wine, and distilled alcoholic beverages(SIC 518)
Beer and ale (SIC 5181) Establishments primarily engagedin the wholesale distribution of beer, ale, porter, and otherfermented malt beverages.
Wine and distilled alcoholic beverages (SIC 5182).Establishments primarily engaged in the wholesale distri-bution of distilled spirits, including neutral spirits and ethylalcohol used in blended wines and distilled liquors.
Miscellaneous nondurable goods (SIC 519)
Farm supplies (SIC 5191). Establishments primarilyengaged in the wholesale distribution of animal feeds,fertilizers, agricultural chemicals, pesticides, seeds, andother farm supplies, except grains. Establishments prima-rily engaged in the wholesale distribution of pet food areclassified in Industry 5149, and those distributing petsupplies are classified in Industry 5199.
Books, periodicals, and newspapers (SIC 5192). Estab-lishments primarily engaged in the wholesale distribution ofbooks, periodicals, and newspapers.
Flowers, nursery stock, and florists’ supplies (SIC5193). Establishments primarily engaged in the wholesaledistribution of flowers, nursery stock, and florists’ supplies.
Tobacco and tobacco products (SIC 5194). Establish-ments primarily engaged in the wholesale distribution oftobacco and its products. Leaf tobacco wholesalers areclassified in Industry 5159, and establishments primarilyengaged in stemming and redrying tobacco are classifiedin Manufacturing, Industry 2141.
Paints, varnishes, and supplies (SIC 5198). Establish-ments primarily engaged in the wholesale distribution ofpaints, varnishes, wallpaper, and supplies. Establishmentsselling to the general public and known as retail in the tradeare classified in Retail Trade, Industry 5231.
Nondurable goods, n.e.c. (SIC 5199). Establishmentsprimarily engaged in the wholesale distribution of nondu-rable goods, not elsewhere classified, such as art goods,industrial yarns, textile bags, and bagging and burlap.
APPENDIX A A-11WHOLESALE TRADE—SUBJECT SERIES

Appendix B.Sample Report Form
The sample report form is shown on the following pages.
APPENDIX B B–1WHOLESALE TRADE—SUBJECT SERIES

TIPS [UPF] BATCH_146 [ACEN,C_ARLEDGE] 10/25/94 12:24 PM MACHINE: EPCV22 DATA:VOL1_TIPS_APXB_01.TIPS;1 * 10/12/94 09:48:00 TAPE: NOreel FRAME: 3TSF:TIPS92-09482232.DAT;1 10/12/94 09:48:35 UTF:TIPS93-09482232.DAT;1 10/12/94 09:48:36 META:VOL1_TIPS96_APXB_01.DAT;6 10/12/94 09:49:15

Appendix C.Changes in Wholesale Trade Kind ~of ~BusinessClassifications for 1992
[Based on revisions to the Standard Industrial classification (SIC) Manual, definitions of some kinds of business were changed for 1987. The significant changes in SIC codes from 1972 to 1987 are listedbelow. For industries other than those listed, the SIC definitions are the same as those used since 1972, or contain only minor revisions affecting the classification of few, if any, establishments]
1987 SIC (used for 1992 census reports) 1972 SIC (used for 1972, 1977, and 1982 census reports and 1987 Assets and Expenditures report)
Code Title Code Title
5013 Motor vehicle supplies and new parts 5013 pt............................................ Automotive parts and supplies (except used)
5013 pt. Used automotive parts, equipment and supplies (wholesale) 5931 pt. Used automotive parts, equipment and supplies (retail)5015 Motor vehicle parts, used .....................................................
5023 Homefurnishings1 5023............................................................ Home furnishings1
5032 Brick, stone, and related construction materials ..................................5033 Roofing, siding, and insulation materials ........................................
5039 Construction materials, n.e.c................................................... 5039 Construction materials, n.e.c.
5044 Office equipment ............................................................5045 Computers and computer peripheral equipment and software......................5046 Commercial equipment, n.e.c. .................................................
5081 Commercial machines and equipment
5047 Medical, dental, and hospital equipment and supplies.............................5048 Ophthalmic goods ...........................................................
5049 Professional equipment and supplies, n.e.c. ..................................... 5086 Professional equipment and supplies
5063 Electrical apparatus and equipment, wiring supplies, and construction materials 5063 pt....... Electrical apparatus and equipment, wiring supplies, and construction materials2
5065 Electronic parts and equipment 5063 pt. Electrical apparatus and equipment, wiring supplies, and construction materials35065 Electronic parts and equipment, n.e.c. ..........................................
5082 Construction and mining (except petroleum) machinery and equipment1 5082............ Construction and mining machinery and equipment
5084 Industrial machinery and equipment 5063 pt. Electrical apparatus and equipment, wiring supplies and construction materials45084 Industrial machinery and equipment ............................................
5091 Sporting and recreational goods and supplies1 5041................................... Sporting and recreational goods and supplies
5092 Toys and hobby goods and supplies1 5042........................................... Toys and hobby goods and supplies
5094 Jewelry, watches, precious stones, and precious metals1 5094......................... Jewelry, watches, diamonds, and other precious stones1
5099 Durable goods, n.e.c. 5199 pt. Nondurable goods, n.e.c.55099 Durable goods, n.e.c. ........................................................
5112 Stationery and office supplies1 5112................................................. Stationery supplies1
5133 Piece goods (woven fabrics) 5134 Notions and other dry goods5131 Piece goods, notions, and other dry goods ......................................
5142 Packaged frozen foods1 5142...................................................... Frozen foods1
5143 Dairy products, except dried or canned1 5143........................................ Dairy products1
5153 Grain and field beans1 5153........................................................ Grain1
5152 Cotton 5159 Farm~product raw materials, n.e.c.5159 Farm~product raw materials, n.e.c. .............................................
5162 Plastics materials and basic forms and shapes ..................................
5169 Chemicals and allied products, n.e.c. ........................................... 5161 Chemicals and allied products
5192 Books, periodicals, and newspapers............................................5193 Flowers, nursery stock, and florists’ supplies ....................................
5199 Nondurable goods, n.e.c. ..................................................... 5199 Nondurable goods, n.e.c.6
1No change in content.2Excluding electrical communications equipment now in SIC 5065 and electrical measuring and testing equipment now in SIC 5084.3Electrical communications equipment part only, now in SIC 5065.4Electrical measuring and testing equipment part only, now in SIC 5084.5General merchandise, durable part only, now in SIC 5099.6All of SIC 5199 except durable goods general merchandise wholesalers. In 1972, all general merchandise wholesalers were in SIC 5199, for 1987 general merchandise wholesalers selling
primarily durable goods were moved to SIC 5099.
WHOLESALE TRADEmSUBJECT SERIES APPENDIX C C–1

1992 CENSUS OF WHOLESALE TRADE
Publications of the 1992 Census of Wholesale Trade, contain-ing data on wholesale trade establishments with payroll in theUnited States, are described below. Publication order forms forspecific reports may be obtained from any Department of Com-merce district office or from Customer Services, Bureau of theCensus, Washington, DC 20233-1900. The first results wereissued in press releases. Final detailed statistics are issued inseparate paperbound reports and compact disc-read only memory(CD-ROM).
Final Reports
Geographic area series—52 reports(WC92-A-1 to -52)
A separate paperbound report containing data for establish-ments with payroll is published for each State, the District ofColumbia, and the United States. Each report presents generalstatistics for establishments with payroll, on number of establish-ments, sales, payroll, employment, operating expenses, andinventories. At the State level, data also are presented separatelyfor the following types of wholesale operations: merchant whole-salers; manufacturers’ sales branches and offices; and agents,brokers, and commission merchants. Less type-of-operation detailis shown below the State level. For States, MA’s, and countiesand places with 200 wholesale establishments or more, statisticsare presented by kind of business. Greater kind-of-business detailis shown for larger areas. In addition, data are shown for allplaces with 2,500 inhabitants or more and all counties (with nokind-of-business detail). For each State, the District of Columbia,and the United States, 1992 data are provided on sales andemployees per establishment, sales and payroll per employee,payroll as a percent of operating expenses, and operating expensesand end-of-year inventories as percentages of sales. Compara-tive statistics showing percent changes in sales and payrollbetween 1987 and 1992 also are shown by kind of business.
Subject series—4 reports(WC92-S-1 to -4)
The Establishment and Firm Size report (WC92-S-1) presentsdata for establishments with payroll, based on size of establish-ment, size of company or firm, and legal form of organization.Establishment statistics are presented by sales size and byemployment size; statistics for firms by sales size (includingconcentration by largest firms), by employment size, and bynumber of establishments operated (single units and multiunits).Statistics are presented by kind of business on the number ofestablishments, sales, payroll, and employment for the UnitedStates.
TheMeasures of Value Produced, Capital Expenditures, Depre-ciable Assets, and Operating Expenses report (WC92-S-2) pre-sents data on measures of value produced, capital expenditures,
depreciable assets, and operating expenses for firms with payrollfor the United States by major kind of business. Measures ofvalue produced include gross margin, value added, and netincome produced at market prices and factor costs. Operatingexpenses include annual payroll, supplemental labor costs, pur-chased services, etc. Sales, purchases, and beginning andending inventories data also are provided.
The Commodity Line Sales report (WC92-S-3) presents dataon major categories of commodities sold by wholesale kind ofbusiness for the United States. Data for 15 selected MA’s and 15selected States will be available on electronic media only. Tablespresent data for each kind of business and show, for eachcommodity line, the number of establishments handling the lineand their sales of the line; the percentage of total sales of the kindof business accounted for by each of the lines carried; and, forestablishments actually handling a specific line, the percentage oftotal sales represented by sales of that line. Summary statisticsalso are provided for the broad commodity line categories,including counts of establishments and the amount and percent-age of the line sold by various kinds of wholesale businesses.
The Miscellaneous Subjects report (WC92-S-4) contains databy kind of business on employment by principal activity; sales byclass of customer; inventory valuation methods; commissions andgross selling value of business conducted for others by agentsand brokers; gross margins, gross profits, and their components;and on petroleum bulk stations and terminals. Data are presentedfor the United States as a whole; for petroleum bulk stations andterminals, States, and counties.
Electronic Media
All data included in the printed reports are available onCD-ROM. The CD-ROM’s provide the same information found inthe final reports as well as additional information not published inthe final reports, such as commodity line sales data for States(WC92-S-3). Electronic media products are available for userswho wish to summarize, rearrange, or process large amounts ofdata. These products, with corresponding technical documenta-tion, are sold by Customer Services, Bureau of the Census,Washington, DC 20233-1900.
OTHER ECONOMIC CENSUS REPORTS
Data on retail trade, service industries, transportation, commu-nications, utilities, financial, insurance, real estate, constructionindustries, manufactures, mineral industries, enterprise statistics,minority-owned business enterprises, and women-owned busi-nesses also are available from the 1992 Economic Census. Aseparate series of reports covers the census of outlying areas:Puerto Rico, Virgin Islands of the United States, Guam, and theNorthern Marianas. Separate announcements describing thesereports are available free of charge from Customer Services,Bureau of the Census, Washington, DC 20233-1900.
Publication Program