cen tage / iom a budgeting survey: benchmarks & · pdf filecentage/ioma budgeting survey:...
TRANSCRIPT

C e n t a g e / I O M a
Budgeting Survey:Benchmarks & Issues

C e n t a g e / I O M a B u d g e t I n g S u r v e y : B e n C h M a r k S & I S S u e S
�
Centage/IOMa Budgeting Survey:
Benchmarks & Issues
Pressure on finance executives and managers to align operations and strategy, deliver accurate and timely financial information, and monitor progress toward goals, has never been greater. the budget has become more than a financial tool to plan the year’s revenues and expenses, and optimize the allocation of resources. It is more than a yardstick to measure what actually happened against plan.
today’s budget is a strategic business planning tool. It helps manage cash flow and monitor progress toward key Performance Indicators (kPIs). your forecasts help determine your company’s strategic direction. yet budgeting processes at most companies have not evolved along with budgeting expectations.
Centage Corporation and IOMa (the Institute of Management & administration) conducted this Budgeting Survey in Spring 2007 to see what issues around budgeting, planning, forecasting and reporting are keeping CFOs up at night, and to help you benchmark your budgeting process, tools and attitudes against your peers. C-level finance executives at companies representing more than 20 industries answered questions on key budgeting issues including forecasting, variances, and how achieving goals affects compensation. Companies of all sizes took part, with annual revenue ranging from less than $�0 million to more than $500 million, encompassing the small to mid-sized business (SMB) market of $�0–99 million, and small to mid-sized enterprise (SMe) market of $�00–499 million.
We think you’ll find the results enlightening. you may be surprised at how many issues, concerns, processes and procedures are consistent across company sizes. Where differences based on company size were found, the results are telling as well.

C e n t a g e / I O M a B u d g e t I n g S u r v e y : B e n C h M a r k S & I S S u e S
2
Key Findings
the #� budgeting/forecasting pain point by far is dealing with other managers in the company, no matter how big or small the company.
the #2 pain point is working with spreadsheets or other technology-related issues.
despite the aggravations of budgeting in spreadsheets, Excel remains the de facto budgeting tool. the majority of companies regardless of size, and 75% of (SMB/SME) companies, budget with spreadsheets alone or in combination with a gL/erP system.
Most companies devote 4-8 weeks to their annual budgeting cycle.
the majority of companies set an acceptable tolerance level for variances from actual to budget (for revenue, expenses, eBIt and cash flow) of +/- 5–10%. Few go beyond �0% and if so, they were companies less than $�0 million.
the overall trend is to link compensation and goal-achievement. the trend is most prevalent at the largest companies (82%), and they tend to put a larger percentage of compensation into this at-risk category — 57% tie 20% of total compensation to meeting operational goals.
executives at about 85% of companies with annual revenue of $�0 million and above view their budgets as important cash flow management tools. For companies smaller than $�0 million, budgets fill this role at 93% of companies.
The confidence finance executives have in the accuracy of their budgets varies widely, with a significant percentage (50–60%) only somewhat confident in the accuracy of their budgets, or even not very confident or not at all confident.
The most common Key Performance Indicators (kPIs) are net Income/Loss, gross Profit %, Operating expenses as a % of Sales, and eBIt.

C e n t a g e / I O M a B u d g e t I n g S u r v e y : B e n C h M a r k S & I S S u e S
�
Pain Points
the “write-in” question on budgeting/forecasting pain points received a plethora of often impas-sioned replies. the #� pain point by far is dealing with other managers in the company, specifically:
• Not taking ownership or being accountable
• Lack of cooperation and/or participation
• Lack of understanding of the process or what’s required
• Not meeting deadlines
• Padding their budgets/providing unrealistic numbers.
the #2 pain point related to technology issues, mainly the frustration of budgeting in excel spreadsheets: the process is too manual, prone to errors, reports are hard to generate, time- consuming, hard to roll-up numbers, can’t drill down, and can’t create what-if scenarios.
after management issues and technology, a wide variety of pain points were raised, including the difficulty of accurately projecting revenues, inconsistencies in the data, lack of executive direction or support on the budget, and market-driven pain points such as the difficulty of forecasting raw materials costs six months in advance.
Budgeting Tools
despite the clear frustrations with spreadsheet-based budgeting, spreadsheets remain the de facto tool for budgeting. three out of four SMe companies are budgeting with spreadsheets alone or in combination with a gL/erP system. For the SMB market, 85% of companies build their budgets this way. Larger companies are somewhat more likely to have broken away from spread-sheets and use dedicated budgeting software.
Budget Planning Tools

C e n t a g e / I O M a B u d g e t I n g S u r v e y : B e n C h M a r k S & I S S u e S
4
Budgeting Basics
the vast majority of companies — about 97% — prepare annual budgets. the few that don’t gave reasons such as being too small, lacking the proper tools or knowledge, or not having the process in place yet.
Budget preparation: about 75% of companies use a combination of top-down and bottom-up methods to build their budgets. this trend is more pronounced for the larger companies surveyed.
Financial methodology: In general, about 60% of finance executives use a top-down methodology, working backwards from sales projections, and 40% use a bottom-up approach, building the budget line item by line item. In the smallest companies, nearly 80% use bottom-up budgeting.
PYA vs. zero-based: regardless of size, about 6�% of finance executives use Previous year’s actuals (Pya) as their budgeting methodology, 22% use zero-based accounting, 5% use a combination of the two, and the remainder use other methods.
Length of budgeting cycle: Most companies take 4–8 weeks for their annual budgeting process. Smaller companies that don’t take 4–8 weeks generally take less time than that. at $�00 million and above, those that don’t take 4–8 weeks generally take longer than 8 weeks.
Length of Annual Budgeting Cycle

C e n t a g e / I O M a B u d g e t I n g S u r v e y : B e n C h M a r k S & I S S u e S
5
Budgeting Confidence
the confidence finance executives have in the accuracy of their budgets varies widely. they are most confident in the area of expenses. a considerable percentage are only somewhat confident in the accuracy of their budgets, or even not very confident or not at all confident.
Budgeting Confidence for <$10m Budgeting Confidence for $10m–$99m
Budgeting Confidence for $100m–$499m Budgeting Confidence for $500+

C e n t a g e / I O M a B u d g e t I n g S u r v e y : B e n C h M a r k S & I S S u e S
6
Digging Deeper: The Value of the Budget
Link to corporate strategy: three-quarters of those surveyed link their operating budgets to their companies’ strategic plans. this trend becomes more prevalent the bigger the company. For the under-$�0 million companies, 66% tie the budget to corporate strategy. For the SMBs ($�0 million–$99 million), that jumps to 74%. at $�00 million and above, about 80% make the budget/strategy link.
Resolving discrepancies: When disconnects between financial goals and operational realities crop up during the budgeting process, these are resolved by senior management at about 90% of the companies surveyed. Individual managers are called upon to resolve the issues at less than �0% of those surveyed. the remaining responses indicated some degree of collaboration, e.g. between corporate and field management.
Budget uses: the reasons companies create budgets confirm the budget’s role as not only a financial planning tool but a business planning tool: comparing actual to budget P&L, aiding management decisions, comparing actual to budget Cash Flows, and — to a lesser extent — comparing actual to budget Balance Sheets.
Cash flow connection: the majority of respondents, regardless of company size, view their budgets as “Important” in managing cash flow. See Figure (a) Important vs. not Important.
the total that rated the budget “very or extremely Important” surpasses those that rated it “Somewhat Important” in all except the $�00 million–$499 million category. See Figure (b) Budget’s value in Managing Cash Flow.
(a) Important vs Not Important (b) Budget’s Value in Managing Cash Flow
C e n t a g e / I O M a B u d g e t I n g S u r v e y : B e n C h M a r k S & I S S u e S
7
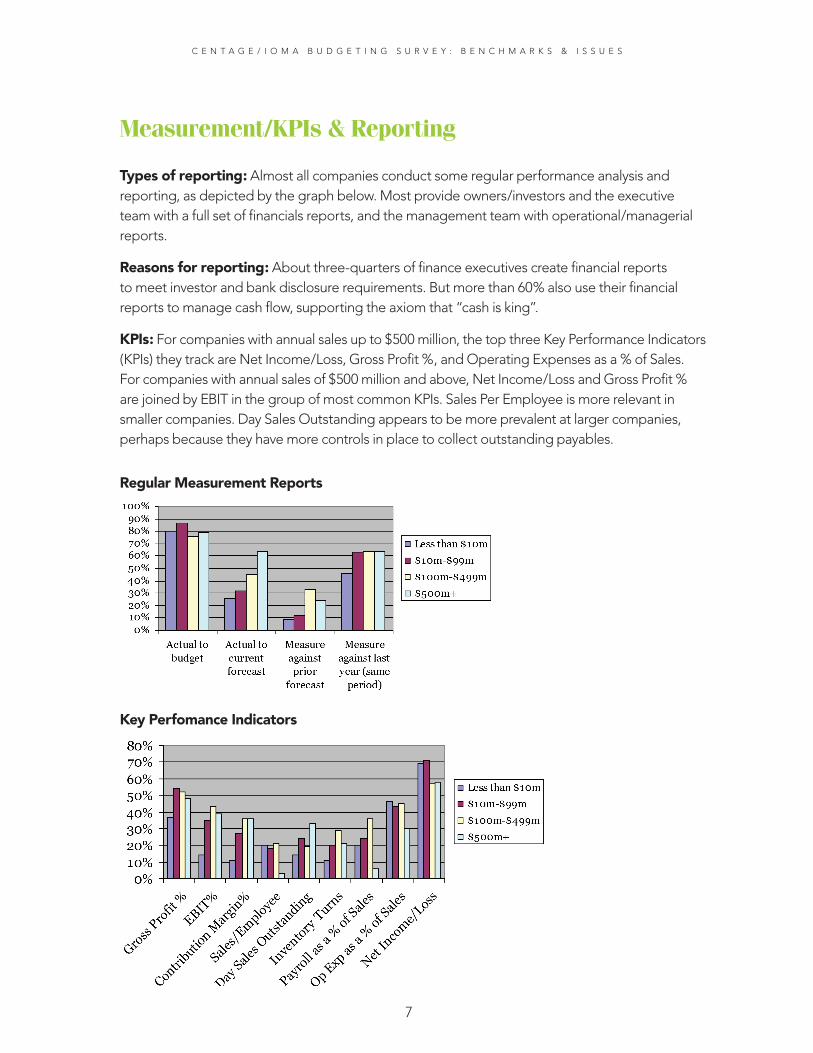
Measurement/KPIs & Reporting
Types of reporting: almost all companies conduct some regular performance analysis and reporting, as depicted by the graph below. Most provide owners/investors and the executive team with a full set of financials reports, and the management team with operational/managerial reports.
Reasons for reporting: about three-quarters of finance executives create financial reports to meet investor and bank disclosure requirements. But more than 60% also use their financial reports to manage cash flow, supporting the axiom that “cash is king”.
KPIs: For companies with annual sales up to $500 million, the top three key Performance Indicators (kPIs) they track are net Income/Loss, gross Profit %, and Operating expenses as a % of Sales. For companies with annual sales of $500 million and above, net Income/Loss and gross Profit % are joined by eBIt in the group of most common kPIs. Sales Per employee is more relevant in smaller companies. day Sales Outstanding appears to be more prevalent at larger companies, perhaps because they have more controls in place to collect outstanding payables.
Regular Measurement Reports
Key Perfomance Indicators

C e n t a g e / I O M a B u d g e t I n g S u r v e y : B e n C h M a r k S & I S S u e S
8
Variances
Frequency: about 80–90% of companies conduct actual-to-budget variance analysis monthly, and about 5–�5% quarterly.
Tolerance levels: Finance executives were asked to define what their companies consider to be acceptable tolerance percentages for revenue, expenses, eBIt and cash flow. the majority of companies allow variances of +/- 5% to �0%. very few go beyond �0%.
Consequences: the types of consequences for exceeding acceptable tolerances fall into three severity levels:
Light (44%): no consequence, budget adjustment made then or on the next forecast, or the manager is asked to justify the variance.
Moderate (29%): Managers must create detailed corrective action plans to bring their departments back within budget, the variance is addressed and noted in the manager’s performance review, or the manager falls under increased executive review.
Severe (28%): Compensation is affected or other sanctions applied, the manager receives a formal reprimand, or job losses result (the manager responsible for the variance, or the variance drives company layoffs due to missed numbers).
In 28% of the cases, there is no formal consequence for varying from the budget. the second most common consequence, however, is an impact on the manager’s compensation (�9%).
One comment conveyed this pragmatic and positive attitude toward variances:
“Our variance analysis is used as both a report card and a planning/management tool to help us understand our business and adjust accordingly.”
Acceptable Tolerance for Variances

C e n t a g e / I O M a B u d g e t I n g S u r v e y : B e n C h M a r k S & I S S u e S
9
Linking Compensation to Goal Achievement
the trend for all companies is clearly toward tying manager compensation to achievement of goals. the largest companies surveyed are the most likely to connect compensation and goal-achievement, and to put a larger percentage of compensation into this at-risk category.
Compensation Tied to Goals
Percentage of Compensation Tied to Goals

C e n t a g e / I O M a B u d g e t I n g S u r v e y : B e n C h M a r k S & I S S u e S
�0
Forecasting
Forecasting basis: Whether forecasting revenue, expenses or cash flow, most companies forecast on a 4-quarter basis, as the graph shows.
Frequency: generally, the larger the company, the more frequently they reforecast. Few companies of any size reforecast more often than monthly.
Rolling forecasts: about one-third of all respondents use rolling forecasts as a financial manage-ment tool. the larger the company, the more frequently they create rolling forecasts.
Reforecasting: the majority of companies, (74% to 86% depending on company size), engage in reforecasting to adjust to market fluctuations and changes, and 5–2�% report that they continue to operate under the same planned assumptions.
about half reforecast without much involvement from operating managers, while almost as many include managers in the process and re-run full-cycle forecasts.
Length of Forecast Period

C e n t a g e / I O M a B u d g e t I n g S u r v e y : B e n C h M a r k S & I S S u e S
��
AdviceWhen finance executives were asked what one piece of budgeting advice they would offer peers, their comments aligned with the main pain points identified, relating mainly to manager interactions and technology. Following is a summary of the advice.
Communication: Communicate openly, thoroughly and regularly with managers and executives across the organization. Communicate clearly the timetable, assumptions, responsibilities and expectations.
Training & Involvement: do groundwork education and development up front to achieve a common skill set and knowledge level among participants. keep department heads involved; their knowledge of their specific areas of influence is invaluable.
Accountability & Ownership: Make sure everyone understands that the budget is not a finance function. Budgeting is a joint effort and should be completed as a team. Leave no area of the P&L without a clear owner.
Technology: get the right tools. get a budgeting and forecasting system to make it easy to enter and pull information for decision-making. error-proof by limiting manual updates. have a system that interfaces with the g/L, so you spend time analyzing data instead of recreating it in a separate excel database. have a structured process with templates that roll up.
Timeline: you can never start too early in discussing strategic plans and building the budget. Invest the time to document your assumptions.
Be Realistic: Be realistic in what you are budgeting, and the goals. don’t budget for items that don’t have implementation timeframes attached to them. don’t ‘spin’ the numbers to forecast a better outlook than is likely to occur.

C e n t a g e / I O M a B u d g e t I n g S u r v e y : B e n C h M a r k S & I S S u e S
�2
Survey Methodology
the Centage/IOMa Budgeting Survey was conducted online over the course of six weeks in the spring of 2007. More than 200 C-level finance executives completed the survey, including CFOs, vPs of Finance, and Controllers. about 20 industries were represented, in particular manufacturing, services, healthcare, wholesale/distribution, finance, pharmaceutical, retail and technology. three-quarters of the respondents were from for-profit companies and one-quarter from not-for-profit organizations.
Small to mid-sized businesses and enterprises — the main audience served by Centage’s Budget Maestro® budgeting/forecasting solution — made up the bulk of the respondents. however, companies of all sizes took part, allowing for insights into how SMB/SMe companies stack up against larger and smaller companies.
Respondents by Annual Sales

C e n t a g e / I O M a B u d g e t I n g S u r v e y : B e n C h M a r k S & I S S u e S
��
About Centagewww.centage.com
Centage Corporation provides sophisticated yet easy-to-use Business Performance Management (BPM) software solutions that enable small and midsize companies to make better financial decisions by improving the efficiency and accuracy of their budgeting, forecasting, reporting and analysis.
Centage’s flagship solution, Budget Maestro® features built-in financial and business logic that frees companies from budgeting with spreadsheets, allowing users to produce accurate budgets and what-if scenarios without risking complex formula errors and bad workbook links. users can generate consolidated and integrated financial statements, income statements, balance sheets and cash flow reports, as well as unlimited analytical and managerial reports, all in real-time. thousands of licenses of Budget Maestro have been sold worldwide since �996. this scalable solution easily interfaces with many g/L and erP applications and implements in hours — usually with no It involvement and little training.
to learn more about Budget Maestro:
Download a Quick Product Tour: www.centage.com/demo/demo.asp
Take a FREE Test Drive: www.centage.com/demo/trial.asp
Attend a Webinar: www.centage.com/demo/webinar.asp
About IOMAwww.ioma.com
For over 20 years, IOMa has been an independent source of exclusive business management information for experienced senior and middle management professionals. IOMa products are created with two key goals in mind: to help you improve your on-the-job efficiency, and to enhance the financial performance of your organization.
research sponsored by:Centage Corporationwww.centage.com(toll Free) 800.�66.5���7��.�44.2440
© 2007 Centage CorporationCentage and Budget Maestro are registered trademarks of Centage