cemex, s.a.b. de c.v. - rns submit · cemex, s.a.b. de c.v. ... incurred under a then-existing...
TRANSCRIPT
UNITED STATES
SECURITIES AND EXCHANGE COMMISSION
Washington, D.C. 20549
FORM 6-K
REPORT OF FOREIGN PRIVATE ISSUER
PURSUANT TO RULE 13a-16 or 15d-16
UNDER THE SECURITIES EXCHANGE ACT OF 1934
For the month of November, 2017
Commission File Number: 001-14946
CEMEX, S.A.B. de C.V. (Translation of Registrant’s name into English)
Avenida Ricardo Margáin Zozaya #325, Colonia Valle del Campestre
San Pedro Garza García, Nuevo León 66265, México
(Address of principal executive office)
Indicate by check mark whether the registrant files or will file annual reports under cover Form 20-F or Form 40-F.
Form 20-F ☒ Form 40-F ☐
Indicate by check mark if the registrant is submitting the Form 6-K in paper as permitted by Regulation S-T Rule 101(b)(1): ☐
Indicate by check mark if the registrant is submitting the Form 6-K in paper as permitted by Regulation S-T Rule 101(b)(7): ☐

We anticipate disclosing to prospective investors certain information that has not been previously publicly reported. This report is
neither an offer to purchase nor a solicitation of an offer to sell any securities. We have elected to provide the information in this report
for informational purposes.
This report contains forward-looking statements within the meaning of the U.S. federal securities laws. We intend these forward-
looking statements to be covered by the safe harbor provisions for forward-looking statements in the U.S. federal securities laws. In
some cases, these statements can be identified by the use of forward-looking words such as “may,” “should,” “could,” “anticipate,”
“estimate,” “expect,” “plan,” “believe,” “predict,” “potential,” “intend” or other similar words. These forward-looking statements
reflect our current expectations and projections about future events based on our knowledge of present facts and circumstances and
assumptions about future events. These statements necessarily involve risks and uncertainties that could cause actual results to differ
materially from our expectations. Some of the risks, uncertainties and other important factors that could cause results to differ, or that
otherwise could have an impact on us or our subsidiaries, include:
• the cyclical activity of the construction sector;
• our exposure to other sectors that impact our business, such as, but not limited to, the energy sector;
• competition;
• general political, economic and business conditions in the markets in which we operate or that affect our operations and any
significant economic, political or social developments in those markets;
• the regulatory environment, including environmental, tax, antitrust and acquisition-related rules and regulations;
• our ability to satisfy our obligations under our material debt agreements, the indentures that govern our senior secured notes
and our other debt instruments;
• the impact of our below investment grade debt rating on our cost of capital;
• our ability to consummate asset sales, fully integrate newly acquired businesses, achieve cost-savings from our cost-
reduction initiatives and implement our global pricing initiatives for our products;
• the increasing reliance on information technology infrastructure for our invoicing, procurement, financial statements and
other processes that can adversely affect our sales and operations in the event that the infrastructure does not work as
intended, experiences technical difficulties or is subjected to cyber-attacks;
• weather conditions;
• trade barriers, including tariffs or import taxes and changes in existing trade policies or changes to, or withdrawals from, free
trade agreements, including the North American Free Trade Agreement (NAFTA), to which Mexico is a party and which is
currently undergoing renegotiation;
• terrorist and organized criminal activities as well as geopolitical events;
• natural disasters and other unforeseen events; and
• the other risks and uncertainties described under “Item 3—Key Information—Risk Factors” of CEMEX, S.A.B. de C.V.’s
annual report on Form 20-F for the year ended December 31, 2016 and under “Risk Factors” in this report.
Readers are urged to read this report and carefully consider the risks, uncertainties and other factors that affect our business. The
information contained in this report is subject to change without notice, and we are not obligated to publicly update or revise forward-
looking statements. Readers should review future reports filed by us with the U.S. Securities and Exchange Commission.

SIGNATURE
Pursuant to the requirements of the Securities Exchange Act of 1934, CEMEX, S.A.B. de C.V. has duly caused this report to be
signed on its behalf by the undersigned, thereunto duly authorized.
CEMEX, S.A.B. de C.V.
(Registrant)
Date: November 27, 2017 By: /s/ Rafael Garza Lozano
Name: Rafael Garza Lozano
Title: Chief Comptroller

EXHIBIT INDEX
EXHIBIT
NO. DESCRIPTION
1. Certain information with respect to CEMEX, S.A.B. de C.V. (NYSE: CX) and its direct and indirect subsidiaries.

Exhibit 1
The following summarizes certain information, including financial information, that we may disclose to prospective
investors. The disclosures set forth below update the information contained in CEMEX, S.A.B. de C.V.’s annual report on Form 20-F
for the year ended December 31, 2016 (the “2016 Annual Report”), filed with the U.S. Securities and Exchange Commission (the
“SEC”) on April 28, 2017 and any other documents that we have filed or furnished with the SEC and should be read in conjunction
therewith. Except as the context otherwise may require, references in this report to “CEMEX,” “we,” “us” or “our” refer to CEMEX,
S.A.B. de C.V. and its consolidated entities. See note 2 to our audited consolidated financial statements included in the 2016 Annual
Report for a description of our significant accounting policies including our principles of consolidation. References in this report to
“U.S.$” and “Dollars” are to U.S. Dollars, references to “€” are to Euros, references to “£” are to British Pounds and, unless otherwise
indicated, references to “Ps,” “Mexican Pesos” and “Pesos” are to Mexican Pesos. References in this report to “CPOs” are to CEMEX,
S.A.B. de C.V.’s Certificados de Participación Ordinarios, and references in this report to “ADSs” are to American Depositary Shares
of CEMEX, S.A.B. de C.V.
CAUTIONARY STATEMENT REGARDING FORWARD-LOOKING STATEMENTS
This report contains forward-looking statements within the meaning of the U.S. federal securities laws. We intend these
forward-looking statements to be covered by the safe harbor provisions for forward-looking statements in the U.S. federal securities
laws. In some cases, these statements can be identified by the use of forward-looking words such as “may,” “should,” “could,”
“anticipate,” “estimate,” “expect,” “plan,” “believe,” “predict,” “potential,” “intend” or other similar words. These forward-looking
statements reflect our current expectations and projections about future events based on our knowledge of present facts and
circumstances and assumptions about future events. These statements necessarily involve risks and uncertainties that could cause actual
results to differ materially from our expectations. Some of the risks, uncertainties and other important factors that could cause results to
differ, or that otherwise could have an impact on us or our subsidiaries, include:
• the cyclical activity of the construction sector;
• our exposure to other sectors that impact our business, such as, but not limited to, the energy sector;
• competition;
• general political, economic and business conditions in the markets in which we operate or that affect our operations and any
significant economic, political or social developments in those markets;
• the regulatory environment, including environmental, tax, antitrust and acquisition-related rules and regulations;
• our ability to satisfy our obligations under our material debt agreements, the indentures that govern our senior secured notes
and our other debt instruments;
• the impact of our below investment grade debt rating on our cost of capital;
• our ability to consummate asset sales, fully integrate newly acquired businesses, achieve cost-savings from our cost-
reduction initiatives and implement our global pricing initiatives for our products;
• the increasing reliance on information technology infrastructure for our invoicing, procurement, financial statements and
other processes that can adversely affect our sales and operations in the event that the infrastructure does not work as
intended, experiences technical difficulties or is subjected to cyber-attacks;
• weather conditions;
• trade barriers, including tariffs or import taxes and changes in existing trade policies or changes to, or withdrawals from, free
trade agreements, including the North American Free Trade Agreement (“NAFTA”), to which Mexico is a party and which
is currently undergoing renegotiation;
• terrorist and organized criminal activities as well as geopolitical events;
• natural disasters and other unforeseen events; and
• the other risks and uncertainties described under “Item 3—Key Information—Risk Factors” of the 2016 Annual Report and
under “Risk Factors” below.
Readers are urged to read this report and carefully consider the risks, uncertainties and other factors that affect our business.
The information contained in this report is subject to change without notice, and we are not obligated to publicly update or revise
forward-looking statements. Readers should review future reports filed by us with the SEC.

GEOGRAPHIC BREAKDOWN OF OUR NET SALES FOR THE NINE-MONTH PERIOD ENDED SEPTEMBER 30, 2017
The following chart indicates the geographic breakdown of our net sales, before eliminations resulting from consolidation,
for the nine-month period ended September 30, 2017:
2

BREAKDOWN OF OUR NET SALES BY PRODUCT FOR THE NINE-MONTH PERIOD ENDED SEPTEMBER 30, 2017
The following chart indicates the breakdown of our net sales by product, after eliminations resulting from consolidation, for
the nine-month period ended September 30, 2017:
RECENT DEVELOPMENTS
Recent Developments Relating to Our Business
Divestiture in the United States and Acquisitions in Rest of SAC
As a result of the divestiture of the cement plant located in Fairborn, Ohio and the acquisition of cement plants in Trinidad and Tobago,
Barbados and Jamaica, the number of cement plants in the United States has decreased from 12 as of December 31, 2016 to 11 as of
September 30, 2017 and the number of cement plants in Rest of South, Central America and the Caribbean (“Rest of SAC”) has
increased from five as of December 31, 2016 to eight as of September 30, 2017. There has been no material change to the aggregate
installed capacity of the cement plants from December 31, 2016 to September 30, 2017.
Recent Developments Relating to Our Indebtedness
Conversions under the March 2018 Optional Convertible Subordinated U.S. Dollar Notes
On June 19, 2017, certain institutional holders of CEMEX, S.A.B. de C.V.’s 3.75% Optional Convertible Subordinated U.S.
Dollar Notes due March 2018 (the “March 2018 Optional Convertible Subordinated U.S. Dollar Notes”) agreed to convert
approximately U.S.$325 million aggregate principal amount of those notes in exchange for 43 million ADSs. CEMEX did not pay any
cash to those noteholders in connection with the conversions. Following the conversions, approximately U.S.$365 million aggregate
principal amount of the March 2018 Optional Convertible Subordinated U.S. Dollar Notes remains outstanding.
3

2017 Credit Agreement
On July 19, 2017, CEMEX, S.A.B. de C.V. and certain of its subsidiaries entered into a facilities agreement (the “2017
Credit Agreement”) for approximately U.S.$4 billion (in aggregate), the proceeds of which were used to refinance indebtedness
incurred under a then-existing credit agreement and the balance, if drawn, shall be used for general corporate purposes. The
indebtedness incurred under the 2017 Credit Agreement ranks equally in right of payment with certain of our other existing and future
indebtedness, pursuant to the terms of the intercreditor agreement, dated September 17, 2012 among CEMEX, S.A.B. de C.V. and
certain of its subsidiaries named therein, Citibank Europe PLC, UK Branch (formerly Citibank International plc) as facility agent, the
financial institutions, noteholders and other entities named therein and Wilmington Trust (London) Limited, as security agent, as
amended by an amendment agreement, dated October 31, 2014, and as amended and restated by an amendment and restatement
agreement dated on or about July 23, 2015 and an amendment and restatement agreement dated July 19, 2017 (the “Intercreditor
Agreement”).
The April 2021 Euro Notes Redemption
On May 1, 2017, CEMEX Finance LLC (“CEMEX Finance”) issued an irrevocable notice of redemption with respect to its
5.250% Euro-Denominated Senior Secured Notes due 2021, pursuant to which it redeemed the remaining €400 million aggregate
principal amount of the April 2021 Euro Notes (the “April 2021 Euro Notes”) on May 31, 2017.
The October 2022 U.S. Dollar Notes Tender Offer and Redemption
On September 25, 2017, CEMEX, S.A.B. de C.V. completed the purchase of U.S.$700,618,000 aggregate principal amount
of the 9.375% Senior Secured Notes due 2022 (the “October 2022 U.S. Dollar Notes”) through a cash tender offer (the “September
2017 Tender Offer”). All such October 2022 U.S. Dollar Notes were immediately canceled. Following the settlement of the September
2017 Tender Offer, U.S.$343,478,468 aggregate principal of the October 2022 U.S. Dollar Notes remained outstanding and was
redeemed by CEMEX Finance on October 12, 2017.
The December 2019 U.S. Dollar Notes Redemption
On November 6, 2017, CEMEX, S.A.B. de C.V. issued an irrevocable notice of redemption with respect to its 6.5% Senior
Secured Notes due December 2019 (the “December 2019 U.S. Dollar Notes”), pursuant to which it will complete the redemption of the
remaining U.S.$610.7 million aggregate principal amount of such series of notes on December 10, 2017.
Recent Developments Relating to Our Regulatory Matters and Legal Proceedings
Antitrust Proceedings-Antitrust Case in Ohio
On October 2013, a nonstructural steel manufacturing joint venture in which CEMEX, Inc. has an indirect majority interest,
other nonstructural steel manufacturers, and related associations were named as defendants in a lawsuit filed in an Ohio State Court
alleging a conspiracy among the defendants to adopt sham industry standards with a goal to exclude the plaintiffs’ products from the
market. A resolution to finalize this matter has been reached with the plaintiffs, definitively finalizing the claim against CEMEX, Inc.
with no adverse resolution against CEMEX, Inc.
Antitrust Proceedings-Antitrust Case in Georgia
On July 24, 2017, two ready-mix concrete producers filed a lawsuit in a U.S. Federal Court in the state of Georgia against
certain subsidiaries of CEMEX in the U.S. and other companies alleging customer allocation and price fixing in both the ready-mix
concrete and cement markets the coastal Georgia and southeastern coastal South Carolina areas. As CEMEX does not participate in the
ready-mix concrete market in these areas, the lawsuit does not allege any improper actions by CEMEX with respect to ready-mix
concrete. On October 2, 2017, we filed a motion to dismiss the lawsuit. As of November 27, 2017, we are not able to assess the
likelihood of an adverse result to this lawsuit. If the lawsuit is resolved adversely to us, we do not expect such adverse resolution would
have a material adverse impact on our results of operations, liquidity and financial condition.
Antitrust Proceedings-Antitrust Investigation in Colombia
On September 5, 2013, CEMEX Colombia was notified of Resolution No. 49141 dated August 21, 2013, issued by the
Colombian Superintendency of Industry and Commerce (Superintendencia de Industria y Comercio) (“SIC”) pursuant to which the SIC
opened an investigation and issued a statement of objections (pliego de cargos) against five cement companies and fourteen directors of
those companies, including CEMEX Colombia S.A. (“CEMEX Colombia”), for alleged anti-competitive practices. On October 12,

2017, the SIC’s Superintendent Delegate for Competition Protection issued a non-binding report stating that two other industry
competitors engaged in illegal anticompetitive practices and recommending to impose sanctions against such companies. On November
10, 2017, CEMEX Colombia filed its final arguments against the report. If, notwithstanding these arguments, the SIC’s Chief
Superintendent decides to impose a sanction against CEMEX Colombia, we have several recourse filing options available, including a
reconsideration request before the SIC. If the reconsideration request does not succeed, we could challenge the validity of the SIC’s
decision before the Colombian Administrative Courts, which could take up to six years in order to obtain a final decision. At this stage
of the proceedings, it is likely that the Chief Superintendent will impose a penalty against CEMEX Colombia. However, as of
November 27, 2017, we do not expect such penalties to be for the maximum amounts permitted by law, and, because there are recourses
available that would take a considerable amount of time to be resolved, we also do not expect this matter to have a material adverse
impact on our results of operation, liquidity and financial condition.
Environmental Matters—Mexico
As of November 27, 2017, we do not currently participate in the wholesale electricity market in Mexico (the “Electricity
Market”). However, we have submitted sale offers at long-term clean power auctions for certain projects we are developing in Mexico,
as well as a purchase offer to acquire a small number of clean energy certificates for compliance starting in 2020. We are also preparing
to eventually participate in the Electricity Market.
During 2016, a new electrical standard code was issued in Mexico (Código de Red) (the “Code”). The Code establishes new
standards for electrical operation that will be enforced beginning in 2018 against consumers connected to the national grid. The
implementation of the Code may require investments across our operating assets in Mexico. We have initiated an assessment of any
possible required investments and, as of November 27, 2017, we expect that any specific investments will be identified by the end of
2017. As of November 27, 2017, we are not able to assess whether any investments will be required or whether any such requirements
would have a material adverse impact on our results of operation, liquidity and financial condition.
Tax Matters—Spain
On April 22, 2014, CEMEX España, S.A. (“CEMEX España”) filed appeals against fines imposed by tax authorities in Spain
arising from the tax audit process covering the tax years from and including 2006 to 2009, pursuant to which the tax authorities in Spain
have challenged part of the tax losses reported by CEMEX España for such years. On September 20, 2017, CEMEX España was
notified by the Tribunal Económico Administrativo Central about an adverse resolution to such appeals. CEMEX España filed a
recourse against such resolution on November 6, 2017 before the National Court (Audiencia Nacional) and applied for the suspension
of the payment of the fines. Should the suspension of the payment be granted by the National Court (Audiencia Nacional), CEMEX
España will not make any payment until the recourses are definitively resolved.
Other Legal Proceedings—South Louisiana Flood Protection Authority-East Claim
On July 24, 2013, a Petition for Damages and Injunctive Relief was filed by the South Louisiana Flood Protection Authority-
East in the Civil District Court for the Parish of Orleans, State of Louisiana, against approximately 100 defendants, including CEMEX,
Inc. On February 13, 2015, the Louisiana District Court dismissed the plaintiffs’ claims with prejudice. On February 27, 2015, the
plaintiffs appealed this ruling. This ruling has been affirmed by the United States Court of Appeals for the Fifth Circuit, finalizing the
process. As a result, there is no outstanding civil responsibility claim against CEMEX, Inc.
Other Legal Proceedings—Maceo, Colombia-Operational Matters
During the third quarter of 2017, at the request of CEMEX Colombia, the Dirección de Impuestos y Aduanas
Nacionales de Colombia granted the suspension of the expansion process of the free trade zone that CEMEX Colombia had previously
requested. Thus, the expansion process of the free trade zone will be stayed until July 31, 2018. As of November 27, 2017, CEMEX
Colombia believes that by July 31, 2018, the partial adjustment to the District of Integrated Management should be finalized, which
would allow CEMEX Colombia to proceed with the expansion process of the free trade zone.
Furthermore, CEMEX Colombia’s petition to decrease the size of the zoning area covered by the environmental
license related to the construction by CEMEX Colombia of a new integrated cement plant in the Antioquia department near the
municipality of Maceo, Colombia (the “Maceo Project”) in order to avoid any overlap with the District of Integrated Management was
filed on October 9, 2018 with the regional environmental agency with jurisdiction over this matter.
Other Legal Proceedings—Quarry Matter in France

Regarding CEMEX Granulats Rhône Méditerranée’s (“CEMEX Granulats”) appeal filed against the adverse judgment
related to SCI La Quinoniere’s (“SCI”) claim against CEMEX Granulats for breach of a contract executed by and between them in
1990, pursuant to which CEMEX Granulats has drilling rights to extract reserves and conduct quarry remediation at a quarry in the
Rhone region of France. CEMEX Granulats and SCI are currently exchanging submissions before the appeals court. The proceedings
are expected to be closed on December 4, 2017, and the oral hearing is scheduled to be held on February 7, 2018. The judgment of the
appeal court is expected in mid-2018. Additionally, SCI recently updated its claim for damages to an approximate aggregate amount of
€67 million (approximately U.S.$79.16 million as of September 30, 2017, based on an exchange rate of €0.8464 to U.S.$1.00).
OUR CORPORATE STRUCTURE AS OF SEPTEMBER 30, 2017
CEMEX, S.A.B. de C.V. is an operating and also a holding company, and in general CEMEX, S.A.B. de C.V. operates its
business through subsidiaries that, in turn, hold interests in CEMEX’s cement and ready-mix concrete operating companies, as well as
other businesses. The following chart summarizes CEMEX’s corporate structure as of September 30, 2017. The chart also shows, unless
otherwise indicated, for each company, CEMEX, S.A.B. de C.V.’s approximate direct or indirect percentage equity ownership or
economic interest. The chart has been simplified to show only some of CEMEX’s major holding companies and/or operating companies
in the main countries in which CEMEX operates, and/or relevant companies in which we hold a significant interest, and does not
include all of CEMEX’s intermediary holding companies and all CEMEX’s operating subsidiaries.
4

5

(1) Includes an approximately 99.88% interest pledged or transferred to a security trust as collateral for the benefit of certain secured
creditors of CEMEX.
(2) Includes an approximately 99.99% interest pledged or transferred to a security trust as collateral for the benefit of certain secured
creditors of CEMEX.
(3) CxNetworks N.V. is the holding company of the global business and IT consulting entities, including Neoris N.V.
(4) Includes a 100% interest pledged or transferred to a security trust as collateral for the benefit of certain secured creditors of
CEMEX.
(5) Includes Cemex Operaciones México, S.A. de C.V.’s (“COM”) 59.64% interest and Cemex Trademark Holdings Ltd.’s (“CTH”)
40.36% interest. CEMEX indirectly holds 100% of COM and CTH.
(6) Includes New Sunwards Holding B.V.’s (“NSH”) and CEMEX’s interest, and shares held in CEMEX España’s treasury.
(7) Includes an approximately 99.63% interest pledged or transferred to a security trust as collateral for the benefit of certain secured
creditors of CEMEX.
(8) Includes CEMEX España’s direct or indirect interest.
(9) Includes CEMEX France Gestion (S.A.S.)’s (“CEMEX France”) 94.75% interest and CEMEX UK’s 5.25% interest.
(10) Represents CEMEX España’s indirect economic interest in three companies incorporated in the United Arab Emirates, CEMEX
Topmix LLC, CEMEX Supermix LLC and CEMEX Falcon LLC. CEMEX España indirectly owns a 49% equity interest in each
of these companies, and CEMEX España indirectly holds the remaining 51% of the economic benefits through agreements with
other shareholders.
(11) Includes CEMEX España’s 69.39% interest and CEMEX France’s 30.61% interest. Since November 24, 2017, 100% of CEMEX
UK’s capital stock is held directly by CEMEX España.
(12) Divestment of CEMEX Hrvatska d.d. was expected to be completed during the first half of 2017, but the divestment will not be
made and CEMEX Hrvatska d.d. remains one of our subsidiaries.
(13) Represents CEMEX España’s indirect 37.84% and 11.76% interest in ordinary and preferred shares, respectively.
(14) CEMEX AS is an operating company and also the holding company for CEMEX’s operations in Finland, Norway and Sweden.
(15) Represents CEMEX Holdings Philippines, Inc.’s (“CHP”) direct and indirect equity interest.
(16) Represents outstanding shares of CEMEX Latam Holdings, S.A.’s (“CEMEX Latam”) capital stock and excludes treasury stock.
(17) Represents CEMEX Latam’s indirect interest.
(18) Represents CEMEX Latam’s 99.483% indirect interest in ordinary shares, and excludes: (i) a 0.516% interest held in Cemento
Bayano, S.A.’s treasury, and (ii) a 0.001% interest held by third parties.
(19) Represents CEMEX Latam’s direct and indirect interest in five companies incorporated in Guatemala, CEMEX Guatemala, S.A.,
Global Concrete, S.A., Gestión Integral de Proyectos, S.A., Equipos para uso de Guatemala, S.A., and Cementos de
Centroamérica, S.A.
(20) Represents CEMEX Latam’s 99.75% and 98.94% indirect interest in ordinary and preferred shares, respectively.
(21) Represents CEMEX Colombia S.A.’s indirect interest.
(22) Includes CEMEX (Costa Rica), S.A.’s 98% interest and CEMEX Colombia’s 2% indirect interest.
(23) Includes Trinidad Cement Limited’s direct and indirect 74.08% interest and CEMEX, S.A.B. de C.V.’s indirect 4.96% interest.
RISK FACTORS
We are subject to various risks mainly resulting from changing economic, environmental, political, industry, business,
financial and climate conditions. The following risk factors, as well as the risk factors described under “Item 3—Key
Information—Risk Factors” of the 2016 Annual Report, are not the only risks we face, and any of the risk factors described below and
in the 2016 Annual Report could significantly and adversely affect our business, results of operations or financial condition.
6

Economic conditions in some of the countries where we operate may adversely affect our business, financial condition and
results of operations.
The economic conditions in some of the countries where we operate have had and may continue to have a material adverse effect
on our business, financial condition and results of operations throughout our operations worldwide. Our results of operations are highly
dependent on the results of our operating subsidiaries mainly in the United States, Mexico, South, Central America and the Caribbean
(“SAC”), Europe, Asia, Middle East and Africa. Accordingly, the economic conditions in some of the countries where we operate have
had and may continue to have a material adverse effect on our business, financial condition and results of operations throughout our
operations worldwide.
The main sources of risks in the current global economy are: (i) an inward shift in political activities, including toward
protectionism, which may lead to lower global growth caused by reduced trade and cross-border investment flows, (ii) a faster-than-
expected normalization of monetary policy in the United States, which could trigger a more rapid tightening in global financial
conditions and a sharp Dollar appreciation, and its impact on the global economy, emerging markets, risk aversion, foreign exchange
markets, volatility and financial markets, (iii) economic vulnerability in emerging market economies, (iv) uncertainty about the
performance of oil prices, (v) China’s economic performance and the ability of the Chinese authorities to manage an economic
transition and vulnerabilities in China’s financial system associated with rapid credit growth, (vi) economic and political uncertainties in
Europe, including the outcome of the Brexit negotiations, vulnerability of the European Union’s (“EU”) banking system and stronger
appreciation of the Euro that may threaten the region’s integration and economic growth, (viii) persistently low inflation in advanced
economies, (viii) geopolitical risks in the Middle East, the Asia-Pacific (including current global tensions with respect to North Korea)
and other regions experiencing political turmoil and (ix) excessive world-wide appreciation in real estate and financial assets
The U.S. economy continues to grow at near trend pace. The U.S. Federal Reserve System increased short-term interest rates in
December 2015, December 2016, March 2017 and June 2017 with the expectation of an additional rate hike in December 2017. There is
a risk that further interest rate hikes could cause Dollar appreciation, a manufacturing slowdown and economic deceleration. On the
other hand, a slower than warranted pace of increase in interest rates could result in inflation acceleration and the de-anchoring of
inflation expectations, leading to swift monetary policy tightening and a potential recession. Housing sector supply constraints,
associated in part with labor shortages, could result in a slower pace of growth in housing starts while causing a significant appreciation
in housing prices.
Federal budget disputes could slow the release of FAST Act money for highways and roads. The global risks mentioned herein
could lead to market volatility and consumer spending retrenchment in the U.S. The results of the U.S. presidential election in 2016,
combined with significant polarization of the political spectrum, has increased uncertainty on certain key policies, such as trade
(potential protectionism and re-negotiation of NAFTA, immigration (anti-immigration rhetoric and a stated intention to build a wall on
the border with Mexico), fiscal (stated intentions to reduce tax rates and increase infrastructure expenditures) and healthcare policy. In
particular, there is uncertainty concerning the implications of potential U.S. tax reform for the fiscal deficit and national debt. All of
these uncertainties could have a significant impact on CEMEX’s business, both in the United States and worldwide.
Many emerging market economies have undergone periods of financial volatility over the past few years. Some large commodity
exporters and other stressed economies have also experienced substantial exchange rate movements. The tightening of financial
conditions across emerging market economies in the immediate aftermath of the U.S. elections in 2016 is a reminder that many such
countries remain vulnerable to sudden shifts in global market sentiment. There is a risk of new episodes of market volatility, increased
risk aversion and capital outflows from emerging markets, which could cause emerging markets currencies to further depreciate. The
high level of U.S. Dollar denominated corporate indebtedness in emerging markets could be an additional source of instability.
Emerging markets could face higher global risk premiums and substantial capital outflows, putting particular pressure on economies
with domestic debt imbalances. The risk of contagion effect across emerging markets could be significant.
Chinese authorities are expected to maintain emphasis on protecting macroeconomic stability. Progress with demand-side
rebalancing and reduction of excess industrial capacity has continued. However, the Chinese economy continues to rely on stimulus
measures to maintain high growth rates and rapidly expanding credit, intermediated through an increasingly opaque and complex
financial system. External triggers, such as a shift toward protectionism in advanced economies or domestic shocks, could lead to a
broader tightening of financial conditions in China. Such tightening could be exacerbated by capital outflow pressures, causing an
adverse impact on demand and output. The consequences for emerging market economies of weaker economic performance and
increased policy uncertainty in China could be significant. As demonstrated by market fluctuations in the second half of 2015 and early
2016, spillovers from turbulence in China into other economies can be significant, operating mainly through commodity prices and
global financial risk aversion.
7

At the beginning of 2017, the outlook for Mexico’s economy was uncertain. Concerns about the new U.S. administration and its
protectionist stances (e.g., potential overhaul or repeal of NAFTA) negatively impacted the Mexican Peso and confidence indicators
(consumer and business) early in the year. In addition, the central bank of Mexico continued with monetary tightening policies to
control inflation and to prevent abnormal volatility of the Mexican Peso. Meanwhile, the Mexican authorities reassured their
commitment to improve Mexico’s fiscal position and to continue fiscal discipline.
However, concerns about Mexico and its economic outlook moderated significantly in recent months. NAFTA renegotiations
began and pressures on the Mexican Peso moderated slightly. Additionally, Mexico’s economic activity showed resilience (driven in
part by the service sector and manufacturing revival) and inflationary prices have begun to recede. It is expected that the Mexican
economy will fulfill the fiscal targets for 2017.
The main short-term risks for the Mexican economy are: (i) abrupt cancelation of NAFTA’s renegotiation rounds, which could
cause significant devaluation of the Mexican Peso, as well as negatively affect Mexican manufacturing activity and new investment’s
decisions, (ii) new episodes of sharp foreign exchange volatility related to the upcoming Mexican election, (iii) further slowdown of
consumption in Mexico due to inflationary revival due to sharper depreciation of the Mexican Peso, (iv) further monetary tightening
and/or extended weakness of employment, (v) sharp adjustment of oil prices and the exacerbation of Mexican oil production decline,
(vi) an unexpected moderation of manufacturing and car sales in the U.S., which could impede Mexican manufacturing activity,
(vii) restrictions on remittances and immigration in the United States could hinder private consumption in Mexico, and (viii) new
episodes of global risk aversion due to geopolitical instability could spur capital outflows and affect the value of the Mexican Peso.
Economic improvement in Colombia has continued during 2017. However, the economy has not improved as quickly as expected,
mainly due to the weakness in consumer and business confidence. However, recent economic indicators show signs of improvement in
the second half 2017, suggesting a turning point in Colombia’s decelerating path.
Inflation in Colombia continues to wane rapidly (mainly in food prices) and is expected to converge with the central bank of
Colombia’s target rate. Nonetheless, there may be certain indexation pressures linked to wage increases and the temporary effect of tax
increases.
The risks to Colombia’s economy include: (i) downside risks related to relatively high gross external financing needs,
(ii) increased volatility and pressures on the Colombian Peso related to U.S. monetary normalization and upcoming elections in
Colombia, (iii) unexpected decreases of international oil prices, (iv) further deterioration of employment (mainly in urban areas), which
could undermine the recovery of domestic demand (e.g., private consumption and investment), (v) worsening consumer and business
confidence, which could undermine economic growth, and (vi) further delays in the execution of investment projects due to limited
financing sources and the escalation of political turbulence due the Odebrecht corruption scandal.
The European Central Bank (the “ECB”) has continued its monetary easing policy. The environment of negative deposit rates is
distorting financial markets and creates uncertain consequences for the banking sector. There is a risk that negative rates will erode
bank profitability and curb lending across the countries that currently use the Euro as their currency (the “Eurozone”), creating other
systemic risks to European economies. The economic activity in the Eurozone has been quite dynamic and inflation expectations appear
to be well-anchored. However, it is too early to confirm that a turning point has been reached in underlying inflation. The ECB is
expected to commence a tapering process but financial conditions should remain quite expansionary for the time been. There is a risk,
however, that the ECB concludes the policy of easing too early, leading to economic slowdown and retrenchment of investment. Also,
uncertainty about the Euro’s performance remains high, particularly as it has appreciated significantly this year. Euro appreciation could
take its toll on economic activity in the Eurozone, particularly on the industrial sector, affecting employment and the construction
activity.
The Eurozone’s economic growth and European integration are challenged by a number of uncertainties, including (i) delays in
implementing the needed structural reforms in some European countries, (ii) uncertainty regarding the profitability of the European
banking system, (iii) the process of the United Kingdom’s exit from the EU, (iv) the ongoing uncertainty as the political negotiations to
form a government in Germany, and (v) uncertainty as to the results of upcoming elections in the first quarter of 2018 in Italy and the
incoming government’s position with respect to the Euro. All these factors could impact market confidence and could limit the benefit
of the economic tailwinds and monetary policy stimulus. Regarding our operations in Europe, the United Kingdom’s expected exit from
the EU is already affecting financial markets and increasing foreign exchange volatility. The United Kingdom’s exit from the EU may
have a significant adverse impact on its economic activity. Such decision could result in substantial uncertainty weighing on investment
and import cost. This situation could impact our business. In Poland, there is a risk that the populist measures of the new government
could eventually restrain foreign investment and growth, which could negatively impact our operations in the region. In Spain, the
complex political situation in Catalonia could erode confidence and negatively impact economic activity.
8

Significant trade links with Western Europe render some Eastern European countries susceptible to economic and political
pressures from Western Europe. Additionally, in the coming years, Central European countries might experience a reduction in the
proceeds they receive from the EU’s Structural Funds, which could hinder infrastructure investment in such countries.
In the Middle East, political risk could moderate economic growth and adversely affect construction investments. In Egypt, the
current government has brought a certain degree of political stability to the country. During the last year, the Egyptian government has
undertaken several economic reforms to combat Egypt’s economic imbalances, including: (i) exchange rate liberalization (to address
shortages of foreign currencies and precariously low reserves), (ii) implementation of a value-added tax law (to increase fiscal
revenues), and (iii) cuts in fuel subsidies (leading to a reduction of the budget deficit). In return, the Egyptian government obtained a
loan from the International Monetary Fund. Although these reforms improved Egypt’s economic performance (reserves have
significantly increased and the budget deficit is expected to improve), they are now negatively affecting Egypt’s population. During
2016, the Egyptian Pound (“EGP”) reached EGP19.6 per U.S.$1.00 (a 120% depreciation since 2015) and inflation continued to
increase at 30%. Weakness in the Egyptian economy has negatively impacted our business. Due, in part, to a foreign exchange shortage
for capital repatriation, cement demand in Egypt decreased significantly in the first quarter of 2017. Political turbulence in connection
with the scheduled 2018 election could result in a resurgence of social unrest. Furthermore, potential conflicts between Israel and
Hamas in Gaza may adversely affect our operations in the region.
The Philippines have also experienced recent political changes. Although the new government has been particularly focused on
security issues, it is also expected to commit to significant infrastructure projects. However, there is a risk that underspending by the
government could adversely affect our business growth projections. Uncertainty regarding the Philippines government’s actions on
security and foreign policy could lead to a retrenchment of foreign investment and confidence in the country, which has been strong
until recently, and the delay of anticipated infrastructure projects.
Demand for our products is strongly related to construction levels and depends, in large part, on residential and commercial
construction activity, as well as private and public infrastructure spending, in the countries where we operate. Public and private
infrastructure spending in countries dependent on revenue generated by the energy sector is exposed to decreases in energy prices.
Therefore, decreases in energy prices could affect public and private infrastructure spending which, in turn, could affect the
construction industry. Declines in the construction industry are correlated with declines in general economic conditions. As a result,
deterioration in economic conditions in the countries where we operate could have a material adverse effect on our business, financial
condition and results of operations. In addition, we cannot assure you that growth in the gross domestic product of the countries where
we operate will translate into a correlated increase in demand for our products.
The 2017 Credit Agreement contains several restrictions and covenants. Our failure to comply with such restrictions and
covenants could have a material adverse effect on our business and financial conditions.
The 2017 Credit Agreement requires us to comply with several financial ratios and tests, including (i) a minimum consolidated
coverage ratio of EBITDA to interest expense (including interest accrued on Perpetual Debentures (as defined in the 2016 Annual
Report) and cash payments on preferred stock) and (ii) a maximum consolidated leverage ratio of total debt (including Perpetual
Debentures and guarantees, excluding convertible / exchangeable obligations, the principal amount of subordinated optional convertible
securities and capital leases and plus or minus the fair value of derivative financial instruments, among other adjustments) to EBITDA
(in each case, as described in the 2017 Credit Agreement). The calculation and formulation of EBITDA, interest expense, total debt, the
consolidated coverage ratio and the consolidated leverage ratio are set out in the 2017 Credit Agreement and may differ from the
calculation and/or formulation of analogous terms in this report. Our ability to comply with these ratios may be affected by economic
conditions and volatility in foreign exchange rates, as well as by overall conditions in the financial and capital markets and the
construction sector.
On July 19, 2017, CEMEX, S.A.B. de C.V., in line with CEMEX’s initiatives of enhancing financial flexibility and reducing risk,
entered into the 2017 Credit Agreement, in order to refinance its indebtedness under a then existing credit agreement and for general
corporate purposes.
The 2017 Credit Agreement requires us to comply with a minimum consolidated coverage ratio of EBITDA to interest expense
(including interest accrued on Perpetual Debentures and cash payments on preferred stock), for the following periods, measured
quarterly, of not less than (i) 2.50:1 for each 12-month period ending on December 31, 2017, March 31, 2018, June 30, 2018,
September 30, 2018, December 31, 2018, March 31, 2019, June 30, 2019, September 30, 2019, December 31, 2019 and March 31, 2020
and (ii) 2.75:1 for the 12-month period ending on June 30, 2020 and on each subsequent quarterly date. In addition, the 2017 Credit
Agreement requires us to comply with a maximum consolidated leverage ratio of total debt (including Perpetual Debentures and
guarantees, excluding convertible / exchangeable obligations, the principal amount of subordinated optional convertible securities and
capital leases and plus or minus the fair value of derivative financial instruments, among other adjustments) to EBITDA for the
9

following periods, measured quarterly, not to exceed (i) 5.25:1 for the 12-month period ending December 31, 2017 and the 12-month
period ending on March 31, 2018, (ii) 5.00:1 for the 12-month period ending June 30, 2018 and the 12-month period ending
September 30, 2018, (iii) 4.75:1 for the 12-month period ending December 31, 2018 and the 12-month period ending March 31, 2019,
(iv) 4.50:1 for each 12-month period ending June 30, 2019, September 30, 2019, December 31, 2019 and March 31, 2020 and (v) 4.25:1
for the 12-month period ending June 30, 2020 and on each subsequent quarterly date. For the period ended September 30, 2017, we
reported to the lenders under the 2017 Credit Agreement a consolidated coverage ratio of 3.31:1 and a consolidated leverage ratio of
3.98:1, each as calculated pursuant to the 2017 Credit Agreement. See “Liquidity and Capital Resources—Our Indebtedness” herein.
Pursuant to the 2017 Credit Agreement, we are limited in relation to making aggregate annual capital expenditures in excess of
U.S.$1 billion in any financial year (excluding certain capital expenditures, joint venture investments and acquisitions to be made by
each of CEMEX Latam and/or CHP and their respective subsidiaries and those funded by Relevant Proceeds (as defined in the 2017
Credit Agreement)), which capital expenditures, joint venture investments and acquisitions at any time then incurred are subject to a
separate aggregate limit of (a) U.S.$500 million (or its equivalent) for each of CEMEX Latam and its subsidiaries and (b) U.S.
$500 million (or its equivalent) for each of CHP and its subsidiaries. In addition, the amounts of which we and our subsidiaries allowed
for permitted acquisitions and investments in joint ventures cannot exceed certain thresholds as set out in the 2017 Credit Agreement.
We are also subject to a number of negative covenants under the 2017 Credit Agreement that, among other things, restrict or limit
(subject to certain exceptions) our ability and the ability of each obligor (as defined in the 2017 Credit Agreement) to: (i) create liens,
(ii) incur additional debt, (iii) change our business or the business of any obligor (as defined in the 2017 Credit Agreement) (taken as a
whole), (iv) enter into mergers, (v) enter into agreements that restrict our subsidiaries’ ability to pay dividends or repay intercompany
debt, (vi) acquire assets, (vii) enter into or invest in joint venture agreements, (viii) dispose of certain assets, (ix) be a creditor in respect
of any financial indebtedness, (x) grant additional guarantees or indemnities, (xi) declare or pay cash dividends or make share
redemptions and (xii) enter into certain derivatives transactions.
The 2017 Credit Agreement also contains a number of affirmative covenants that, among other things, require us to provide
periodic financial information to our creditors. Pursuant to the 2017 Credit Agreement, a number of covenants and restrictions will, if
CEMEX so elects, cease to apply (including the capital expenditure limitations mentioned above) or become less restrictive if (i) our
consolidated leverage ratio for the two most recently completed quarterly testing periods is less than 3.75:1 or, for the three most
recently completed quarterly testing periods, our consolidated leverage ratio for the first and third of those quarterly testing periods is
3.75:1 or less and in the second quarterly testing period would have been 3.75:1 or less but for the proceeds of certain permitted
financial indebtedness being included in the calculation of debt and (ii) no default under the 2017 Credit Agreement is continuing. At
that point, the existing consolidated coverage ratio and consolidated leverage ratio tests will be replaced by a requirement that the
consolidated leverage ratio must not exceed 4.25:1 and consolidated coverage ratio must not be less than 2.75:1. However, we cannot
assure you that we will be able to meet the conditions for these restrictions to cease to apply prior to the final maturity date under the
2017 Credit Agreement.
The 2017 Credit Agreement contains events of default, some of which may be outside of our control. Such events of default
include defaults, subject to certain exceptions, and grace periods, based on (i) non-payment, (ii) material inaccuracy of representations
and warranties, (iii) breach of covenants, (iv) bankruptcy (quiebra) or insolvency (concurso mercantil) of CEMEX, S.A.B. de C.V., any
other obligor under the 2017 Credit Agreement or any other of our material subsidiaries (as defined in the 2017 Credit Agreement),
(v) inability to pay debts as they fall due or by reason of actual financial difficulties, suspension or threatened suspension of payments
on debts exceeding U.S.$50 million or commencement of negotiations to reschedule debt exceeding U.S.$50 million, (vi) a cross-
default in relation to financial indebtedness in excess of U.S.$50 million, (vii) certain changes to the ownership of any of the obligors
under the 2017 Credit Agreement, (viii) enforcement of any security against an obligor or material subsidiary, (ix) any attachment,
distress or execution affects any asset of an obligor or material subsidiary, (x) restrictions not in effect on July 19, 2017 are imposed
that limit the ability of obligors to transfer foreign exchange for purposes of performing material obligations under the 2017 Credit
Agreement, (xi) any material adverse change arising in the financial condition of CEMEX, which creditors representing two thirds or
more of the total commitments under the 2017 Credit Agreement determine would result in our failure, taken as a whole, to perform
payment obligations under the 2017 Credit Agreement and (xii) it becomes unlawful for us to comply with its obligations under the
2017 Credit Agreement. If an event of default occurs and is continuing, upon the authorization of creditors representing two thirds or
more of the total commitments under the 2017 Credit Agreement, the agent has the ability to accelerate all outstanding amounts due
under the 2017 Credit Agreement. Acceleration is automatic in the case of insolvency.
We cannot assure you that we will be able to comply with the restrictive covenants and limitations contained in the 2017 Credit
Agreement. Our failure to comply with such covenants and limitations could result in an event of default, which could materially and
adversely affect our business, financial condition and results of operation.
10

We pledged the capital stock of some of our subsidiaries that represent substantially all of our business as collateral to secure
our payment obligations under the 2017 Credit Agreement, the indentures governing our Senior Secured Notes and other
financing arrangements.
In connection with the 2017 Credit Agreement, we pledged under pledge agreements or transferred to trustees under a security
trust, substantially all the shares of CEMEX México, S.A. de C.V. (“CEMEX México”), COM, CEMEX TRADEMARKS HOLDING
Ltd., NSH and CEMEX España, as collateral (together, the “Collateral”) and all proceeds of the Collateral, to secure our obligations
under the 2017 Credit Agreement, our Senior Secured Notes (as defined in Management’s Discussion and Analysis of Financial
Condition and Results of Operations—Summary of Material Contractual Obligations and Commercial Commitments—Senior Secured
Notes” herein) and under a number of other financing arrangements for the benefit of the creditors and holders of debt and other
obligations that benefit from provisions in their agreements or instruments requiring that their obligations be equally and ratably
secured. As of September 30, 2017, the Collateral and all proceeds of such Collateral secured (i) Ps173,814 million (U.S.$9,524
million) (principal amount Ps175,580 million (U.S.$9,621 million)) aggregate principal amount of debt under the 2017 Credit
Agreement, our Senior Secured Notes and other financing arrangements and (ii) Ps8,140 million (U.S.$446 million) aggregate principal
amount of Perpetual Debentures. These subsidiaries whose shares are part of the Collateral collectively own, directly or indirectly,
substantially all of our operations worldwide. Provided that no default has occurred which is continuing under the 2017 Credit
Agreement, the Collateral will be released automatically if we meet specified financial covenant targets in accordance with the terms of
the Intercreditor Agreement.
We have a substantial amount of debt and other financial obligations maturing in the next several years. If we are unable to
secure refinancing on favorable terms or at all, we may not be able to comply with our upcoming payment obligations. Our
ability to comply with our principal maturities and financial covenants may depend on us making asset sales, and there is no
assurance that we will be able to execute such sales on terms favorable to us or at all.
As of September 30, 2017, our total debt plus other financial obligations were Ps214,004 million (U.S.$11,726 million) (principal
amount Ps216,121 million (U.S.$11,842 million)), which does not include approximately Ps8,140 million (U.S.$446 million), which
represents the nominal amount of Perpetual Debentures. Of such total debt plus other financial obligations amount, Ps7,935 million
(U.S.$435 million) (principal amount Ps7,917 million (U.S.$434 million)) matures during 2017; Ps23,995 million (U.S.$1,315 million)
(principal amount Ps24,132 million (U.S.$1,322 million)) matures during 2018; Ps12,066 million (U.S.$661 million) (principal amount
Ps12,198 million (U.S.$668 million)) matures during 2019; Ps19,423 million (U.S.$1,064 million) (principal amount Ps19,687 million
(U.S.$1,079 million)) matures during 2020; and Ps150,585 million (U.S.$8,251 million) (principal amount Ps152,187 million
(U.S.$8,339 million)) matures after 2020.
If we are unable to comply with our upcoming principal maturities under our indebtedness, or refinance or extend maturities of our
indebtedness, our debt could be accelerated. Acceleration of our debt would have a material adverse effect on our business, financial
condition and results of operations. As a result of the restrictions under the 2017 Credit Agreement, the indentures that govern our
Senior Secured Notes and other debt instruments, the current global economic environment and uncertain market conditions, we may
not be able to complete asset sales on terms that we find economically attractive or at all. Volatility in the credit and capital markets
could significantly affect us due to its effect on the availability of funds to potential acquiring parties, including industry peers. In
addition, high levels of consolidation in our industry in some jurisdictions may further limit potential assets sales to interested parties
due to antitrust considerations. If we are unable to complete asset sales and our cash flow or capital resources prove inadequate, we
could face liquidity problems and may not be able to comply with financial covenants and payment obligations under our indebtedness.
In addition, our levels of debt, contractual restrictions, and our need to deleverage may limit our planning flexibility and our
ability to react to changes in our business and the industry, and may place us at a competitive disadvantage compared to competitors
who may have no need to deleverage, lower leverage ratios and fewer contractual restrictions. There can also be no assurance that,
because of our leverage ratio and contractual restrictions, we will be able to maintain our operating margins and deliver financial results
comparable to the results obtained in the past under similar economic conditions.
We may not be able to generate sufficient cash to service all of our indebtedness or satisfy our short-term liquidity needs, and
we may be forced to take other actions to satisfy our obligations under our indebtedness and our short-term liquidity needs,
which may not be successful.
Historically, we have addressed our liquidity needs, including funds required to make scheduled principal and interest payments,
refinance debt, and fund working capital and planned capital expenditures, with operating cash flow, borrowings under credit facilities
and receivables and inventory financing facilities, proceeds of debt and equity offerings and proceeds from asset sales.

As of September 30, 2017, we had U.S.$573 million funded under our securitization programs in Mexico, the United States,
France and the United Kingdom. We cannot assure you that, going forward, we will be able to, if needed, roll over or renew these
programs, which could adversely affect our liquidity.
11

The weakness of the global economic environment and its adverse effects on our operating results may negatively affect our credit
rating and the market value of CEMEX, S.A.B. de C.V.’s CPOs and ADSs. If current economic pressures continue or worsen, we may
be dependent on the issuance of equity as a source to repay our existing indebtedness. Although we have been able to raise debt, equity
and equity-linked capital in the recent past, previous conditions in the capital markets in 2008 and 2009 were such that traditional
sources of capital were not available to us on reasonable terms or at all. As a result, we cannot assure you that we will be able to
successfully raise additional debt or equity capital on terms that are favorable to us or at all.
We have sought and obtained waivers and amendments to several of our debt instruments relating to a number of financial ratios
in the past. Our ability to comply with these ratios may be affected by current global economic conditions and volatility in foreign
exchange rates and the financial and capital markets. We may need to seek waivers or amendments in the future. However, we cannot
assure you that any future waivers or amendments, if requested, will be obtained. If we are unable to comply with the provisions of our
debt instruments, and are unable to obtain a waiver or amendment, the indebtedness outstanding under such debt instruments could be
accelerated. Acceleration of these debt instruments would have a material adverse effect on our business and financial condition.
If the global economic environment deteriorates and our operating results worsen significantly, if we were unable to complete debt
or equity offerings or if our planned divestitures and/or our cash flow or capital resources prove inadequate, we could face liquidity
problems and may not be able to comply with our upcoming principal payments under our indebtedness or refinance our indebtedness.
We have to service our debt and other financial obligations denominated in Dollars with revenues generated in Mexican Pesos
or other currencies, as we do not generate sufficient revenue in Dollars from our operations to service all our debt and other
financial obligations denominated in Dollars. This could adversely affect our ability to service our obligations in the event of a
further devaluation or depreciation in the value of the Mexican Peso, or any of the other currencies of the countries in which
we operate, compared to the U.S. Dollar. In addition, our consolidated reported results and outstanding indebtedness are
significantly affected by fluctuations in exchange rates between the Mexican Peso and other currencies.
A substantial portion of our total debt plus other financial obligations is denominated in Dollars. As of September 30, 2017, our
debt plus other financial obligations denominated in Dollars represented approximately 69% of our total debt plus other financial
obligations, which does not include U.S.$371 million of Dollar-denominated Perpetual Debentures. Our Dollar-denominated debt must
be serviced with funds generated by CEMEX, S.A.B. de C.V.’s subsidiaries. Although we have substantial operations in the U.S., we
continue to rely on our non-U.S. assets to generate revenues to service our Dollar-denominated debt. Consequently, we have to use
revenues generated in Mexican Pesos, Euros or other currencies to service our Dollar-denominated obligations. See “Management’s
Discussion and Analysis of Financial Condition and Results of Operations—Quantitative and Qualitative Market Disclosure—Interest
Rate Risk, Foreign Currency Risk and Equity Risk—Foreign Currency Risk.” A devaluation or depreciation in the value of the Mexican
Peso, Euro, British Pound, Colombian Peso or any of the other currencies of the countries in which we operate, compared to the
U.S. Dollar, could adversely affect our ability to service our Dollar-denominated debt. As of September 2017, our operations in Mexico,
the United Kingdom, Germany, France, Spain, the Rest of Europe, Colombia, Egypt, the Philippines, the Rest of Asia, Middle East and
Africa, which are our main non-Dollar-denominated operations, together generated approximately 59% of our total net sales in Mexican
Peso terms (approximately 21%, 7%, 4%, 6%, 3%, 5%, 4%, 1%, 3%, and 5%, respectively) before eliminations resulting from
consolidation. In the nine-month period ended September 30, 2017, approximately 22% of our net sales in Mexican Peso terms were
generated in the United States. During the nine-month period ended September 30, 2017, the Mexican Peso appreciated approximately
6% against the U.S. Dollar, the Euro appreciated approximately 6% against the U.S. Dollar and the British Pound appreciated
approximately 5% against the U.S. Dollar. Currency hedges that we may be a party to or may enter in the future may not be effective in
covering all our currency-related risks. Our consolidated reported results for any period and our outstanding indebtedness as of any date
are significantly affected by fluctuations in exchange rates between the Mexican Peso and other currencies, as those fluctuations
influence the amount of our indebtedness when translated into Mexican Pesos and also result in foreign exchange gains and losses as
well as gains and losses on derivative contracts, including those entered into to hedge our exchange rate exposure. The 2017 Credit
Agreement and other debt instruments significantly restrict our ability to enter into certain types of derivative transactions.
In addition, as of September 30, 2017, our Euro-denominated total debt plus other financial obligations represented approximately
22% of our total debt plus other financial obligations, which does not include the €64 million aggregate principal amount of Euro-
denominated Perpetual Debentures.
High energy and fuel costs may have a material adverse effect on our operating results.
Energy and fuel costs represent an important part of our overall cost structure. Energy and fuel prices and availability are generally
subject to market volatility and, therefore, may have an adverse impact on our costs and operating results. In addition, governments in
several of the countries where we operate are working to reduce energy subsidies or impose new excise taxes, which could further
increase energy costs.

12

Furthermore, if our efforts to increase our use of alternative fuels are unsuccessful, due to their limited availability, price volatility
or otherwise, we would be required to use traditional fuels, which may increase our energy and fuel costs and could have a material
adverse effect on our business, financial condition and results of operations.
We are an international company and are exposed to risks in the countries in which we have operations or interests.
We are dependent, in large part, on the economies of the countries in which we market our products. The economies of these
countries are in different stages of socioeconomic and political development. Consequently, like many other companies with significant
international operations, we are exposed to risks from changes in foreign currency exchange rates, interest rates, inflation, governmental
spending, social instability and other political, economic or social developments that may materially affect our business, financial
condition and results of operations.
As of September 30, 2017, we had operations in Mexico, the United States, the United Kingdom, France, Germany, Spain, the
Rest of Europe, Colombia, the Rest of SAC, the Philippines, Egypt, and the Rest of Asia, Middle East and Africa (as described in “Item
4—Information on the Company—Business Overview” of our 2016 Annual Report).
For a geographic breakdown of our net sales for the nine-month period ended September 30, 2017, see “Geographic Breakdown of
Our Net Sales for the Nine-Month Period Ended September 30, 2017” elsewhere in this report.
In recent years, concerns over global economic conditions, energy costs, geopolitical issues, political uncertainty, the availability
and cost of credit and the international financial markets have contributed to economic uncertainty and reduced expectations for the
global economy.
Our operations in Egypt, the United Arab Emirates (“UAE”) and Israel have experienced instability as a result of, among other
things, civil unrest, extremism and the deterioration of general diplomatic relations. We cannot assure that political turbulence in Egypt,
Syria, Libya, Yemen and other countries in Africa, the Middle East and Asia will abate in the near future or that neighboring countries
will not be drawn into conflict or experience instability. In addition, our operations in Egypt are subject to political risks, such as
confiscation, expropriation and/or nationalization. See “Item 4—Information on the Company—Regulatory Matters and Legal
Proceedings—Other Legal Proceedings—Egypt Share Purchase Agreement” in our 2016 Annual Report.
Beginning in January 2011, protests demanding a change in the regime took place across Egypt, resulting in the resignation of
former President Hosni Mubarak on February 11, 2011. Subsequently, Mr. Mubarak transferred government powers to the Egyptian
Army. The Supreme Council of the Armed Forces of Egypt dissolved the Egyptian parliament, suspended the nation’s constitution and
formed a committee to recommend constitutional changes to facilitate a political transition through democratic elections. Following
some delays, elections for a new parliament took place between November 2011 and January 2012. Elections held in May and June of
2012 witnessed the victory of Mohamed Morsi as the fifth president of Egypt. Despite a return to civilian rule, protests continued to
take place across Egypt following Mr. Morsi’s election, culminating in large-scale anti-Morsi protests in June 2013. On July 3, 2013,
the Egyptian military, led by General Abdel Fattah el-Sisi removed Mr. Morsi from office and suspended the Egyptian constitution. The
Egyptian military then appointed Chief Justice Adly Mansour as the interim president of Egypt, and charged him with forming a
transitional technocratic government. In May 2014, presidential elections took place, having elected General Abdel Fattah el-Sisi. In
November and December 2015, parliamentary elections to the House of Representatives took place. New presidential elections are
expected to be held in the first half of 2018. President Abdel Fattah el-Sisi is widely expected to be re-elected, although the legitimacy
of the vote may be marred by low voter turnout. Although CEMEX’s operations in Egypt have been affected by the turbulence in
Egypt, CEMEX continues with its cement production, dispatch and sales activities as of the date of this report. Risks to CEMEX’s
operations in Egypt include a potential reduction in overall economic activity, exchange rate volatility, increased cost of energy, cement
oversupply and threat of terrorist attacks which could have a material adverse effect on our operations in the country.
Our operations are also exposed to the Israeli-Palestinian conflict. Confrontations has increased violence in the region. Progress on
peace is highly unlikely, as neither side has shown intentions for making concessions. If the conflicts escalate, it could have a negative
impact on the geopolitics and economy in the region, which in turn could adversely affect our operations.
Military activities in Ukraine and on its borders, including Russia effectively taking control of Crimea, followed by Crimea’s
independence vote and absorption by Russia, have combined with Ukraine’s weak economic conditions to create uncertainty in Ukraine
and the global markets. In response to the annexation of the Crimean region of Ukraine by Russia, other nations, including the U.S.,
have imposed and may continue to impose economic sanctions on Russia. Presently, concerns related to ongoing unrest in Ukraine have
prompted calls for increasing levels of economic sanctions against Russia. Resolution of Ukraine’s political and
13

economic conditions may not occur for some time and the situation could deteriorate into increased violence and/or economic collapse.
While not directly impacting territories in which we had operations as of September 30, 2017, this dispute could negatively affect the
economies of the countries in which we operate and their access to Russian energy supplies, and could negatively impact the global
economy. Further, potential responses by Russia to those sanctions could adversely affect European economic conditions, which could
have a material adverse effect on our operations in Europe.
In the Middle East region, during 2017, the Gulf Cooperation Council split in a way not seen since its foundation in 1981, after
Saudi Arabia, the UAE and Bahrain launched a boycott of Qatar in June 2017, alleging Qatar’s support to Islamist groups. The end of
the conflict does not appear to be imminent, as Qatar refuses to accept demands from Gulf Cooperation Council countries. The Qatar-
Gulf crisis may have a negative economic impact on the region.
In Asia, there is considerable political instability in Taiwan related to its disputes with China and in South Korea related to its
disputes with North Korea. Similarly, mutually exclusive territorial disputes among several Southeast Asian countries in the South
China Sea amplify the potential for an outbreak of hostilities. A major outbreak of hostilities or other political upheaval in China,
Taiwan, North Korea or South Korea could adversely affect the global economy, which could have a material adverse effect on our
business, financial condition or results of operations. A potential sharp and unexpected reduction of economic growth in China, or an
economic contraction of this country, could affect the global economy to an extent that could damage the financial results of our
operations.
Other regions are also exposed to political turmoil, including the continued political unrest in Venezuela, which may similarly
affect the results of our operations in those regions.
Further, there have been terrorist attacks and ongoing threats of future terrorist attacks in countries in which we maintain
operations. We cannot assure you that there will not be other attacks or threats that will lead to an economic contraction or erection of
material barriers to trade in any of our markets. An economic contraction in any of our major markets could affect domestic demand for
cement and could have a material adverse effect on our operations.
We are subject to anti-corruption, anti-bribery, anti-money laundering and antitrust laws and regulations in the countries in
which we operate. Any violation of any such laws or regulations could have a material adverse impact on our reputation and results
of operations and financial condition.
We are subject to anti-corruption, anti-bribery, anti-money laundering, antitrust and other international laws and regulations and
are required to comply with the applicable laws and regulations of the countries in which we operate. In addition, we are subject to
regulations on economic sanctions that restrict our dealings with certain sanctioned countries, individuals and entities. Given the large
number of contracts that we are a party to around the world, the geographic distribution of our operations and the great variety of actors
that we interact within the course of business, we are subject to the risk that our affiliates, employees, directors, officers, partners,
agents and service providers may misappropriate our assets, manipulate our assets or information, make improper payments or engage
in corruption, bribery, money laundering or other illegal activity, for such person’s personal or business advantage.
There can be no assurance that our internal policies and procedures will be sufficient to prevent or detect all inappropriate
practices, fraud or violations of law by our affiliates, employees, directors, officers, partners, agents and service providers or that any
such persons will not take actions in violation of our policies and procedures. If we fail to fully comply with applicable laws and
regulations, the relevant government authorities of the countries where we operate have the power and authority to impose fines and
other penalties. Any violations by us of anti-bribery and anti-corruption laws or sanctions regulations could have a material adverse
effect on our business, reputation, results of operations and financial condition.
For further information regarding our ongoing proceedings with respect to anti-corruption laws, see “Item 3—Key
Information—Risk Factors—Risks Relating to Our Business—We are subject to litigation proceedings, including antitrust proceedings,
that could harm our business if an unfavorable ruling were to occur” and “Item 4—Information on the Company—Regulatory Matters
and Legal Proceedings” in our 2016 Annual Report.
We have concluded that our internal control over financial reporting was not effective as of December 31, 2016, and our
remediation efforts are ongoing. As a result, our ability to report our results of operations accurately, including our ability to make
required filings with government authorities, may be adversely affected if our remediation efforts are not adequate. In addition, the
trading price of our securities may be adversely affected by a related negative market reaction.
We have identified a material weakness in our internal control over financial reporting. Our management, including CEMEX,
S.A.B. de C.V.’s Chief Executive Officer and Executive Vice President of Finance and Chief Financial Officer, has concluded that our

disclosure controls and procedures were not effective as of December 31, 2016 to achieve their intended objectives. We have identified
the following material weakness in our internal control over financial reporting: our risk assessment process did not operate effectively
to implement controls that would prevent, or detect and correct, misstatements resulting from apparent collusion or management
override of controls in relation to significant unusual transactions. In addition, we did not design and operate effective monitoring
controls to detect non-compliance with our policies related to the financial reporting of significant unusual transactions. This material
weakness relates, in part, to the previously disclosed irregular payments to a non-governmental individual made in connection with the
Maceo Project. As of December 31, 2016, the investigations of this failure, and the implementation of our remediation plan to address
it, were not far enough advanced to provide a sufficient level of assurance that such circumvention or override of controls and misuse of
funds by management would be prevented. For more information, see “Item 15—Controls and Procedures” in our 2016 Annual Report.
As of the date of this report, the process of designing, implementing and validating remedial measures related to the material weakness
is ongoing. Remedial activities to address the material weakness include, but are not limited to, the establishment of a corporate
committee to oversee large investment projects, enhancements to internal audit procedures related to large investment projects, and
enhancements to monitoring controls, including a new reporting policy for significant unusual transactions that are executed at the
operating subsidiary level, in order to make them operate at a sufficient level of precision. If our efforts to remediate this material
weakness are not successful, we may be unable to report our results of operations accurately and make our required filings with
government authorities, including the SEC. Furthermore, our business and operating results and the price of our securities may be
adversely affected by related negative market reactions. We cannot be certain that in the future additional material weaknesses will not
exist or otherwise be discovered.
SELECTED CONSOLIDATED FINANCIAL INFORMATION
The financial data set forth below as of December 31, 2015 and 2016 and for each of the three years ended December 31,
2014, 2015 and 2016 have been derived from, and should be read in conjunction with, and are qualified in their entirety by reference to,
our audited consolidated financial statements included in the 2016 Annual Report. Our audited consolidated financial statements
prepared under International Financial Reporting Standards (“IFRS”), for the year ended December 31, 2016 were approved by our
shareholders at the annual general ordinary shareholders’ meeting held on March 30, 2017.
14

The operating results of newly acquired businesses are consolidated in our financial statements beginning on the acquisition
date. Therefore, all periods presented do not include operating results corresponding to newly acquired businesses before we assumed
control. As a result, the financial data for the years ended December 31, 2014, 2015 and 2016 may not be comparable to that of prior
periods.
The financial data set forth below as of September 30, 2017, and for the nine-month periods ended September 30, 2016 and
2017, have been derived from, and should be read in conjunction with, and are qualified in their entirety by reference to, our unaudited
condensed consolidated financial statements as of September 30, 2017 and for the nine-month periods ended September 30, 2016 and
2017 and the notes thereto included herein. In the opinion of management, the unaudited condensed consolidated financial statements
reflect all adjustments (consisting of normal recurring items) that are necessary to properly present, in all material respects, the results
for the interim periods. The interim results of operations for the nine-month period ended September 30, 2017 are not indicative of
operating results to be expected for the entire year.
Our unaudited condensed consolidated financial statements as of September 30, 2017 and for the nine-month periods ended
September 30, 2016 and 2017 included herein are prepared on a basis consistent with the accounting policies used in the preparation
and presentation of our audited consolidated financial statements included in the 2016 Annual Report. No new IFRSs have been
adopted by CEMEX during 2017; however, we are calculating the effects of adopting new IFRSs during 2017, which are not yet
mandatory as of this year.
Our audited consolidated financial statements included in the 2016 Annual Report have been prepared in accordance with
IFRS, which differ in significant respects from United States Generally Accepted Accounting Principles (“U.S. GAAP”). The
regulations of the SEC do not require foreign private issuers that prepare their financial statements on the basis of IFRS (as published by
the International Accounting Standards Board) to reconcile such financial statements to U.S. GAAP. Accordingly, since our adoption of
IFRS, we no longer reconcile our financial information to U.S. GAAP.
Non-Mexican Peso amounts included in the consolidated financial statements are first translated into Dollar amounts, in each
case at a commercially available or an official government exchange rate for the relevant period or date, as applicable, and those Dollar
amounts are then translated into Mexican Peso amounts at the CEMEX accounting rate, described under “Item 3—Key
Information—Mexican Peso Exchange Rates” of the 2016 Annual Report, as of the relevant period or date, as applicable.
The Dollar amounts provided below, unless otherwise indicated elsewhere in this report, are translations of Mexican Peso
amounts at an exchange rate of Ps18.25 to U.S.$1.00, the CEMEX accounting rate as of September 30, 2017. However, in the case of
transactions conducted in Dollars, we have presented the Dollar amount of the transaction and the corresponding Mexican Peso amount
that is presented in our unaudited condensed consolidated financial statements. These translations have been prepared solely for the
convenience of the reader and should not be construed as representations that the Mexican Peso amounts actually represent those Dollar
amounts or could be converted into Dollars at the rate indicated. The noon buying rate for Mexican Pesos on September 30, 2017 was
Ps18.15 to U.S.$1.00. Between January 1, 2017 and November 17, 2017, the Mexican Peso appreciated by approximately 8% against
the Dollar, based on the noon buying rate for Mexican Pesos.
CEMEX, S.A.B. DE C.V. AND SUBSIDIARIES Selected Consolidated Financial Information
As of and For the Year Ended December 31,
As of and For the Nine Months
Ended September 30,
2014 2015 2016 2016 2017
(in millions, except ratios and share and per share amounts)
Statement of Operations Information:
Net sales Ps 199,942 Ps 220,326 Ps 249,945 Ps 186,288 Ps 192,595
Cost of sales(1) (134,742) (146,068) (160,433) (120,221) (126,668)
Gross profit 65,200 74,258 89,512 66,067 65,927
Operating expenses (43,347) (47,769) (53,969) (39,704) (41,212)
Operating earnings before other expenses, net(2) 21,853 26,489 35,543 26,363 24,715
Other (expense) income, net (5,045) (3,043) (1,670) (1,507) 1,377
Operating earnings(2) 16,808 23,446 33,873 24,856 26,092
Financial items(3) (18,952) (21,002) (16,997) (12,976) (12,975)
Share of profit of equity accounted investees 294 738 688 553 385
15

Earnings (loss) before income tax (1,850) 3,182 17,564 12,433 13,502
Discontinued operations(4)(5) 90 1,279 768 555 3,503
Non-controlling interest net income 1,103 932 1,174 987 1,087
Controlling interest net income (loss) (6,783) 1,201 14,033 9,750 17,229
Basic earnings (loss) per share(6)(7) (0.16) 0.03 0.33 0.22 0.38
Diluted earnings (loss) per share(6)(7) (0.16) 0.03 0.33 0.22 0.37
Basic earnings (loss) per share of continuing operations(6)(7) (0.16) — 0.31 0.21 0.30
Diluted earnings (loss) per share of continuing operations(6)(7) (0.16) — 0.31 0.21 0.30
Number of shares outstanding(6)(8)(9) 37,370 40,403 42,182 44,572 45,266
Balance Sheet Information:
Cash and cash equivalents 12,589 15,280 11,616 11,508 8,203
Assets held for sale(4)(5) — 3,446 21,031 15,278 1,543
Property, machinery and equipment, net 202,928 214,133 230,133 227,779 215,931
Total assets 514,961 542,264 599,728 588,860 532,808
Short-term debt including current maturities of long-term debt 14,507 218 1,222 7,675 8,110
Long-term debt 191,327 229,125 235,016 230,633 175,802
Liabilities from operations held for sale — 673 815 1,088 —
Non-controlling interest and Perpetual Debentures(10) 17,068 20,289 28,951 27,226 27,185
Total controlling interest 131,103 143,479 167,774 165,229 172,635
Other Financial Information:
Net working capital(11) 20,757 16,781 7,920 16,175 11,357
Book value per share(6)(9)(12) 3.51 3.55 3.98 3.71 3.82
Operating margin before other expense, net 10.9% 12.0% 14.2% 14.2% 12.8%
Operating EBITDA(13) 35,556 41,354 51,534 38,379 36,597
Ratio of Operating EBITDA to interest expense(13) 1.7 2.1 2.3 2.3 2.4
Capital expenditures 9,486 12,313 13,279 13,278 6,403
Depreciation and amortization 13,703 14,865 15,991 12,016 11,882
Net cash flow provided by continued operating activities
before interest, coupons on Perpetual Debentures and
income taxes 35,445 43,184 61,188 40,919 29,690
Basic earnings (loss) per CPO of continuing operations(6)(7) (0.48) — 0.93 0.63 0.90
Basic earnings (loss) per CPO(6)(7) (0.48) 0.09 0.99 0.66 1.14
Total debt plus other financial obligations 244,429 268,198 273,868 273,868 214,004
(1) Cost of sales includes depreciation, amortization and depletion of assets involved in production, freight expenses of raw materials
used in our producing plants, delivery expenses of our ready-mix concrete business and expenses related to storage in producing
plants. Our cost of sales excludes (i) expenses related to personnel and equipment comprising our selling network and those
expenses related to warehousing at the points of sale, which are included as part of the line item titled “Administrative and selling
expenses,” and (ii) freight expenses of finished products from our producing plants to our points of sale and from our points of
sale to our customers’ locations, which are all included as part of the line item titled “Distribution expenses.”
16

(2) In the statements of operations, CEMEX includes the line item titled “Operating earnings before other income (expenses), net”
considering that is a relevant measure for CEMEX’s management as explained in note 4B to our audited consolidated financial
statements included in the 2016 Annual Report. Under IFRS, while there are line items that are customarily included in the
statement of operations, such as net sales, operating costs and expenses and financial revenues and expenses, among others, the
inclusion of certain subtotals such as “Operating earnings before other income (expenses), net” and the display of such statements
of operations varies significantly by industry and company according to specific needs.
(3) Financial items include financial expenses and our other financial income, net, which includes our financial income, results from
financial instruments, net (derivatives, fixed-income investments and other securities), foreign exchange results and effects of net
present value on assets and liabilities and others, net. See notes 7 and 16 to our audited consolidated financial statements included
in the 2016 Annual Report and note 6 to our unaudited condensed consolidated financial statements for the nine-month periods
ended September 30, 2016 and 2017 included herein.
(4) On October 31, 2015, after the conditions precedent were satisfied, we completed the sale of our operations in Austria and
Hungary to the Rohrdorfer Group for €165 million (U.S.$179 million or Ps3,090 million) after final adjustments for changes in
cash and working capital balances as of the transfer date. Our combined operations in Austria and Hungary consisted of 29
aggregates quarries and 68 ready-mix plants. As per IFRS, our balance sheet as of December 31, 2014 was not restated as a result
of the sale of our operations in Austria and Hungary. On May 26, 2016, we closed the sale of our operations in Bangladesh and
Thailand to Siam City Cement Public Company Ltd. for approximately U.S.$70 million. As per IFRS, our balance sheet as of
December 31, 2015 was not restated as a result of the sale of our operations in Thailand and Bangladesh. On January 31, 2017,
one of CEMEX, S.A.B. de C.V.’s subsidiaries in the U.S. closed the sale of our U.S. Reinforced Concrete Pipe Manufacturing
Business (the “Concrete Pipe Business”) to Quikrete Holdings, Inc. (“Quikrete”) for U.S.$500 million plus an additional
U.S.$40 million contingent consideration based on future performance. Considering that we disposed of our entire concrete pipe
division, the operations of the Concrete Pipe Business, as included in our statements of operations for the years ended
December 31, 2014, 2015 and 2016, were reclassified to the single line item “Discontinued operations.” In addition, as of
December 31, 2016, the Concrete Pipe Business was reclassified to assets held for sale and directly related liabilities on our
consolidated balance sheet, including U.S.$260 million (Ps5,369 million) of goodwill associated with the reporting segment in the
United States that was proportionally allocated to these net assets based on their relative fair values. See note 4A to our audited
consolidated financial statements included in the 2016 Annual Report and note 3A to our unaudited condensed consolidated
financial statements for the nine-month periods ended September 30, 2016 and 2017 included herein.
(5) On August 12, 2015, we entered into an agreement for the sale of our operations in Croatia, including assets in Bosnia and
Herzegovina, Montenegro and Serbia, to Duna-Dráva Cement Kft. for €231 million (approximately U.S.$243 million or Ps5,032
million). Those operations mainly consist of three cement plants with aggregate annual production capacity of approximately
2.4 million tons of cement, two aggregates quarries and seven ready-mix plants. On April 5, 2017, we announced that the
European Commission issued a decision that restricts completion of the sale. Therefore, the sale of our operations in Croatia did
not close and we currently maintain our operations in Croatia, including assets in Bosnia and Herzegovina, Montenegro and
Serbia. For the years ended December 31, 2015 and 2014, the operations in Croatia, including assets in Bosnia and Herzegovina,
Montenegro and Serbia, included in our statements of operations are presented in the single line item “Discontinued operations.”
However, due to the inability to complete the sale, beginning in the second quarter of 2017, we reclassified the financial
statements of our operations in Croatia, including assets in Bosnia and Herzegovina, Montenegro and Serbia, from the single line
item “Discontinued operations” to each applicable line item in our 2016 consolidated financial statements. See notes 4A and 26 to
our audited consolidated financial statements included in the 2016 Annual Report and note 3A to our unaudited condensed
consolidated financial statements included herein.
(6) CEMEX, S.A.B. de C.V.’s capital stock consists of Series A shares and Series B shares. Each CPO represents two Series A shares
and one Series B share. As of September 30, 2017, approximately 99.85% of CEMEX, S.A.B. de C.V.’s outstanding share capital
was represented by CPOs. Each ADS represents ten CPOs.
(7) Earnings (loss) per share is calculated based upon the weighted average number of shares outstanding during the year, as
described in note 22 to our audited consolidated financial statements included in the 2016 Annual Report. Basic loss per CPO is
determined by multiplying the basic loss per share for each period by three (the number of shares underlying each CPO). Basic
loss per CPO is presented solely for the convenience of the reader and does not represent a measure under IFRS. As shown in
notes 4A and 22 to our audited consolidated financial statements included in the 2016 Annual Report, and in connection with the
sale of our operations in Croatia, Austria, Hungary, Thailand, Bangladesh, and the sale of the Concrete Pipe Business, for the year
ended December 31, 2014, “Basic loss per share” includes Ps0.16 from “Continuing operations,” and for the year ended
December 31, 2016, “Basic earnings per share” includes Ps0.31 from “Continuing operations.” In addition, for the years ended
December 31, 2015 and 2016, “Basic earnings per share” includes Ps0.03 and Ps0.02, respectively, from “Discontinued
operations.” Likewise, for the year ended December 31, 2014, “Diluted loss per share” includes Ps0.16, and for the year ended
17

December 31, 2016, “Diluted earnings per share” includes Ps0.31 from “Continuing operations.” In addition, for the years ended
December 31, 2015 and 2016, “Diluted earnings per share” includes Ps0.03 and Ps0.02, respectively, from “Discontinued
operations.” For the nine-month period ended September 30, 2016, “Basic earnings per share” and “Diluted earnings per share”
include Ps0.21 from “Continuing operations.” For the nine-month period ended September 30, 2017, “Basic earnings per share”
and “Diluted earnings per share” include Ps0.30 from “Continuing operations.” See note 22 to our audited consolidated financial
statements included in the 2016 Annual Report.
(8) CEMEX, S.A.B. de C.V. did not declare a dividend for fiscal years 2014, 2015 and 2016. At each of CEMEX, S.A.B. de C.V.’s
2014, 2015 and 2016 annual general ordinary shareholders’ meetings, held on March 26, 2015, March 31, 2016, and March 30,
2017, respectively, CEMEX, S.A.B. de C.V.’s shareholders approved a recapitalization of retained earnings. New CPOs issued
pursuant to each such recapitalization were allocated to shareholders on a pro-rata basis. As a result, shares equivalent to
approximately 500 million CPOs, approximately 538 million CPOs and approximately 562.4 million CPOs were allocated to
shareholders on a pro-rata basis in connection with the 2014, 2015 and 2016 recapitalizations, respectively. In each case, CPO
holders received one new CPO for each 25 CPOs held and ADS holders received one new ADS for each 25 ADSs held. There was
no cash distribution and no entitlement to fractional shares.
(9) Based upon the total number of shares outstanding at the end of each period, expressed in millions of shares, and includes shares
subject to financial derivative transactions, but does not include shares held by our subsidiaries.
(10) As of December 31, 2014, 2015 and 2016 and September 30, 2016 and 2017, non-controlling interest includes U.S.$466 million
(Ps6,869 million), U.S.$440 million (Ps7,581 million), U.S.$438 million (Ps9,075 million), U.S.$443 million (Ps8,590 million)
and U.S.$446 million (Ps8,140 million), respectively, that represents the nominal amount of Perpetual Debentures, denominated in
Dollars and Euros, issued by consolidated entities. In accordance with IFRS, these securities qualify as equity due to their
perpetual nature and the option to defer the coupons.
(11) Net working capital equals trade receivables, less allowance for doubtful accounts plus inventories, net, less trade payables.
(12) Book value per share is calculated by dividing the total controlling interest by the number of shares outstanding.
(13) Operating EBITDA equals operating earnings before other income (expenses), net, plus amortization and depreciation expenses.
Operating EBITDA is calculated and presented because we believe that it is widely accepted as a financial indicator of our ability
to internally fund capital expenditures and service or incur debt, and the consolidated ratio of Operating EBITDA to interest
expense is calculated and presented because it is used to measure our performance under certain of our financing agreements.
Operating EBITDA and such ratio are non-IFRS measures, and should not be considered as indicators of our financial
performance as alternatives to cash flow, as measures of liquidity or as being comparable to other similarly titled measures of
other companies. Under IFRS, while there are line items that are customarily included in statements of operations prepared
pursuant to IFRS, such as net sales, operating costs and expenses and financial revenues and expenses, among others, the inclusion
of certain subtotals, such as operating earnings before other income (expenses), net, and the display of such statement of
operations varies significantly by industry and company according to specific needs. Our Operating EBITDA may not be
comparable to similarly titled measures reported by other companies due to potential differences in the method of calculation.
Operating EBITDA is reconciled below to operating earnings before other income (expenses), net, as reported in the statements of
operations, and to net cash flows provided by operating activities before interest and income taxes paid in cash, as reported in the
statement of cash flows. Interest expense under IFRS does not include coupon payments on the Perpetual Debentures issued by
consolidated entities of approximately Ps420 million in 2014, approximately Ps432 million in 2015 and approximately
Ps507 million in 2016, as described in note 20D to our audited consolidated financial statements included in the 2016 Annual
Report, and approximately Ps369 million for the nine-month period ended September 30, 2016 and approximately Ps359 million
for the nine-month period ended September 30, 2017.
18

For the Year Ended December 31,
For the Nine
Months Ended September 30,
2014 2015 2016 2016 2017
(in millions)
(unaudited)
Reconciliation of Operating EBITDA to net
cash flows provided by continuing
operations activities before interest,
coupons on Perpetual Debentures and
income taxes
Operating EBITDA Ps 35,556 Ps 41,354 Ps 51,534 Ps 38,379 Ps 36,597
Less:
Depreciation and amortization expense 13,703 14,865 15,991 12,016 11,882
Operating earnings before other expenses, net Ps 21,853 Ps 26,489 Ps 35,543 Ps 26,363 Ps 24,715
Plus / minus:
Changes in working capital excluding
income taxes 1,475 3,541 11,023 3,500 (4,219)
Depreciation and amortization
expense 13,703 14,865 15,991 12,016 11,882
Other items, net (1,586) (1,711) (1,369) (960) (2,688)
Net cash flows provided by continuing
operations activities before interest, coupons
on Perpetual Debentures and income taxes Ps 35,445 Ps 43,184 Ps 61,188 Ps 40,919 Ps 29,690
19

MANAGEMENT’S DISCUSSION AND ANALYSIS OF FINANCIAL CONDITION AND RESULTS OF OPERATIONS
The following discussion and analysis should be read in conjunction with, and is qualified in its entirety by reference to, our
unaudited condensed consolidated financial statements as of September 30, 2017 and for the nine-month periods ended September 30,
2016 and 2017 included herein. Our significant accounting policies are described in note 2 to our audited consolidated financial
statements included in our 2016 Annual Report.
On October 26, 2017, we announced our results for the nine-month period ended September 30, 2017. The interim results of
operations for the nine-month period ended September 30, 2017 are not indicative of operating results to be expected for the entire year
or any subsequent interim period. The following is a discussion of our results for the nine-month period ended September 30, 2017 as
compared to the same period in the prior year.
Our unaudited condensed consolidated financial statements included herein include those subsidiaries in which we hold a
controlling interest or which we otherwise control. Control exists when we have the power, directly or indirectly, to govern the
administrative, financial and operating policies of an entity in order to obtain benefits from its activities.
Investments in associates are accounted for by the equity method, when we have significant influence, which is generally
presumed with a minimum equity interest of 20% unless it is proven that we have significant influence with a lower percentage. Under
the equity method, after acquisition, our original cost in the investment is adjusted for our proportional interest of the holding company
in the associate’s equity and earnings, considering the effects of inflation.
All balances and transactions among group subsidiaries have been eliminated in consolidation.
For the nine-month periods ended September 30, 2016 and 2017, our consolidated results reflect the following transactions, which
had an impact on the comparability of our results in such periods:
• On June 30, 2017, we announced that one of our subsidiaries in the United States closed the divestment of its Pacific
Northwest Materials Business consisting of aggregate, asphalt and ready-mix concrete operations in Oregon and Washington
to Cadman Materials, Inc., a subsidiary of Lehigh Hanson, Inc. and the U.S. subsidiary of Heidelberg-Cement Group, for
approximately U.S.$150 million.
• On February 10, 2017, one of our subsidiaries in the U.S. sold its Fairborn, Ohio cement plant and cement terminal in
Columbus, Ohio to Eagle Materials Inc. for U.S.$400 million. We used the proceeds from this transaction for debt reduction
and general corporate purposes.
• On January 31, 2017, we announced the closing of the sale of the Concrete Pipe Business in the United States to Quikrete for
approximately U.S.$500 million plus an additional U.S.$40 million contingent consideration based on future performance.
• On November 18, 2016, after all conditions precedent were satisfied, CEMEX, S.A.B. de C.V. announced that it had closed
the sale of certain assets in the U.S. to Grupo Cementos de Chihuahua, S.A.B. de C.V. (“GCC”) for approximately
U.S.$306 million. The assets were sold by an affiliate of CEMEX to an affiliate of GCC in the U.S., and mainly consisted of
CEMEX’s cement plant in Odessa, Texas, two cement terminals and the building materials business in El Paso, Texas and
Las Cruces, New Mexico.
• On July 18, 2016, CHP closed its initial public offering of 45% of its common shares in the Philippines and 100% of CHP’s
common shares started trading on the Philippine Stock Exchange under the ticker “CHP.” As of September 30, 2017,
CEMEX Asian South East Corporation, an indirect subsidiary of CEMEX España, directly owned approximately 55% of
CHP’s outstanding common shares. The net proceeds to CHP from its initial public offering were approximately
U.S.$506.8 million, which were used to repay existing indebtedness owed to BDO Unibank and to an indirect subsidiary of
CEMEX.
• On May 26, 2016, certain of our subsidiaries sold their operations in Bangladesh and Thailand to Siam City Cement Public
Company Ltd. for approximately U.S.$70 million. We used the proceeds from this transaction for debt reduction and general
corporate purposes.
• On August 12, 2015, we entered into an agreement for the sale of our operations in Croatia, including assets in Bosnia and
Herzegovina, Montenegro and Serbia, to Duna-Dráva Cement Kft. for €231 million (approximately U.S.$243 million or
Ps5,032 million). Those operations mainly consisted of three cement plants with aggregate annual production capacity of
approximately 2.4 million tons of cement, two aggregates quarries and seven ready-mix plants. On April 5, 2017, we
20

announced that the European Commission issued a decision that restricted completion of the sale. Therefore, the sale of our
operations in Croatia did not close and we currently maintain our operations in Croatia, including assets in Bosnia and
Herzegovina, Montenegro and Serbia.
Selected Condensed Consolidated Statements of Operations Data
The following table sets forth our selected condensed consolidated statements of operations data for each of the nine-month
periods ended September 30, 2016 and 2017 expressed as a percentage of net sales.
For the Nine-Month Periods
Ended September 30,
2016 2017
Net sales 100% 100%
Cost of sales (65)% (66)%
Gross profit 35% 34%
Total operating expenses (21)% (21)%
Operating earnings before other income (expense), net 14% 13%
Other income (expenses), net (1)% 1%
Operating earnings 13% 14%
Financial expense (9)% (8)%
Other financial income, net 2% 1%
Share of profit of equity accounted investees — —
Earnings before income tax 7% 7%
Income taxes (1)% 1%
Net income from continuing operations 5% 8%
Discontinued operations — 2%
Consolidated net income for the period 6% 10%
Non-controlling interest net income for the period (1)% (1)%
Controlling interest net income for the period 5% 9%
Nine-Month Period Ended September 30, 2017 Compared to Nine-Month Period Ended September 30, 2016
Summarized in the table below are the percentage (%) increases (+) and decreases (-) for the nine-month period ended
September 30, 2017 compared to the nine-month period ended September 30, 2016, in our domestic cement and ready-mix concrete
sales volumes, as well as export sales volumes of cement and domestic cement and ready-mix concrete average sales prices for each of
our geographic segments.
Effective January 1, 2016, according to an announcement made by CEMEX on December 1, 2015, CEMEX’s operations were
reorganized into five geographical regions, each under the supervision of a regional president, as follows: (1) Mexico, (2) United States,
(3) Europe, (4) SAC and (5) Asia, Middle East and Africa. Under the new organization, the geographical operating segments under the
former Mediterranean region were incorporated to the Europe region or the Asia, Middle East and Africa region, as applicable.
The table below and the other volume data presented by geographic segment in this “Management’s Discussion and Analysis of
Financial Condition and Results of Operations” section are presented before eliminations resulting from consolidation (including those
shown on page F-13 of our unaudited condensed consolidated financial statements for the nine-month periods ended September 30,
2016 and 2017 included herein).
Domestic Sales Volumes
Export Sales
Volumes
Average Domestic Sales
Prices in Local Currency(1)
Geographic Segment Cement
Ready-Mix
Concrete Cement Cement
Ready-Mix
Concrete
Mexico -4% -2% +6% +18% +9%
United States -7% -4% — +3% +1%
Europe
United Kingdom -8% -2% — +3% Flat
Germany +14% +2% -10% Flat +2%
France — +7% — — +1%

Spain +23% Flat -20% -4% +6%
Rest of Europe (2) +7% +9% +12% +4% +4%
South, Central America and the Caribbean
Colombia -5% -15% — -21% -2%
Rest of South, Central America and the
Caribbean (3) +24% +10% +7% +2% -2%
Asia, Middle East and Africa
Egypt -14% -3% — +11% -5%
Philippines -3% — +2% -10% —
Rest of Asia, Middle East and Africa (4) +56% +5% — +3% +4%
21

“—” = Not Applicable
(1) Represents the average change in domestic cement and ready-mix concrete prices in local currency terms. For purposes of a
geographic segment consisting of a region, the average prices in local currency terms for each individual country within the region
are first translated into Dollar terms (except for the Rest of Europe, in which they are translated first into Euros) at the exchange
rates in effect as of the end of the reporting period. Variations for a region represent the weighted average change of prices in
Dollar terms (except for the Rest of Europe, in which they represent the weighted average change of prices in Euros) based on
total sales volumes in the region.
(2) The “Rest of Europe” segment refers primarily to operations in the Czech Republic, Croatia, Poland and Latvia, as well as trading
activities in Scandinavia and Finland. On August 12, 2015, we entered into an agreement for the sale of our operations in Croatia,
including assets in Bosnia and Herzegovina, Montenegro and Serbia, to Duna-Dráva Cement Kft. On April 5, 2017, we announced
that the European Commission issued a decision that restricted completion of the sale. Therefore, the sale of our operations in
Croatia did not close and we currently maintain our operations in Croatia, including assets in Bosnia and Herzegovina,
Montenegro and Serbia. Due to the inability to complete the sale, beginning in the second quarter of 2017, we reclassified the
financial statements of our operations in Croatia, including assets in Bosnia and Herzegovina, Montenegro and Serbia, from the
single line item “Discontinued operations” to each applicable line item in our 2016 condensed consolidated financial statements.
See notes 4A and 26 to our audited consolidated financial statements included in the 2016 Annual Report and note 3A to our
unaudited condensed consolidated financial statements included herein.
(3) The “Rest of South, Central America and the Caribbean” segment includes CEMEX’s operations in Costa Rica, Panama, Puerto
Rico, the Dominican Republic, Nicaragua, Peru, Jamaica, Trinidad and Tobago and other countries in the Caribbean, El Salvador,
Guatemala, Brazil and small ready-mix concrete operations in Argentina.
(4) The “Rest of Asia, Middle East and Africa” segment includes the operations in the UAE and Israel. On May 26, 2016, we
completed the sale of our operations in Bangladesh and Thailand. Our operations in Bangladesh and Thailand for the five-month
period ended May 26, 2016 included in CEMEX’s statements of operations were reclassified to the single line item “Discontinued
operations.” See note 4A to our consolidated financial statements included in the 2016 Annual Report and note 3A to our
unaudited condensed consolidated financial statements included herein.
On a consolidated basis, our cement sales volumes decreased 2%, from 52.2 million tons for the nine-month period ended
September 30, 2016 to 51.3 million tons for the same period in 2017 and our ready-mix concrete sales volumes remained flat at
38.6 million tons for the nine-month periods ended September 30, 2016 and 2017. Our net sales increased approximately 3%, from
Ps186,288 million for the nine-month period ended September 30, 2016 to Ps192,595 million for the same period in 2017, and our
operating earnings before other income (expenses), net, decreased approximately 6%, from Ps26,363 million for the nine-month period
ended September 30, 2016 to Ps24,715 million for the same period in 2017.
The following tables present selected financial information of net sales and operating earnings before other income (expenses),
net, for each of our geographic segments for the nine-month periods ended September 30, 2016 and 2017. The net sales information in
the table below is presented before eliminations resulting from consolidation shown on page F-10 of our unaudited condensed
consolidated financial statements for the nine-month periods ended September 30, 2016 and 2017 included herein. Variations in net
sales determined on the basis of Mexican Pesos include the appreciation or depreciation which occurred during the period between the
local currencies of the countries in the regions vis-à-vis the Mexican Peso; therefore, such variations differ substantially from those
based solely on the countries’ local currencies:
Geographic Segment
Variation in
Local
Currency(1)
Approximate
Currency
Fluctuations
Variation in
Mexican Pesos
Net Sales
For the Nine-Month Periods
Ended September 30,
2016 2017
(in millions of Mexican Pesos)
Mexico +10% — +10% Ps 39,511 Ps 43,501
United States -2% +2% Flat 49,467 49,543
Europe
United Kingdom -2% -5% -7% 16,270 15,207
Germany +3% +2% +5% 6,972 7,328
France +7% +3% +10% 10,746 11,829
Spain -1% +3% +2% 5,057 5,164
Rest of Europe(2) +12% +2% +14% 9,492 10,836
South, Central America and
the Caribbean
22

Geographic Segment
Variation in
Local
Currency(1)
Approximate
Currency
Fluctuations
Variation in
Mexican Pesos
Net Sales
For the Nine-Month Periods
Ended September 30,
2016 2017
(in millions of Mexican Pesos)
Colombia -18% +5% -13% 9,346 8,132
Rest of South, Central
America and the
Caribbean(3) +23% -1% +22% 14,633 17,835
Asia, Middle East and
Africa
Egypt -3% -13% -52% 5,715 2,736
Philippines -13% -39% -16% 7,471 6,289
Rest of Asia, Middle
East and Africa(4) +8% +2% +10% 8,805 9,699
Others(5) +11% +10% +21% 13,830 16,699
Continuing operations +4% Ps 197,315 Ps 204,798
Discontinued operations -77% 6,819 1,549
Net sales before
eliminations +1% Ps 204,134 Ps 206,347
Eliminations resulting
from consolidation +11% 11,027 12,203
Net sales +1% Ps 193,107 Ps 194,144
23

Geographic Segment
Variation in
Local
Currency(1)
Approximate
Currency
Fluctuations
Variation in
Mexican
Pesos
Operating Earnings (Loss)
Before Other Income (Expenses),
Net
For the Nine-Month Periods Ended
September 30,
2016 2017
(in millions of Mexican Pesos)
Mexico +15% — +15% Ps 12,479 Ps 14,355
United States +17% -2% +15% 2,681 3,090
Europe
United Kingdom -27% -3% -30% 2,007 1,395
Germany +<100% — +<100% 7 112
France +85% -5% +80% 151 272
Spain ->100% — ->100% 183 (267)
Rest of Europe(2) +24% -8% +16% 520 605
South, Central America and the
Caribbean
Colombia -61% +3% -58% 2,869 1,215
Rest of South, Central America and the
Caribbean(3) +8% — +8% 3,975 4,303
Asia, Middle East and Africa
Egypt -57% -23% -80% 1,571 315
Philippines -60% -2% -58% 1,719 723
Rest of Asia, Middle East and Africa(4) +6% — +6% 961 1,014
Others(5) -1% -11% -12% (2,760) (2,417)
Operating earnings before other income
(expenses), net from continuing
operations -6% Ps 26,363 Ps 24,715
Operating earnings before other income
(expenses), net from discontinued
operations -94% 310 18
Total -7% Ps 26,673 Ps 24,733
“—” = Not Applicable
(1) Represents the variation in local currency terms. For purposes of a geographic segment consisting of a region, the variation in
local currency terms for each individual country within the region are first translated into Dollar terms (except for the Rest of
Europe, in which they are translated first into Euros) at the exchange rates in effect as of the end of the reporting period.
Variations for a region represent the change in Dollar terms (except for the Rest of Europe region, in which they represent the
change in Euros), net, in the region.
(2) The “Rest of Europe” segment refers primarily to operations in the Czech Republic, Croatia, Poland and Latvia, as well as trading
activities in Scandinavia and Finland. On August 12, 2015, we entered into an agreement for the sale of our operations in Croatia,
including assets in Bosnia and Herzegovina, Montenegro and Serbia, to Duna-Dráva Cement Kft. On April 5, 2017, we announced
that the European Commission issued a decision that restricted completion of the sale. Therefore, the sale of our operations in
Croatia did not close and we currently maintain our operations in Croatia, including assets in Bosnia and Herzegovina,
Montenegro and Serbia. Due to the inability to complete the sale, beginning in the second quarter of 2017, we reclassified the
financial statements of our operations in Croatia, including assets in Bosnia and Herzegovina, Montenegro and Serbia, from the
single line item “Discontinued operations” to each applicable line item in our 2016 condensed consolidated financial statements.
See note 4A and 26 to our audited consolidated financial statements included in the 2016 Annual Report and note 3A to our
unaudited condensed consolidated financial statements included herein.
(3) The “Rest of South, Central America and the Caribbean” segment includes CEMEX’s operations in Costa Rica, Panama, Puerto
Rico, the Dominican Republic, Nicaragua, Peru, Jamaica, Trinidad and Tobago and other countries in the Caribbean, El Salvador,
Guatemala, Brazil and small ready-mix concrete operations in Argentina.
(4) The “Rest of Asia, Middle East and Africa” segment includes the operations in the UAE and Israel. On May 26, 2016, we
completed the sale of our operations in Bangladesh and Thailand. Our operations in Bangladesh and Thailand for the five-month
period ended May 26, 2016 included in CEMEX’s statements of operations were reclassified to the single line item “Discontinued
operations,” which includes, for the nine-month period ended September 30, 2016, a gain on sale of approximately
U.S.$24 million (Ps424 million). See note 4A to our consolidated financial statements included in the 2016 Annual Report and
note 3A to our unaudited condensed consolidated financial statements included herein.

(5) The “Others” segment refers to: (i) cement trade maritime operations, (ii) our information technology solutions business (Neoris
N.V.), (iii) CEMEX, S.A.B. de C.V. and other corporate entities and (iv) other minor subsidiaries with different lines of business.
24

Net sales. Our consolidated net sales increased approximately 3%, from Ps186,288 million for the nine-month period ended
September 30, 2016 to Ps192,595 million for the same period in 2017. The increase was primarily attributable to higher prices for our
products in Mexico and the U.S., as well as higher cement volumes in Europe, Asia, the Middle East and African regions. Set forth
below is a quantitative and qualitative analysis of the various factors affecting our net sales on a geographic segment basis. The
discussion of volume data and net sales information below is presented before eliminations resulting from consolidation shown in note
3C to our unaudited condensed consolidated financial statements for the nine-month periods ended September 30, 2016 and 2017
included herein.
Mexico
As of September 30, 2017, our operations in Mexico represented approximately 13% of our total assets. Our net sales from our
operations in Mexico represented approximately 21% of our total net sales for the nine-month period ended September 30, 2017, in
Mexican Peso terms, before eliminations resulting from consolidation. Our domestic cement sales volumes from our operations in
Mexico decreased approximately 4% for the nine-month period ended September 30, 2017 compared to the same period in 2016, and
our ready-mix concrete sales volumes decreased approximately 2% over the same period. In the industrial-and-commercial sector, while
recent indicators reflect slower growth in retail sales, favorable dynamics continued in shopping malls, hospitality and tourism-related
construction. Regarding the self-construction sector, while disposable income was temporarily affected by higher inflation, indicators
including job creation and remittances continued to be solid. In the formal residential sector, there has been a recent shift in mortgage
dynamics between banking and government-related entities. Mortgage credits from the banking sector, recently reflected a slowdown in
credits while mortgages from the Instituto del Fondo Nacional de la Vivienda para los Trabajodores (“INFONAVIT”) rebounded.
INFONAVIT is now offering higher-value loans with improved terms and conditions. Low-income housing activity has been affected
by a decline in government subsidies. The infrastructure sector was affected by lower investment from the federal government. Our
cement export volumes from our operations in Mexico, which represented approximately 4% of our Mexican cement sales volumes for
the nine-month period ended September 30, 2016, increased approximately 6% for the nine-month period ended September 30, 2017
compared to the same period in 2016. Of our total cement export volumes from our operations in Mexico during the nine-month period
ended September 30, 2017, 49% was shipped to the United States, 51% to South, Central America and the Caribbean. Our average sales
price of domestic cement from our operations in Mexico increased approximately 18%, in Mexican Peso terms, for the nine-month
period ended September 30, 2017 compared to the same period in 2016, and our average sales price of ready-mix concrete increased
approximately 9%, in Mexican Peso terms, over the same period. For the nine-month period ended September 30, 2017, cement
represented approximately 59%, ready-mix concrete approximately 20% and our aggregates and other businesses approximately 21% of
our net sales, in Mexican Peso terms, from our operations in Mexico before intra-sector eliminations within the segment and before
eliminations resulting from consolidation, as applicable.
As a result of increases in our domestic cement and ready-mix concrete average sales prices, partially offset by decreases in
domestic cement and ready-mix concrete average sales volumes, our net sales in Mexico, in Mexican Peso terms, increased
approximately 10% for the nine-month period ended September 30, 2017 compared to the same period in 2016.
United States
As of September 30, 2017, our operations in the United States represented approximately 47% of our total assets. Our net sales
from our operations in the United States represented approximately 24% of our total net sales for the nine-month period ended
September 30, 2017, in Mexican Peso terms, before eliminations resulting from consolidation. Our domestic cement sales volumes from
our operations in the United States decreased approximately 7% for the nine-month period ended September 30, 2017 compared to the
same period in 2016, and our ready-mix concrete sales volumes decreased approximately 4% over the same period. The residential
sector continued as the main driver of demand. Single family housing starts increased in this period, supported by low inventories, wage
growth, job creation, positive consumer sentiment, and improved lending conditions. Additionally, single-family housing permits
increased year-to-date in September. In the industrial-and-commercial sector, construction spending increased year-to-date in August,
with cement consumption growth in commerce, office and lodging. Our domestic cement average sales prices of our operations in the
United States increased approximately 3%, in Dollar terms, for the nine-month period ended September 30, 2017 compared to the same
period in 2016, and our average ready-mix concrete sales price increased approximately 1%, in Dollar terms, over the same period. For
the nine-month period ended September 30, 2017, cement represented approximately 33%, ready-mix concrete approximately 42% and
our aggregates and other businesses approximately 25% of net sales in Mexican Peso terms from our operations in the United States
before intra-sector eliminations within the segment and before eliminations resulting from consolidation, as applicable.
As a result of the decreases in domestic cement and ready-mix concrete sales volumes, partially offset by increases in domestic
cement and ready-mix concrete average sales prices, net sales from our operations in the United States, in Dollar terms, decreased by
2% for the period ended September 30, 2017 compared to the same period in 2016.
25

Europe
For the nine-month period ended September 30, 2017, our operations in the Europe region consisted of our operations in the
United Kingdom, Germany, France and Spain, which represent the most significant operations in this region, in addition to the Rest of
Europe, which refers primarily to operations in the Czech Republic, Croatia, Poland and Latvia, as well as trading activities in
Scandinavia and Finland. Our net sales from our operations in the Europe region represented approximately 24% of our total net sales
for the nine-month period ended September 30, 2017, in Mexican Peso terms, before eliminations resulting from consolidation. As of
September 30, 2017, our operations in the Europe region represented approximately 19% of our total assets. Set forth below is a
quantitative and qualitative analysis of the effects of the various factors affecting our net sales for our main operations in the Europe
region.
United Kingdom
Our domestic cement sales volumes from our operations in the United Kingdom decreased approximately 8% for the nine-month
period ended September 30, 2017 compared to the same period in 2016, and our ready-mix concrete sales volumes decreased
approximately 2% over the same period. The decreases in domestic cement and ready-mix concrete sales volumes reflects a high base
of comparison with the same period last year due to non-recurring industry sales, as well as softening market conditions due to political
uncertainty. The residential sector was the main driver of demand supported by government’s help-to-buy program. Our operations in
the United Kingdom represented approximately 7% of our total net sales for the nine-month period ended September 30, 2017, in
Mexican Peso terms, before eliminations resulting from consolidation. Our average sales price of domestic cement from our operations
in the United Kingdom increased approximately 3%, in Pound terms, for the nine-month period ended September 30, 2017 compared to
the same period in 2016, and our average sales price of ready-mix concrete remained flat, in Pound terms, over the same period. For the
nine-month period ended September 30, 2017, cement represented approximately 17%, ready-mix concrete approximately 27% and our
aggregates and other businesses approximately 56% of net sales in Mexican Peso terms from our operations in the United Kingdom
before intra-sector eliminations within the segment and before eliminations resulting from consolidation, as applicable.
As a result of the decreases in domestic cement and ready-mix concrete sales volumes, partially offset by an increase in domestic
cement average sales prices, net sales from our operations in the United Kingdom, in Pound terms, decreased approximately 2% for the
nine-month period ended September 30, 2017 compared to the same period in 2016.
Germany
Our domestic cement sales volumes from our operations in Germany increased approximately 14% for the nine-month period
ended September 30, 2017 compared to the same period in 2016, and our ready-mix concrete sales volumes increased approximately
2% over the same period. Domestic cement volume growth reflects our participation in infrastructure projects and strong demand from
the residential sector. The infrastructure sector benefited from increased central government spending, while the residential sector
continued to benefit from low unemployment and mortgage rates, rising purchasing power as well as immigration. Our cement export
volumes from our operations in Germany, which represented approximately 32% of our cement sales volumes in Germany for the nine-
month period ended September 30, 2017, decreased approximately 10% for the nine-month period ended September 30, 2017 compared
to the same period in 2016. Of our total cement export volumes from our operations in Germany during the nine-month period ended
September 30, 2017, 100% was shipped to the Rest of Europe. Our operations in Germany represented approximately 4% of our total
net sales for the nine-month period ended September 30, 2017, in Mexican Peso terms, before eliminations resulting from consolidation.
Our average sales price of domestic cement from our operations in Germany remained flat, in Euro terms, for the nine-month period
ended September 30, 2017 compared to the same period in 2016, and our average sales price of ready-mix concrete increased
approximately 2%, in Euro terms, over the same period. For the nine-month period ended September 30, 2017, cement represented
approximately 29%, ready-mix concrete approximately 36% and our aggregates and other businesses approximately 35% of net sales in
Mexican Peso terms from our operations in Germany before intra-sector eliminations within the segment and before eliminations
resulting from consolidation, as applicable.
As a result of the increases in domestic cement and ready-mix concrete sales volumes and ready-mix concrete average sales
prices, net sales from our operations in Germany, in Euro terms, increased approximately 3% for the nine-month period ended
September 30, 2017 compared to the same period in 2016.
France
Our ready-mix concrete sales volumes from our operations in France increased approximately 7% for the nine-month period ended
September 30, 2017 compared to the same period in 2016. Volume growth reflects continued activity in the residential sector. The
residential sector was supported by low interest rates and government’s initiatives including a buy-to-let program and zero-rate

26

loans for first time buyers. Our operations in France represented approximately 6% of our total net sales for the nine-month period
ended September 30, 2017, in Mexican Peso terms, before eliminations resulting from consolidation. Our average sales price of
ready-mix concrete of our operations in France increased approximately 1%, in Euro terms, for the nine-month period ended
September 30, 2017 compared to the same period in 2016. For the nine-month period ended September 30, 2017, ready-mix concrete
represented approximately 67% and our aggregates and other businesses approximately 33% of net sales in Mexican Peso terms from
our operations in France before intra-sector eliminations within the segment and before eliminations resulting from consolidation, as
applicable.
As a result of the increases in ready-mix concrete sales volumes and average sales prices, net sales from our operations in France,
in Euro terms, increased approximately 7% for the nine-month period ended September 30, 2017 compared to the same period in 2016.
Spain
Our domestic cement sales volumes from our operations in Spain increased approximately 23% for the nine-month period ended
September 30, 2017 compared to the same period in 2016, while ready-mix concrete sales volumes remained flat over the same period.
Our domestic cement volume growth reflects favorable activity from the residential and the industrial-and-commercial sectors. The
residential sector benefited from favorable credit conditions and income perspectives, job creation, and pent-up housing demand. The
industrial-and-commercial sector was supported by offices, tourism and agricultural projects. Our operations in Spain represented
approximately 3% of our total net sales for the nine-month period ended September 30, 2017, in Mexican Peso terms, before
eliminations resulting from consolidation. Our cement export volumes from our operations in Spain, which represented approximately
49% of our Spain cement sales volumes for the nine-month period ended September 30, 2017, decreased approximately 20% for the
nine-month period ended September 30, 2017 compared to the same period in 2016. Of our total cement export volumes from our
operations in Spain during the nine-month period ended September 30, 2017, approximately 4% were to South, Central America and the
Caribbean, approximately 30% were to the United States, approximately 10% were to the United Kingdom, approximately 8% were to
the Rest of Europe and approximately 48% were to Asia, the Middle East, and Africa. Our average sales price of domestic cement of
our operations in Spain decreased approximately 4%, in Euro terms, for the nine-month period ended September 30, 2017 compared to
the same period in 2016, and our average sales price of ready-mix concrete increased approximately 6%, in Euro terms, over the same
period. For the nine-month period ended September 30, 2017, cement represented approximately 75%, ready-mix concrete
approximately 12% and our aggregates and other businesses approximately 13% of net sales from our operations in Spain before intra-
sector eliminations within the segment and before eliminations resulting from consolidation, as applicable.
As a result of a decrease in domestic cement average sales prices, partially offset by the increases in domestic cement sales
volumes and in ready-mix concrete average sales prices, net sales from our operations in Spain, in Euro terms, decreased approximately
1% for the nine-month period ended September 30, 2017 compared to the same period in 2016.
Rest of Europe
Our domestic cement sales volumes from our operations in the Rest of Europe increased approximately 7% for the nine-month
period ended September 30, 2017 compared to the same period in 2016, and ready-mix concrete sales volumes increased approximately
9% over the same period. The increases in domestic cement and ready-mix concrete sales volumes were primarily due to our operations
in Poland. Our cement export volumes from our operations in the Rest of Europe segment, which represented approximately 19% of our
Rest of Europe cement sales volumes for the period ended September 30, 2017, increased approximately 12% for the nine-month period
ended September 30, 2017 compared to the same period in 2016. Of our total cement export volumes from our operations in the Rest of
Europe during the nine-month period ended September 30, 2017, approximately 7% were to Germany, approximately 8% were to
Spain, approximately 7% were to South, Central America and the Caribbean, approximately 18% were to Asia, the Middle East and
Africa and the rest were within the same region. Our net sales from our operations in the Rest of Europe represented approximately 5%
of our total net sales for the period ended September 30, 2017, in Mexican Peso terms, before eliminations resulting from consolidation.
Our average sales price of domestic cement from our operations in the Rest of Europe increased approximately 4%, in Euro terms, for
the nine-month period ended September 30, 2017 compared to the same period in 2016, and our average sales price of ready-mix
concrete increased approximately 4%, in Euro terms, over the same period. For the period ended September 30, 2017, cement
represented approximately 55%, ready-mix concrete approximately 30% and our aggregates and other businesses approximately 15% of
net sales in Mexican Peso terms from our operations in the Rest of Europe before intra-sector eliminations within the segment and
before eliminations resulting from consolidation, as applicable.
As a result of the increases in domestic cement and ready-mix concrete sales volumes and average sales prices, net sales in the
Rest of Europe, in Euro terms, increased approximately 12% for the nine-month period ended September 30, 2017 compared to the
same period in 2016.
27

South, Central America and the Caribbean
For the nine-month period ended September 30, 2017, our operations in the SAC region consisted of our operations in Colombia,
which represents the most significant operations in this region, in addition to the Rest of SAC, which refers primarily to operations in
Costa Rica, Panama, Puerto Rico, the Dominican Republic, Nicaragua, Peru, Jamaica, Trinidad and Tobago and other countries in the
Caribbean, El Salvador, Guatemala, Brazil and small ready-mix concrete operations in Argentina. Some of these trading operations in
the Caribbean region consist of the resale of cement produced by our operations in Mexico. Our net sales from our operations in the
SAC region represented approximately 13% of our total net sales for the nine-month period ended September 30, 2017, in Mexican
Peso terms, before eliminations resulting from consolidation. As of September 30, 2017, our operations in the SAC region represented
approximately 10% of our total assets. Set forth below is a quantitative and qualitative analysis of the effects of the various factors
affecting our net sales for our main operations in the SAC region.
Colombia
Our domestic cement sales volumes from our operations in Colombia decreased approximately 5% for the nine-month period
ended September 30, 2017 compared to the same period in 2016, and ready-mix concrete sales volumes decreased approximately 15%
over the same period. The decreases in sales volumes were primarily due to a weak demand from industrial and commercial projects,
partially offset by high- and middle-income housing developments. Our net sales from our operations in Colombia represented
approximately 4% of our total net sales for the nine-month period ended September 30, 2017, in Mexican Peso terms, before
eliminations resulting from consolidation. Our average sales price of domestic cement from our operations in Colombia decreased
approximately 21%, in Colombian Peso terms, for the nine-month period ended September 30, 2017 compared to the same period in
2016, and our average sales price of ready-mix concrete decreased approximately 2%, in Colombian Peso terms, over the same period.
For the nine-month period ended September 30, 2017, cement represented approximately 50%, ready-mix concrete approximately 28%
and our aggregates and other businesses approximately 22% of our net sales from our operations in Colombia before intra-sector
eliminations within the segment and before eliminations resulting from consolidation, as applicable.
As a result of the decreases in domestic cement and ready-mix concrete sales volumes and average sales prices, net sales of our
operations in Colombia, in Colombian Peso terms, decreased approximately 18% for the nine-month period ended September 30, 2017
compared to the same period in 2016.
Rest of South, Central America and the Caribbean
Our domestic cement volumes from our operations in the Rest of SAC increased 24% for the nine-month period ended
September 30, 2017 compared to the same period in 2016, and ready-mix concrete sales volumes increased approximately 10% over the
same period. Our net sales from our operations in the Rest of SAC represented approximately 9% of our total net sales for the nine-
month period ended September 30, 2017, in Mexican Peso terms, before eliminations resulting from consolidation. Our cement export
volumes from our operations in the Rest of SAC segment, which represented approximately 12% of our Rest of SAC cement sales
volumes for the nine-month period ended September 30, 2017, increased approximately 7% for the nine-month period ended
September 30, 2017 compared to the same period in 2016. Of our total cement export volumes from our operations in the Rest of South,
Central America and the Caribbean during the nine-month period ended September 30, 2017, approximately 94% were to within the
same region and approximately 6% were to the Rest of Europe region. Our average sales price of domestic cement from our operations
in the Rest of SAC increased approximately 2% in Dollar terms, for the nine-month period ended September 30, 2017 compared to the
same period in 2016, and our average sales price of ready-mix concrete decreased approximately 2%, in Dollar terms, over the same
period. For the nine-month period ended September 30, 2017, cement represented approximately 76%, ready-mix concrete
approximately 14% and our other businesses approximately 10% of net sales from our operations in the Rest of SAC before intra-sector
eliminations within the segment and before eliminations resulting from consolidation, as applicable.
As a result of the increases in domestic cement sales volumes and average sales prices and ready-mix concrete sales volumes,
partially offset by the decrease in ready-mix concrete average sales prices, net sales of our operations in the Rest of SAC, in Dollar
terms, increased approximately 23% for the nine-month period ended September 30, 2017 compared to the same period in 2016.
Asia, Middle East and Africa
For the nine-month period ended September 30, 2017, our operations in the Asia, Middle East and Africa region consisted of our
operations in Egypt and the Philippines, which represent the most significant operations in this region, in addition to the Rest of Asia,
Middle East and Africa, which refers primarily to operations in the UAE and Israel. Our net sales from our operations in the Asia,
Middle East and Africa region represented approximately 9% of our total net sales for the nine-month period ended September 30,
2017, in Mexican Peso terms, before eliminations resulting from consolidation. As of September 30, 2017, our operations in the Asia,

Middle East and Africa region represented approximately 5% of our total assets. Set forth below is a quantitative and qualitative
analysis of the effects of the various factors affecting our net sales for our main operations in the Asia, Middle East and Africa region.
28

Egypt
Our domestic cement sales volumes from our operations in Egypt decreased approximately 14% for the nine-month period ended
September 30, 2017 compared to the same period in 2016, while ready-mix concrete sales volumes decreased approximately 3% over
the same period. The volume decline mainly reflects reduced consumer purchasing power resulting from the currency devaluation. Our
net sales from our operations in Egypt represented approximately 1% of our total net sales for the nine-month period ended
September 30, 2017, in Mexican Peso terms, before eliminations resulting from consolidation. Our average sales price of domestic
cement increased approximately 11%, in Egyptian Pound terms, for the nine-month period ended September 30, 2017 compared to the
same period in 2016, and our average sales price of ready-mix concrete decreased approximately 5%, in Egyptian Pound terms, over the
same period. For the nine-month period ended September 30, 2017, cement represented approximately 83%, ready-mix concrete
approximately 12% and our aggregates and other businesses approximately 5% of net sales in Mexican Peso terms from our operations
in Egypt before intra-sector eliminations within the segment and before eliminations resulting from consolidation, as applicable.
As a result of the decreases in domestic cement and ready-mix concrete sales volumes and ready-mix concrete average sales
prices, partially offset by the increase in domestic cement average sales prices, our net sales in Egypt, in Egyptian Pound terms,
decreased approximately 3% for the nine-month period ended September 30, 2017 compared to the same period in 2016.
The Philippines
Our domestic cement sales volumes from our operations in the Philippines decreased approximately 3% for the nine-month period
ended September 30, 2017 compared to the same period in 2016. The decrease in our domestic cement sales volumes resulted primarily
from a high base of comparison during the last year, with strong construction activity prior to the presidential elections. Our cement
export volumes from our operations in Philippines, which represented 2% of our Philippines cement sales volumes for the nine-month
period ended September 30, 2017, increased approximately 2% for the nine-month period ended September 30, 2017 compared to the
same period in 2016. Our net sales from our operations in the Philippines represented approximately 3% of our total net sales for the
nine-month period ended September 30, 2017, in Mexican Peso terms, before eliminations resulting from consolidation. Our average
sales price of domestic cement from our operations in the Philippines decreased approximately 10% in Philippine Peso terms, for the
nine-month period ended September 30, 2017 compared to the same period in 2016. For the nine-month period ended September 30,
2017, cement represented approximately 96%, ready-mix concrete approximately 1% and our other businesses approximately 3% of our
net sales in Mexican Peso terms from our operations in the Philippines before intra-sector eliminations within the segment and before
eliminations resulting from consolidation, as applicable.
As a result of the decreases in domestic cement sales volumes and average sales prices, net sales of our operations in the
Philippines, in Philippine Peso terms, decreased approximately 13% for the nine-month period ended September 30, 2017 compared to
the same period in 2016.
Rest of Asia, Middle East and Africa
Our domestic cement sales volumes from our operations in the Rest of Asia, Middle East and Africa increased approximately 56%
for the nine-month period ended September 30, 2017 compared to the same period in 2016, and ready-mix concrete sales volumes
increased approximately 5% over the same period. Our net sales from our operations in our Rest of Asia, Middle East and Africa
segment represented approximately 5% of our total net sales for the nine-month period ended September 30, 2017, in Mexican Peso
terms, before eliminations resulting from consolidation. Our average sales price of domestic cement increased approximately 3%, in
Dollar terms, for the nine-month period ended September 30, 2017 compared to the same period in 2016, and the average sales price of
ready-mix concrete increased approximately 4%, in Dollar terms, over the same period. For the nine-month period ended September 30,
2017, cement represented approximately 5%, ready-mix concrete approximately 66% and our other businesses approximately 29% of
net sales from our operations in the Rest of Asia, Middle East and Africa before intra-sector eliminations within the segment and before
eliminations resulting from consolidation, as applicable.
As a result of the increase in domestic cement and ready-mix concrete sales volumes and average sales prices, net sales from our
operations in the Rest of Asia, Middle East and Africa, in Dollar terms, increased approximately 8% for the nine-month period ended
September 30, 2017 compared to the same period in 2016.
29

Others
Our Others segment refers to: (i) cement trade maritime operations, (ii) our information technology solutions business (Neoris
N.V.), (iii) CEMEX, S.A.B. de C.V. and other corporate entities and (iv) other minor subsidiaries with different lines of business. Net
sales from our Others segment increased approximately 11% before intra-sector eliminations within the segment and before
eliminations resulting from consolidation, as applicable, for the nine-month period ended September 30, 2017 compared to the same
period in 2016, in Dollar terms. The increase resulted primarily from an increase in the worldwide cement volume from our trading
operations. For the nine-month period ended September 30, 2017, our information technology solutions company represented
approximately 30% and our trading operations represented approximately 38% of our net sales in our Others segment, in Dollar terms.
Cost of Sales. Our cost of sales, including depreciation, increased approximately 5% from Ps120,221 million for the nine-month
period ended September 30, 2016 to Ps126,668 million for the same period in 2017. As a percentage of net sales, cost of sales increased
from 65% for the nine-month period ended September 30, 2016 to 66% for the same period in 2017. The increase in cost of sales as a
percentage of net sales was mainly driven by higher energy costs. Our cost of sales includes freight expenses of raw materials used in
our producing plants.
Gross Profit. For the reasons explained above, our gross profit remained flat at approximately Ps66.0 billion for the nine-month
periods ended September 30, 2016 and 2017. As a percentage of net sales, gross profit decreased from approximately 35% for the nine-
month period ended September 30, 2016 to 34% for the same period in 2017. In addition, our gross profit may not be directly
comparable to those of other entities that include all their freight expenses in cost of sales. As described above, we include freight
expenses of finished products from our producing plants to our points of sale and from our points of sale to our customers’ locations
within distribution expenses, which in aggregate represented costs of approximately Ps17,589 million for the nine-month period ended
September 30, 2016 and approximately Ps18,837 million for the same period in 2017. As a percentage of net sales, distribution and
logistics expenses increased from approximately 9% for the nine-month period ended September 30, 2016 to 10% for the same period
in 2017.
Operating expenses. Our operating expenses, which are represented by administrative, selling and distribution and logistics
expenses, increased approximately 4%, from approximately Ps39,704 million for the nine-month period ended September 30, 2016 to
approximately Ps41,212 million for the same period in 2017. The increase was mainly driven by higher distribution expenses. As a
percentage of net sales, operating expenses remained flat at approximately 21% for the nine-month periods ended September 30, 2016
and 2017. Our operating expenses include expenses related to personnel, equipment and services involved in sales activities and storage
of product at points of sale, which are included as part of the administrative and selling expenses, as well as freight expenses of finished
products between plants and points of sale and freight expenses between points of sale and the customers’ facilities, which are included
as part of the “Distribution expenses” line item. For the nine-month periods ended September 30, 2016 and 2017, selling expenses
included as part of the “Administrative and selling expenses” line item amounted to approximately Ps4,981 million and
Ps4,846 million, respectively. As discussed above, we include freight expenses of finished products from our producing plants to our
points of sale and from our points of sale to our customers’ locations within distribution expenses, which in aggregate represented costs
of approximately Ps17,589 million for the nine-month period ended September 30, 2016 and approximately Ps18,837 million for the
same period in 2017. As a percentage of net sales, distribution and logistics expenses increased from approximately 9% for the nine-
month period ended September 30, 2016 to 10% for the same period in 2017.
Operating Earnings Before Other Income (Expenses), Net
For the reasons mentioned above, our operating earnings before other income (expenses), net, decreased approximately 6% from
approximately Ps26,363 million for the nine-month period ended September 30, 2016 to approximately Ps24,715 million for the same
period. As a percentage of net sales, operating earnings before other income (expenses), net, decreased from approximately 14% for the
nine-month period ended September 30, 2016 to 13% for the same period in 2017. Additionally, set forth below is a quantitative and
qualitative analysis of the effects of the various factors affecting our operating earnings before other income (expenses), net, on a
geographic segment basis.
Mexico
Our operating earnings before other income (expenses), net, from our operations in Mexico increased approximately 15%, in
Mexican Peso terms, from operating earnings before other expenses, net, of approximately Ps12,479 million for the nine-month period
ending September 30, 2016 to operating earnings before other expenses, net, of approximately Ps14,355 million for the same period in
2017. The increase resulted primarily from an increase in our Mexican operations net sales as well as higher contributions in our
products.
30

United States
Our operating earnings before other income (expenses), net, from our operations in the United States increased 17% in Dollar
terms. The increase in operating earnings before other expenses, net, resulted primarily from our cost reduction effort during the nine-
month period ended September 30, 2017 compared to the same period in 2016.
Europe
United Kingdom. Our operating earnings before other income (expenses), net, from our operations in the United Kingdom, in
Pound terms, increased approximately 27% for the nine-month period ended September 30, 2017 compared to the same period in 2016.
The increase in our operating earnings before other income (expenses), net, from our operations in the United Kingdom resulted
primarily from our cost reduction initiatives despite a decrease in our net sales.
Germany. Our operating earnings before other income (expenses), net, from our operations in Germany increased significantly in
Euro terms. The increase resulted primarily from an increase in net sales due to higher sales volumes during the nine-month period
ended September 30, 2017 compared to the same period in 2016.
France. Our operating earnings before other income (expenses), net, from our operations in France increased approximately 85%
in Euro terms. The increase in our operating earnings before other expenses, net, in France resulted primarily from an increase in net
sales due to higher sales volumes and averages sales prices and improved operating efficiencies during the nine-month period ended
September 30, 2017 compared to the same period in 2016.
Spain. Our operating earnings before other income (expenses), net, from our operations in Spain decreased significantly in Euro
terms. The decrease in the operating earnings before other income (expenses), net, resulted primarily from a decrease in net sales.
Rest of Europe. Our operating earnings before other income (expenses), net, from our operations in the Rest of Europe increased
approximately 24% in Dollar terms. The increase resulted primarily from our improved operating efficiencies and increases in our net
sales in our Rest of Europe region.
South, Central America and the Caribbean
Colombia. Our operating earnings before other income (expenses), net, from our operations in Colombia decreased approximately
61% in Colombian Peso terms. The decrease resulted primarily from decreases in net sales resulted primarily from a decrease in sales
volumes.
Rest of South, Central America and the Caribbean. Our operating earnings before other income (expenses), net, from our
operations in the Rest of SAC increased approximately 8% in Dollar terms. The increase resulted primarily from an increase in net
sales.
Asia, Middle East and Africa
Egypt. Our operating earnings before other income (expenses), net, from our operations in Egypt decreased 60% in Egyptian
Pound terms. The decrease resulted primarily from a decrease in net sales as well as higher energy costs.
The Philippines. Our operating earnings before other income (expenses), net, from our operations in the Philippines decreased
approximately 57% in Philippine Peso terms. The decrease resulted primarily from a decrease in net sales volumes.
Rest of Asia, Middle East and Africa. Our operating earnings before other income (expenses), net, from our operations in the Rest
of Asia, Middle East and Africa increased approximately 6%, in Dollar terms, for the nine-month period ended September 30, 2017
compared to the same period in 2016. The increase resulted primarily from an increase in our net sales.
Others. Our operating loss before other income (expenses), net, in our Others segment decreased by approximately 12%, in
Mexican Peso terms, from a loss of approximately Ps2,760 in 2016 to a loss of approximately Ps2,417 in 2017 in Peso terms, primarily
explained due to increase in our worldwide cement, clinker and slag trading operations.
Other Income (Expenses), Net. Our other income (expenses), net, increased significantly in Mexican Peso terms, from an expense
of Ps1,507 million for the period ended September 30, 2016 to an income of Ps1,377 million for the same period in 2017. The increase
resulted primarily from an increase in our results from the sale of assets and others, net, during the nine-month period ended
September 30, 2017 compared to the same period in 2016. As a percentage of net sales, Other income (expenses), net, increased from
31

an expense of approximately 1% for the nine-month period ended September 30, 2016 to an income of 1% for the same period in 2017.
See notes 3A and 3B to our unaudited condensed financial statements for the nine-month periods ended September 30, 2016 and 2017
included herein. The most significant items included under this caption for the nine-month periods ended September 30, 2016 and 2017
are as follows:
For the Nine-Month Periods Ended
September 30,
2016 2017
(in millions of Mexican Pesos)
Restructuring costs Ps (506) Ps (446)
Impairment losses (797) (571)
Charitable contributions (79) (100)
Results from the sale of assets and others, net (125) 2,494
Ps (1,507) Ps 1,377
Financial Items
Pursuant to IFRS, financial items include:
• financial or interest expense on borrowed funds;
• financial income on cash and cash equivalents;
• changes in the fair value resulting from the valuation of financial instruments, including derivative instruments and
marketable securities;
• foreign exchange gains or losses associated with monetary assets and liabilities denominated in foreign currencies; and
• accretion result from assets and liabilities and others.
For the Nine-Month Periods Ended
September 30,
2016 2017
(in millions of Mexican Pesos)
Financial items:
Financial expense Ps (16,558) Ps (15,128)
Other financial income, net:
Financial income 319 251
Results from financial instruments 395 3,802
Foreign exchange results 3,649 (1,133)
Effects of net present value on assets and liabilities and
others, net (781) (767)
Ps (12,976) Ps (12,975)
Our financial items for the nine-month period ended September 30, 2017, which comprises financial expense and other financial
income, net, as reported in our statements of operations, remained flat for the nine-month period ended September 30, 2016 and in
2017. The components of the change are shown above.
Our financial expense decreased approximately 9%, from Ps16,558 million for the nine-month period ended September 30, 2016
to Ps15,128 million for the same period in 2017, primarily attributable to a decrease in our financial debt. See note 12A to our unaudited
condensed consolidated financial statements for the nine-month periods ended September 30, 2016 and 2017 included herein.
Our other financial income, net, decreased approximately 40%, from Ps3,582 million for the nine-month period ended
September 30, 2016 to Ps2,153 million for the same period in 2017. Our financial income, decreased approximately 21%, from
Ps319 million for the nine-month period ended September 30, 2016 to Ps251million for the same period in 2017. Our results from
financial instruments increased from a gain of Ps395 million for the nine-month period ended September 30, 2016 to a gain of
Ps3,802 million for the same period in 2017, primarily attributable to the sale of our direct participation in common stock of GCC (see
note 10 to our unaudited condensed consolidated financial statements for the nine-month periods ended September 30, 2016 and 2017,
included herein). Our foreign exchange results decreased from a gain of approximately Ps3,649 million for the nine-month period ended
September 30, 2016 to a loss of approximately Ps1,133 million for the same period in 2017. The decrease was primarily attributable to
the fluctuation of the Mexican Peso against the U.S. Dollar. The accretion expense, which represents the effects on our net assets and

liabilities recognized at amortized cost due to the passage of time, decreased by approximately 2% from an expense of Ps781 million for
the nine-month period ended September 30, 2016 to Ps767 million for the same period in 2017.
32

Derivative Financial Instruments. For the nine-month periods ended September 30, 2016 and 2017, our derivative financial
instruments that had a potential impact on our other financial income, net, consisted of interest rate swaps, equity forwards on third-
party shares contracts, options on CEMEX, S.A.B. de C.V.’s own shares, foreign exchange forward contracts and derivatives related to
energy projects, as discussed in note 12C to our unaudited condensed consolidated financial statements for the nine-month periods
ended September 30, 2016 and 2017 included herein.
For the nine-month period ended September 30, 2017, our gain from our derivative financial instruments decreased compared to
the same period in 2016. See “Liquidity and Capital Resources—Quantitative and Qualitative Market Disclosure—Our Financial
Instruments” herein.
Income Taxes. Our income tax effect in the statement of operations, which is primarily comprised of current income taxes plus
deferred income taxes, changed significantly from an expense of Ps2,251 million for the nine-month period ended September 30, 2016
to an income of Ps1,311 million for the same period in 2017. The change in effective tax rate for the nine month period ended
September 30, 2017 was caused mainly by the recognition of deferred tax asset derived from tax loss carryforwards in the United States
that resulted in a tax benefit to us for the period.
Net Income from continuing operations. For the reasons described above, our net income from continuing operations for the nine-
month period ended September 30, 2017 increased 39% from a net income from continuing operations of Ps10,182 million for the nine-
month period ended September 30, 2016 to a net income from continuing operations of Ps14,183 million for the same period in 2017.
As a percentage of net sales, net income from continuing operations represented 5% for the nine-month period ended September 30,
2016 and 8% for the same period in 2017.
Discontinued operations. For the nine-month periods ended September 30, 2016 and 2017, our discontinued operations included
in our unaudited condensed consolidated statements of operations amounted, net of tax, to an income of Ps555 million and an income of
Ps3,503 million, respectively. As a percentage of net sales, discontinued operations, net of tax, represented less than 1% for the nine-
month period ended September 30, 2016 and 2% for the same period in 2017. See note 3A to our unaudited condensed consolidated
financial statements for the nine-month periods ended September 30, 2016 and 2017 included herein.
Consolidated Net Income. For the reasons described above, our consolidated net income (before deducting the portion allocable to
non-controlling interest) for the nine-month period ended September 30, 2017 increased 71%, from a consolidated net income of
approximately Ps10,737 million for the nine-month period ended September 30, 2016 to a consolidated net income of approximately
Ps18,316 million for the same period in 2017. As a percentage of net sales, consolidated net income represented 6% for the nine-month
period ended September 30, 2016 and 10% for the same period in 2017.
Non-controlling Interest Net Income. Changes in non-controlling interest net income in any period reflect changes in the
percentage of the stock of our subsidiaries held by non-associated third parties as of the end of each month during the relevant period
and the consolidated net income attributable to those subsidiaries. Non-controlling interest net income increased approximately 10%,
from a gain of Ps987 million for the nine-month period ended September 30, 2016 to a gain of Ps1,087 million for the same period in
2017, primarily attributable to an increase in the net income of the consolidated entities in which others have a non-controlling interest.
Controlling Interest Net Income. Controlling interest net income represents the difference between our consolidated net income
and non-controlling interest net income, which is the portion of our consolidated net income attributable to those of our subsidiaries in
which non-associated third parties hold interests. For the reasons described above, our controlling interest net income increased 77%
from a net income of approximately Ps9,750 million for the nine-month period ended September 30, 2016 to a controlling interest net
income of approximately Ps17,229 million for the same period in 2017.
Liquidity and Capital Resources
Operating Activities
We have satisfied our operating liquidity needs primarily through operations of our subsidiaries and expect to continue to do so for
both the short-term and long-term. Although cash flow from our operations has historically met our overall liquidity needs for
operations, servicing debt and funding capital expenditures and acquisitions, our subsidiaries are exposed to risks from changes in
foreign currency exchange rates, price and currency controls, interest rates, inflation, governmental spending, social instability and
other political, regulatory, economic and/or social developments in the countries in which we operate, any one of which may materially
decrease our net income and decrease cash flows operations. Consequently, in order to meet our liquidity needs, we also
33

rely on cost-cutting and operating improvements to optimize capacity utilization and maximize profitability, as well as borrowing under
credit facilities, proceeds of debt and equity offerings, and proceeds from asset sales. Our consolidated net cash flows provided by
operating activities from continuing operations before interest, coupons on perpetual debentures (as defined in the 2016 Annual Report)
and income taxes paid in cash decreased approximately 28% from Ps40,969 million for the nine-month period ended September 30,
2016 to Ps29,690 million for the same period in 2017. See our statement of cash flows for the nine-month periods ended September 30,
2016 and 2017 included herein.
Sources and Uses of Cash
Our review of sources and uses of resources below refers to nominal amounts included in our statement of cash flows for the nine-
month periods ended September 30, 2016 and 2017.
Our primary sources and uses of cash during the nine-month periods ended September 30, 2016 and 2017 were as follows:
For the Nine-Month Periods Ended September 30,
2016 2017
(in millions of Mexican Pesos)
Operating Activities
Consolidated net income 10,737 18,316
Discontinued operations 555 3,503
Net income from continuing operations 10,182 14,813
Non-cash items 27,237 19,096
Changes in working capital, excluding income taxes 3,500 (4,219)
Net cash flows provided by operating activities from
continuing operations before interest, coupons on
perpetual debentures and income taxes 40,919 29,690
Financial expense and coupons on perpetual debentures
and income taxes paid in cash (17,952) (16,439)
Net cash flows provided by operating activities of
continuing operations 22,967 13,251
Net cash flows provided by operating activities of
discontinued operations 873 144
Net cash flows provided by operating activities 23,840 13,395
Investing Activities
Property, machinery and equipment, net (6,559) (5,300)
Disposal of subsidiaries and associates, net 1,424 23,978
Other long-term assets and others, net (2,165) (1,032)
Net cash flows (used) provided by investing
activities of continuing operations (7,300) 17,646
Net cash flows used in investing activities of
discontinued operations (14) —
Net cash flows (used) provided by investing
activities (7,314) 17,646
Financing Activities
Sale (acquisition) of non-controlling interest in
subsidiaries 9,777 (55)
Derivative financial instruments 232 596
Repayment of debt, net (31,577) (33,925)
Securitization of trade receivables 42 54
Non-current liabilities, net (1,599) (2,149)
Net cash flows used in financing activities (23,125) (35,479)
Decrease in cash and cash equivalents of continuing
operations (7,458) (4,582)
Increase in cash and cash equivalents of discontinued
operations 859 144
Cash conversion effects, net 2,827 1,025
Cash and cash equivalents at the beginning of the period 15,280 11,616
Cash and cash equivalents at the end of the period 11,508 8,203

September 30, 2017. During the nine-month period ended September 30, 2017, excluding the positive foreign currency effect of
our initial balances of cash and cash equivalents generated during the period of approximately Ps1,025 million, there was a decrease in
cash and cash equivalents of continuing operations of approximately Ps4,582 million. This decrease was a result of our net cash flows
used in financing activities of approximately Ps35,479 million, partially offset by our net cash flows provided by operating activities of
continuing operations which, after financial expense and coupons on Perpetual Debentures and income taxes paid in cash of
approximately Ps16,439 million, amounted to approximately Ps13,251 million and by our net cash flows provided by investing
activities of continuing operations of approximately Ps17,646 million.
34

For the nine-month period ended September 30, 2017, our net cash flows provided by operating activities included cash flows
used in working capital of approximately Ps4,219 million, which was primarily comprised of trade payables and other accounts payable
and accrued expenses for an aggregate amount of approximately Ps7,164 million partially offset by other accounts receivable and other
assets, trade receivable, net and inventories, for an aggregate amount of approximately Ps2,945 million.
During the nine-month period ended September 30, 2017, our net cash flows provided by (i) operating activities of continuing
operations after financial expense and coupons on Perpetual Debentures and income taxes paid in cash of approximately
Ps13,251 million and (ii) our net cash flows used in the investing activities of continuing operations of approximately Ps17,646 million,
which include disposal in subsidiaries and associates, net and other long-term assets and others, net, for an aggregate amount of
approximately Ps24,065 million, partially offset by property, machinery and equipment, net, and intangible assets and other deferred
charges for an aggregate amount of approximately Ps6,419 million, were mainly disbursed in connection with our net cash flows used
in financing activities of approximately Ps35,479 million, which include repayment of our debt, net, non-current liabilities, net and sale
of non-controlling interest in subsidiaries for an aggregate amount of approximately Ps36,129 million, partially offset by derivative
financial instruments and securitization of trade receivables, for an aggregate amount of approximately Ps650 million.
September 30, 2016. During the nine-month period ended September 30, 2016, excluding the positive foreign currency effect of
our initial balances of cash and cash equivalents generated during the period of approximately Ps2,827 million, there was a decrease in
cash and cash equivalents of continuing operations of approximately Ps7,458 million. This decrease was the result of our net cash flows
used in financing activities of approximately Ps23,125 million and our net cash flows used in investing activities of continuing
operations of approximately Ps7,300 million, partially offset by our net cash flows provided by operating activities of continuing
operations, which, after financial expense and coupons on Perpetual Debentures and income taxes paid in cash of approximately
Ps17,952 million, amounted to approximately Ps22,967 million.
For the nine-month period ended September 30, 2016, our net cash flows provided by operating activities included cash flows
generated in working capital of approximately Ps3,500 million, which was primarily comprised of cash flows originated by trade
payables and other accounts payable and accrued expenses, for an aggregate amount of approximately Ps12,462 million, partially offset
by cash disbursed by trade receivables, net, other accounts receivable and other assets and inventories for an aggregate amount of
approximately Ps8,962 million.
During the nine-month period ended September 30, 2016, our net cash flows provided by operating activities of continuing
operations after financial expense and coupons on Perpetual Debentures and income taxes paid in cash of approximately
Ps22,967 million were mainly disbursed in connection with (i) our net cash flows used in financing activities of approximately
Ps23,125 million, which include repayment of our debt, net and non-current liabilities for an aggregate amount of approximately
Ps33,176 million, partially offset by sale of non-controlling interest in subsidiaries, derivative financial instruments and securitization of
trade receivables for an aggregate amount of approximately Ps10,051 million and (ii) our net cash flows used in the investing activities
of continuing operations of approximately Ps7,300 million, which include investing in property, machinery and equipment, net, other
long-term assets and others, net and intangible assets and other deferred charges for an aggregate amount of approximately
Ps8,724 million, partially offset by disposal of subsidiaries and associates, net for an amount of approximately Ps1,424 million.
As of September 30, 2017, we had the following uncommitted lines of credit, at annual interest rates ranging between
approximately 1.9% and 9.9%, depending on the negotiated currency:
Lines of Credit Available
(in millions of Mexican Pesos)
Other lines of credit in foreign subsidiaries Ps 9,033 Ps 6,797
Other lines of credit from banks Ps 6,229 Ps 5,262
Total Ps 15,262 Ps 12,059
35

Capital Expenditures
Our capital expenditures incurred for the nine-month periods ended September 30, 2016 and 2017, and our expected capital
expenditures for the remaining three-month periods ended December 31, 2017, which include an allocation to 2017 of a portion of our
total future committed amount, are as follows:
Actual For the Nine-Month Periods
Ended September 30,
Estimated For the
Remaining Three-
Month Period
Ended December 31,
20172016 2017
(in millions of U.S. Dollars)
Mexico 38 57 66
United States 123 110 82
Europe
United Kingdom 11 14 25
Germany 15 13 0
France 12 11 9
Spain 12 8 5
Rest of Europe 16 14 31
South, Central America and the Caribbean
Colombia 130 50 46
Rest of South, Central America and the
Caribbean 18 21 52
Asia, Middle East and Africa
Philippines 21 18 23
Egypt 12 10 13
Rest of Asia, Middle East and Africa 9 13 8
Others 8 5 22
Continuing operations 425 344 383
Discontinued operations — — 3
Total consolidated 425 344 386
Of which
Expansion capital expenditures 177 81 131
Base capital expenditures 248 263 255
As of the date of this report, plans for capital expenditures for the remaining three-month period ended December 31, 2017 are
expected to be U.S.$386 million. Pursuant to the 2017 Credit Agreement, we are prohibited from making aggregate annual capital
expenditures in excess of U.S.$1 billion in any financial year (excluding certain capital expenditures, joint venture investments and
acquisitions by each of CEMEX Latam and CHP and their respective subsidiaries and those funded by Relevant Proceeds (as defined in
the 2017 Credit Agreement)), which capital expenditures, joint venture investments and acquisitions at any time then incurred are
subject to a separate aggregate limit of (a) U.S.$500 million (or its equivalent) for CEMEX Latam and its subsidiaries and (b) U.S.
$500 million (or its equivalent) for CHP and its subsidiaries. In addition, the amounts of which we and our subsidiaries are allowed for
permitted acquisitions and investments in joint ventures cannot exceed certain thresholds as set out in the 2017 Credit Agreement.
Our Indebtedness
As of September 30, 2017, we reported approximately Ps214,004 million (U.S.$11,726 million) (principal amount
Ps216,121 million (U.S.$11,842 million), excluding deferred issuance costs) of total debt plus other financial obligations, which does
not include approximately Ps8,140 million (U.S.$446 million) of Perpetual Debentures. See note 15B to our unaudited condensed
consolidated financial statements for the nine-month periods ended September 30, 2016 and 2017 included herein. Of our total debt plus
other financial obligations, approximately 12% were short-term (including current maturities of long-term debt) and 88% were long-
term. As of September 30, 2017, approximately 69% of our total debt plus other financial obligations was Dollar-denominated,
approximately 22% was Euro-denominated, approximately 5% was British Pounds-denominated, approximately 2% was Mexican Peso-
denominated and 2% were denominated in other currencies.
On July 19, 2017, CEMEX, S.A.B. de C.V. and certain of its subsidiaries entered into the 2017 Credit Agreement for
approximately U.S.$4 billion (in aggregate), the proceeds of which were used to refinance indebtedness incurred under a then-existing
credit agreement and the balance, if drawn, shall be for general corporate purposes. The indebtedness incurred under the 2017 Credit

Agreement ranks equally in right of payment with certain other of our existing and future indebtedness pursuant to the terms of the
Intercreditor Agreement.
Total commitments initially available under the 2017 Credit Agreement included (i) approximately €741 million (approximately
U.S.$875 million or approximately Ps15,967 million), (ii) approximately £344 million (approximately U.S.$460 million or
approximately Ps8,402) and (iii) approximately U.S.$2,746 million (Ps50,123 million), out of which approximately U.S.$1,135 million
(Ps20,714 million) were in the revolving credit facility tranche of the 2017 Credit Agreement. As of September 30,
36

2017, the 2017 Credit Agreement had an amortization profile, considering all commitments of approximately U.S.$4 billion under the
2017 Credit Agreement, of approximately U.S.$589 million in 2020, U.S.$1,179 million in 2021 and U.S.$2,314 million in 2022. See
note 12A to our unaudited condensed consolidated financial statements included herein.
CEMEX, S.A.B. de C.V. and certain of its subsidiaries have pledged the Collateral and all proceeds of the Collateral, to secure our
payment obligations under the 2017 Credit Agreement, the Senior Secured Notes and under several other of our financing
arrangements. These subsidiaries whose shares were pledged or transferred as part of the Collateral collectively own, directly or
indirectly, substantially all our operations worldwide. See “Risk Factors—We pledged the capital stock of some of our subsidiaries that
represent substantially all of our business as collateral to secure our payment obligations under the 2017 Credit Agreement, the
indentures governing our Senior Secured Notes and other financing arrangements.”
As of September 30, 2017, we reported an aggregate amount of outstanding debt of approximately Ps46,145 million (U.S.$2,529
million) under the 2017 Credit Agreement. As of September 30, 2017, we had full availability under the U.S.$1,135 million revolving
credit facility tranche of the 2017 Credit Agreement, as well as full availability under the U.S.$377 million term loan. If we are unable
to comply with our upcoming principal maturities under our indebtedness, or are not able to refinance or extend maturities of our
indebtedness, our debt could be accelerated. Acceleration of our debt would have a material adverse effect on our financial condition.
See “Risk Factors—We have a substantial amount of debt and other financial obligations maturing in the next several years. If we are
unable to secure refinancing on favorable terms or at all, we may not be able to comply with our upcoming payment obligations. Our
ability to comply with our principal maturities and financial covenants may depend on us making asset sales, and there is no assurance
that we will be able to execute such sales on terms favorable to us or at all.”
For a discussion of restrictions and covenants under the 2017 Credit Agreement, see “Risk Factors—The 2017 Credit Agreement
contains several restrictions and covenants. Our failure to comply with such restrictions and covenants could have a material adverse
effect on our business and financial conditions.”
For a description of the Senior Secured Notes, see “Management’s Discussion and Analysis of Financial Conditions and
Results of Operations—Summary of Material Contractual Obligations and Commercial Commitments—Senior Secured Notes.”
Some of our subsidiaries and special purpose vehicles (“SPVs”) have issued or provided guarantees of certain of our indebtedness,
as indicated in the table below.
Senior Secured
Notes
2017 Credit
Agreement
Perpetual
Debentures CBs(1)
U.S.$6,958 million
(Ps126,991
million) (principal
amount
U.S.$7,014
million (Ps128,004
million))
U.S.$2,529
million
(Ps46,145
million) (principal
amount U.S.$2,570
million (Ps46,898
million))
U.S.$446
million
(Ps8,140
million)
U.S.$37
million
(Ps678
million)
Amount outstanding as of September 30,
2017
CEMEX, S.A.B. de C.V. ✓ ✓ ✓ ✓CEMEX México, S.A. de C.V. ✓ ✓ ✓ ✓CEMEX Concretos, S.A. de C.V. ✓ ✓ ✓Empresas Tolteca de México, S.A. de C.V. ✓ ✓New Sunward Holding B.V. ✓ ✓ ✓CEMEX España, S.A. ✓ ✓Cemex Asia B.V. ✓ ✓CEMEX Corp. ✓ ✓CEMEX Finance LLC ✓ ✓Cemex Egyptian Investments B.V. ✓ ✓CEMEX France Gestion (S.A.S) ✓ ✓Cemex Research Group AG ✓ ✓CEMEX UK ✓ ✓
(1) Includes long-term secured promissory notes previously issued by us and placed in the Mexican capital markets (certificados
bursátiles, or “CBs”).

In addition, as of September 30, 2017, (i) CEMEX Materials LLC is a borrower of Ps2,847 million (U.S.$156 million) (principal
amount Ps2,736 million (U.S.$150 million)) under an indenture, which is guaranteed by CEMEX Corp.; and (ii) several of our other
operating subsidiaries were borrowers under debt facilities and other financial obligations aggregating Ps37,343 million (U.S.$2,046
million).
37

Most of our outstanding indebtedness has been incurred to finance our acquisitions and to finance our capital expenditure
programs. Historically, we have addressed our liquidity needs (including funds required to make scheduled principal and interest
payments, refinance debt, and fund working capital and planned capital expenditures) with operating cash flow, securitizations,
borrowings under credit facilities, proceeds of debt and equity offerings and proceeds from asset sales.
Relevant Transactions Related to Our Indebtedness During the Nine-Month Period Ended September 30, 2017
As of September 30, 2017, we had approximately Ps214,004 million (U.S.$11,726 million) (principal amount Ps216,121 million
(U.S.$11,842 million), excluding deferred issuance costs) of total debt plus other financial obligations in our balance sheet, which does
not include approximately Ps8,140 million (U.S.$446 million) of Perpetual Debentures. As of September 30, 2017, approximately 69%
of our total debt plus other financial obligations was Dollar-denominated, approximately 22% was Euro-denominated, approximately
5% were British Pounds-denominated, approximately 2% was Mexican Peso-denominated and 2% were denominated in other
currencies. Our financing activities through December 31, 2016 are described in the 2016 Annual Report. The following is a description
of our most important transactions related to our indebtedness for the nine-month period ended September 30, 2017:
• In February 2017, CHP announced that it had entered into a senior unsecured peso term loan facility agreement with BDO
Unibank for a Philippine Peso denominated amount equal to approximately U.S.$280 million, to refinance a majority of
CHP’s outstanding long-term loan with NSH. The term loan provided by BDO Unibank has a tenor of seven years and
consists of a fixed rate tranche and a floating rate tranche. CHP drew the full amount of the term loan during the first quarter
of 2017 to repay a portion of its existing indebtedness.
• In March 2017, we repurchased U.S.$89.9 million aggregate principal amount of the December 2019 U.S. Dollar Notes and
U.S.$385.1 million aggregate principal amount of the January 2021 U.S. Dollar Notes (as defined below) through a cash
tender offer and, during the first quarter of 2017, we conducted an open market repurchase of U.S.$9 million aggregate
principal amount of the Senior Secured Notes (all of which have been canceled).
• In the first quarter of 2017, we made drawdowns and repayments under the revolving tranche of our then-existing credit
agreement resulting in a reduction of Ps11,686 million (U.S.$564 million) of outstanding indebtedness under the revolving
tranche of the then-existing credit agreement, which was financed primarily from the proceeds of our asset divestitures.
• On June 19, 2017, certain institutional holders of the March 2018 Optional Convertible Subordinated U.S. Dollar Notes
agreed to convert approximately U.S.$325 million aggregate principal amount of those notes in exchange for 43 million
ADSs. CEMEX did not pay any cash to those noteholders in connection with the conversions. Following the conversions,
approximately U.S.$365 million aggregate principal amount of the March 2018 Optional Convertible Subordinated
U.S. Dollar Notes remains outstanding.
• On July 19, 2017, CEMEX, S.A.B. de C.V. and certain of its subsidiaries entered into the 2017 Credit Agreement for
approximately U.S.$4 billion (in aggregate), the proceeds of which were used to refinance indebtedness incurred under a
then-existing credit agreement and the balance, if drawn, shall be used for general corporate purposes. The indebtedness
incurred under the 2017 Credit Agreement ranks equally in right of payment with certain of our other existing and future
indebtedness, pursuant to the terms of the Intercreditor Agreement.
• On May 1, 2017, CEMEX Finance issued an irrevocable notice of redemption with respect to the April 2021 Euro Notes,
pursuant to which it redeemed the remaining €400 million aggregate principal amount of the April 2021 Euro Notes on May
31, 2017.
• On September 25, 2017, CEMEX, S.A.B. de C.V. completed the purchase of U.S.$700,618,000 aggregate principal amount
of the October 2022 U.S. Dollar Notes through the September 2017 Tender Offer. All such October 2022 U.S. Dollar Notes
were immediately canceled. Following the settlement of the September 2017 Tender Offer, U.S.$343,478,468 aggregate
principal of the October 2022 U.S. Dollar Notes remained outstanding and was redeemed by CEMEX Finance on
October 12, 2017.
38

Our Other Financial Obligations
Other financial obligations in the consolidated balance sheet as of December 31, 2016 and September 30, 2017 are detailed as
follows:
September 30, 2017 December 31, 2016
Short-
term
Long-
term Total
Short-
term
Long-
term Total
March 2020 Optional Convertible Subordinated U.S. Dollar Notes Ps — 9,247 9,247 — 10,417 10,417
March 2018 Optional Convertible Subordinated U.S. Dollar Notes 6,535 — 6,535 — 13,575 13,575
November 2019 Mandatory Convertible Mexican Peso Notes 311 455 766 278 689 967
Liabilities secured with accounts receivable 10,454 — 10,454 11,095 — 11,095
Capital leases 525 2,565 3,090 285 1,291 1,576
Ps 17,825 12,267 30,092 11,658 25,972 37,630
As mentioned in note 2F to our audited consolidated financial statements included in the 2016 Annual Report, financial
instruments convertible into CEMEX, S.A.B. de C.V.’s CPOs and/or ADSs (each as defined in the 2016 Annual Report) contain
components of both liability and equity, which are recognized differently depending on whether the instrument is mandatorily
convertible, or is optionally convertible by election of the note holders, as well as the currency in which the instrument is denominated.
March 2020 Optional Convertible Subordinated U.S. Dollar Notes
During 2015, CEMEX, S.A.B. de C.V. issued U.S.$521 million (Ps 8,977 million) aggregate principal amount of its 3.72%
Convertible Subordinated Notes due March 2020 (the “March 2020 Optional Convertible Subordinated U.S. Dollar Notes”). The March
2020 Optional Convertible Subordinated U.S. Dollar Notes were issued: (a) U.S.$200 million as a result of the exercise on March 13,
2015 of U.S.$200 million notional amount of CCUs (as defined in the 2016 Annual Report), and (b) U.S.$321 million as a result of
private exchanges with certain institutional investors on May 28, 2015, which together with early conversions, resulted in a total of
approximately U.S.$626 million aggregate principal amount of the 3.250% Convertible Subordinated Notes due 2016 (the “March 2016
Optional Convertible Subordinated U.S. Dollar Notes”) held by such investors being paid and the issuance and delivery by CEMEX of
an estimated 42 million ADSs, which included a number of additional ADSs issued to the holders as non-cash inducement premiums.
The March 2020 Optional Convertible Subordinated U.S. Dollar Notes, which are subordinated to all of CEMEX’s liabilities and
commitments, are convertible into a fixed number of CEMEX, S.A.B. de C.V.’s ADSs at any time at the holder’s election and are
subject to antidilution adjustments. The difference at the exchange date between the fair value of the March 2016 Optional Convertible
Subordinated U.S. Dollar Notes and the 42 million ADSs against the fair value of March 2020 Optional Convertible Subordinated
U.S. Dollar Notes, represented a loss of approximately Ps365 million recognized in 2015 as part of other financial (expense) income,
net. As of December 31, 2016, the conversion price per ADS under the March 2020 Optional Convertible Subordinated U.S. Dollar
Notes was approximately U.S.$11.45, and, as of the date of this report, this has been further adjusted to approximately U.S.$11.01. The
aggregate fair value of the conversion option as of the issuance dates which amounted to approximately Ps199 million was recognized
in other equity reserves. After antidilution adjustments, the conversion rate as of December 31, 2016 was 87.3646 ADSs per each
U.S.$1 thousand principal amount of such notes, and, as of the date of this report, this has been further adjusted to 90.8592 ADSs per
each U.S.$1 thousand principal amount of such notes. See note 16B to our audited consolidated financial statements included in the
2016 Annual Report.
March 2018 Optional Convertible Subordinated U.S. Dollar Notes
On March 15, 2011, CEMEX, S.A.B. de C.V. closed the offering of U.S.$690 million (Ps8,211 million) aggregate principal
amount of the March 2018 Optional Convertible Subordinated U.S. Dollar Notes. The notes are subordinated to all of CEMEX’s
liabilities and commitments. The notes are convertible into a fixed number of CEMEX, S.A.B. de C.V.’s ADSs, at the holder’s election,
and are subject to antidilution adjustments. As of December 31, 2016, the conversion price per ADS under the March 2018 Optional
Convertible Subordinated U.S. Dollar Notes was approximately U.S.$8.92, and, as of the date of this report, this has been further
adjusted to approximately U.S.$8.57. After antidilution adjustments, the conversion rate as of December 31, 2016 was 112.1339 ADSs
per each U.S.$1 thousand principal amount of the March 2018 Optional Convertible Subordinated U.S. Dollar Notes, and, as of the date
of this report, this has been further adjusted to 116.6193 ADSs per each U.S.$1 thousand principal amount of such notes. A portion of
the net proceeds from this transaction were used to fund the purchase of capped call options, which are generally expected to reduce the
potential dilution cost to us upon the potential conversion of the March 2018 Optional Convertible Subordinated U.S. Dollar Notes. See
notes 16B and 16D to our audited consolidated financial statements included in the 2016 Annual Report.
39

November 2019 Mandatory Convertible Mexican Peso Notes
In December 2009, CEMEX, S.A.B. de C.V. completed an exchange offer of debt into its 10% mandatorily convertible securities
in pesos (the “November 2019 Mandatory Convertible Mexican Peso Notes”) for approximately U.S.$315 million (Ps4,126 million).
Reflecting antidilution adjustments, the notes will be converted at maturity or earlier if the price of the CPO reaches approximately
Ps29.50 into approximately 210 million CPOs at a conversion price of approximately Ps17.48 per CPO. The conversion rate under the
November 2019 Mandatory Convertible Mexican Peso Notes is 509.1077 CPOs per each convertible obligation. During their tenure,
holders have an option to voluntarily convert their securities on any interest payment date into CPOs. Considering the currency in which
the notes are denominated and the functional currency of CEMEX, S.A.B. de C.V.’s financing division, the conversion option
embedded in these securities is treated as a stand-alone derivative liability at fair value in the statement of operations, recognizing an
initial effect of Ps365 million.
Our Receivables Financing Arrangements
Our subsidiaries in Mexico, the United States, France and the United Kingdom are parties to sales of trade accounts receivable
programs with financial institutions, referred to as securitization programs. As of December 31, 2016 and September 30, 2017, trade
accounts receivable included receivables of U.S.$658 million (Ps13,644 million) and U.S.$698 million (Ps12,737 million), respectively.
Under these programs, our subsidiaries effectively surrender control associated with the trade accounts receivable sold and there is no
guarantee or obligation to reacquire the assets. However, we retain certain residual interest in the programs and/or maintain continuing
involvement with the accounts receivable; therefore, the amounts received are recognized within “Other financial obligations.” Trade
accounts receivable qualifying for sale exclude amounts over certain days past due or concentrations over certain limits to any
customer, according to the terms of the programs. The portion of the accounts receivable sold maintained as reserves amounted to
Ps2,549 million as of December 31, 2016 and Ps2,283 million as of September 30, 2017, respectively. Therefore, the funded amount to
CEMEX was U.S.$535 million (Ps11,095 million) as of December 31, 2016 and U.S.$573 million (Ps10,454 million) as of
September 30, 2017. The discount granted to the acquirers of the trade accounts receivable is recorded as financial expense and
amounted to approximately U.S.$11 million (Ps194 million) and U.S.$11 million (Ps214 million) for the nine-month periods ended
September 30, 2016 and 2017, respectively. Our securitization programs are negotiated for specific periods and may be renewed at their
maturity. As of September 30, 2017, the securitization programs outstanding in Mexico, the United States, France and the United
Kingdom each mature in March 2018. See note 8 to our unaudited condensed consolidated financial statements for the nine-month
periods ended September 30, 2016 and 2017 included herein.
Capital Leases
As of December 31, 2016 and September 30, 2017, we held several operating buildings and mainly mobile equipment, under
capital lease contracts for a total of approximately U.S.$84 million (Ps1,576 million) and U.S.$169 million (Ps3,090 million),
respectively. Future payments associated with these contracts are presented in note 23E to our audited consolidated financial statements
included in the 2016 Annual Report.
Perpetual Debentures
As of December 31, 2016 and as of September 30, 2017, non-controlling interest stockholders’ equity included approximately
U.S.$438 million (Ps9,075 million) and U.S.$446 million (Ps8,140 million), respectively, representing the notional amount of Perpetual
Debentures, which exclude any perpetual debentures held by subsidiaries. The Perpetual Debentures have no fixed maturity date and do
not represent contractual obligations to exchange any series of its outstanding Perpetual Debentures for financial assets or financial
liabilities. Based on their characteristics, the Perpetual Debentures, issued through SPVs, qualify as equity instruments and are
classified within non-controlling interest as they were issued by consolidated entities, and, if the conditions to interest deferred are
satisfied, we have the unilateral right to defer indefinitely the payment of interest due on the Perpetual Debentures. Issuance costs, as
well as the interest expense, which is accrued based on the principal amount of the Perpetual Debentures, are included within “Other
equity reserves” and represented expenses of approximately Ps369 million and Ps359 million for the nine-month periods ended
September 2016 and 2017, respectively. The different SPVs were established solely for purposes of issuing the Perpetual Debentures
and are included in our audited consolidated financial statements included in the 2016 Annual Report. As of December 31, 2016, the
Perpetual Debentures were as follows
Issuer Issuance Date
Nominal Amount
at Issuance
Date (in millions)
Nominal Amount
Outstanding as of
December 31, 2016
(in millions) Repurchase Option
Interest
Rate
C10-EUR Capital (SPV) Ltd. May 2007 € 730 € 64 Tenth anniversary EURIBOR +4.79%
C8 Capital (SPV) Ltd. (1) February 2007 U.S.$ 750 U.S.$ 135 Eighth anniversary LIBOR + 4.40%
C5 Capital (SPV) Ltd.(1) December 2006 U.S.$ 350 U.S.$ 61 Fifth anniversary LIBOR + 4.277%

C10 Capital (SPV) Ltd. December 2006 U.S.$ 900 U.S.$ 175 Tenth anniversary LIBOR + 4.71%
(1) “EURIBOR” above refers to the Euro Inter-Bank Offered Rate. As of September 30, 2016 and 2017, 3-month EURIBOR was
approximately -0.30% and -0.33%.
40

(2) “LIBOR” above refers to the London Inter-Bank Offered Rate. As of September 30, 2016 and 2017, 3-month LIBOR was
approximately 0.85% and 1.33%, respectively.
Stock Repurchase Program
Under Mexican law, CEMEX, S.A.B. de C.V.’s shareholders may authorize a stock repurchase program at any annual general
ordinary shareholders’ meeting. Unless otherwise instructed by CEMEX, S.A.B. de C.V.’s shareholders, we are not required to
purchase any minimum number of shares pursuant to such program.
In connection with CEMEX, S.A.B. de C.V.’s 2014, 2015 and 2016 annual general ordinary shareholders’ meetings held on
March 26, 2015, March 31, 2016, and March 30, 2017, respectively, no stock repurchase program has been proposed between March
2014 and the date of this report. Subject to certain exceptions, we are not permitted to repurchase shares of our capital stock under the
2017 Credit Agreement and the indentures governing the Senior Secured Notes.
Research and Development, Patents and Licenses, etc.
Headed by Cemex Research Group AG (“Cemex Research Group”), based in Switzerland, R&D is increasingly assuming a key
role as it is recognized as an important contributor to CEMEX’s comprehensive pricing strategy for CEMEX’s products. Through the
development of innovative technologies, services, and commercial models, CEMEX is leveraging its know-how based assets to create
an important differentiation in its offerings to customers in a broad range of markets with unique challenges. Focus is placed on creating
tangible value for our customers by making their business more profitable, but more importantly, as leaders in the industry, there is an
underlying mission for CEMEX to elevate and accelerate the industry’s evolution in order to achieve greater sustainability, increase
engagement in social responsibility and provoke an important leap in its technological advancement.
CEMEX’s R&D initiatives are globally led, coordinated and managed by Cemex Research Group, which encompasses the areas of
Product Development & Construction Trends, Cement Production Technology, Sustainability, Business Process & IT, Innovation, and
Commercial & Logistics. The areas of Product Development & Construction Trends and Cement Production Technology are
responsible for, among others, developing new products for our cement, ready-mix concrete, aggregate and admixture businesses as
well as introduce novel and/or improved processing and manufacturing technology for all of CEMEX’s core businesses. Additionally,
the Product Development & Construction Trends and Sustainability areas collaborate to develop and propose construction solutions
through consulting and the integration of the aforementioned technologies. The Cement Production Technology and Sustainability areas
are dedicated to, among others, operational efficiencies leading to cost reductions and enhancing our CO2 footprint and overall
environmental impact through the usage of alternative or biomass fuels and the use of supplementary materials in substitution of
clinker. For example, we have developed processes and products that allow us to reduce heat consumption in our kilns, which in turn
reduces energy costs. Global products/brands have been conceptualized and engineered to positively impact the jobsite safety, promote
efficient construction practices, sensibly preserve natural resources vital to life, lower carbon foot-print and improve the quality of life
in rapidly transforming cities. Underlying CEMEX’s R&D philosophy is a growing culture of global collaboration and coordination,
where the innovation team identifies and promotes novel collaboration practices, and mobilizes its adoption within CEMEX. Getting
closer and understanding our customers is a fundamental transformation within CEMEX, and consequently the Commercial & Logistics
area is carrying out research initiatives to better attend the needs of customers as well as identify key changes in our supply chain
management that will enable us to bring products, solutions, and services to our customers in the most cost-effective and efficient
manner.
There are nine laboratories supporting CEMEX’s R&D efforts under a collaboration network. The laboratories are strategically
located in close proximity to our plants, and assist the operating subsidiaries with troubleshooting, optimization techniques and quality
assurance methods. The laboratory located in Switzerland is continually improving and consolidating our research and development
efforts in the areas of cement, concrete, aggregates, admixtures, mortar and asphalt technology, sustainability as well as in energy
management. In addition, Cemex Research Group actively generates as well as registers patents and pending applications in many of
the countries in which CEMEX operates. Patents and trade secrets are managed strategically in order to ensure an important technology
lock-ins associated with CEMEX technology.
Our Information Technology divisions develop information management systems and software relating to cement and ready-mix
concrete operational practices, automation and maintenance. These systems have helped us to better serve our clients with respect to
purchasing, delivery and payment. More importantly, thanks to the activities of the Business Process and IT departments, CEMEX is
continuously improving and innovating its business processes to adapt them to the dynamically evolving markets, and better serve
CEMEX’s needs.
41

R&D activities comprise part of the daily routine of the departments and divisions mentioned above; therefore, the costs
associated with such activities are expensed as incurred. However, the costs incurred in the development of software for internal use are
capitalized and amortized in operating results over the estimated useful life of the software, which is approximately five years.
For the nine-month periods ended September 30, 2016 and 2017, the total combined expense of the technology and energy
departments in CEMEX, which includes all significant R&D activities, amounted to approximately Ps512 million (U.S.$28 million) and
Ps593 million (U.S.$32 million), respectively.
Summary of Material Contractual Obligations and Commercial Commitments
The 2017 Credit Agreement
On July 19, 2017, CEMEX, S.A.B. de C.V. and certain of its subsidiaries entered into the 2017 Credit Agreement for
approximately U.S.$4 billion (in aggregate), the proceeds of which were used to refinance indebtedness incurred under a then-existing
credit agreement and the balance, if drawn, shall be used for general corporate purposes.
As of September 30, 2017, we reported an aggregate principal amount of outstanding debt of approximately Ps46,145 million
(U.S.$2,529 million) under the 2017 Credit Agreement. The 2017 Credit Agreement is secured by a first-priority security interest over
the Collateral and all proceeds of such Collateral. Total commitments initially available under the 2017 Credit Agreement included
(i) approximately €741 million (approximately U.S.$875 million or approximately Ps15,967 million), (ii) approximately £344 million
(approximately U.S.$460 million or approximately Ps8,402) and (iii) approximately U.S.$2,746 million (Ps50,123 million), out of
which approximately U.S.$1,135 million (Ps20,714 million) were in the revolving credit facility tranche of the 2017 Credit Agreement.
As of September 30, 2017, the 2017 Credit Agreement had an amortization profile, considering all commitments of approximately
U.S.$4 billion under the 2017 Credit Agreement, of approximately U.S.$589 million in 2020, U.S.$1,179 million in 2021 and
U.S.$2,314 million in 2022. See note 12A to our unaudited condensed consolidated financial statements included herein.
Our failure to comply with restrictions and covenants under the 2017 Credit Agreement could have a material adverse effect on
our business and financial conditions.
For a discussion of restrictions and covenants under the 2017 Credit Agreement, see “Risk Factors—The 2017 Credit Agreement
contains several restrictions and covenants. Our failure to comply with such restrictions and covenants could have a material adverse
effect on our business and financial conditions.”
Senior Secured Notes
The indentures currently governing our existing Senior Secured Notes impose significant operating and financial restrictions on
us. These restrictions will limit our ability, among other things, to: (i) create liens; (ii) incur in additional debt; (iii) change CEMEX’s
business or the business of any obligor or material subsidiary; (iv) enter into mergers; (v) enter into agreements that restrict our
subsidiaries’ ability to pay dividends or repay intercompany debt; (vi) acquire assets; (vii) enter into or invest in joint venture
agreements; (viii) dispose certain assets; (ix) grant additional guarantees or indemnities; (x) declare or pay cash dividends or make share
redemptions; (xi) enter into certain derivatives transactions and (xii) exercise any call option in relation to any perpetual bonds issues
unless the exercise of the call options does not have a materially negative impact on our cash flow.
December 2019 U.S. Dollar Notes. On August 12, 2013, CEMEX, S.A.B. de C.V. issued U.S.$1.0 billion aggregate principal
amount of the December 2019 U.S. Dollar Notes, in transactions exempt from registration pursuant to Rule 144A and Regulation S
under the United States Securities Act of 1933, as amended (the “Securities Act”). CEMEX México, CEMEX España, New Sunward,
Cemex Asia, CEMEX Concretos, CEMEX Corp., CEMEX Finance, Cemex Egyptian Investments, CEMEX France, Cemex Research
Group, CEMEX UK and Empresas Tolteca have fully and unconditionally guaranteed the performance of all obligations of CEMEX,
S.A.B. de C.V. under the December 2019 U.S. Dollar Notes. The payment of principal, interest and premium, if any, on such notes is
secured by a first-priority security interest over the Collateral and all proceeds of such Collateral. On May 12, 2016, CEMEX, S.A.B. de
C.V. completed the purchase of U.S.$218.9 million aggregate principal amount of the December 2019 U.S. Dollar Notes through a cash
tender offer. On March 2, 2017, CEMEX, S.A.B. de C.V. completed the purchase of an additional U.S.$89.9 million aggregate
principal amount of the December 2019 U.S. Dollar Notes through a cash tender offer. All such December 2019 U.S. Dollar Notes
purchased in the tender offers were immediately canceled. Following the settlement of the tender offers, U.S.$618.2 million aggregate
principal amount of the December 2019 U.S. Dollar Notes remained outstanding. On November 6, 2017, CEMEX,
42

S.A.B. de C.V. issued an irrevocable notice of redemption with respect to the December 2019 U.S. Dollar Notes, pursuant to which it
will complete the redemption of the remaining U.S.$610.7 million aggregate principal amount of the December 2019 U.S. Dollar Notes
on December 10, 2017. See “Recent Developments—Recent Developments Relating to Our Indebtedness—The December 2019
U.S. Dollar Notes Redemption.”
January 2021 and October 2018 U.S. Dollar Notes. On October 2, 2013, CEMEX, S.A.B. de C.V. issued U.S.$1.0 billion
aggregate principal amount of its 7.25% Senior Secured Notes due 2021 (the “January 2021 U.S. Dollar Notes”) and U.S.$500 million
aggregate amount of its Floating Rate Senior Secured Notes due 2018 (the “October 2018 U.S. Dollar Notes” and, together with the
January 2021 U.S. Dollar Notes, the “January 2021 and October 2018 U.S. Dollar Notes”), in transactions exempt from registration
pursuant to Rule 144A and Regulation S under the Securities Act. CEMEX México, CEMEX España, New Sunward, Cemex Asia,
CEMEX Concretos, CEMEX Corp., CEMEX Finance, Cemex Egyptian Investments, CEMEX France, Cemex Research Group,
CEMEX UK and Empresas Tolteca have fully and unconditionally guaranteed the performance of all obligations of CEMEX, S.A.B. de
C.V. under the January 2021 and October 2018 U.S. Dollar Notes. The payment of principal, interest and premium, if any, on such
notes is secured by a first-priority security interest over the Collateral and all proceeds of such Collateral. On May 12, 2016, CEMEX,
S.A.B. de C.V. completed the purchase of U.S.$178.5 million aggregate principal amount of the October 2018 U.S. Dollar Notes
through a cash tender offer. All such October 2018 U.S. Dollar Notes purchased in the tender offer were immediately canceled.
Following the settlement of the tender offer, U.S.$319.5 million aggregate principal amount of the October 2018 U.S. Dollar Notes
remained outstanding. On September 29, 2016, CEMEX, S.A.B. de C.V. commenced a tender offer to purchase up to U.S.$500 million
of the outstanding January 2021 U.S. Dollar Notes. On October 28, 2016, CEMEX, S.A.B. de C.V. announced that approximately
U.S.$241.9 million of the January 2021 U.S. Dollar Notes were validly tendered by holders of such notes. On March 2, 2017, CEMEX,
S.A.B. de C.V. completed the purchase of an additional U.S.$385.1 million aggregate principal amount of the January 2021 U.S. Dollar
Notes through a cash tender offer. All such January 2021 U.S. Dollar Notes purchased in the tender offers were immediately canceled.
Following the settlement of the tender offers, U.S.$341.7 million aggregate principal amount of the January 2021 U.S. Dollar Notes
remained outstanding.
April 2024 U.S. Dollar Notes and April 2021 Euro Notes. On April 1, 2014, CEMEX Finance issued U.S.$1.0 billion aggregate
principal amount of its 6.000% U.S. Dollar-Denominated Senior Secured Notes due 2024 (the “April 2024 U.S. Dollar Notes”) and
€400 million aggregate principal amount of the April 2021 Euro Notes, in transactions exempt from registration pursuant to Rule 144A
and Regulation S under the Securities Act. CEMEX, S.A.B. de C.V., CEMEX México, CEMEX España, New Sunward, Cemex Asia,
CEMEX Concretos, CEMEX Corp., Cemex Egyptian Investments, CEMEX France, Cemex Research Group, CEMEX UK and
Empresas Tolteca have fully and unconditionally guaranteed the performance of all obligations of CEMEX Finance under the April
2024 U.S. Dollar Notes and April 2021 Euro Notes. The payment of principal, interest and premium, if any, on such notes is secured by
a first-priority security interest over the Collateral and all proceeds of such Collateral. On May 1, 2017, CEMEX Finance issued an
irrevocable notice of redemption with respect to the April 2021 Euro Notes, pursuant to which it redeemed the remaining €400 million
aggregate principal amount of the April 2021 Euro Notes on May 31, 2017.
January 2025 U.S. Dollar Notes and January 2022 Euro Notes. On September 11, 2014, CEMEX, S.A.B. de C.V. issued
U.S.$1.1 billion aggregate principal amount of its 5.7% Senior Secured Notes due 2025 (the “January 2025 U.S. Dollar Notes”)
€400 million aggregate principal amount of its 4.750% Senior Secured Notes due 2022 (the “January 2022 Euro Notes”), in transactions
exempt from registration pursuant to Rule 144A and Regulation S under the Securities Act. CEMEX México, CEMEX Concretos,
Empresas Tolteca, New Sunward, CEMEX España, Cemex Asia, CEMEX Corp., CEMEX Finance, Cemex Egyptian Investments,
CEMEX France, Cemex Research Group and CEMEX UK have fully and unconditionally guaranteed the performance of all obligations
of CEMEX, S.A.B. de C.V. under the January 2025 U.S. Dollar Notes and January 2022 Euro Notes. The payment of principal, interest
and premium, if any, on such notes is secured by a first-priority security interest over the Collateral and all proceeds of such Collateral.
May 2025 U.S. Dollar and March 2023 Euro Notes. In March 2015, CEMEX, S.A.B. de C.V. issued U.S.$750 million aggregate
principal amount of its 6.125% Senior Secured Notes due 2025 (the “May 2025 U.S. Dollar Notes”) and €550 million aggregate amount
of its 4.375% Senior Secured Notes due 2023 (the “March 2023 Euro Notes”), in transactions exempt from registration pursuant to Rule
144A and Regulation S under the Securities Act. CEMEX México, CEMEX Concretos, Empresas Tolteca, New Sunward, CEMEX
España, Cemex Asia, CEMEX Corp., CEMEX Finance, Cemex Egyptian Investments, CEMEX France, Cemex Research Group and
CEMEX UK have fully and unconditionally guaranteed the performance of all obligations of CEMEX, S.A.B. de C.V. under the May
2025 U.S. Dollar Notes and the March 2023 Euro Notes. The payment of principal, interest and premium, if any, on such notes is
secured by a first-priority security interest over the Collateral and all proceeds of such Collateral.
43

April 2026 U.S. Dollar Notes. On March 16, 2016, CEMEX, S.A.B. de C.V. issued U.S.$1.0 billion aggregate principal amount of
its 7.75% Senior Secured Notes due 2026 (the “April 2026 U.S. Dollar Notes”), in transactions exempt from registration pursuant to
Rule 144A and Regulation S under the Securities Act. CEMEX México, CEMEX España, New Sunward, Cemex Asia, CEMEX
Concretos, CEMEX Corp., CEMEX Finance, Cemex Egyptian Investments, CEMEX France, Cemex Research Group and CEMEX UK
and Empresas Tolteca have fully and unconditionally guaranteed the performance of all obligations of CEMEX, S.A.B. de C.V. under
the April 2026 U.S. Dollar Notes. The payment of principal, interest and premium, if any, on such notes is secured by a first-priority
security interest over the Collateral and all proceeds of such Collateral.
June 2024 Euro Notes. On June 14, 2016, CEMEX Finance issued €400 million of 4.625% Senior Secured Notes due 2024
denominated in Euros (the “June 2024 Euro Notes” and, together with the December 2019 U.S. Dollar Notes, the January 2021 and
October 2018 U.S. Dollar Notes, the April 2024 U.S. Dollar Notes, the January 2025 U.S. Dollar Notes, the January 2022 Euro Notes,
the May 2025 U.S. Dollar Notes, the March 2023 Euro Notes and the April 2026 U.S. Dollar Notes, the “Senior Secured Notes”), in
transactions exempt from registration pursuant to Rule 144A and Regulation S under the Securities Act. CEMEX, S.A.B. de C.V.,
CEMEX México, CEMEX Concretos, Empresas Tolteca, New Sunward, CEMEX España, Cemex Asia, CEMEX Corp., Cemex
Egyptian Investments, CEMEX France, Cemex Research Group and CEMEX UK have fully and unconditionally guaranteed the
performance of all obligations of CEMEX Finance under the June 2024 Euro Notes. The payment of principal, interest and premium, if
any, on such notes is secured by a first-priority security interest over the Collateral and all proceeds of such Collateral.
Convertible Notes
March 2020 Optional Convertible Subordinated U.S. Dollar Notes. During 2015, CEMEX, S.A.B. de C.V. issued
U.S.$521 million (Ps8,977 million) aggregate principal amount of its March 2020 Optional Convertible Subordinated U.S. Dollar
Notes. The March 2020 Optional Convertible Subordinated U.S. Dollar Notes were issued: (a) U.S.$200 million as a result of the
exercise on March 13, 2015 of U.S.$200 million notional amount of CCUs, and (b) U.S.$321 million as a result of private exchanges
with certain institutional investors on May 28, 2015, which together with early conversions, resulted in a total of approximately
U.S.$626 million aggregate principal amount of the March 2016 Optional Convertible Subordinated U.S. Dollar Notes held by such
investors being paid and the issuance and delivery by CEMEX of an estimated 42 million ADSs, which included a number of additional
ADSs issued to the holders as non-cash inducement premiums. The March 2020 Optional Convertible Subordinated U.S. Dollar Notes,
which are subordinated to all of CEMEX’s liabilities and commitments, are convertible into a fixed number of CEMEX, S.A.B. de
C.V.’s ADSs at any time at the holder’s election and are subject to antidilution adjustments. The difference at the exchange date
between the fair value of the March 2016 Optional Convertible Subordinated U.S. Dollar Notes and the 42 million ADSs against the
fair value of the March 2020 Optional Convertible Subordinated U.S. Dollar Notes, represented a loss of approximately Ps365 million
recognized in 2015 as part of other financial (expense) income, net. The aggregate fair value of the conversion option as of the issuance
dates which amounted to approximately Ps199 million was recognized in other equity reserves. As of September 30, 2017, the
conversion price per ADS under the March 2020 Optional Convertible Subordinated U.S. Dollar Notes was approximately U.S.$11.01.
After antidilution adjustments, the conversion rate as of September 30, 2017 was 90.8592 ADSs per each U.S.$1 thousand principal
amount of such notes.
November 2019 Mandatory Convertible Mexican Peso Notes. In December 2009, CEMEX, S.A.B. de C.V. completed an
exchange offer of debt for approximately U.S.$315 million (Ps4,126 million) of the November 2019 Mandatory Convertible Mexican
Peso Notes. Reflecting antidilution adjustments, the notes will be converted at maturity or earlier if the price of the CPO reaches
approximately Ps29.50 into approximately 210 million CPOs at a conversion price of approximately Ps17.48 per CPO. The conversion
rate under the November 2019 Mandatory Convertible Mexican Peso Notes is 509.1077 CPOs per each convertible obligation. During
their tenure, holders have an option to voluntarily convert their securities on any interest payment date into CPOs. Considering the
currency in which the notes are denominated and the functional currency of CEMEX, S.A.B. de C.V.’s financing division, the
conversion option embedded in these securities is treated as a stand-alone derivative liability at fair value in the statement of operations,
recognizing an initial effect of Ps365 million. See note 16B to our audited consolidated financial statements included in the 2016
Annual Report.
March 2018 Optional Convertible Subordinated U.S. Dollar Notes. On March 15, 2011, CEMEX, S.A.B. de C.V. closed the
offering of U.S.$690 million (Ps8,211 million) aggregate principal amount of its March 2018 Optional Convertible Subordinated
U.S. Dollar Notes. The notes are subordinated to all of CEMEX’s liabilities and commitments. The notes are convertible into a fixed
number of CEMEX, S.A.B. de C.V.’s ADSs, at the holder’s election, and are subject to antidilution adjustments. As of the date of this
report, the conversion price per ADS under the March 2018 Optional Convertible Subordinated U.S. Dollar Notes was approximately
U.S.$8.57. After antidilution adjustments, the conversion rate as of the date of this report was 116.6193 ADSs per each U.S.$1 thousand
principal amount of the March 2018 Optional Convertible Subordinated U.S. Dollar Notes. During August 2016, we amended the
capped calls relating to the March 2018 Optional Convertible Subordinated U.S. Dollar Notes and, as a result, the exercise price was
adjusted to U.S.$8.92 per ADS and the underlying to six million ADSs. See notes 16B and 16D to our audited consolidated financial
statements included in the 2016 Annual Report.

44

Commercial Commitments
On July 30, 2012, we entered into a Master Professional Services Agreement with International Business Machines Corporation
(“IBM”). This agreement provides the framework for our contracting for IBM to provide us with the following services: information
technology, application development and maintenance, finance and accounting outsourcing, human resources administration and
contact center services. The agreement provides for these services to be provided to us from July 30, 2012 until August 31, 2022, unless
earlier terminated. Our minimum required payments to IBM under the agreement are approximately U.S.$50 million per year. We will
have the right to adjust the cost and quality of the services every two years if it is determined that they do not meet certain benchmarks.
We may terminate the agreement (or a portion of it) at our discretion and without cause at any time by providing at least six-months’
notice to IBM and paying termination charges consisting of IBM’s unrecovered investment and breakage and wind-down costs. In
addition, we may terminate the agreement (or a portion of it) for cause without paying termination charges. Other termination rights
may be available to us for a termination charge that will vary with the reason for termination. IBM may terminate the agreement if we
(i) fail to make payments when due or (ii) become bankrupt and do not pay in advance for the services.
In some countries, we have self-insured health care benefits plans for its active employees, which are managed on cost plus fee
arrangements with major insurance companies or provided through health maintenance organizations.
As of September 30, 2017, we did not depend on any of our suppliers of goods or services to conduct our business.
Contractual Obligations
As of December 31, 2016 and September 30, 2017, we had material contractual obligations as set forth in the table below.
45

As of
December 31, 2016 As of September 30, 2017
Obligations Total
Less than
1 year 1-3 years 3-5 years
More
than 5
years Total
(in millions of U.S. Dollars)
Long-term debt U.S.$ 11,379 370 918 1,878 6,837 10,003
Capital lease obligations(1) 107 8 59 55 19 141
Convertible notes(2) 1,205 17 25 507 — 549
Total debt and other financial obligations(3) 12,691 395 1,002 2,440 6,856 10,693
Operating leases(4) 515 27 185 144 116 471
Interest payments on debt(5) 3,996 242 1,046 899 1,065 3,252
Pension plans and other benefits(6) 1,414 157 311 316 825 1,609
Purchases of raw material, fuel and energy(7) 4,440 521 830 796 2,129 4,275
Total contractual obligations U.S.$ 23,056 1,343 3,373 4,595 10,990 20,300
Total contractual obligations (Mexican Pesos) Ps 477,720 24,503 61,558 83,852 200,569 370,483
(1) Represents nominal cash flows. As of September 30, 2017, the net present value of future payments under such leases was
approximately U.S.$141 million (Ps2,573 million), of which, approximately U.S.$59 million (Ps1,077 million) refers to payments
from one to three years, approximately U.S.$55 million (Ps1,044 million) refers to payments from three to five years and
approximately U.S.$19 million (Ps347 million) refers to payments of more than five years
(2) Refers to the components of liability of the convertible notes described in note 16B to our audited consolidated financial
statements included in the 2016 Annual Report and assumes repayment at maturity and no conversion of such convertible notes.
(3) The schedule of debt payments, which includes current maturities, does not consider the effect of any refinancing of debt that may
occur during the following years. In the past, we have replaced our long-term obligations for others of a similar nature.
(4) The amounts represent nominal cash flows. We have operating leases, primarily for operating facilities, cement storage and
distribution facilities and certain transportation and other equipment, under which annual rental payments are required plus the
payment of certain operating expenses. Rental expense was U.S.$84 million (Ps1,539 million) for the nine-month period ended
September 30, 2017 and U.S.$90 million (Ps1,743 million) for the same period in 2016.
(5) Estimated cash flows on floating rate denominated debt were determined using the interest rates in effect as of December 31, 2016
and September 30, 2017.
(6) Represents estimated annual payments under these benefits for the next ten years (see note 18 to our audited consolidated financial
statements included in the 2016 Annual Report). Future payments include the estimate of new retirees during such future years.
(7) Future nominal payments for the purchase of raw materials are presented on the basis of contractual nominal cash flows. Future
nominal payments of energy were estimated for all contractual commitments on the basis of an aggregate average expected
consumption of approximately 3,124.1 GWh per year using the future prices of energy established in the contracts for each period.
Future payments also include our commitments for the purchase of fuel.
Off-Balance Sheet Arrangements
We do not have any off-balance sheet arrangements that are reasonably likely to have a material effect on our financial condition,
operating results and liquidity or capital resources.
Quantitative and Qualitative Market Disclosure
Our Derivative Financial Instruments
For the nine-month period ended September 30, 2017, we had net income related to the recognition of changes in fair values of
derivative financial instruments of approximately Ps245 million (U.S.$13 million) as compared to a net income of approximately
Ps493 million (U.S.$27 million) for the same period in 2016.
Since the beginning of 2009, we have been reducing the aggregate notional amount of our derivatives, thereby reducing the risk of
cash margin calls. This initiative has included closing substantially all notional amounts of derivative instruments related to our debt
(currency and interest rate derivatives) and the settlement of our inactive derivative financial instruments (see note 16D to our audited
consolidated financial statements included in
46

the 2016 Annual Report), which we finalized during April 2009. The 2017 Credit Agreement significantly restricts our ability to enter
into certain derivative transactions.
We use derivative financial instruments in order to change the risk profile associated with changes in interest rates and foreign
exchange rates of debt agreements, as a vehicle to reduce financing costs, as an alternative source of financing, and as hedges of:
(i) highly probable forecasted transactions, (ii) our net assets in foreign subsidiaries and (iii) future exercises of options under our
executive stock option programs. Before entering into any transaction, we evaluate, by reviewing credit ratings and our business
relationship according to our policies, the creditworthiness of the financial institutions and corporations that are prospective
counterparties to our derivative financial instruments. We select our counterparties to the extent we believe that they have the financial
capacity to meet their obligations in relation to these instruments. Under current financial conditions and volatility, we cannot assure
that risk of non-compliance with the obligations agreed to with such counterparties is minimal.
The fair value of derivative financial instruments is based on estimated settlement costs or quoted market prices and supported by
confirmations of these values received from the counterparties to these financial instruments. The notional amounts of derivative
financial instrument agreements are used to measure interest to be paid or received and do not represent the amount of exposure to
credit loss.
At December 31, 2016 At September 30, 2017
(in millions of U.S. Dollars)
Notional
Amount
Estimated
Fair value
Notional
Amount
Estimated
Fair value Maturity Date
Interest rate swaps 147 23 142 21 September 2022
Equity forwards on third-
party shares — — 168 3 March 2019
Options on CEMEX, S.A.B.
de C.V.’s shares 576 26 — (37) November 2019
Foreign exchange forward
contracts 80 — 1,062 (27)
October 2017 - September
2019
Fuels price hedging
77 15 74 12
October 2017 - December
2018
880 64 1,446 (28)
Our Interest Rate Swaps. As of December 31, 2016 and September 30, 2017, we had an interest rate swap maturing in September
2022 with notional amounts of U.S.$ 147 million and U.S.$142 million, respectively, negotiated to exchange floating for fixed rates in
connection with agreements we entered into for the acquisition of electric energy in Mexico. For more information, see note 12C to our
unaudited condensed consolidated financial statements for the nine-month periods ended September 30, 2016 and 2017 included herein.
As of December 31, 2016 and September 30, 2017, the fair value of the swap represented assets of approximately U.S.$23 million and
U.S.$21 million, respectively. Pursuant to this instrument, during the tenure of the swap and based on its notional amount, we will
receive a fixed rate of 5.4% and will pay at LIBOR. Changes in the fair value of interest rate swaps, generated losses of approximately
U.S.$2 million (Ps38 million) for the nine-month period ended September 30, 2017 and gains of approximately U.S.$2 million (Ps37
million) for the same period in 2016, which were recognized in the statement of operations for each period. See note 16D to our audited
consolidated financial statements included in the 2016 Annual Report and note 12C to our unaudited condensed consolidated financial
statements for the nine month periods ended September 30, 2017 and 2016 included herein.
Our Equity Forwards on Third-Party Shares. After our sale of the direct common shares of GCC, announced in September 28,
2017, was completed and in order to retain exposure to the stock price of GCC, CEMEX, S.A.B. de C.V. entered into two forward
contracts on the stock price of GCC, which are payable in cash, over the price of 31.5 million shares and due in March 2019. GCC is a
Mexican construction company traded in the Mexican Stock Exchange. As of September 30, 2017, the fair value of the equity forward
represented an asset of approximately U.S.$3 million (Ps56 million), net of cash collateral. Changes in the fair value of this instrument
generated losses of U.S.$5 million (Ps94 million) for the nine-month period ended September 30, 2017, which were recognized in the
statement of operations.
Our Options on Our Own Shares. On March 15, 2011, in connection with the offering of the March 2018 Optional Convertible
Subordinated U.S. Dollar Notes and to effectively increase the conversion price for CEMEX, S.A.B. de C.V.’s ADSs under such notes,
CEMEX, S.A.B. de C.V. entered into capped call transactions after antidilution adjustments of over approximately 80 million ADSs
maturing in March 2018, by means of which at maturity of the notes in March 2018, if the price per ADS is above U.S.$8.5749, we will
receive in cash the difference between the market price of the ADS and U.S.$8.5749, with a maximum appreciation per ADS of
U.S.$13.8518. We paid a total premium of approximately U.S.$104 million. During August 2016 we amended 58.3% of the total
notional amount of such capped calls, with the purpose of reducing the volatility of their fair value by lowering the strike prices in
exchange for reducing the number of underlying options. These amendments involved no cash settlements. As a result of such

amendments, CEMEX, S.A.B. de C.V. retained a total amount of capped call transactions over approximately 71 million CEMEX
ADSs after antidilution adjustments maturing in March 2018. As of December 31, 2016, the fair
47

value of such options represented assets of approximately U.S.$66 million (Ps1,368 million). For the nine-month period ended
September 30, 2017, changes in the fair value of this contract generated a gain of approximately U.S.$37 million (Ps696 million), which
was recognized in the statement of operations for the period. During 2017, we amended capped calls transactions maturing in March
2018 over approximately 71 million CEMEX ADSs, with the purpose of unwinding the position, pursuant to which CEMEX, S.A.B. de
C.V. received an aggregate amount of approximately U.S.$103 million in cash. As of September 30, 2017, CEMEX, S.A.B. de C.V.
closed all of its options in its own shares.
In addition, in connection with the November 2019 Mandatory Convertible Mexican Peso Notes (see note 16B to our audited
consolidated financial statements included in the 2016 Annual Report), and considering (i) the change in CEMEX, S.A.B. de C.V.’s
functional currency effective January 1, 2013 and (ii) that the currency in which such November 2019 Mandatory Convertible Mexican
Peso Notes are denominated and the functional currency of the issuer differ, beginning January 1, 2013, we now separate the conversion
option embedded in such instruments and recognize it at fair value, which as of December 31, 2016 and September 30, 2017, resulted in
a liability of approximately U.S.$40 million (Ps829 million) and U.S.$37 million (Ps675 million), respectively. Changes in fair value of
the conversion option generated a gain during the nine-month period ended September 30, 2017 of U.S.$2 million (Ps38 million), which
was recognized in the statement of operations for the period.
Foreign exchange forward contracts. As of December 31, 2016 and September 30, 2017, we held foreign exchange forward
contracts matured in 2017 to hedge the U.S. Dollar value of future proceeds in other currencies from expected sale of assets. See note
4A to our audited consolidated financial statements included in the 2016 Annual Report. Changes in the estimated fair value of these
instruments, including the effects resulting from positions entered and settled during each period, generated losses of U.S.$19 million
(Ps357 million) for the nine-month period ended September 30, 2016 and gains of U.S.$5 million (Ps91 million) for the same period in
2017, each recognized within “Other financial income (expense), net.”
In addition, during 2017, we negotiated foreign exchange forwards contract to hedge our exposure to currency translation effects
arising from certain investments in foreign subsidiaries. These contracts have been documented as a net investment hedge. As of
September 30, 2017, the fair value of these foreign exchange forward contracts represented a liability of approximately U.S.$28 million
(Ps511 million). Changes in fair value are recognized through other comprehensive income. For the nine-month period ended
September 30, 2017, changes in the estimated fair value of these instruments, generated losses of U.S.$71 (Ps1,340), recognized within
stockholders’ equity.
As described above, during 2017, we negotiated foreign exchange forward contracts to hedge our exposure to currency translation
effects arising from certain investments in foreign subsidiaries. Under these contracts, there is a direct relationship in the change in the
fair value of the derivative with the change in the Mexican Peso exchange rate. As of September 30, 2017, the potential change in the
fair value of these forward contracts that would result from a hypothetical, instantaneous appreciation of 10% in the Mexican Peso
exchange rate, with all variables held constant, would be a reduction of our stockholder’s equity by approximately U.S.$106 million (Ps
1,943 million) as a result of additional negative changes in fair value associated with such forward contracts. A 10% hypothetical
depreciation in the Mexican Peso exchange rate would generate approximately the opposite effects.
Fuel price hedging. As of December 31, 2016 and September 30, 2017, we maintained forward contracts negotiated to hedge the
price of diesel fuel in several countries in 2016 and 2017 for aggregate notional amounts of U.S.$44 million (Ps912 million) and
U.S.$54 million (Ps986 million), respectively, with an estimated fair value representing an asset of U.S.$4 million (Ps75 million) for the
nine-month period ended September 30, 2016 and an estimated fair value representing an asset of U.S.$5 million (Ps91 million) for the
same period in 2017. By means of these contracts, for own consumption only, we fixed the fuel component of the market price of diesel
over certain volumes representing a portion of the estimated diesel consumption in such operations. These contracts have been
designated as cash flow hedges of diesel fuel consumption, and as such, changes in fair value are recognized temporarily through other
comprehensive income (loss), and are recycled to operating expenses as the related diesel volumes are consumed. For the nine-month
periods ended September 30, 2016 and 2017, changes in fair value of these contracts recognized in other comprehensive income (loss)
represented gains of U.S.$2 million (Ps35 million) and losses of U.S.$2 million (Ps30 million), respectively.
In addition, as of December 31, 2016 and September 30, 2017, we held forward contracts negotiated in 2016 to hedge the price of
coal, as solid fuel, for aggregate notional amounts of U.S.$33 million (Ps684 million) and U.S.$20 million (Ps365 million),
respectively, and an estimated fair value representing an asset of U.S.$2 million (Ps39 million) for the nine-month period ended
September 30, 2016 and an estimated fair value representing an asset of U.S.$7 million (Ps128 million) for the same period in 2017. By
means of these contracts, for own consumption only, we fixed the price of coal over certain volumes representing a portion of the
estimated coal consumption in our applicable operations. These contracts have been designated as cash flow hedges of coal
consumption, and as such, changes in fair value are recognized temporarily through other comprehensive income (loss), and are
recycled to operating expenses as the related coal volumes are consumed. For the nine-month periods ended September 30, 2016 and
2017, changes in fair value of these contracts recognized in other comprehensive income (loss) represented gains of U.S.$1 million
(Ps18 million) and losses of U.S.$1 million (Ps18 million), respectively.
48

Interest Rate Risk, Foreign Currency Risk and Equity Risk
Interest Rate Risk. The table below presents tabular information of our fixed and floating rate long-term foreign currency-
denominated debt as of September 30, 2017. Average floating interest rates are calculated based on forward rates in the yield curve as
of September 30, 2017. Future cash flows represent contractual principal payments. The fair value of our floating rate long-term debt is
determined by discounting future cash flows using borrowing rates available to us as of September 30, 2017 and is summarized as
follows:
Expected maturity dates as of September 30, 2017
Long-Term Debt(1)2017 2018 2019 2020 After 2021 Total Fair Value
(In millions of U.S. Dollars, except percentages)
Variable rate U.S.$— 314 — 514 2,236 U.S.$3,064 U.S.$3,178
Average interest rate — 6.03% 1.32% 3.14% 3.21%
Fixed rate U.S.$— — 604 — 5,965 U.S.$6,569 U.S.$7,880
Average interest rate — 4.12% 6.50% 4.12% 5.98%
(1) The information above includes the current maturities of the long-term debt. Total long-term debt as of September 30, 2017 does
not include our other financial obligations and the Perpetual Debentures for an aggregate amount of approximately
U.S.$2,095 million (Ps38,241 million) issued by consolidated entities. See note 12A to our unaudited condensed consolidated
financial statements for the nine-month periods ended September 30, 2016 and 2017 included herein.
As of September 30, 2017, we were subject to the volatility of floating interest rates, which, if such rates were to increase, may
adversely affect our financing cost and our net income. As of September 30, 2017, 30% of our foreign currency-denominated long-term
debt bears floating rates at a weighted average interest rate of LIBOR plus 296 basis points. As of September 30, 2016, 28% of our
foreign currency-denominated long-term debt bears floating rates at a weighted average interest rate of LIBOR plus 306 basis points. As
of September 30, 2016 and 2017, if interest rates at that date had been 0.5% higher, with all other variables held constant, CEMEX’s net
income for the nine-month periods ended September 30, 2016 and 2017 would have been reduced by approximately U.S.$13 million
(Ps242 million) and U.S.$15 million (Ps298 million), respectively, as a result of higher interest expense on variable-rate debt. However,
this analysis does not include the interest rate swaps held by CEMEX during the nine-month periods ended September 30, 2016 and
2017. See note 12B to our unaudited condensed consolidated financial statements included herein.
Foreign Currency Risk. Due to our geographic diversification, our revenues are generated in various countries and settled in
different currencies. However, some of our production costs, including fuel and energy, and some of our cement prices, are periodically
adjusted to take into account fluctuations in the U.S. Dollar/Mexican Peso exchange rate. For the nine-month period ended
September 30, 2017, approximately 21% of our net sales, before eliminations resulting from consolidation, were generated in Mexico,
24% in the United States, 7% in the United Kingdom, 6% in France, 4% in Germany, 3% in Spain, 5% in the Rest of Europe, 4% in
Colombia, 9% in the Rest of SAC, 3% in Egypt, 5% in the Rest of Asia, Middle East and Africa and 8% from our Other operations.
Foreign exchange gains and losses occur by monetary assets or liabilities in a currency different from its functional currency, and
are recorded in the consolidated statements of operations, except for exchange fluctuations associated with foreign currency
indebtedness directly related to the acquisition of foreign entities and related parties’ long-term balances denominated in foreign
currency, for which the resulting gains or losses are reported in other comprehensive income (loss). As of September 30, 2016 and
2017, excluding from the sensitivity analysis the impact of translating the net assets of foreign operations into our reporting currency, a
hypothetical 10% strengthening of the U.S. Dollar against the Mexican Peso, with all other variables held constant, would have
increased our net income for the nine-month periods ended September 30, 2016 and 2017 by approximately U.S.$125 million (Ps2,425
million) and U.S.$146 million (Ps2,666 million), respectively, as a result of higher foreign exchange losses on our dollar-denominated
net monetary liabilities held in consolidated entities with other functional currencies. Conversely, a hypothetical 10% weakening of the
U.S. Dollar against the Mexican Peso would have had the opposite effect.
As of September 30, 2017, approximately 69% of our total debt plus other financial obligations was U.S. Dollar-denominated,
approximately 22% was Euro-denominated, approximately 5% was British Pounds-denominated, approximately 2% was Mexican Peso-
denominated and 2% were denominated in other currencies, which does not include approximately Ps8,149 million (U.S.$446 million)
of Perpetual Debentures; therefore, we had a foreign currency exposure arising from the debt plus other financial obligations
denominated in U.S. Dollars, and the debt and other financial obligations denominated in Euros, versus the currencies in which our
revenues are settled in most countries in which we operate. We cannot guarantee that we will generate sufficient revenues in U.S.
Dollars and Euros from our operations to service these obligations. As of September 30, 2016 and 2017, CEMEX had not implemented
any derivative financing hedging strategy to address this foreign currency risk.
49

Equity Risk. As described above, we have entered into equity forward contracts on GCC shares, under these equity forward
contracts, there is a direct relationship in the change in the fair value of the derivative with the change in price of the underlying share.
Upon liquidation, the equity forward contracts provide for cash settlement and the effects are recognized in the statement of operations
as part of “Other financial income, net” in our unaudited condensed consolidated financial statements included herein.
As of September 30, 2017, the potential change in the fair value of CEMEX’s forward contracts in GCC’s shares that would result
from a hypothetical, instantaneous decrease of 10% in the market price of common stock of GCC, with all other variables held constant,
our net income for as of September 30, 2017 would have reduced by approximately U.S.$16 million (Ps291 million), as a result of
additional negative changes in fair value associated with such forward contracts. A 10% hypothetical increase in the common stock of
GCC price would have generated approximately the opposite effects.
The changes in fair value of our embedded conversion options in the November 2019 Mandatory Convertible Mexican Peso Notes
denominated in a currency other than the functional issuer’s currency affect profit or loss, they do not imply any risk or variability in
cash flows, considering that through their exercise, we will settle a fixed amount of debt with a fixed amount of shares. As of
September 30, 2017, the potential change in the fair value of these embedded conversion options in the November 2019 Mandatory
Convertible Mexican Peso Notes that would result from a hypothetical, instantaneous increase of 10% in the market price of CEMEX,
S.A.B. de C.V.’s CPOs, with all other variables held constant, would have been a loss of approximately U.S.$12 million (Ps220
million), as a result of additional negative changes in fair value associated with this option. A 10% hypothetical instantaneous decrease
in the CPO price would generate approximately the opposite effect.
Liquidity Risk. We are exposed to risks from changes in foreign currency exchange rates, prices and currency controls, interest
rates, inflation, governmental spending, social instability and other political, economic and/or social developments in the countries in
which we operate, any one of which may materially affect our results and reduce cash from operations. As of September 30, 2017, we
had approximately U.S.$1,135 million (Ps20,714 million) available in our committed revolving credit tranche under the 2017 Credit
Agreement.
Investments, Acquisitions and Divestitures
The transactions described below represent our principal investments, acquisitions and divestitures completed during the nine-
month period ended September 30, 2017.
Investments and Acquisitions
On January 24, 2017, Sierra Trading (“Sierra”), which is a wholly-owned CEMEX España subsidiary, announced that, having
received a foreign investment license from the Trinidad and Tobago Ministry of Finance, all terms and conditions had been complied
with or waived and the offer and takeover bid (the “Offer”) and the take-over bid to all shareholders that took place on December 5,
2016, had accordingly been declared unconditional. In addition, such Offer closed in Jamaica on February 7, 2017. Sierra acquired all
Trinidad Cement Limited (“TCL”) shares deposited pursuant to the Offer up to the maximum number of the offered shares. TCL shares
deposited in response to the Offer together with Sierra’s existing shareholding in TCL represented approximately 69.83% of the
outstanding TCL shares. The total consideration paid by Sierra for the TCL shares was approximately U.S.$86 million. After conclusion
of the Offer, CEMEX consolidates TCL and its subsidiaries, including Caribbean Cement Company in Jamaica, for financial reporting
purposes beginning February 1, 2017.
Divestitures
On June 30, 2017, we announced that one of our subsidiaries in the United States closed the divestment of its Pacific Northwest
Materials Business consisting of aggregate, asphalt and ready-mix concrete operations in Oregon and Washington to Cadman Materials,
Inc., part of Lehigh Hanson, Inc. and the U.S. subsidiary of Heidelberg Cement Group.
On January 31, 2017, after the satisfaction of certain conditions precedent including approval from regulators, we announced the
closing of the sale of the Concrete Pipe Business in the United States to Quikrete for approximately U.S.$500 million plus an additional
U.S.$40 million contingent consideration based on future performance.
On May 26, 2016, we closed the sale of our operations in Bangladesh and Thailand to Siam City Cement Public Company Ltd. for
approximately U.S.$70 million.
50

INDEX TO CONDENSED CONSOLIDATED FINANCIAL STATEMENTS
CEMEX, S.A.B. de C.V. and Subsidiaries:
Condensed Consolidated Statements of Operations for the nine-month periods ended September 30, 2017 and 2016 F-2
Condensed Consolidated Statements of Comprehensive Income (Loss) for the nine-month periods ended September 30, 2017
and 2016 F-3
Condensed Consolidated Balance Sheets as of September 30, 2017 and December 31, 2016 F-4
Condensed Consolidated Statements of Cash Flows for the nine-month periods ended September 30, 2017 and 2016 F-5
Condensed Consolidated Statements of Changes in Stockholders’ Equity for the nine-month periods ended September 30, 2017
and 2016 F-6
Notes to the Condensed Consolidated Financial Statements F-7
F-1

CEMEX, S.A.B. DE C.V. AND SUBSIDIARIES
Condensed Consolidated Statements of Operations
(Millions of Mexican pesos, except for earnings per share)
For the nine-month period ended September 30,,
Note 2017 2016
Net sales Ps 192,595 186,288
Cost of sales (126,668) (120,221)
Gross profit 65,927 66,067
Administrative and selling expenses 4 (22,375) (22,115)
Distribution expenses (18,837) (17,589)
(41,212) (39,704)
Operating earnings before other income (expenses), net 24,715 26,363
Other income (expenses), net 5 1,377 (1,507)
Operating earnings 26,092 24,856
Financial expense (15,128) (16,558)
Financial income and others, net 6 2,153 3,582
Share of profit of equity accounted investees 385 553
Income before income tax 13,502 12,433
Income tax 14 1,311 (2,251)
Net income from continuing operations 14,813 10,182
Discontinued operations, net of tax 3A 3,503 555
CONSOLIDATED NET INCOME FOR THE PERIOD 18,316 10,737
Non-controlling interest net income for the period 15B (1,087) (987)
CONTROLLING INTEREST NET INCOME FOR THE PERIOD Ps 17,229 9,750
BASIC EARNINGS PER SHARE Ps 0.38 0.22
BASIC EARNINGS PER SHARE OF CONTINUING OPERATIONS 0.30 0.21
DILUTED EARNINGS PER SHARE Ps 0.37 0.22
DILUTED EARNINGS PER SHARE OF CONTINUING OPERATIONS 0.30 0.21
The accompanying notes are part of these condensed consolidated financial statements.
F-2

CEMEX, S.A.B. DE C.V. AND SUBSIDIARIES
Condensed Consolidated Statements of Comprehensive Income (Loss)
(Millions of Mexican pesos)
For the nine-month period ended September 30,
Note 2017 2016
CONSOLIDATED NET INCOME FOR THE PERIOD Ps 18,316 10,737
Items that will be reclassified subsequently to profit or loss when specific conditions are met
Effects from available-for-sale investments and hedge derivatives (1,262) 228
Currency translation of foreign subsidiaries (20,731) 2,215
Income tax recognized directly in other comprehensive income 649 475
Other comprehensive income (loss) for the period (21,344) 2,918
TOTAL COMPREHENSIVE INCOME (LOSS) FOR THE PERIOD (3,028) 13,655
Non-controlling interest comprehensive income (loss) for the period (1,766) 3,439
CONTROLLING INTEREST COMPREHENSIVE INCOME (LOSS) FOR THE PERIOD Ps (1,262) 10,216
Out of which:
COMPREHENSIVE INCOME (LOSS) OF DISCONTINUED OPERATIONS 5,766 2,918
COMPREHENSIVE INCOME (LOSS) OF CONTINUING OPERATIONS (7,028) 7,298
The accompanying notes are part of these condensed consolidated financial statements.
F-3

CEMEX, S.A.B. DE C.V. AND SUBSIDIARIES
Condensed Consolidated Balance Sheets
(Millions of Mexican pesos)
September 30, December 31,
Note 2017 2016
ASSETS
CURRENT ASSETS
Cash and cash equivalents 7 Ps 8,203 11,616
Trade accounts receivable, net 8 31,566 30,160
Other accounts receivable 4,178 5,238
Inventories, net 18,093 18,098
Assets held for sale 3A 1,543 21,031
Other current assets 9 2,382 2,298
Total current assets 65,965 88,441
NON-CURRENT ASSETS
Equity accounted investees 10 8,027 10,488
Other investments and non-current accounts receivable 10 4,988 7,122
Property, machinery and equipment, net 11 215,931 230,133
Goodwill and intangible assets, net 218,725 247,506
Deferred income taxes 19,172 16,038
Total non-current assets 466,843 511,287
TOTAL ASSETS Ps 532,808 599,728
LIABILITIES AND STOCKHOLDERS’ EQUITY
CURRENT LIABILITIES
Short-term debt 12A Ps 8,110 1,222
Other financial obligations 12B 17,825 11,658
Trade payables 38,302 40,338
Income tax payable 4,257 5,441
Other current liabilities 13 20,828 22,530
Liabilities directly related to assets held for sale 3A — 815
Total current liabilities 89,322 82,004
NON-CURRENT LIABILITIES
Long-term debt 12A 175,802 235,016
Other financial obligations 12B 12,267 25,972
Employee benefits 22,016 23,365
Deferred income taxes 17,958 19,600
Other non-current liabilities 15,623 17,046
Total non-current liabilities 243,666 320,999
TOTAL LIABILITIES 332,988 403,003
STOCKHOLDERS’ EQUITY
Controlling interest:
Common stock and additional paid-in capital 15A 144,616 127,336
Other equity reserves 4,609 24,793
Retained earnings 6,181 1,612
Net income 17,229 14,033
Total controlling interest 172,635 167,774
Non-controlling interest and perpetual debentures 15B 27,185 28,951
TOTAL STOCKHOLDERS’ EQUITY 199,820 196,725
TOTAL LIABILITIES AND STOCKHOLDERS’ EQUITY Ps 532,808 599,728
The accompanying notes are part of these condensed consolidated financial statements.
F-4

CEMEX, S.A.B. DE C.V. AND SUBSIDIARIES
Condensed Consolidated Statements of Cash Flows
(Millions of Mexican pesos)
For the nine-month period ended September 30,
Note 2017 2016
OPERATING ACTIVITIES
Consolidated net income Ps 18,316 10,737
Discontinued operations, net of tax 3,503 555
Net income from continuing operations 14,813 10,182
Non-cash items:
Depreciation and amortization of assets 11,882 12,016
Impairment losses 571 797
Equity accounted investees (385) (553)
Other income (expenses), net (4,636) (250)
Financial items, net 12,975 12,976
Income taxes 14 (1,311) 2,251
Changes in working capital, excluding income tax (4,219) 3,500
Net cash flow provided by operating activities from continuing operations before
interest, coupons on perpetual debentures and income tax 29,690 40,919
Financial expense paid in cash including coupons on perpetual debentures 15B (12,652) (13,686)
Income taxes paid in cash (3,787) (4,266)
Net cash flow provided by operating activities of continuing operations 13,251 22,967
Net cash flow provided by operating activities of discontinued operations 144 873
Net cash flows provided by operating activities 13,395 23,840
INVESTING ACTIVITIES
Property, machinery and equipment, net 3, 11 (5,300) (6,559)
Disposal of subsidiaries and associates, net 23,978 1,424
Intangible assets and other deferred charges (1,119) (1,060)
Long term assets and others, net 87 (1,105)
Net cash flows provided by (used in) investing activities of continuing operations 17,646 (7,300)
Net cash flows used in investing activities of discontinued operations — (14)
Net cash flows provided by (used in) investing activities 17,646 (7,314)
FINANCING ACTIVITIES
Sale (acquisition) of non-controlling interests in subsidiaries (55) 9,777
Derivative instruments 596 232
Repayment of debt, net (33,925) (31,577)
Securitization of trade receivables 54 42
Non-current liabilities, net (2,149) (1,599)
Net cash flows used in financing activities (35,479) (23,125)
Decrease in cash and cash equivalents of continuing operations (4,582) (7,458)
Increase in cash and cash equivalents of discontinued operations 144 859
Cash conversion effect, net 1,025 2,827
Cash and cash equivalents at beginning of period 11,616 15,280
CASH AND CASH EQUIVALENTS AT END OF PERIOD 7 Ps 8,203 11,508
Changes in working capital, excluding income taxes:
Trade receivables, net Ps 584 (6,324)
Other accounts receivable and other assets 530 (1,478)
Inventories 1,831 (1,160)
Trade payables (4,732) 7,621
Other accounts payable and accrued expenses (2,432) 4,841
Changes in working capital, excluding income taxes Ps (4,219) 3,500
The accompanying notes are part of these condensed consolidated financial statements.
F-5
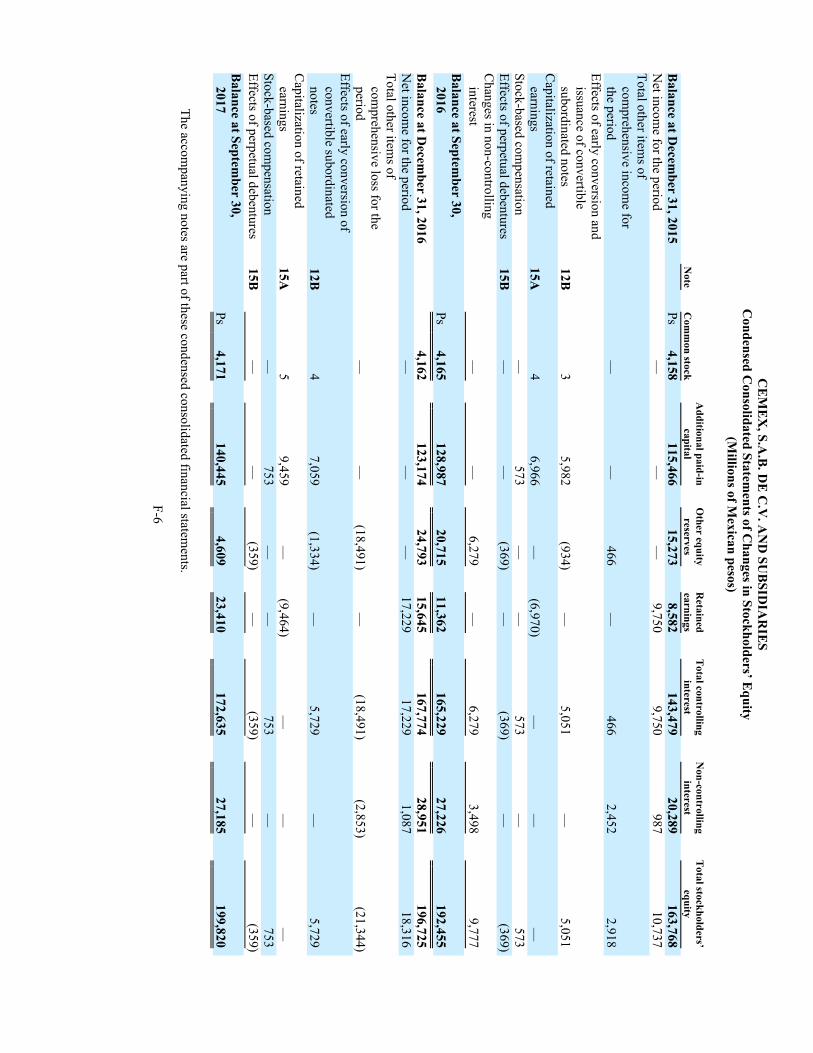
CE
ME
X, S
.A.B
. DE
C.V
. AN
D S
UB
SID
IA
RIE
S
Co
nd
en
sed
Co
nsolid
ated
Statem
en
ts o
f C
han
ges i
n S
to
ck
hold
ers’ E
qu
ity
(M
illion
s o
f M
ex
ican
pesos)
Note
Com
mon
stock
Ad
dition
al p
aid
-in
cap
ital
Oth
er e
qu
ity
reserv
es
Reta
in
ed
earn
in
gs
To
ta
l c
on
tro
llin
g
in
terest
Non
-co
ntro
llin
g
in
terest
To
ta
l s
tock
hold
ers’
eq
uity
Bala
nce a
t D
ecem
ber 3
1, 2
01
5P
s4,1
58
115,4
66
15,2
73
8,5
82
14
3,4
79
20,2
89
163,7
68
Net i
nco
me f
or t
he p
erio
d—
—
—
9,7
50
9,7
50
987
10,7
37
To
tal o
th
er i
tem
s o
f
com
prehensive i
ncom
e f
or
th
e p
erio
d—
—
466
—
466
2,4
52
2,9
18
Effects o
f e
arly
co
nversion
an
d
issuance o
f c
onvertible
subordinated n
otes
12B
35,9
82
(934
)
—
5,0
51
—
5,0
51
Capitalization o
f r
etain
ed
earnings
15A
46,9
66
—
(6,9
70)
—
—
—
Sto
ck-based c
om
pensation
—
57
3—
—
573
—
573
Effects o
f p
erp
etual d
ebentures
15B
—
—
(369
)
—
(369
)
—
(3
69)
Chang
es i
n n
on-con
tro
lling
in
terest
—
—
6,2
79
—
6,2
79
3,4
98
9,7
77
Balan
ce a
t S
ep
tem
ber 3
0,
20
16
Ps
4,1
65
128,9
87
20,7
15
11,3
62
16
5,2
29
27,2
26
192,4
55
Bala
nce a
t D
ecem
ber 3
1, 2
01
64,1
62
123,1
74
24,7
93
15,6
45
16
7,7
74
28,9
51
196,7
25
Net i
nco
me f
or t
he p
erio
d—
—
—
17,2
29
17,2
29
1,0
87
18,3
16
To
tal o
th
er i
tem
s o
f
com
prehensive l
oss f
or t
he
perio
d—
—
(1
8,4
91
)
—
(1
8,4
91
)
(2,8
53
)
(21,3
44)
Effects o
f e
arly
co
nversion
of
con
vertible s
ubordin
ated
no
tes
12B
47,0
59
(1,3
34
)
—
5,7
29
—
5,7
29
Capitalization o
f r
etain
ed
earnings
15A
59,4
59
—
(9,4
64)
—
—
—
Sto
ck-based c
om
pensation
—
75
3—
—
753
—
753
Effects o
f p
erp
etual d
ebentures
15B
—
—
(359
)
—
(359
)
—
(3
59)
Balan
ce a
t S
ep
tem
ber 3
0,
20
17
Ps
4,1
71
140,4
45
4,6
09
23,4
10
17
2,6
35
27,1
85
199,8
20
Th
e a
ccom
panying n
otes a
re p
art o
f t
hese c
ondensed c
onsolidated f
inancial s
tatem
ents.
F-6

CEMEX, S.A.B. DE C.V. AND SUBSIDIARIES
Notes to the Condensed Consolidated Financial Statements
As of September 30, 2017 and December 31, 2016 and for the nine-month period ended
September 30, 2017 and 2016
(Millions of Mexican pesos)
1. DESCRIPTION OF BUSINESS
CEMEX, S.A.B. de C.V., a public stock corporation with variable capital (S.A.B. de C.V.) organized under the laws of the United
Mexican States, or Mexico, is a holding company (parent) of entities whose main activities are oriented to the construction industry,
through the production, marketing, distribution and sale of cement, ready-mix concrete, aggregates and other construction materials.
CEMEX, S.A.B. de C.V. was founded in 1906 and was registered with the Mercantile Section of the Public Register of Property and
Commerce in Monterrey, N.L., Mexico in 1920 for a period of 99 years. In 2002, this period was extended to the year 2100. The shares
of CEMEX, S.A.B. de C.V. are listed on the Mexican Stock Exchange (“MSE”) as Ordinary Participation Certificates (“CPOs”). Each
CPO represents two series “A” shares and one series “B” share of common stock of CEMEX, S.A.B. de C.V. In addition, CEMEX,
S.A.B. de C.V.’s shares are listed on the New York Stock Exchange (“NYSE”) as American Depositary Shares (“ADSs”) under the
symbol “CX.” Each ADS represents ten CPOs.
The terms “CEMEX, S.A.B. de C.V.” or the “Parent Company” used in these accompanying notes to the condensed consolidated
financial statements refer to CEMEX, S.A.B. de C.V. without its consolidated subsidiaries. The terms the “Company” or “CEMEX”
refer to CEMEX, S.A.B. de C.V. together with its consolidated subsidiaries.
2. SIGNIFICANT ACCOUNTING POLICIES
The accounting policies that were applied to these condensed consolidated financial statements of September 30, 2017, are the same as
those applied by CEMEX in its consolidated financial statements as at and for the year ended December 31, 2016. No newly IFRSs
have been adopted by CEMEX during 2017, however, there are various IFRS issued at the date of these financial statements, which
have not yet been adopted, which are described below:
IFRS 9, Financial Instruments: classification and measurement (“IFRS 9”): Among other changes in presentation rules, measurement
and hedging activities, which have no material impact on CEMEX’s financial statements, under the impairment model in IFRS 9, it is
not necessary that a credit event should occur to recognize credit losses on financial assets, instead the entity must recognize expected
credit losses and changes in expected credit losses through the income statement. In this regard, CEMEX is working on an expected
credit loss model applicable to its trade accounts receivable that considers the historical performance, as well as the credit risk of each
group of customers, which will be ready for the full prospective adoption of IFRS 9 on January 1, 2018, including hedge accounting.
The adoption of IFRS 9 will significantly increase the internal processes for the generation of information and accounting records,
however, CEMEX does not expect any significant effect on its operation results, financial situation and compliance of contractual
obligations (financial restrictions) due to the adoption effects. Considering the prospective adoption of IFRS 9 as of January 1, 2018,
there may be a lack of comparability of the financial information prepared without the application of the retrospective method for more
than one period, according to the options provided in the standard itself, beginning January 1, 2018, with the information disclosed in
prior years, however, no significant effect is expected.
IFRS 15, Revenues from contracts with customers (“IFRS 15”): CEMEX started in 2015 to evaluate the impacts of IFRS 15 on the
accounting and disclosures of its revenues. As of the reporting date, CEMEX has analyzed its contracts with customers in all the
countries in which it operates in order to identify the different performance obligations and other offerings (discounts, loyalty programs,
etc.) included in such contracts, among other aspects, aimed to determine potential differences in the accounting recognition of revenue
with respect to current IFRS. In addition, key personnel have been trained in the new standard with the support of external experts, and
an online training course has been developed. Preliminary, considering its assessments as of the reporting date, the nature of the
business, its main transactions and current accounting policies, and the fact that the transaction price is allocated to goods delivered or
services rendered to customers when customers have assumed the risk of loss, CEMEX does not expect a significant effect on revenue
recognition due to the adoption of IFRS 15. As of September 30, 2017, CEMEX has completed its theoretical assessment and training
for key personnel, and has proceeded to quantify any adjustments that would be necessary if certain portion of the revenue that currently
is being recognized at the transaction date or deferred during time, as applicable, should otherwise be recognized differently upon the
adoption of IFRS 15. As of September 30, 2017, the quantified effects refer mainly to reclassifications to align with IFRS 15 accounts
and minor adjustments for sales discounts. Beginning January 1, 2018, CEMEX plans to adopt IFRS 15 using the full retrospective
approach. The adoption of IFRS 15 will significantly increase the internal processes for generating information and accounting records,
however, CEMEX does not expect any significant effect on its operation results, financial situation and compliance with contractual
obligations (financial restrictions) due to adoption effects. Considering the full retrospective adoption of IFRS 15 beginning January 1,

2018, according to the options foreseen in the standard, there will not be lack of comparability of the financial information prepared in
prior years.
F-7

CEMEX, S.A.B. DE C.V. AND SUBSIDIARIES
Notes to the Condensed Consolidated Financial Statements
As of September 30, 2017 and December 31, 2016 and for the nine-month period ended
September 30, 2017 and 2016
(Millions of Mexican pesos)
IFRS 16, Leases (“IFRS 16”): As of the reporting date, CEMEX has performed an assessment of its main outstanding operating and
finance lease contracts, in order to inventory the most relevant characteristics of such contracts (types of assets, committed payments,
maturity dates, renewal clauses, etc.). During 2017, CEMEX expects to define its future policy under IFRS 16 in connection with the
exception for short-term leases and low-value assets, in order to set the basis and be able to quantify the required adjustments for the
proper recognition of the assets for the “right-of-use” and the corresponding financial liabilities, with a plan to adopt IFRS 16 on
January 1, 2019 full retrospectively. Preliminary, based on its assessment as of the reporting date, CEMEX considers that upon the
adoption of IFRS 16, most of its outstanding operating leases will be recognized on balance sheet, significantly increasing assets and
liabilities, as well as amortization and interest, but without significant initial effect on net assets. The adoption of IFRS 16 will
significantly increase the internal processes for generating information and accounting records, however, CEMEX does not expect any
significant effect on its operation results, financial situation and compliance with contractual obligations (financial restrictions) due to
the adoption effects. Considering the full retrospective adoption of IFRS 16 as of January 1, 2019, according to the options foreseen in
the standard, beginning January 1, 2019, there will not be lack of comparability of the financial information prepared in prior years.
2A) BASIS OF PRESENTATION AND DISCLOSURE
The condensed consolidated financial statements were prepared in accordance with International Accounting Standards - IAS 34
Interim Financial Reporting (“IAS 34”). Selected explanatory notes are included to explain events and transactions that are significant
to an understanding of the changes in financial position and performance of CEMEX since the last annual consolidated financial
statements as of and for the year ended 31 December 2016.
The accompanying condensed consolidated balance sheet as of September 30, 2017, as well as the related condensed consolidated
statements of operations, comprehensive (loss) income, cash flows and changes in stockholders’ equity for the nine-month periods
ended September 30, 2017 and 2016, and their related disclosures included in these notes, are unaudited. The presentation currency for
these condensed consolidated financial statements is the Mexican Peso.
Definition of terms
When reference is made to pesos or “Ps,” it means Mexican pesos. Except when specific references are made to “earnings per share”
and “prices per share,” the amounts in the condensed consolidated financial statements and the accompanying notes are stated in
millions of pesos. When reference is made to “US$” or dollars, it means millions of dollars of the United States of America (“United
States”). When reference is made to “£” or pounds, it means millions of British pounds sterling. When reference is made to “€” or
Euros, it means millions of the currency in circulation in a significant number of European Union countries.
When it is deemed relevant, certain amounts presented in the notes to the condensed consolidated financial statements include between
parentheses a convenience translation into dollars, into pesos, or both, as applicable. These translations should not be construed as
representations that the amounts in pesos or dollars, as applicable, actually represent those peso or dollar amounts or could be converted
into pesos or dollars at the rate indicated. As of September 30, 2017 and December 31, 2016, translations of pesos into dollars and
dollars into pesos, were determined for balance sheet amounts using the closing exchange rates of Ps18.25 and Ps20.72 pesos per dollar,
respectively, and for statements of operations amounts, using the average exchange rates of Ps18.80 and Ps18.27 pesos per dollar for the
nine-month period ended September 30, 2017 and 2016, respectively. When the amounts between parentheses are the peso and the
dollar, the amounts were determined by translating the foreign currency amount into dollars using the closing exchange rates at end of
the period, and then translating the dollars into pesos as previously described.
F-8

CEMEX, S.A.B. DE C.V. AND SUBSIDIARIES
Notes to the Condensed Consolidated Financial Statements
As of September 30, 2017 and December 31, 2016 and for the nine-month period ended
September 30, 2017 and 2016
(Millions of Mexican pesos)
2B) TRANSLATION OF FOREIGN CURRENCY FINANCIAL STATEMENTS
The most significant closing exchange rates and the approximate average exchange rates for condensed consolidated balance sheet
accounts and condensed consolidated income statement accounts, respectively, as of September 30, 2017 and December 31, 2016, as
well as the approximate average exchange rates for the nine-month periods ended as of September 30, 2017 and 2016, were as follows:
As of September 30, 2017 As of December 31, 2016 As of September 30, 2016
Currency Closing Average Closing Average
Dollar 18.2500 18.8000 20.7200 18.2700
Euro 21.5624 21.0291 21.7945 20.3619
Sterling Pound 24.4514 24.1514 25.5361 25.1925
Colombian Peso 0.0062 0.0064 0.0069 0.0060
Egyptian Pound 1.0336 1.0558 1.1234 2.1182
Philippine Peso 0.3591 0.3737 0.4167 0.3877
The financial statements of foreign subsidiaries are initially translated from their functional currencies into dollars and subsequently
into pesos. Therefore, the foreign exchange rates presented in the table above between the functional currency and the peso represent
the exchange rates resulting from this methodology. The peso to U.S. dollar exchange rate used by CEMEX is an average of free market
rates available to settle its foreign currency transactions. No significant differences exist, in any case, between the foreign exchange
rates used by CEMEX and those exchange rates published by the Mexican Central Bank.
2C) USE OF ESTIMATES AND CRITICAL ASSUMPTIONS
The preparation of the condensed consolidated financial statements requires management to make estimates and assumptions that affect
reported amounts of assets and liabilities and the disclosure of contingent assets and liabilities at the date of the condensed consolidated
financial statements, as well as the reported amounts of revenues and expenses during the period. These assumptions are reviewed on an
ongoing basis using available information. Actual results could differ from these estimates.
The main items subject to estimates and assumptions made by management include, among others, impairment tests of long-lived
assets, allowances for doubtful accounts and inventories obsolescence, recognition of deferred income tax assets, as well as the
measurement of financial instruments at fair value, and the assets and liabilities related to employee benefits.
In preparing these condensed consolidated financial statements, significant judgments made by management in applying CEMEX’s
accounting policies and the key sources of information and assumptions were the same as those that applied to the consolidated
financial statements as of and for the year ended December 31, 2016.
3. DISCONTINUED OPERATIONS, SALE OF OTHER DISPOSAL GROUPS AND SELECTED FINANCIAL
INFORMATION BY GEOGRAPHIC OPERATING SEGMENT
3A) DISCONTINUED OPERATIONS
On June 30, 2017, CEMEX announced that one of its subsidiaries in the United States closed the divestment of its Pacific Northwest
Materials Business consisting of aggregate, asphalt and ready-mix concrete operations in Oregon and Washington to Cadman Materials,
Inc., subsidiary of Lehigh Hanson, Inc. and the U.S. subsidiary of HeidelbergCement Group, for approximately US$150. CEMEX
determined a net gain on disposal of these assets for approximately US$22 recognized during 2017 as part of discontinued operations,
which included a proportional allocation of goodwill for approximately US$73.
In relation to the agreement signed between CEMEX and Duna-Dráva on August 12, 2015 for the sale of its Croatian operations,
including assets in Bosnia and Herzegovina, Montenegro and Serbia, on April 5, 2017, CEMEX announced that the European
Commission (“EC”) issued a decision that ultimately did not allowed CEMEX to sell its operations in Croatia to Duna-Dráva Cement
Kft. As one of the closing conditions under the corresponding sale purchase agreement was to receive the necessary clearance from the
EC, the transaction will not close and CEMEX will maintain its operations in Croatia. For the year ended as of December 31, 2016,
CEMEX reclassified its Croatian Operations from discontinued operations to a line-by-line presentation in the condensed balance sheet.

For the nine-month periods ended September 30, 2017 and 2016, the Croatian Operations are presented line-by-line in the condensed
statements of operations and statements of cash flows.
In connection with the sale of the Concrete Pipe Business in the United States to Quikrete, on January 31, 2017, after the satisfaction of
certain conditions precedent including approval from regulators, CEMEX announced the closing of the transaction for approximately
US$500 plus an additional US$40 contingent consideration based on future performance. CEMEX determined a net gain on disposal of
these assets for approximately US$148 recognized during 2017 as part of discontinued operations, which included a proportional
allocation of goodwill for approximately US$260.
F-9

CEMEX, S.A.B. DE C.V. AND SUBSIDIARIES
Notes to the Condensed Consolidated Financial Statements
As of September 30, 2017 and December 31, 2016 and for the nine-month period ended
September 30, 2017 and 2016
(Millions of Mexican pesos)
Discontinued operations - Continued
On May 26, 2016, CEMEX closed the sale of its operations in Bangladesh and Thailand to Siam City Cement Public Company Ltd. for
approximately US$70 (Ps1,450), generating a net gain on sale of approximately US$24 (Ps424) and included in the statement of
operations in 2016 within the line item “Discontinued operations” , which includes the reclassification of foreign currency translation
gains associated with these operations accrued in equity until disposal for approximately US$7 (Ps122).
The operations in the Concrete Pipe Business for the one-month period ended January 31, 2017 and the nine-month period ended
September 30 2016; Pacific Northwest Materials Business for the six-month period ended June 30, 2017 and the nine-month period
ended September 30, 2016; and Bangladesh and Thailand for the period from January 1 to May 26, 2016, were reclassified to the single
line item “Discontinued operations”. The following table presents condensed combined information of the statement of operations of
CEMEX discontinued operations for the nine-month period ended September 30, 2017 and 2016, were as follows:
2017 2016
Sales Ps 1,549 6,819
Cost of sales and operating expenses (1,531) (6,509)
Other income (expenses), net 14 (1)
Interest expenses, net and others (3) (71)
Earning before income tax 29 238
Income tax — (78)
Net income 29 160
Net income of non-controlling interest — —
Net income of controlling interest Ps 29 160
3B) OTHER DISPOSALS GROUPS
Other disposal groups do not represent the disposal of an entire sector or line of business and, due to the remaining ongoing activities
and the relative size, are not considered discontinued operations and were consolidated by CEMEX line-by-line in the condensed
statement of operations for all reported periods.
In connection to the CEMEX agreement of December 2, 2016, for the definite transfer of its assets and activities related to the
ready-mix concrete pumping in Mexico to Cementos Españoles de Bombeo, S. de R.L., subsidiary in Mexico of Pumping Team S.L.L.
(“Pumping Team”), specialist in the supply of ready-mix concrete pumping services based in Spain. On April 28, 2017, CEMEX,
received the Mexican authorities approval and closed the transaction with Pumping Team. CEMEX received approximately Ps1,649,
which includes the sale of fixed assets upon closing of the transaction for approximately Ps309 plus administrative and client and
market development services, as well as the lease of facilities that CEMEX will supply to Pumping Team over a period of ten years
with the possibility to extend for three additional years, for an aggregate initial amount of approximately Ps1,340, plus a contingent
revenue subject to results for up to Ps557 linked to annual metrics beginning in the first year and up to the fifth year of the agreement.
In connection with the agreement for the sale of CEMEX’s Fairborn, Ohio cement plant and cement terminal in Columbus, Ohio to
Eagle Materials Inc., on February 10, 2017, CEMEX announced that one of its subsidiaries in the United States closed the divestment of
such assets to a subsidiary of Eagle Materials, Inc. for approximately US$400. CEMEX determined a net gain on disposal of these
assets for approximately US$188 recognized during 2017 as part of Other expenses, net, which included a proportional allocation of
goodwill for approximately US$211.
3C) SELECTED FINANCIAL INFORMATION BY GEOGRAPHIC OPERATING SEGMENT
Geographic operating segments represent the components of CEMEX that engage in business activities from which CEMEX may earn
revenues and incur expenses, whose operating results are regularly reviewed by the entity’s top management to make decisions about
resources to be allocated to the segments and assess their performance, and for which discrete financial information is available.

The financial information by geographic operating segment reported in the tables below for the nine-month period ended September 30,
2017 and 2016 and for the year ended as of December 31, 2016 has been restated in order to give effect to the discontinued operations
described in note 3A. The Company’s operations are organized into five geographical regions, also each under the supervision of a
regional president, as follows: 1) Mexico, 2) United States, 3) Europe, 4) South, Central America and the Caribbean (“SAC”), and 5)
Asia, Middle East and Africa.
F-10

CEMEX, S.A.B. DE C.V. AND SUBSIDIARIES
Notes to the Condensed Consolidated Financial Statements
As of September 30, 2017 and December 31, 2016 and for the nine-month period ended
September 30, 2017 and 2016
(Millions of Mexican pesos)
Selected financial information by geographic operating segment - Continued
Selected information of the condensed consolidated statements of operations by geographic operating segment for the nine-month
period ended September 30, 2017 and 2016 was as follows:
2017
Net sales
(including related
parties)
Less:
Related
parties Net sales
Operating
EBITDA
Less:
depreciation
and
amortization
Operating
earnings
before other
income
(expenses), net
Other
income
(expenses),
net
Financial
expense
Other
financing
items, net
Mexico Ps 43,501 787 42,714 16,039 1,684 14,355 (454) (298) (720)
United States 49,543 — 49,543 7,811 4,721 3,090 3,652 (449) (141)
Europe
United Kingdom 15,207 — 15,207 2,128 733 1,395 158 (62) (297)
Germany 7,328 1,012 6,316 473 361 112 (17) (8) (45)
France 11,829 — 11,829 662 390 272 (68) (45) 14
Spain 5,164 743 4,421 206 473 (267) (309) (26) (23)
Rest of Europe 1 10,836 666 10,170 1,375 770 605 11 (30) 13
South, Central America
and the Caribbean
Colombia 8,132 — 8,132 1,570 355 1,215 (302) (72) 34
Rest of SAC 2 17,835 1,047 16,788 5,189 886 4,303 (72) (267) 41
Asia, Middle East and
Africa
Egypt 2,736 — 2,736 534 219 315 (87) (48) 545
Philippines 6,289 — 6,289 1,093 370 723 15 (2) (36)
Rest of Asia, Middle East
and Africa 3 9,699 — 9,699 1,282 268 1,014 (176) (22) 6
Others 4 16,699 7,948 8,751 (1,765) 652 (2,417) (974) (13,799) 2,762
Continuing operations 204,798 12,203 192,595 36,597 11,882 24,715 1,377 (15,128) 2,153
Discontinued operations 1,549 — 1,549 60 42 18 14 (3) —
Total Ps 206,347 12,203 194,144 36,657 11,924 24,733 1,391 (15,131) 2,153
2016
Net sales
(including related
parties)
Less:
Related
parties Net sales
Operating
EBITDA
Less:
depreciation
and
amortization
Operating
earnings
before other
income
(expenses),
net
Other
income
(expenses),
net
Financial
expense
Other
financing
items, net
Mexico Ps 39,511 667 38,844 14,246 1,767 12,479 (402) (260) 1,457
United States 49,467 — 49,467 7,578 4,897 2,681 267 (334) (171)
Europe
United Kingdom 16,270 — 16,270 2,800 793 2,007 254 (60) (290)
Germany 6,972 1,060 5,912 342 335 7 (41) (8) (59)
France 10,746 — 10,746 531 380 151 5 (35) 11
Spain 5,057 673 4,384 684 501 183 (82) (22) (716)
Rest of Europe 1 9,492 654 8,838 1,251 731 520 (82) (35) 215
South, Central America and the
Caribbean
Colombia 9,346 1 9,345 3,221 352 2,869 (11) 44 (116)
Rest of SAC 2 14,633 1,292 13,341 4,656 681 3,975 (159) (41) 5
Asia, Middle East and Africa
Egypt 5,715 4 5,711 2,003 432 1,571 (184) (47) 122
Philippines 7,471 — 7,471 2,115 396 1,719 16 (6) (34)

Rest of Asia, Middle East and
Africa 3 8,805 9 8,796 1,153 192 961 (138) (17) 23
Others 4 13,830 6,667 7,163 (2,201) 559 (2,760) (950) (15,737) 3,135
Continuing operations 197,315 11,027 186,288 38,379 12,016 26,363 (1,507) (16,558) 3,582
Discontinued operations 6,819 — 6,819 902 592 310 (1) (24) (47)
Total Ps 204,134 11,027 193,107 39,281 12,608 26,673 (1,508) (16,582) 3,535
F-11

CEMEX, S.A.B. DE C.V. AND SUBSIDIARIES
Notes to the Condensed Consolidated Financial Statements
As of September 30, 2017 and December 31, 2016 and for the nine-month period ended
September 30, 2017 and 2016
(Millions of Mexican pesos)
Selected financial information by geographic operating segment - Continued
As of September 30, 2017 and December 31, 2016 selected segment information of condensed balance sheet by geographic operating
segment was as follows:
September 30, 2017
Equity
accounted
investees
Other
segment
assets
Total
assets
Total
liabilities
Net assets by
segment
Additions to
fixed assets
Mexico Ps 239 69,058 69,297 21,568 47,729 1,065
United States 1,438 249,450 250,888 28,434 222,454 2,054
Europe
United Kingdom 100 31,536 31,636 21,549 10,087 252
Germany 77 8,479 8,556 6,547 2,009 242
France 921 16,801 17,722 6,589 11,133 199
Spain (1) 25,162 25,161 3,259 21,902 157
Rest of Europe 1 272 20,130 20,402 5,813 14,589 251
South, Central America and the Caribbean
Colombia — 24,619 24,619 9,912 14,707 934
Rest of SAC 2 28 27,889 27,917 8,357 19,560 394
Asia, Middle East and Africa
Egypt 1 4,479 4,480 2,909 1,571 189
Philippines 6 10,275 10,281 2,251 8,030 339
Rest of Asia, Middle East and Africa 3 — 11,995 11,995 6,040 5,955 233
Others 4 4,946 23,365 28,311 209,760 (181,449) 94
Continuing operations 8,027 523,238 531,265 332,988 198,277 6,403
Assets held for sale and directly related liabilities — 1,543 1,543 — 1,543 —
Total Ps 8,027 524,781 532,808 332,988 199,820 6,403
December 31, 2016
Equity
accounted
investees
Other
segment
assets
Total
assets
Total
liabilities
Net assets by
segment
Additions to
fixed assets
Mexico Ps 490 70,012 70,502 20,752 49,750 1,651
United States 1,587 287,492 289,079 30,118 258,961 3,760
Europe
United Kingdom 104 32,469 32,573 22,914 9,659 599
Germany 74 8,396 8,470 6,694 1,776 507
France 909 16,855 17,764 6,829 10,935 379
Spain 13 27,251 27,264 3,206 24,058 490
Rest of Europe 1 280 20,381 20,661 5,333 15,328 440
South, Central America and the Caribbean
Colombia — 26,532 26,532 11,548 14,984 3,633
Rest of SAC 2 28 22,321 22,349 5,931 16,418 637
Asia, Middle East and Africa
Egypt 1 5,512 5,513 2,907 2,606 381
Philippines 6 12,308 12,314 2,696 9,618 341
Rest of Asia, Middle East and Africa 3 — 12,347 12,347 6,994 5,353 394
Others 4 6,996 26,333 33,329 276,266 (242,937) 67
Continuing operations 10,488 568,209 578,697 402,188 176,509 13,279
Assets held for sale and directly related liabilities — 21,031 21,031 815 20,216 (1)
Total Ps 10,488 589,240 599,728 403,003 196,725 13,278
F-12

CEMEX, S.A.B. DE C.V. AND SUBSIDIARIES
Notes to the Condensed Consolidated Financial Statements
As of September 30, 2017 and December 31, 2016 and for the nine-month period ended
September 30, 2017 and 2016
(Millions of Mexican pesos)
Selected financial information by geographic operating segment - Continued
Net sales by product and geographic operating segment for the nine-month period ended September 30, 2017 and 2016 were as follows:
2017 Cement Concrete Aggregates Others Eliminations Net sales
Mexico Ps31,456 10,787 2,512 8,490 (10,531) 42,714
United States 20,680 26,620 11,004 4,918 (13,679) 49,543
Europe
United Kingdom 3,703 5,638 5,897 6,008 (6,039) 15,207
Germany 2,672 3,393 1,552 1,680 (2,981) 6,316
France — 9,794 4,666 144 (2,775) 11,829
Spain 4,127 684 191 526 (1,107) 4,421
Rest of Europe 1 6,911 3,772 1,268 519 (2,300) 10,170
South, Central America and the Caribbean
Colombia 5,362 3,055 924 1,504 (2,713) 8,132
Rest of SAC 2 15,844 2,867 802 1,414 (4,139) 16,788
Asia, Middle East and Africa
Egypt 2,367 347 11 118 (107) 2,736
Philippines 6,130 57 123 40 (61) 6,289
Rest of Asia, Middle East and Africa 3 628 8,157 2,104 1,561 (2,751) 9,699
Others 4 — — — 16,702 (7,951) 8,751
Continuing operations 99,880 75,171 31,054 43,624 (57,134) 192,595
Discontinued operations — 525 340 686 (2) 1,549
Total Ps99,880 75,696 31,394 44,310 (57,136) 194,144
2016 Cement Concrete Aggregates Others Eliminations Net sales
Mexico Ps27,707 10,023 2,308 8,663 (9,857) 38,844
United States 21,203 26,720 11,372 5,540 (15,368) 49,467
Europe
United Kingdom 4,091 5,994 6,286 6,144 (6,245) 16,270
Germany 2,491 3,206 1,563 1,596 (2,944) 5,912
France — 8,793 4,175 176 (2,398) 10,746
Spain 4,266 620 135 339 (976) 4,384
Rest of Europe 1 6,126 3,271 1,064 403 (2,026) 8,838
South, Central America and the Caribbean
Colombia 6,687 3,393 1,023 1,264 (3,022) 9,345
Rest of SAC 2 12,502 2,639 647 427 (2,874) 13,341
Asia, Middle East and Africa
Egypt 5,002 756 18 182 (247) 5,711
Philippines 7,287 109 119 53 (97) 7,471
Rest of Asia, Middle East and Africa 3 673 7,583 1,815 1,063 (2,338) 8,796
Others 4 — — — 13,829 (6,666) 7,163
Continuing operations 98,035 73,107 30,525 39,679 (55,058) 186,288
Discontinued operations 422 1,007 588 4,822 (20) 6,819
Total Ps98,457 74,114 31,113 44,501 (55,078) 193,107
Footnotes to the geographic operating segment tables presented above:
1 The segment “Rest of Europe” refers primarily to operations in Ireland, the Czech Republic, Croatia, Poland, and Latvia, as well
as trading activities in Scandinavia and Finland.

2 The segment “Rest of South, Central America and the Caribbean” includes CEMEX’s operations in Costa Rica, Panama, Puerto
Rico, the Dominican Republic, Nicaragua, Trinidad and Tobago, Jamaica and other countries in the Caribbean, Guatemala and
small ready-mix concrete operations in Argentina.
3 The segment “Rest of Asia, Middle East and Africa” includes the operations in the United Arab Emirates and Israel.
4 This segment refers to: 1) cement trade maritime operations, 2) the subsidiary involved in the development of information
technology solutions (Neoris, N.V.), 3) the Parent Company and other corporate entities, and 4) other minor subsidiaries with
different lines of business.
F-13

CEMEX, S.A.B. DE C.V. AND SUBSIDIARIES
Notes to the Condensed Consolidated Financial Statements
As of September 30, 2017 and December 31, 2016 and for the nine-month period ended
September 30, 2017 and 2016
(Millions of Mexican pesos)
4. ADMINISTRATIVE AND SELLING EXPENSES
For the nine-month period ended September 30, 2017 and 2016, selling expenses included as part of the selling and administrative
expenses line item amounted to Ps4,846 and Ps4,981, respectively.
5. OTHER INCOME (EXPENSES), NET
Other income (expenses), net for the nine-month period ended in September 30, 2017 and 2016, consisted of the following:
2017 2016
Restructuring costs Ps (446) (506)
Impairment losses (571) (797)
Charitable contributions (100) (79)
Results from the sale of assets and others, net (note 3B) 2,494 (125)
Ps1,377 (1,507)
6. FINANCIAL INCOME AND OTHERS, NET
Financial income and others, net for the nine-month period ended in September 30, 2017 and 2016, is detailed as follows:
2017 2016
Financial income Ps 251 319
Results from financial instruments (note 10 and 12C) 3,802 395
Foreign exchange results (1,133) 3,649
Effects of net present value on assets and liabilities and others, net (767) (781)
Ps 2,153 3,582
The caption of Results from financial instruments includes the gain of approximately US$187 (Ps3,516), in connection with the sale of
common stock shares of Grupo Cementos de Chihuahua, S.A.B. de C.V. (note 10).
7. CASH AND CASH EQUIVALENTS
Consolidated cash and cash equivalents as of September 30, 2017 and December 31, 2016, consisted of:
September 30, 2017 December 31, 2016
Cash and bank accounts Ps 6,637 9,105
Fixed-income securities and other cash
equivalents 1,566 2,511
Ps 8,203 11,616
Based on net settlement agreements, as of September 30, 2017 and December 31, 2016 the balance of cash and cash equivalents
excludes deposits in margin accounts that guarantee several obligations of CEMEX for approximately Ps214 and Ps250, respectively,
which are offset against the corresponding CEMEX’s obligations with the counterparties.
8. TRADE ACCOUNTS RECEIVABLE, NET
Consolidated trade accounts receivable consisted of:
September 30, 2017 December 31, 2016
Trade accounts receivable Ps 33,800 32,356
Allowances for doubtful accounts (2,234) (2,196)

Ps 31,566 30,160
As of September 30, 2017 and December 31, 2016, trade accounts receivable include receivables of Ps12,737 (US$698), and Ps13,644
(US$658), respectively, that were sold under securitization programs for the sale of trade accounts receivable established in Mexico, the
United States, France and the United Kingdom. Under these programs, CEMEX effectively surrenders control associated with the trade
accounts receivable sold and there is no guarantee or obligation to reacquire the assets. However, CEMEX retains certain residual
interest in the programs and/or maintains continuing involvement with the accounts receivable; therefore, the amounts received are
recognized within “Other financial obligations.” Trade accounts receivable qualifying for sale exclude amounts over certain days past
due or concentrations over certain limits to any customer, according to the terms of the programs. The portion of the accounts
receivable sold maintained as reserves amounted to Ps2,283 as of September 30, 2017 and Ps2,549 as of December 31, 2016. The
discount granted to the acquirers of the trade accounts receivable is recorded as financial expense and amounted to approximately Ps214
(US$11) and Ps194 (US$11) for the nine-month period ended September 30, 2017 and 2016. The securitization programs outstanding
as of September 30, 2017 in Mexico, United States, France and the United Kingdom mature in March 2018.
F-14

CEMEX, S.A.B. DE C.V. AND SUBSIDIARIES
Notes to the Condensed Consolidated Financial Statements
As of September 30, 2017 and December 31, 2016 and for the nine-month period ended
September 30, 2017 and 2016
(Millions of Mexican pesos)
9. OTHER CURRENT ASSETS
As of September 30, 2017 and December 31, 2016, other current assets are mainly comprised of advance payments.
10. OTHER INVESTMENTS AND NON-CURRENT ACCOUNTS RECEIVABLE AND EQUITY ACCOUNTED
INVESTEES
On February 10 and September 28, 2017, CEMEX sold its shares of common stock of Grupo Cementos de Chihuahua, S.A.B. de C.V.
(“GCC”), which represented approximately 23% of the stockholders’ equity of GCC. The aggregate proceeds from the sale were
approximately US$378 (Ps7,106). Such sales resulted in a gain of approximately US$187 (Ps3,516), which were recognized into
Financial income and others, net in the profit and losses. As of September 30, 2017, CEMEX continues to have an approximate 20%
indirect interest in GCC through Camcem, S.A. de C.V., an entity that owns a majority interest in GCC and in which CEMEX has a
direct interest. After the sale of the GCC shares was completed, CEMEX also entered into forward contracts on GCC’s stock price, with
net cash settlement, but may be unwound earlier at CEMEX’s option. The forwards transactions have an 18-month tenor (note 12C).
On January 24, 2017, Sierra Trading (“Sierra”), which is an indirect subsidiary of CEMEX, communicated that having received the
Foreign Investment License from the Trinidad and Tobago Ministry of Finance, all terms and conditions had been complied with or
waived and the Offer and the take-over bid to all shareholders that took place on December 5, 2016, had accordingly been declared
unconditional. In addition, such Offer closed in Jamaica on February 7, 2017. Sierra acquired all Trinidad Cement Limited (“TCL”)
shares deposited pursuant to the Offer up to the maximum number of the Offered Shares. TCL shares deposited in response to the Offer
together with Sierra’s existing shareholding in TCL represented approximately 69.83% of the outstanding TCL shares. The total
consideration paid by Sierra for the TCL shares was approximately US$86. After conclusion of the Offer, CEMEX consolidates TCL
for financial reporting purposes beginning February 1, 2017.
During 2016, the Parent Company participated as shareholder in a share restructuring executed by Camcem, S.A. de C.V. (“Camcem”),
indirect parent company of Control Administrativo Mexicano, S.A. de C.V. (“Camsa”) and GCC, aimed to simplify its corporate
structure, by means of which, Imin de México, S.A. de C.V., intermediate holding company, Camsa and GCC were merged, prevailing
GCC as the surviving entity. As a result of the share restructuring, CEMEX’s 10.3% interest in Camcem and 49% interest in Camsa,
both before the restructuring, were exchanged on equivalent basis into a 40.1% interest in Camcem and a 23% interest in GCC, which
shares of the latest trade in the MSE.
11. PROPERTY, MACHINERY AND EQUIPMENT, NET
Consolidated property, machinery and equipment, net consisted of:
September 30, 2017 December 31, 2016
Land and mineral reserves Ps 87,870 97,218
Buildings 49,797 51,740
Machinery and equipment 225,726 229,717
Construction in progress 17,720 17,247
Accumulated depreciation and depletion (165,182) (165,789)
Ps 215,931 230,133
Depreciation for the nine-month period ended September 30, 2017 and 2016 is detailed as follows:
2017 2016
Depreciation expense related to assets used in the production process Ps10,349 10,627
Depreciation expense related to assets used in administrative and selling
activities 1,533 1,389
Ps11,882 12,016
12. FINANCIAL INSTRUMENTS

12A) SHORT-TERM AND LONG-TERM DEBT
Consolidated debt by interest rates, currencies and type of instrument was summarized as follows:
September 30, 2017 December 31, 2016
Short-term Long-term Total Short-term Long-term Total
Floating rate debt Ps 1,132 55,922 57,054 Ps 519 64,550 65,069
Fixed rate debt 6,978 119,880 126,858 703 170,466 171,169
Ps 8,110 175,802 183,912 Ps 1,222 235,016 236,238
Effective rate 1
Floating rate 7.1% 3.5% 9.7% 4.4%
Fixed rate 8.9% 6.0% 4.4% 6.5%
F-15

CEMEX, S.A.B. DE C.V. AND SUBSIDIARIES
Notes to the Condensed Consolidated Financial Statements
As of September 30, 2017 and December 31, 2016 and for the nine-month period ended
September 30, 2017 and 2016
(Millions of Mexican pesos)
Short-term and long-term debt - Continued
September 30, 2017 December 31, 2016
Currency Short-term Long-term Total Effective rate 1 Short-term Long-term Total Effective rate 1
Dollars Ps 6,292 116,515 122,807 6.1% Ps 114 179,675 179,789 6.3%
Euros 44 45,930 45,974 3.8% 50 55,292 55,342 4.3%
Pesos 678 — 678 4.4% 648 — 648 4.4%
Other currencies 1,096 13,357 14,453 3.7% 410 49 459 10.2%
Ps 8,110 175,802 183,912 Ps 1,222 235,016 236,238
1 Represents the weighted average effective interest rate.
September 30, 2017 Short-term Long-term December 31, 2016 Short-term Long-term
Bank loans Bank loans
Loans in foreign countries, 2017 to
2024 Ps 926 6,025
Loans in foreign countries, 2017 to
2022 Ps 261 1,090
Syndicated loans, 2020 to 2022 — 46,217 Syndicated loans, 2017 to 2022 36 57,032
926 52,242 297 58,122
Notes payable Notes payable
Notes payable in Mexico, 2017 — 678 Notes payable in Mexico, 2017 — 648
Medium-term notes, 2017 to 2026 281 126,709 Medium-term notes, 2017 to 2026 — 173,656
Other notes payable, 2017 to 2025 148 2,928 Other notes payable, 2017 to 2025 173 3,342
429 130,315 173 177,646
Total bank loans and notes payable 1,355 182,557 Total bank loans and notes payable 470 235,768
Current maturities 6,755 (6,755) Current maturities 752 (752)
Ps 8,110 175,802 Ps 1,222 235,016
As of September 30, 2017 and December 31, 2016, discounts, fees and other direct costs incurred in the issuance of CEMEX’s
outstanding notes payable for approximately US$94 and US$84, respectively, adjust the balance of payable instruments, and are
amortized to financing expense over the maturity of the related debt instruments.
The maturities of consolidated long-term debt as of September 30, 2017, were as follows:
September 30, 2017
2018 Ps 5,736
2019 11,020
2020 9,380
2021 24,889
2022 and thereafter 124,777
Ps 175,802
Relevant debt transactions during 2017
On February 13, 2017, CEMEX announced that it has commenced a tender offer to purchase up to US$475 of (i) 7.250% Senior
Secured Notes due 2021; (ii) 6.500% Senior Secured Notes due 2019; and (iii) 9.375% Senior Secured Notes due 2022, subject to
purchase in accordance with the acceptance priority level for each series of Notes.
Regarding the February 13, 2017 tender offer, on February 28, 2017, CEMEX purchased US$385 aggregate principal amount of the
7.250% Senior Secured Notes due 2021 and US$90 of the 6.500% Senior Secured Notes due 2019.

On May 1, 2017, CEMEX issued an irrevocable notice of redemption with respect to its 5.250% Euro-Denominated Senior Secured
Notes due 2021, pursuant to which it redeemed the remaining €400 aggregate amount of such notes on May 31, 2017.
On September 19, 2017, CEMEX announced its offer to purchase for cash any and all of outstanding 9.375% Senior Secured Notes due
2022. The aggregate amount of such Notes outstanding at that date was approximately US$1,044. Holders which did not tender their
Notes into the tender offer, their Notes would be redeemed on October 12, 2017 (note 17).
On September 25, 2017, in relation to the previously announced offer to purchase for cash any and all of the outstanding 9.375% Senior
Secured Notes due 2022, CEMEX purchased approximately US$701 aggregate principal amount of such notes. Following
consummation of the tender offer, US$343 of such notes are expected to remain outstanding until the redemption date of October 12,
2017 (note 17).
F-16

CEMEX, S.A.B. DE C.V. AND SUBSIDIARIES
Notes to the Condensed Consolidated Financial Statements
As of September 30, 2017 and December 31, 2016 and for the nine-month period ended
September 30, 2017 and 2016
(Millions of Mexican pesos)
For the nine-month periods ended September 30, 2017 and 2016, as a result of the debt transactions incurred by CEMEX mentioned
above, CEMEX paid combined premiums and fees costs, associated with the extinguished portion of the repurchased notes for
approximately US$115 (Ps2,162) and US$121 (Ps2,211), respectively, were recognized in the statement of operations in each period
within “Financial expense”. Moreover, proportional fees and issuance costs related to the extinguished debt instruments for
approximately US$10 (Ps188) in 2017 and US$35 (Ps655) in 2016 that were pending for amortization were recognized in the statement
of operations of each year as part of “Financial expense.”
Facilities agreement
On July 19, 2017, CEMEX announced that entered into a new facilities agreement for a total amount of US$4,050 (“2017 Credit
Agreement”), with twenty institutions. Part of the proceeds of the 2017 Credit Agreement were used in part to refinance the US$3,678
facilities agreement dated September 29, 2014. CEMEX canceled both drawn and undrawn amounts under the 2014 Credit Agreement
on July 25, 2017.
The main terms and conditions of the 2017 Credit Agreement include: i).- A total weighted average life of 4.3 years with a final
maturity on July 2022; ii).- Approximately the equivalent of US$2,915 of commitments under term loan tranches, including US$1,611,
€741 and £344, amortizing in five equal semi-annual payments, beginning on July 2020; iii).- Approximately US$1,135 of
commitments under a revolving credit facility with a five-year bullet maturity; iv).- All tranches under the 2017 Credit Agreement have
substantially the same terms, including an applicable margin over the benchmark interest rate of between 125 to 350 basis points,
depending on CEMEX’s consolidated debt leverage ratio; when such ratio is below 4.5x, the applicable margin ranges between 50 and
125 basis points lower than it would have been under the 2014 Credit Agreement; and v).- Same guarantors and security package as the
2014 Credit Agreement and other senior secured debt obligations of CEMEX.
12B) OTHER FINANCIAL OBLIGATIONS
Other financial obligations in the consolidated balance sheet are detailed as follows:
September 30, 2017 December 31, 2016
Short-term Long-term Total Short-term Long-term Total
I. Convertible subordinated notes due 2020 Ps — 9,247 9,247 Ps — 10,417 10,417
II. Convertible subordinated notes due 2018 6,535 — 6,535 — 13,575 13,575
III. Mandatory convertible securities due 2019 311 455 766 278 689 967
IV. Liabilities secured with accounts receivable 10,454 — 10,454 11,095 — 11,095
V. Capital leases 525 2,565 3,090 285 1,291 1,576
Ps 17,825 12,267 30,092 Ps 11,658 25,972 37,630
Convertible subordinated notes due 2018
On June 19, 2017, CEMEX agreed with certain institutional holders the early conversion of approximately US$325 in aggregate
principal amount of the 2018 Convertible Notes in exchange for approximately 43 million ADSs, which included the number of
additional ADSs issued to the holders as non-cash inducement premiums. As a result of the early conversion agreements the liability
component of the converted notes of approximately Ps1,334, was reclassified from other financial obligations to other equity reserves.
In addition, considering the issuance of shares, CEMEX increased common stock for Ps4 and additional paid-in capital for Ps7,059
against other equity reserves, and recognized expense for the inducement premiums of approximately Ps769, representing the fair value
of the ADSs at the issuance dates, in the income statement for the nine-month period ended September 30, 2017 within “Financial
income and others, net.”
Mandatory convertible securities due 2019
In December 2009, the Parent Company exchanged debt into approximately US$315 principal amount of 10% mandatorily convertible
securities in pesos with maturity in 2019 (the “2019 Mandatorily Convertible Securities”). Reflecting antidilution adjustments, the notes
will be converted at maturity or earlier if the price of the CPO reaches approximately Ps29.50 into approximately 210 million CPOs at a

conversion price of approximately Ps19.66 per CPO. Holders have an option to voluntarily convert their securities on any interest
payment date into CPOs. The conversion option embedded in these securities is treated as a stand-alone derivative liability at fair value
through the statement of operations (note 12C).
F-17

CEMEX, S.A.B. DE C.V. AND SUBSIDIARIES
Notes to the Condensed Consolidated Financial Statements
As of September 30, 2017 and December 31, 2016 and for the nine-month period ended
September 30, 2017 and 2016
(Millions of Mexican pesos)
12C) DERIVATIVE FINANCIAL INSTRUMENTS
During the reported periods, in compliance with the guidelines established by its Risk Management Committee and the restrictions set
forth by its debt agreement. CEMEX held interest rate swaps, as well as forward contracts and other derivative instruments on CEMEX,
S.A.B. de C.V.’s own shares and third parties’ shares, with the objective of, as the case may be: a) changing the risk profile associated
with the price of raw materials and other energy projects; and b) other corporate purposes. The notional amounts and fair values of
CEMEX’s derivative instruments were as follows:
September 30, 2017 December 31, 2016
(U.S. dollars millions)
Notional
amount
Fair
Value
Notional
amount
Fair
Value
I. Interest rate swaps US$ 142 21 147 23
II. Equity forwards on third party shares 168 3 — —
III. Options on the Parent Company’s own shares — (37) 576 26
IV. Foreign exchange forward contracts 1,062 (27) 80 —
V. Fuels price hedging 74 12 77 15
US$ 1,446 (28) 880 64
The caption “Financial income and others, net” includes gains and losses related to the recognition of changes in fair values of
derivative instruments during the applicable period which, for the nine-month period ended September 30, 2017 and 2016, represented a
net gains of approximately US$13 (Ps245) and US$27 (Ps493), respectively.
As of September 30, 2017 and December 31, 2016, the main exposure of CEMEX was related to changes in the prices of CEMEX,
S.A.B. de C.V.’s CPOs and third party shares. A significant decrease in the market price of CEMEX, S.A.B. de C.V.’s CPOs and
third-party shares would negatively affect CEMEX’s liquidity and financial position. The estimated fair value of derivative instruments
fluctuates over time and is determined by measuring the effect of future relevant economic variables according to the yield curves
shown in the market as of the reporting date. These values should be analyzed in relation to the fair values of the underlying
transactions and as part of CEMEX’s overall exposure attributable to fluctuations in interest rates and foreign exchange rates. The
notional amounts of derivative instruments do not represent amounts exchanged by the parties, and consequently, there is no direct
measure of CEMEX’s exposure to the use of these derivatives. The amounts exchanged are determined based on the notional amounts
and other terms included in the derivative instruments.
I. Interest rate swap contracts
As of September 30, 2017 and December 31, 2016, CEMEX had an interest rate swap maturing in September 2022 associated with an
agreement entered into by CEMEX for the acquisition of electric energy in Mexico, which fair value represented assets of US$21
(Ps383) and US$23 (Ps477), respectively. Pursuant to this instrument, during the tenure of the swap and based on its notional amount,
CEMEX will receive a fixed rate of 5.4% and will pay LIBOR. Changes in the fair value of this interest rate swap generated losses of
US$2 (Ps38) for the nine-month period ended September 30, 2017 and gains of US$2 (Ps37) for the nine-month period ended
September 30, 2016, recognized in profit or loss for each period.
II. Equity forwards in third party shares
As of September 30, 2017, CEMEX had forward contracts which are net cash settled maturing in March 2019 over the price of
31 million shares of Grupo Cementos Chihuahua, S.A.B. de C.V. (“GCC”), a Mexican construction company traded in the MSE.
Changes in the fair value of this instrument generated losses of US$5 (Ps94) for the nine-month period ended September 30, 2017, were
recognized in profit or loss.
III. Options on the Parent Company’s own shares
As of December 31, 2016, the fair value of the existing options represented an asset of approximately US$66 (Ps1,368). Changes in the
fair value of these instruments generated gains of US$37 (Ps696) and US$48 (Ps877), for the nine-month period ended September 30,

2017 and 2016, respectively, recognized within “Financial income and others, net” in profit or loss. As of September 30, 2017, CEMEX
closed all its options in its own shares.
In connection with the 2019 Mandatorily Convertible Securities (note 12B); CEMEX separated the conversion option embedded in such
instruments and recognized it at fair value through profit or loss, which as of September 30, 2017 and December 31, 2016, resulted in a
liability of US$37 (Ps675) and US$40 (Ps829), respectively. Changes in the fair value of this embedded derivative generated gains of
US$2 (Ps38) for the nine-month period ended September 30, 2017 and losses of US$26 (Ps475) for the nine-month period ended
September 30, 2016, recognized in profit or loss for each period.
F-18

CEMEX, S.A.B. DE C.V. AND SUBSIDIARIES
Notes to the Condensed Consolidated Financial Statements
As of September 30, 2017 and December 31, 2016 and for the nine-month period ended
September 30, 2017 and 2016
(Millions of Mexican pesos)
IV. Foreign exchange forward contracts
During 2017, CEMEX negotiated foreign exchange forwards contract to hedge its exposure to currency translation effects arising from
certain investments in foreign subsidiaries. These contracts have been documented as a net investment hedge and such, changes in fair
value are recognized through other comprehensive income. For the nine-month period ended September 30, 2017, changes in the
estimated fair value of these instruments, generated losses of US$71 (Ps1,340), recognized within stockholders’ equity.
As of September 30, 2017, and as of December 31, 2016, negotiated to hedge the U.S. dollar value of future proceeds in other
currencies from expected sale of assets. For the nine-month period ended September 30, 2017 and 2016, changes in the estimated fair
value of these instruments, including the effects resulting from positions entered and settled during the period, generated losses of
US$19 (Ps357) and gains of US$5 (Ps91) respectively, recognized within “Financial income and others, net” in profit or loss.
V. Fuels price hedging
As of September 30, 2017 and December 31, 2016, CEMEX had forward contracts with a notional amount of approximately US$74 and
US$77, respectively, negotiated to hedge the price of diesel fuel and coal in some countries. These contracts have been documented as
cash flow hedges of fuel or coal consumption, and such, changes in fair value are recognized through other comprehensive income. As
of September 30, 2017, the fair value of these contracts resulted in an asset of approximately US$12 (Ps219).
12D) FAIR VALUE OF FINANCIAL INSTRUMENTS
Financial assets and liabilities
CEMEX’s carrying amounts of cash, trade accounts receivable, other accounts receivable, trade accounts payable, other accounts
payable and accrued expenses, as well as short-term debt, approximate their corresponding estimated fair values due to the short-term
maturity and revolving nature of these financial assets and liabilities. Cash equivalents and certain long-term investments are recognized
at fair value, considering to the extent available, quoted market prices for the same or similar instruments. The estimated fair value of
long-term debt is either based on estimated market prices for such or similar instruments, considering interest rates currently available
for CEMEX to negotiate debt with the same maturities, or determined by discounting future cash flows using market-based interest
rates currently available to CEMEX. As of September 30, 2017 and December 31, 2016, the carrying amounts of financial assets and
liabilities and their respective fair values were as follows:
September 30, 2017 December 31, 2016
Carrying
amount
Fair
value
Carrying
amount
Fair
value
Financial assets
Derivative instruments (note 12C) Ps 466 466 Ps 1,900 1,900
Other investments and non-current accounts receivable 4,522 4,522 5,222 5,222
Ps 4,988 4,988 Ps 7,122 7,122
Financial liabilities
Long-term debt (note 12A) Ps175,802 185,373 235,016 241,968
Other financial obligations (note 12B) 12,267 20,416 25,972 27,419
Derivative instruments (note 12C) 1,178 1,178 818 818
Ps189,247 206,967 Ps 261,806 270,205
F-19
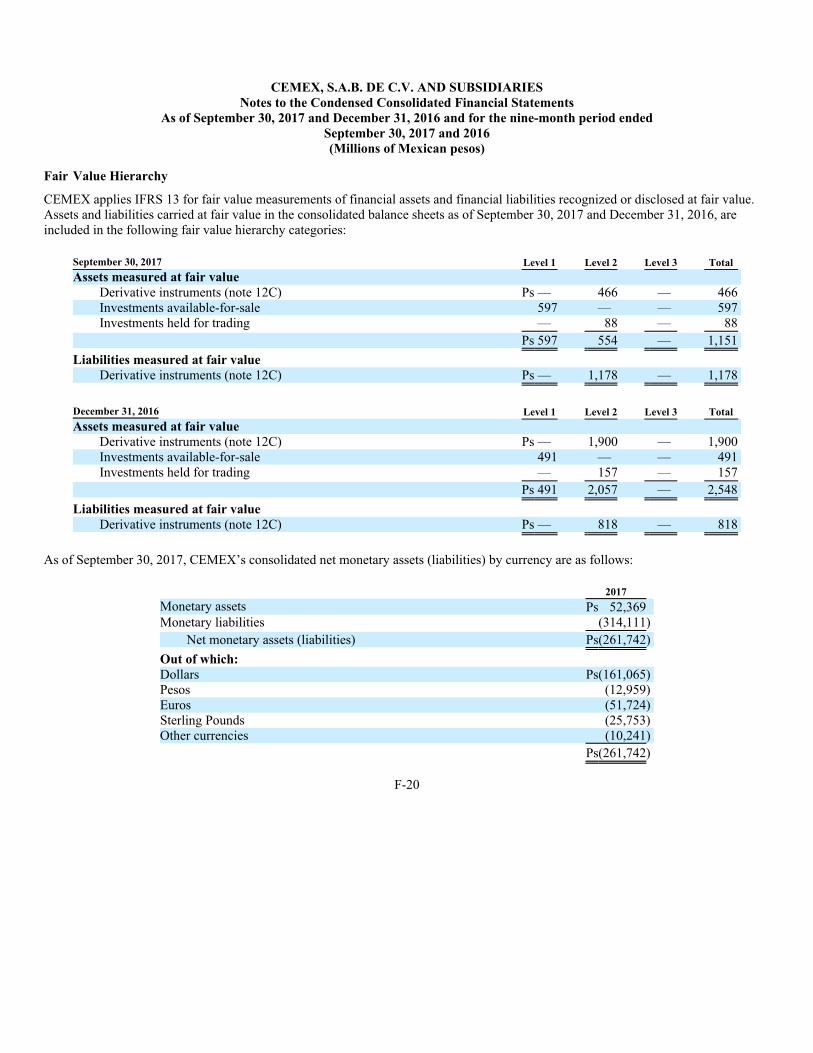
CEMEX, S.A.B. DE C.V. AND SUBSIDIARIES
Notes to the Condensed Consolidated Financial Statements
As of September 30, 2017 and December 31, 2016 and for the nine-month period ended
September 30, 2017 and 2016
(Millions of Mexican pesos)
Fair Value Hierarchy
CEMEX applies IFRS 13 for fair value measurements of financial assets and financial liabilities recognized or disclosed at fair value.
Assets and liabilities carried at fair value in the consolidated balance sheets as of September 30, 2017 and December 31, 2016, are
included in the following fair value hierarchy categories:
September 30, 2017 Level 1 Level 2 Level 3 Total
Assets measured at fair value
Derivative instruments (note 12C) Ps — 466 — 466
Investments available-for-sale 597 — — 597
Investments held for trading — 88 — 88
Ps 597 554 — 1,151
Liabilities measured at fair value
Derivative instruments (note 12C) Ps — 1,178 — 1,178
December 31, 2016 Level 1 Level 2 Level 3 Total
Assets measured at fair value
Derivative instruments (note 12C) Ps — 1,900 — 1,900
Investments available-for-sale 491 — — 491
Investments held for trading — 157 — 157
Ps 491 2,057 — 2,548
Liabilities measured at fair value
Derivative instruments (note 12C) Ps — 818 — 818
As of September 30, 2017, CEMEX’s consolidated net monetary assets (liabilities) by currency are as follows:
2017
Monetary assets Ps 52,369
Monetary liabilities (314,111)
Net monetary assets (liabilities) Ps(261,742)
Out of which:
Dollars Ps(161,065)
Pesos (12,959)
Euros (51,724)
Sterling Pounds (25,753)
Other currencies (10,241)
Ps(261,742)
F-20

CEMEX, S.A.B. DE C.V. AND SUBSIDIARIES
Notes to the Condensed Consolidated Financial Statements
As of September 30, 2017 and December 31, 2016 and for the nine-month period ended
September 30, 2017 and 2016
(Millions of Mexican pesos)
13. OTHER CURRENT LIABILITIES
As of September 30, 2017 and December 31, 2016, consolidated other current accounts payable and accrued expenses were as follows:
September 30, 2017 December 31, 2016
Provisions Ps 10,740 11,716
Interest payable 2,346 3,425
Advances from customers 2,912 3,413
Other accounts payable and accrued expenses 4,830 3,976
Ps 20,828 22,530
Current provisions primarily consist of employee benefits accrued at the balance sheet date, insurance payments, and accruals related to
legal and environmental assessments expected to be settled in the short-term. These amounts are revolving in nature and are expected to
be settled and replaced by similar amounts within the next 12 months.
14. INCOME TAXES
Consolidated income tax expense is recognized based on Management’s best estimate of the weight average annual effective income tax
rate expected for the full year applied to the income before income tax for the nine-month periods ended September 30, 2017 and
September 30, 2016, respectively, and adjusted for the tax effect of certain items recognized in full in the interim period. The change in
effective tax rate for the nine-month period ended September 30, 2017 was caused mainly by the recognition of deferred tax asset
derived from tax loss carryforwards in the United States that result in a tax benefit for the period.
15. STOCKHOLDERS’ EQUITY
15A) COMMON STOCK AND ADDITIONAL PAID-IN CAPITAL
As of September 30, 2017 and December 31, 2016 the breakdown of common stock and additional paid-in capital was as follows:
September 30, 2017 December 31, 2016
Common stock Ps 4,171 4,162
Additional paid-in capital 140,445 123,174
Ps 144,616 127,336
On March 30, 2017, stockholders at the annual ordinary shareholders’ meeting approved resolutions to: (i) increase the variable
common stock through the capitalization of retained earnings by issuing up to 1,687 million shares (562 million CPOs), which shares
were issued, representing an increase in common stock of approximately Ps5, considering a nominal value of Ps0.00833 per CPO;
(ii) increase the variable common stock by issuing up to 258 million shares (86 million CPOs),which will be kept in CEMEX’s treasury
to be used to preserve the anti-dilutive rights of note holders pursuant CEMEX’s convertible securities. On April, 2017, upon delivery
of the shares, an additional paid-in capital of approximately Ps9,459 was recognized within stockholders’ equity against retained
earnings.
15B) NON-CONTROLLING INTEREST AND PERPETUAL DEBENTURES
Non-controlling interest
Non-controlling interest represents the share of non-controlling stockholders in the results and equity of consolidated subsidiaries. As of
September 30, 2017 and December 31, 2016 non-controlling interest in equity amounted to approximately Ps19,045 and Ps19,876.
Perpetual debentures

As of September 30, 2017 and December 31, 2016, the balances of the non-controlling interest included approximately US$446
(Ps8,140) and US$438 (Ps9,075), respectively, representing the notional amount of perpetual debentures. Interest expense on the
perpetual debentures, which is accrued based on the principal amount, was included within “Other equity reserves” and represented
expenses of approximately Ps359 and Ps369 for the nine-month period ended September 30, 2017 and September 30, 2016,
respectively.
16. CONTINGENCIES FROM LEGAL PROCEEDINGS
CEMEX is involved in various legal proceedings which have not required the recognition of accruals, as CEMEX believes that the
probability of loss is less than probable or remote after considering all the elements of such proceedings, as well as proceedings in
which a negative resolution for CEMEX may represent, among other things, the revocation of operating licenses or the assessment of
fines, whereby CEMEX may experience a decrease in future revenues, an increase in operating costs or a loss. As of September 30,
2017, the details of the most significant updates events in relation to the most important contingencies as well as the quantification of
the potential loss, when it is determinable, were as follows:
F-21

CEMEX, S.A.B. DE C.V. AND SUBSIDIARIES
Notes to the Condensed Consolidated Financial Statements
As of September 30, 2017 and December 31, 2016 and for the nine-month period ended
September 30, 2017 and 2016
(Millions of Mexican pesos)
On October 27, 2016, CLH decided to postpone the commencement of operations of the cement plant in Maceo, Colombia. This
decision was mainly due to the following circumstances: (i) CEMEX Colombia had not received permits required to finalize road
access to such cement plant. As of September 30, 2017, the process to obtain the permits required to finalize the road access to such
cement plant in Maceo, Colombia, is ongoing. CEMEX Colombia has provided all information that the authorities have requested in
order to grant such permits, but CEMEX Colombia is not able to assess if and when such permits will be received; (ii) CEMEX
Colombia had not received a final response to the request to expand the free trade zone that covers the Maceo Project in order to
commission a new clinker line at such cement plant. Failure to obtain such expansion would jeopardize CEMEX Colombia’s capability
to consolidate the benefits that would otherwise be available for CEMEX Colombia in the area. CEMEX Colombia had requested to the
Colombian Ministry of Trade, Industry and Tourism (Ministerio de Comercio, Industria y Turismo) an expansion of the free trade zone,
for which CEMEX Colombia did not receive a final decision. CEMEX Colombia believes the delay in such decision could have been
related to the expiration of property proceeding against the Affected Assets. During the third quarter of 2017, the Directorate of
National Taxes and Customs of Colombia (Dirección de Impuestos y Aduanas Nacionales de Colombia) (“DIAN”) granted, at the
request of CEMEX Colombia, the suspension of the expansion process of the free trade zone that CEMEX Colombia had previously
requested, thus, the expansion process of the free trade zone will be stayed until July 31, 2018. As of September 30, 2017, CEMEX
Colombia believes that by July 31, 2018, the partial adjustment to the District of Integrated Management should be finalized, which
would allow CEMEX Colombia to proceed with the expansion process of the free trade zone; (iii) The environmental license and the
mining concession related to the Maceo Project were held by different legal entities, which is contrary to typical procedure in Colombia.
The environmental license related to the Maceo Project is held by Central de Mezclas S.A. (“Central de Mezclas”), a subsidiary of
CEMEX Colombia. However, the mining permit related to the Maceo Project was remanded back to CI Calizas as a result of the
revocation of such mining concession by the Mining Secretariat (Secretaría de Minas) of Antioquia in December 2013. In connection
with the environmental license that had been issued for the Maceo Project, during the second half of 2016, Corantioquia, the regional
environmental agency with jurisdiction over the Maceo Project environmental license, requested authorization and consent from Central
de Mezclas to reverse the assignment of the environmental license for the Maceo Project back to CI Calizas, which also holds the
corresponding mining title. Central de Mezclas has petitioned Corantioquia to evaluate the basis for such request. CEMEX Colombia
had requested a modification to the environmental license, and on December 13, 2016, Corantioquia notified Central de Mezclas that it
had adopted the decision to deny the request for modification of the environmental license related to the Maceo Project to 950,000 tons
per annum on the basis of the overlap of the project area with the District of Integrated Management. On December 14, 2016, Central de
Mezclas appealed the decision. On March 28, 2017, Central de Mezclas was notified of Corantioquia’s decision, which affirmed the
decision that had previously denied the modification of the environmental license for a 950,000 per annum project. As a result, as of
September 30, 2017, CEMEX Colombia was actively working on the zoning and compatibility of the District of Integrated
Management, as well as analyzing alternatives for a partial adjustment to the District of Integrated Management, to avoid future
discussions regarding feasibility of expanding the proposed production in the Maceo Project beyond 950,000 tons per annum. As of
September 30, 2017, CEMEX Colombia expects to file the petition for subtraction of the zoning area during the course of the fourth
quarter of 2017. Once these alternatives are implemented, As of September 30, 2017, CEMEX Colombia will reconsider submitting a
new request pursuing the modification of the environmental license to expand its production of 950,000 tons per annum as initially
planned; and (iv) CEMEX Colombia determined that the area covered by the environmental license related to the Maceo Project
partially overlapped with a District of Integrated Management (Distrito de Manejo Integrado), which could limit the granting of the
environmental license modification. As of September 30, 2017, CEMEX Colombia expects to file a petition to decrease the size of the
zoning area to avoid any overlap with the District of Integrated Management and in the meantime will limit its activities to those that do
not have a negative impact on the District of Integrated Management. CEMEX Colombia and Central de Mezclas plan to continue to
work on solving the issues causing the postponement of the commissioning of the Maceo Project cement plant in order to capture, as
soon as reasonably possible, the full operating benefits of this facility in Colombia. CEMEX Colombia believes some of these issues
could be related to the expiration of property proceeding against the Affected Assets. As of September 30, 2017, CEMEX do not expect
to suffer a material adverse impact to its results of operations, liquidity or financial condition as a result of the Maceo Project cement
plant not being commissioned to operate pending resolution of these issues.
In September 2014, the National Markets and Competition Commission (Comisión Nacional de los Mercados y la Competencia or the
“CNMC”), in the context of an investigation of the Spanish cement, ready-mix concrete and related products industry regarding alleged
anticompetitive practices, inspected one of CEMEX’s facilities in Spain. In January 2015, CEMEX España Operaciones, S.L.U., was
notified of the initiation by the CNMC of a disciplinary proceeding for alleged prohibited conducts, and in November 2015, such entity
was notified of alleged anticompetitive practices in 2009 for the cement market and the years 2008, 2009, 2012, 2013 and 2014 for the
ready-mix market. CEMEX España Operaciones, S.L.U. believes that it has not breached any applicable laws. On September 8, 2016,
CEMEX España Operaciones was notified of a decision issued by the CNMC pursuant to which CEMEX España Operaciones, S.L.U.

has been required to pay a fine of approximately €6 (US$7 or Ps129). CEMEX España Operaciones, S.L.U. filed an appeal against the
CNMC resolution and requested the suspension of payment of the fine. The National Court (Audiencia Nacional) granted the requested
suspension; subject to issuance of a bank guarantee for the principal amount of the sanction. The CNMC has been notified. As of
September 30, 2017, CEMEX do not expect that an adverse resolution to this matter would have a material adverse impact on our
results of operations, liquidity and financial condition.
In 2012, in connection with a contract (the “Quarry Contract”) entered into in 1990 by CEMEX Granulats Rhône Méditerranée
(“CEMEX GRM”), one of CEMEX’s subsidiaries in France, with SCI La Quinoniere (“SCI”) pursuant to which CEMEX GRM has
drilling rights in order to extract reserves and do quarry remediation at a quarry in the Rhone region of France, SCI filed a claim against
CEMEX GRM for breach of the Quarry Contract, requesting the rescission of the Quarry Contract and damages. After many hearings,
Proceedings will be closed on December 4, 2017 and the next hearing will be on February 7, 2018. The judgment of the appeal court is
expected mid-2018. As of September 30, 2017, CEMEX considers that an adverse resolution on this matter would not have a material
adverse impact on CEMEX’s results of operations, liquidity and financial condition.
F-22

CEMEX, S.A.B. DE C.V. AND SUBSIDIARIES
Notes to the Condensed Consolidated Financial Statements
As of September 30, 2017 and December 31, 2016 and for the nine-month period ended
September 30, 2017 and 2016
(Millions of Mexican pesos)
On July 7, 2011, the tax authorities in Spain notified CEMEX España of a tax audit process in Spain covering the tax years from and
including 2006 to 2009. The tax authorities in Spain have challenged part of the tax losses reported by CEMEX España for such years.
On April 22, 2014, CEMEX España filed appeals against such fines, and, on September 20, 2017, it was notified about an adverse
resolution to such appeals. CEMEX España has a two-month period in order to challenge this decision and apply for the suspension of
the payment of the fines. CEMEX España will not make any payment until the resources are finally resolved. At this stage, as of
September 30, 2017 we are not able to assess the likelihood of an adverse result to the actions that CEMEX España intends to file,
including in relation to the request to suspend the payment while the recourses any being processed, and, in general to this matter.
Nonetheless, a final adverse resolution of this matter could have a material adverse impact on CEMEX’S results of operations, liquidity
and financial condition.
As of September 30, 2017, CEMEX is involved in various legal proceedings of minor impact that have arisen in the ordinary course of
business. These proceedings involve: 1) product warranty claims; 2) claims for environmental damages; 3) indemnification claims
relating to acquisitions; 4) claims to revoke permits and/or concessions; and 5) other diverse civil actions. CEMEX considers that in
those instances in which obligations have been incurred, CEMEX has accrued adequate provisions to cover the related risks. CEMEX
believes these matters will be resolved without any significant effect on its business, financial position or results of operations. In
addition, in relation to certain ongoing legal proceedings, CEMEX is sometimes able to make and disclose reasonable estimates of the
expected loss or range of possible loss, as well as disclose any provision accrued for such loss, but for a limited number of ongoing
legal proceedings, CEMEX may not be able to make a reasonable estimate of the expected loss or range of possible loss or may be able
to do so but believes that disclosure of such information on a case-by-case basis would seriously prejudice CEMEX’s position in the
ongoing legal proceedings or in any related settlement discussions. Accordingly, in these cases, CEMEX has disclosed qualitative
information with respect to the nature and characteristics of the contingency, but has not disclosed the estimate of the range of potential
loss.
17. SUBSEQUENT EVENTS
In connection to the purchase of the 9.375% Senior Secured Notes due 2022, on October 12, 2017, CEMEX, redeemed the total
outstanding amount of approximately US$343 aggregate principal amount of such notes. CEMEX paid approximately US$359
including the principal amount plus accrued and unpaid interest up to this date (note 12A).
On November 6, 2017, CEMEX issued an irrevocable notice of redemption with respect to the December 2019 U.S. Dollar Notes,
pursuant to which it will complete the redemption of the approximately remaining of US$611 aggregate principal amount of such notes
on December 10, 2017. Holders of such notes will receive US$1,032.5 dollars for each US$1,000 dollars principal amount of Notes,
plus accrued and unpaid interest, to the Settlement Date (note 12A).
In connection with CEMEX Colombia’s petition to decrease the size of the zoning area covered by the environmental license related to
the Maceo Project in order to avoid any overlap with the District of Integrated Management, was filed on October 9, 2017 with the
regional environmental agency with jurisdiction over this matter.
In regards with CEMEX GRM appeal filed against the adverse judgment mentioned in note 16, recently, the SCI has recently updated
its claim for damages to approximately €67 (US$79 or Ps1,445)
In connection to the process initiated by the Colombian Superintendence of Industry and Commerce (Superintendencia de Industria y
Comercio, the “SIC”) in which has an opened investigation against five cement companies and 14 executives of those companies,
including two former executives of CEMEX Colombia, for allegedly breaching rules which prohibit: a) to limit free competition and/or
determining or maintaining unfair prices; b) direct or indirect price fixing agreements; and c) any market sharing agreements between
producers or distributors. On October 12, 2017 CEMEX Colombia and other companies were notified that a non-binding report was
issued by the Superintendent Delegate for the Protection of Competition for the benefit of the SIC. In addition, it is recommended to
sanction CEMEX Colombia for alleged restrictive practices of competition. The non-binding report is a recommendation, which closes
the investigation stage and does not imply the completion of the process nor the condemnation of the payment of a penalty or fine to the
date. This report must be analyzed by the SIC, who will decide to impose or not an economic sanction according with the
recommendations. CEMEX Colombia has a period of twenty business days to file their final arguments against the non-binding report.
If an adverse resolution is issued by the SIC, CEMEX Colombia has the possibility of filing several recourses that are available,

including a reconsideration request before the SIC and, if the reconsideration request does not succeed, challenging the validity of the
SIC’s decision before the Colombian Administrative Courts.
F-23