cement sector coverage - 18 february 2016
TRANSCRIPT
PRIME INVESTMENT RESEARCH AUTOMOTIVE |EGYPT
GB AUTO – INITIATION OF COVERAGE JANUARY, 14TH
2016
PRIME INVESTMENT RESEARCH
BUILDING MATERIALS |EGYPT CEMENT SECTOR COVERAGE – ARCC, SUCE & SVCE
FEBRUARY, 18TH 2016
HUGE POTENTIAL COUPLED WITH
UNCERTAINTY.
LOW DEMAND A KEY CHALLENGE AFTER
SOLVING ENERGY DILEMMA.
NEW LICENSES CONSIDERED A DOUBLE EDGE
DEPENDING ON FUTURE DEMAND.
ACC A PIONEER FAILING TO REAP BENEFITS
OF EARLY COAL CONVERSION.
SUEZ GROUP FINANCIAL POSITION
NEGATIVELY AFFECTED BY SUBSIDIARIES.
SOUTH VALLEY TO ELIMINATE RISK IN CASE
OF ACQUIRING NEW LICENSE.
2
PRIME INVESTMENT RESEARCH CEMENT SECTOR COVERAGE
FEBRUARY, 2016
Bearish outlook despite huge potential The Egyptian cement industry has always held huge potential for
high returns with the Egyptian cement market being one of the main markets worldwide. Despite the
huge potential we are bearish over the sector. The witnessed decline in the EGX since 2015 has pushed
most stock prices towards all time lows and cement stocks weren’t different. We believe that the upside
for all our covered companies is attributed to the declining market price rather than companies’
performance. Fundamentally, however, companies are facing huge uncertainty despite great potential.
Expected demand depends on several market factors The Egyptian cement market has been hit by
oversupply during 2015 forcing selling prices towards a 15% drop. We estimate the market to reach
equilibrium by 2017 where the demand is set to equal the current total capacity. However, our demand
assumptions are based on the announced projects being completed within their announced time frame.
Several projects have already faced some delays, while the other projects related to the tourism sector
have been suspended following the latest events. Moreover, the economic uncertainty has scared away
foreign investors limiting their contribution to these projects.
Could new licenses turn into a threat? The new licenses which were offered by the IDA are seen by many
as an opportunity to capitalize on increasing demand. However, even with projects operating within time
frame we expect demand to reach 82mtpa by 2020. Granting all 14 licenses would add a significant
28mtpa which pushes capacity towards 96mtpa causing a supply-demand gap. It is noteworthy that, some
of the market players have the ability to exceed 100% utilization, which already took place before 2011. A
further oversupply without revisiting the idea of exporting creates a huge threat for the Egyptian cement
Industry.
FX a huge risk The EGP witnessed a significant devaluation during 2015 which caused a drag on the whole
economy. The coal integration has caused companies to need foreign currency for the coal imports. Any
shortage or further devaluation is considered a threat for companies’ operations. Furthermore,
companies in need of clinker imports might be forced to dismiss the idea and lose significant market share
as importing clinker might surpass the already declining selling prices which would be cost inefficient.
Despite the great potential there remains an uncertainty whether the oversupply situation could be
solved. The market potential depends greatly on the above mentioned factors which is a huge risk due to
the uncertainty of the economic outlook. Hence we opted to adopt a HOLD recommendation for the
companies covered in the report based on their fundamentals despite their “fake” upside. However, we
decided to put the whole sector on the watch list, waiting for any enhancement in performance to be
reported in 1Q 2016, in order to revise our assumptions and accordingly our recommendations.
Company Ticker Market Price Target Price
Arabian Cement ARCC 7.3 11.9
Suez Cement SUCE 16.8 29.6
South Valley Cement SVCE 3.5 5.5

3
PRIME INVESTMENT RESEARCH CEMENT SECTOR COVERAGE
FEBRUARY, 2016
URBAN POPULATION %
SOURCE: WORLD BANK
GLOBAL CEMENT CONSUMPTION
SOURCE: BLOOMBERG & PRIME CALCULATIONS
Global Industry Overview
Cement industry was one of the largest
growing industries in the past decades. The
rapidly growing demand for housing and
infrastructure in addition to the growing
urbanization levels in emerging economies
provided the main incentive for this growth.
Since there is no other material discovered till
now can replace cement in its role, cement is
the major building material in meeting this
huge demand. Hence, the low urbanization
levels, like that in Asia & Africa, compared to
that of developed nations, promises more
demand growth for cement in the coming years.
However, the slowing growth rates in China’s economy that hit the country in the last two years led
to a global slowdown in the whole world’s economic growth. As China was the largest importer of
many commodities from emerging markets, the lower growth rates in the Chinese economy
negatively affected most of these emerging economies which resulted in a slowdown in housing and
construction sector, hence, a lower demand for cement.
Derived by China’s demand, Asia led the global consumption for cement in the last decade, as it
represented more than 70% of the world’s consumption. Europe comes second as the second largest
consumer of cement. The Americas come in the third place derived by the increasing consumption
levels of cement in emerging countries in South America like Brazil. Africa comes fourth in the global
consumption. By 2015, world’s cement consumption reached 4276.1mn ton, growing by a CAGR of
25.24% over 2010-2015.
0
10
20
30
40
50
60
70
80
90
100
1994
2004
2014
0
500
1000
1500
2000
2500
3000
3500
4000
4500
2010 2011 2012 2013 2014 2015
Mn
To
n
America
EU
ME
Africa
Asia
World
3585.2 3745.7
4033.5 4139.5 4276.1
3311.7

4
PRIME INVESTMENT RESEARCH CEMENT SECTOR COVERAGE
FEBRUARY, 2016
GLOBAL CEMENT PRODUCTION
SOURCE: BLOOMBERG & PRIME CALCULATIONS
SOURCE: BLOOMBERG & PRIME CALCULATIONS
MKT SHARE BY REVENUE
SOURCE: BLOOMBERG & PRIME CALCULATIONS
The unprecedented growth in China’s
cement demand urged the country to
increase its production to meet this
demand. In the past 8 years cement
production in China increased by more
than 80%, it recorded 2,344.4mn ton in
2015 as the largest cement producer in
the world. India is in the second place with
274.5mn ton followed by USA, Iran and
Indonesia, respectively
Asia dominates global cement market
share; derived by huge Chinese
production and consumption, Asia
controls 54.1% of the world’s cement
production. Asia is followed by North
America, Europe, Middle East & Africa
and South America, respectively.
0
500
1000
1500
2000
2500
3000
3500
4000 M
n T
on
Indonesia Japan Vietnam Russia Brazil Iran Egypt Saudi Arabia US Turkey India China
Europe, 14.4
Asia, 54.1
North America,
16.8
South America,
6.8
Middle East & Africa,
7.7
Cement Production (Mn ton) 2008 2009 2010 2011 2012 2013 2014 2015
China 1300.2 1561.4 1748.7 1942.1 2193.4 2404.2 2465.6 2344.4
India 182.7 201.8 213.2 225 243.5 254.8 270.4 274.5
Turkey 51.4 54 62.7 62.2 63.9 70 70.4 58.6
US 78.6 57 60.4 61.9 67.8 69.9 75 69.6
Saudi Arabia 31.8 40 42.3 48.4 50 57 55 55
Egypt 39.93 47.4 48.32 48.72 49.71 45.15 47.79 38.97
Iran 44.4 50 50 61 70 72 65 65
Brazil 57.9 57.7 59.1 64.1 68.8 70 72 72
Russia 53.6 44.3 50.4 55.6 61.5 66.4 68.4 69
Vietnam 37 47.9 50 59 60 58 60.5 61
Japan 31.85 51.53 51.29 54.74 57.96 57.91 49.9
Indonesia 37 40 22 30 32 56 65 65

5
PRIME INVESTMENT RESEARCH CEMENT SECTOR COVERAGE
FEBRUARY, 2016
An Overview on Egyptian economy and growth expectations
The Egyptian economy has been unstable facing several challenges since the 2011 revolution despite
government’s efforts to ensure stable growth. FY 2014/2015 witnessed slightly enhanced performance
with GDP growth reaching 4.2% jumping from 2.2% recorded a year earlier. However, the economy is still
facing several challenges such as:
Foreign currency shortage as the net foreign reserves amounting to USD16.4 billion, barely covering
3 months of imports.
Widening trade deficit at USD38.8bn recorded in FY-2014/2015
Shortage in energy supply, which directly affects the cement sector as well as other industries such
as steel, fertilizers and ceramics.
Foreign exchange risk. Highlighted by a widening spread between the official and the parallel
market to reach 9%.
Decreasing Gulf countries’ support. Official transfers from Gulf countries in the form of cash and in-
kind grants declined by 77% in FY15. Furthermore, the pressure caused by the declining oil prices
and the Saudi Arabia/Iran conflict adds further possibility to more decline to be expected.
Slowdown due to declining oil prices in 2015.
Facing those challenges there are still key positives that lead us to forecast an economy growth in the following year. The parliament had its first sessions in January 2016. This would help to enforce economic reforms and add political stability to ensure foreign investors. Moreover, the new gas discoveries as well as the arrival of second gasification ship at Ain Sokhna Port will help solving energy shortage constrains and boost the economy. Triggered by political stability and the serious steps taken by the government to pay back investors’ pending backlogs especially in the oil sector, we see growth rate for FY15/16 to be 3.9%, taken into consideration facts such as delayed reforms (tax, investment laws) and production halts caused by lack of energy especially with energy intensive industries. As a result, we expect GDP to pick up soon by FY-2016/2017 on the back of the new Eni’s gas discovery reaching 30 trillion cubic feet gas reserves. This will help to solve energy crisis and may be government allocate a portion of its output for export to gain foreign currency. However, the global prices will be a major obstacle if the current tren continues. A further trigger for demand are the projects which were offered at the EEDC (Egypt Economic Development Conference) that was held last March, as the government succeeded in sealing deals worth over USD 33bn. This is in addition to the MoUs that were signed which were valued at USD 111.4bn. Most of the major sectors including the Real Estate and Building Materials will benefit from such projects driving demand. In addition, issuing the new investment law will increase domestic and foreign investors ‘confidence and hence induce FDI.
6
PRIME INVESTMENT RESEARCH CEMENT SECTOR COVERAGE
FEBRUARY, 2016
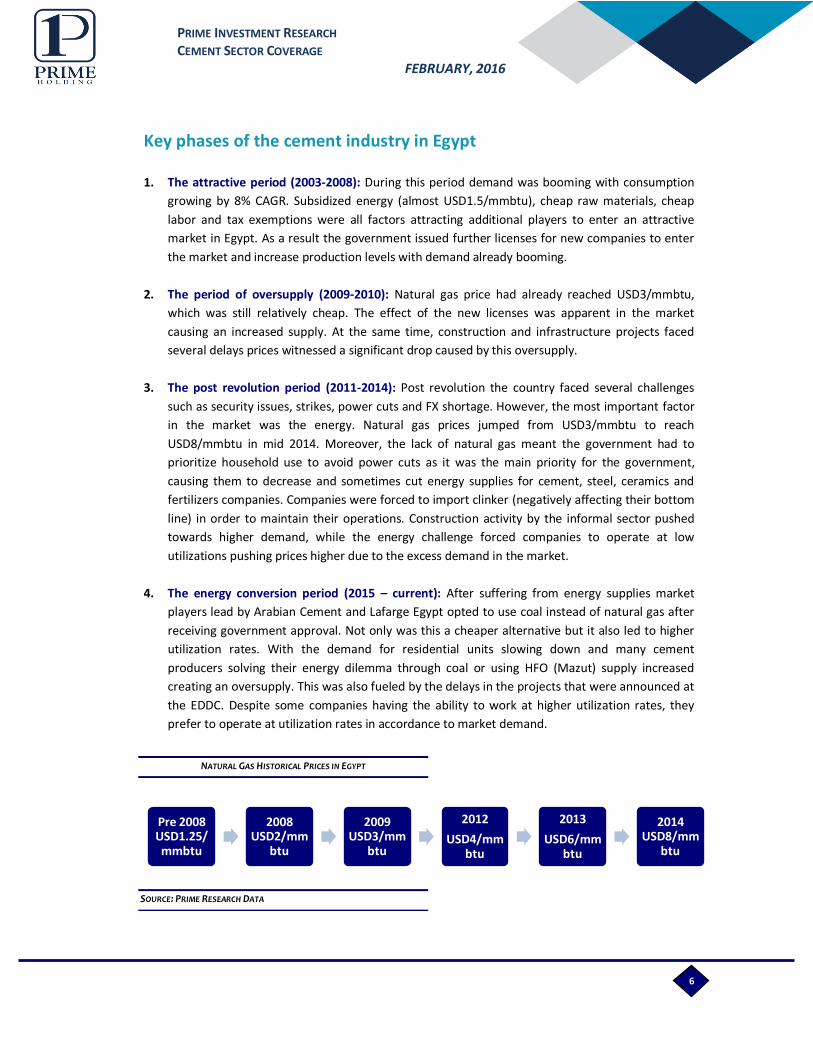
NATURAL GAS HISTORICAL PRICES IN EGYPT
SOURCE: PRIME RESEARCH DATA
Key phases of the cement industry in Egypt
1. The attractive period (2003-2008): During this period demand was booming with consumption
growing by 8% CAGR. Subsidized energy (almost USD1.5/mmbtu), cheap raw materials, cheap
labor and tax exemptions were all factors attracting additional players to enter an attractive
market in Egypt. As a result the government issued further licenses for new companies to enter
the market and increase production levels with demand already booming.
2. The period of oversupply (2009-2010): Natural gas price had already reached USD3/mmbtu,
which was still relatively cheap. The effect of the new licenses was apparent in the market
causing an increased supply. At the same time, construction and infrastructure projects faced
several delays prices witnessed a significant drop caused by this oversupply.
3. The post revolution period (2011-2014): Post revolution the country faced several challenges
such as security issues, strikes, power cuts and FX shortage. However, the most important factor
in the market was the energy. Natural gas prices jumped from USD3/mmbtu to reach
USD8/mmbtu in mid 2014. Moreover, the lack of natural gas meant the government had to
prioritize household use to avoid power cuts as it was the main priority for the government,
causing them to decrease and sometimes cut energy supplies for cement, steel, ceramics and
fertilizers companies. Companies were forced to import clinker (negatively affecting their bottom
line) in order to maintain their operations. Construction activity by the informal sector pushed
towards higher demand, while the energy challenge forced companies to operate at low
utilizations pushing prices higher due to the excess demand in the market.
4. The energy conversion period (2015 – current): After suffering from energy supplies market
players lead by Arabian Cement and Lafarge Egypt opted to use coal instead of natural gas after
receiving government approval. Not only was this a cheaper alternative but it also led to higher
utilization rates. With the demand for residential units slowing down and many cement
producers solving their energy dilemma through coal or using HFO (Mazut) supply increased
creating an oversupply. This was also fueled by the delays in the projects that were announced at
the EDDC. Despite some companies having the ability to work at higher utilization rates, they
prefer to operate at utilization rates in accordance to market demand.
Pre 2008 USD1.25/mmbtu
2008 USD2/mm
btu
2009 USD3/mm
btu
2012
USD4/mmbtu
2013
USD6/mmbtu
2014 USD8/mm
btu

7
PRIME INVESTMENT RESEARCH CEMENT SECTOR COVERAGE
FEBRUARY, 2016
OUR CEMENT DEMAND ESTIMATES
SOURCE: PRIME RESEARCH
The Cement consumption in Egypt
Cement consumption in Egypt is spread out into three sectors; residential, infrastructure and non-
residential sectors with 85%, 5% and 10% of cement consumption respectively. Therefore, we initially
forecasted the building & construction sector based on its substantially well-built historical relationship
with GDP as a stable and consistent percentage of the GDP. Cement as a value is forecasted through as a
percentage of construction part of the Real GDP. Through our inflation adjusted price forecasts we
acquired a value for market consumption between 2015 and 2020. We believe that cement consumption
would reach 82mtpa by 2020 growing at a CAGR of 8.1%. This growth is justified by the construction
activity anticipated through the megaprojects planned by the government between 2015-2020. We
expect cement demand to witness two periods:
Reaching equilibrium (2015-2017): During 2015 the market has been suffering from oversupply
in the market which caused increased prices. The conversion to coal by several market players
enabled them to operate at higher utilization rates compared to 2014. An example would be
Arabian Cement, which has already converted to cheaper and more available coal as an energy
source. Meanwhile, other companies who have not converted to coal yet, have used HFO
witnessing a more steady supply in comparison to natural gas. Moreover, the economic
slowdown witnessed in 2015 also contributed to a lower than expected cement consumption
leading to a total sales volume of 53mn tons from a total capacity of 70mn tons. In 2016 we
expect total cement sales to witness a significant 11% increase. This increase continues until
2017 where cement demand is expected to be equal to the total capacity of Egyptian market
players. This would enable most market players to operate at full utilization.
Demand Growth (2018-2020): Starting 2018 almost all cement makers would have converted to
coal enabling 100% utilization. However, with most projects (even the ones facing delays) being
in operations during this period in addition to the GDP growth. However, starting 2018 the
construction as a percentage of GDP would face a slight decline. This is caused by a boom in
other sectors as more major problems such as energy and political instability are expected to be
solved. This has been a trend even historically with the construction percentage averaging
between (2.8%-3.6%) between 2005 and 2008 which is the economic peak for Egypt. Meanwhile
construction has represented an average of 4.2% since 2009, a period affected by the economic
slowdown and the revolution in Egypt. The cement consumption would still increase to reach an
expected sales volume of 82mn tons in 2020. The extra 13.5mn tons are either to be acquired
through imports (at a higher cost) or more likely through licenses which were announced
recently by the government.
2010 2011 2012 2013 2014 2015 2016 2017 2018 2019 2020
GDP (Real), EGP bn 1,528 1,558 1,592 1,626 1,678 1,746 1,818 1,902 1,995 2,095 2,146
Construction & Building (Real) 64 66 69 71 74 77 80 83 83 83 81
% of GDP 4.2% 4.2% 4.4% 4.4% 4.4% 4.4% 4.4% 4.4% 4.2% 4.0% 3.8%
Cement Demand, mn tons 49 49 51 50 51 53 60 69 74 78 82
Inflation adjusted Cement Prices 387 440 465 453 456 546 675 543 499 459 425
Cement Value mn 14,850 21,029 23,012 22,057 23,337 27,352 34,617 28,784 30,071 31,456 31,486
Cement % of Construction Value 29.0% 36.0% 36.1% 33.4% 33.7% 38.4% 47.1% 37.6% 37.7% 37.7% 37.7%

8
PRIME INVESTMENT RESEARCH CEMENT SECTOR COVERAGE
FEBRUARY, 2016
REAL GDP (EGP, BN ) & GROWTH CEMENT DEMAND (TONS,MN) & GROWTH
SOURCE: PRIME RESEARCH
CONSTRUCTION% OF GDP IN BOOM AND
SLOWDOWN PERIODS
0%
1%
2%
3%
4%
5%
6%
-
500
1,000
1,500
2,000
2,500
2011
2012
2013
2014
2015
2016
2017
2018
2019
2020 -4%
-2%
0%
2%
4%
6%
8%
10%
12%
14%
16%
-
10
20
30
40
50
60
70
80
90
2011
2012
2013
2014
2015
2016
2017
2018
2019
2020
0.0%
0.5%
1.0%
1.5%
2.0%
2.5%
3.0%
3.5%
4.0%
4.5%
5.0%
2005
2006
2007
2008
2009
2010
2011
2012
2013
2014
Oversupply explained
Lower than expected demand poses a great risk for the industry as it directly affects prices which in
turn have suffered during 2015. The delays for the start date for certain projects in addition to the hit
that was taken by the tourism industry has led to a slowing demand which forced the companies to
operate at lower average utilization rate of 78% during 2015. Furthermore, our main export
destinations (Libya and Sudan) have been suffering from political and market instability denying
Egyptian producers the opportunity to export their excess supply. It is unlikely that cement players
would lower their supply. For example, during 2015 many companies maintained their supply level
despite suffering from losses. (Torah, Helwan, Sinai and Alex Cement). However, we believe this
situation of oversupply would be resolved by 2017 where market consumption is expected to finally
equal total capacity. On the other hand, most cement companies would have converted to coal by then
allowing the companies to reach equilibrium with demand equaling supply. Post 2017 we expect
demand to surpass the total market capacity which offers the perfect chance for the added capacity
acquired through the new licenses.
How much added capacity would is needed?
Projects: The increased demand estimation by 2020 to reach 82mtpa is based on the expected
infrastructure investments pledged and agreed upon in the form of MoUs during the EEDC. This is in
addition to the projects that are going to be implemented in the developmental area around the New
Suez Canal. We anticipate a hike in construction demand over the upcoming period reflected in a total
of USD 173.4bn according MEED worth of projects to be implemented over 2015-2025. These projects
will cause a significant increase in demand. The Residential and Non-residential projects alone stand at
a net value

9
PRIME INVESTMENT RESEARCH CEMENT SECTOR COVERAGE
FEBRUARY, 2016
UPCOMING PROJECTS AND REQUIRED CEMENT
SOURCE: MEED PROJECTS
of USD117.2bn, while power related projects stand USD 24.7bn with transportation projects standing at
USD 31.9bn. While residential projects require 20% of cement other two segments require 10%. As a
result, we do believe that despite some delays these projects still supports the idea of increased demand.
2012 2013 2014 2015 2016 2017 2018 2019 2020
Average Mkt Price 456 546 675 575 575 587 604 622 635
Growth
20% 24% -15% 0% 2% 3% 3% 2%
Value in USD, bn Required Cement %
Residential & Non-Residential 117.2 20%
Transportation Projects 31.9 10%
Power & Water Projects 24.4 10%
Total 173.4
The new licenses: The government announced the issuance of new 14 cement licenses at an estimated
capacity of 2mtpa with details to be announced later. Several market players haven’t shown their willingness
to apply for the new licenses due to its high cost, having to ensure their own electricity and the already
existing oversupply in the market. However, after adding such capacities for other market players like South
Valley Cement who are willing to add the total. Our demand forecast of 82mn tons by 2020 means that the
government only needs to add licenses worth 13.5mtpa to cater for the growing demand. Any further
addition would pose a threat of further oversupply. It is noteworthy, that the IDA has announced that all new
licenses are obliged to use energy sources other than natural gas (coal, RDF, HFO). This capacity expansion is
needed for the high investments and projects previously mentioned. The investment cost per line was valued
at EGP 150mn.
Prices expected to grow conservatively after significant drop in 2015
During 2015 average price dropped significantly as a result of a) oversupply and b) slowdown in global cement
prices. The oversupply has pushed prices to 15% decline. The slower than expected project executions coupled
with the blow to the tourism industry mean that demand would grow at a slower rate than expected pushing
the market to remain at a state of oversupply until it reaches equilibrium in 2017. We believe that prices
would remain stable during 2016 at EGP 575/ton, grow in accordance with population growth rates at 2% for
the following year. For 2017-2018 prices are expected to grow at 3% each year. This would be coupled with
reaching market equilibrium in 2017. Growth is expected to slow down slightly growing at 2% to finally reach
EGP 635/ton. Average market prices are expected to grow at a 5-year CAGR of 2%. We do not expect any
extraordinary price hike as the demand will be met by the increased utilization rates. In addition, the new
licenses dismissing the idea of supply shortage in the long term. It is noteworthy that many companies sell at
premium or a discount to the average market price depending on location, distribution and other factors.
Moreover, these price forecasts would be subject to change in case of delays of the projects and the amount
of new licenses that are taken by the companies.
10
PRIME INVESTMENT RESEARCH CEMENT SECTOR COVERAGE
FEBRUARY, 2016
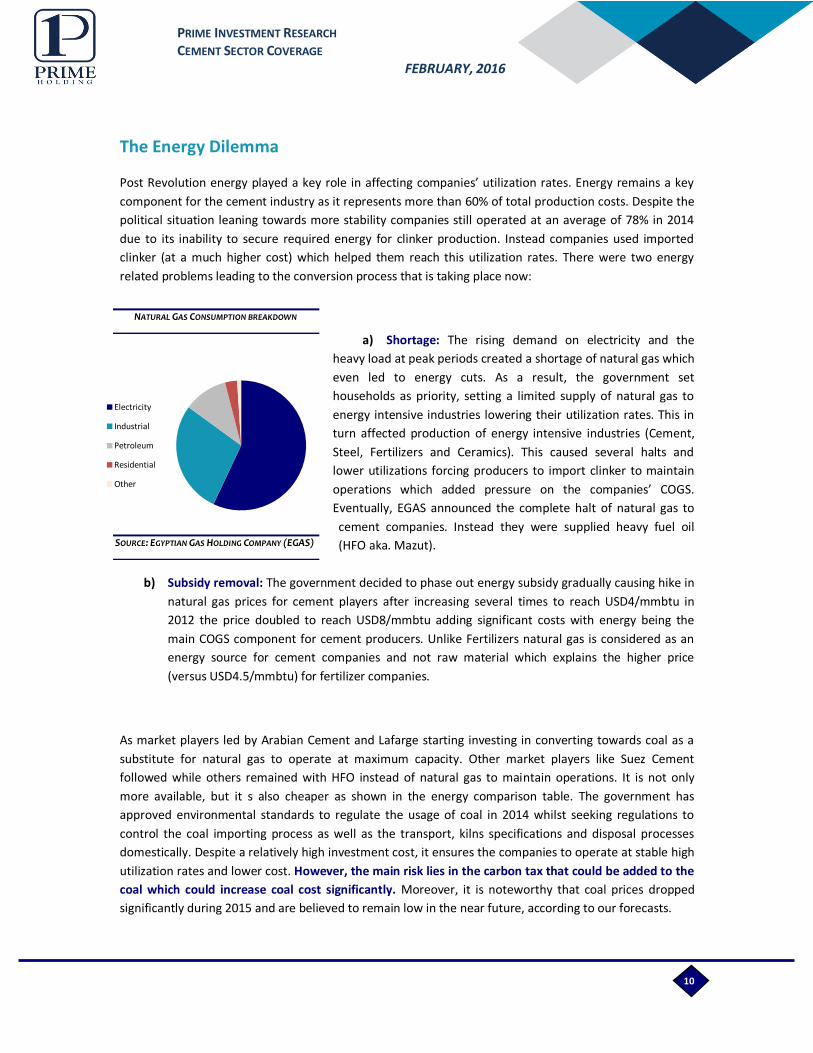
NATURAL GAS CONSUMPTION BREAKDOWN
SOURCE: EGYPTIAN GAS HOLDING COMPANY (EGAS)
The Energy Dilemma
Post Revolution energy played a key role in affecting companies’ utilization rates. Energy remains a key
component for the cement industry as it represents more than 60% of total production costs. Despite the
political situation leaning towards more stability companies still operated at an average of 78% in 2014
due to its inability to secure required energy for clinker production. Instead companies used imported
clinker (at a much higher cost) which helped them reach this utilization rates. There were two energy
related problems leading to the conversion process that is taking place now:
a) Shortage: The rising demand on electricity and the
heavy load at peak periods created a shortage of natural gas which
even led to energy cuts. As a result, the government set
households as priority, setting a limited supply of natural gas to
energy intensive industries lowering their utilization rates. This in
turn affected production of energy intensive industries (Cement,
Steel, Fertilizers and Ceramics). This caused several halts and
lower utilizations forcing producers to import clinker to maintain
operations which added pressure on the companies’ COGS.
Eventually, EGAS announced the complete halt of natural gas to
cement companies. Instead they were supplied heavy fuel oil
(HFO aka. Mazut).
b) Subsidy removal: The government decided to phase out energy subsidy gradually causing hike in
natural gas prices for cement players after increasing several times to reach USD4/mmbtu in
2012 the price doubled to reach USD8/mmbtu adding significant costs with energy being the
main COGS component for cement producers. Unlike Fertilizers natural gas is considered as an
energy source for cement companies and not raw material which explains the higher price
(versus USD4.5/mmbtu) for fertilizer companies.
As market players led by Arabian Cement and Lafarge starting investing in converting towards coal as a
substitute for natural gas to operate at maximum capacity. Other market players like Suez Cement
followed while others remained with HFO instead of natural gas to maintain operations. It is not only
more available, but it s also cheaper as shown in the energy comparison table. The government has
approved environmental standards to regulate the usage of coal in 2014 whilst seeking regulations to
control the coal importing process as well as the transport, kilns specifications and disposal processes
domestically. Despite a relatively high investment cost, it ensures the companies to operate at stable high
utilization rates and lower cost. However, the main risk lies in the carbon tax that could be added to the
coal which could increase coal cost significantly. Moreover, it is noteworthy that coal prices dropped
significantly during 2015 and are believed to remain low in the near future, according to our forecasts.
Electricity
Industrial
Petroleum
Residential
Other

11
PRIME INVESTMENT RESEARCH CEMENT SECTOR COVERAGE
FEBRUARY, 2016
COAL PRICE (USD/TON) AND FORECASTS BRENT PRICE (USD/B) AND FORECASTS
SOURCE: BLOOMBERG & PRIME RESEARCH ESTIMATES
So why the sudden drop in coal prices?
The oil price decrease had a direct effect on coal prices to decrease as well. Further, the lower/higher coal
prices will have a positive/negative direct effect in Egyptian cement industry in general, and for
companies using coal in particular. Oil and coal are theoretically considered substitutes, however, by
looking at historical consumption and price movement the trends tell a different story. As indicated by the
below trend line, there is a positive correlation between oil and coal. We expect coal prices to be in
correlation with oil prices and to reach USD62/ton by 2019. This in turn would lower production costs
compared to previous higher prices adding to its already cheaper price compared to natural gas or mazut.
This shows clearly as Arabian Cement enjoys one of the lowest COGS/ton of the market.
96 95 96
88
47 48 45 50 52
-60%
-50%
-40%
-30%
-20%
-10%
0%
10%
20%
30%
40%
0
20
40
60
80
100
120
117
93
80 73
57 58 56 60 62
-30%
-20%
-10%
0%
10%
20%
30%
40%
0
20
40
60
80
100
120
140
12
PRIME INVESTMENT RESEARCH CEMENT SECTOR COVERAGE
FEBRUARY, 2016
ENERGY COST COMPARISON (EGP/TON OF
CEMENT) 2015
ENERGY COST COMPARISON (EGP/TON OF
CEMENT) ESTIMATES
ENERGY COST COMPARISON (EGP/TON OF CEMENT) ESTIMATES
SOURCE: PRIME RESEARCH ESTIMATES
SOURCE: PRIME RESEARCH ESTIMATES
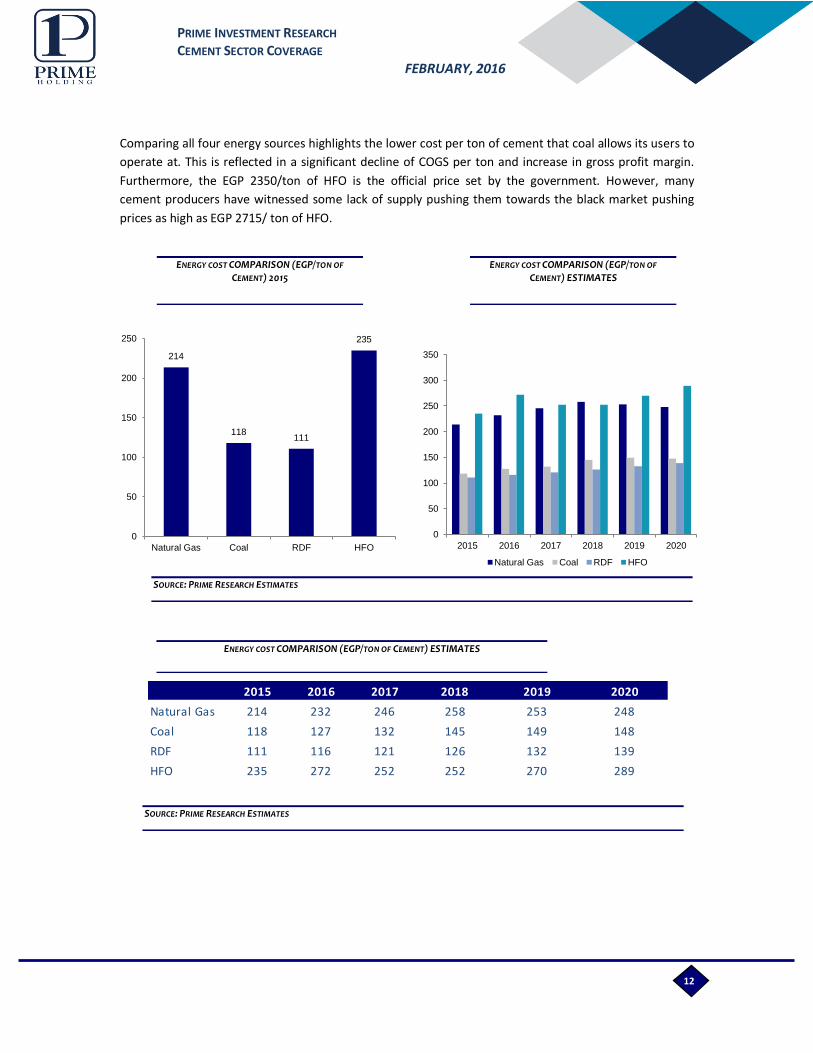
Comparing all four energy sources highlights the lower cost per ton of cement that coal allows its users to
operate at. This is reflected in a significant decline of COGS per ton and increase in gross profit margin.
Furthermore, the EGP 2350/ton of HFO is the official price set by the government. However, many
cement producers have witnessed some lack of supply pushing them towards the black market pushing
prices as high as EGP 2715/ ton of HFO.
2015 2016 2017 2018 2019 2020
Natural Gas 214 232 246 258 253 248
Coal 118 127 132 145 149 148
RDF 111 116 121 126 132 139
HFO 235 272 252 252 270 289
214
118 111
235
0
50
100
150
200
250
Natural Gas Coal RDF HFO
0
50
100
150
200
250
300
350
2015 2016 2017 2018 2019 2020
Natural Gas Coal RDF HFO

13
PRIME INVESTMENT RESEARCH CEMENT SECTOR COVERAGE
FEBRUARY, 2016
EGYPTIAN CEMENT MARKET DATA AS OF 2015
SOURCE: COMPANY FINANCIALS, IDA DATA
Company Name Capacity Production Utilization Sales Marketshare Sales YoY
Total suez cement group domistic 12.0 8.0 67% 7.9 15% 0.3%
National Cement Co. 3.5 1.8 50% 1.9 4% 16.9%
Assiut Cement Co. 6.0 4.6 77% 4.7 9% -9.5%
Amreyah Cement 3.5 3.4 97% 3.4 6% -9.1%
Alex &Bani Swaif Cement Co. 4.5 3.9 86% 3.9 7% 28.7%
Lafarge Cement Co. 10.0 7.5 75% 7.4 14% 16.4%
Sina Cement Co. 3.0 2.1 70% 2.0 4% -6.1%
Qena Cement Co. 1.9 1.8 95% 1.7 3% -12.7%
Masr Bani Swaif Cement Co. 3.0 2.8 93% 2.7 5% 12.7%
Arabian Cement Co. 5.0 4.2 84% 4.2 8% 2.4%
South Vally Cement 1.5 1.5 99% 1.5 3% 34.6%
Shoura Cement 0.6 0.3 50% 0.3 1% 0.0%
Medecom Aswan 0.8 0.7 100% 0.7 1% -6.2%
Sinai whitecement 1.5 0.1 6% 0.1 0% 120.3%
Elsewedy Cement Co. 1.5 2.4 162% 2.4 5% 10.0%
Wadi El Nile Cement Co. 2.0 1.7 83% 1.7 3% 18.1%
El-Areish Cement Co. 3.0 1.6 54% 1.6 3% -32.5%
El Nahda Industries Co. 1.5 1.3 87% 1.3 2% -13.6%
Building Materials Ind. Co. 1.8 1.6 91% 1.6 3% 9.6%
ASEC Minya Cement Co. 1.9 1.9 98% 1.9 4% 0.0%
Total 68.5 53.2 78% 53.0 100% 3.4%

14
PRIME INVESTMENT RESEARCH CEMENT SECTOR COVERAGE
FEBRUARY, 2016
FINANCIAL & MULTIPLE COMPARISON
SOURCE: COMPANY FINANCIALS, PRIME RESEARCH ESTIMATES
Company 2013 2014 2015 2016 2017 2018 2019 2020
COGS/Ton
ARCC 309 401 354 354 363 370 381 389
SUCE 486 565 495 389 375 381 415 356
SVCE 296 340 439 417 470 487 513 537
Sales/Ton
ARCC 528 635 543 541 557 586 610 628
SUCE 517 593 548 498 503 545 580 513
SVCE 516 601 585 585 592 610 628 641
P/E
ARCC 6.55 7.33 8.35 7.14 6.00 4.68 4.22 4.01
SUCE 6 6 -51 25 11 5 5 4
SVCE 12.75 11.26 19.93 8.35 6.84 5.99 7.82 7.70
Ev/EBITDA
ARCC 5.1 4.5 4.9 4.3 3.5 2.6 2.2 1.8
SUCE 1 2 7 3 2 1 1 2
SVCE 9.8 8.4 11.4 7.2 5.9 4.7 4.6 4.5
Ev/Ton
ARCC 1042 956 849 735 631 524 461 398
SUCE 199 240 340 249 215 119 163 195
SVCE 1944 1966 1324 1381 799 679 625 556
GPM
ARCC 42% 37% 35% 35% 35% 37% 38% 38%
SUCE 26% 25% 16% 20% 23% 26% 24% 27%
SVCE 43% 43% 33% 36% 25% 25% 23% 21%
EBITDA Margin
ARCC 39% 33% 32% 32% 32% 34% 35% 35%
SUCE 30% 31% 24% 29% 32% 35% 33% 36%
SVCE 38% 41% 23% 34% 23% 24% 22% 20%
NPM
ARCC 20% 15% 14% 16% 17% 20% 21% 22%
SUCE 12% 8% -1% 2% 5% 8% 7% 9%
SVCE 23% 23% 10% 22% 14% 15% 11% 11%
EPS
ARCC 1.1 1.0 0.9 1.0 1.2 1.5 1.7 1.8
SUCE 2.96 2.71 (0.33) 0.67 1.47 3.06 3.20 3.96
SVCE 0.3 0.3 0.2 0.4 0.5 0.6 0.5 0.5
DPS
ARCC 0.4 0.5 0.6 0.7 0.8 1.1 1.2 1.3
SUCE 0.27 0.25 - 0.17 0.51 8.27 9.13 7.46
SVCE 0.22 0.00 0.00 0.04 0.13 0.15 0.11 0.11
15
PRIME INVESTMENT RESEARCH CEMENT SECTOR COVERAGE
FEBRUARY, 2016
Stock Data Outstanding Shares [in mn] 378.7 Mkt. Cap [in mn] 2,745.9 Bloomberg – Reuters ARCC EY / ARCC.CA 52-WEEKS EGP 7.14/EGP18.5 DAILY AVERAGE TURNOVER (2015) EGP 2.2MN
Ownership Aridos Jativa SLU 60% Al Borini Family 17.5% Free Float 22.5%
Source: ARCC, Prime Estimates All prices are as of 16 February 2016
Source: Bloomberg
ource: GB AUTO, Prime Estimates
0
5
10
15
20
ARCC EGX30 - Rebased
“BUY” MARKET PRICE EGP XX FAIR VALUE EGP XX POTENTIAL XX% UPSIDE
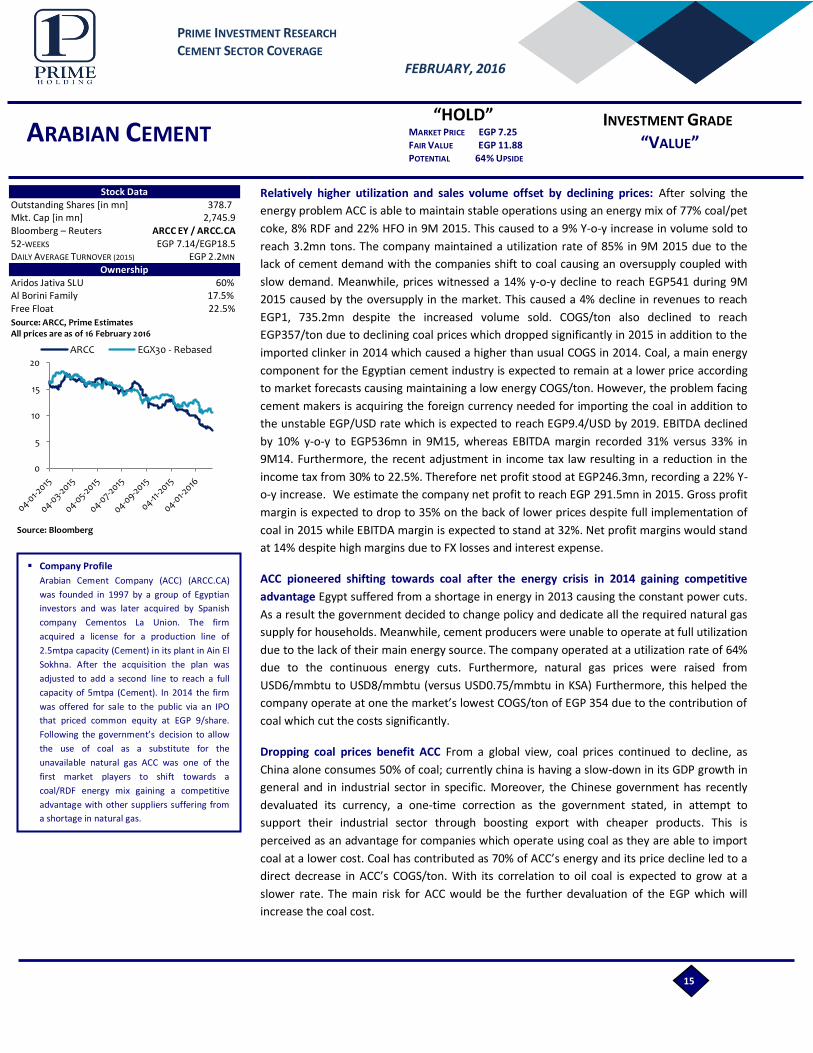
Relatively higher utilization and sales volume offset by declining prices: After solving the
energy problem ACC is able to maintain stable operations using an energy mix of 77% coal/pet
coke, 8% RDF and 22% HFO in 9M 2015. This caused to a 9% Y-o-y increase in volume sold to
reach 3.2mn tons. The company maintained a utilization rate of 85% in 9M 2015 due to the
lack of cement demand with the companies shift to coal causing an oversupply coupled with
slow demand. Meanwhile, prices witnessed a 14% y-o-y decline to reach EGP541 during 9M
2015 caused by the oversupply in the market. This caused a 4% decline in revenues to reach
EGP1, 735.2mn despite the increased volume sold. COGS/ton also declined to reach
EGP357/ton due to declining coal prices which dropped significantly in 2015 in addition to the
imported clinker in 2014 which caused a higher than usual COGS in 2014. Coal, a main energy
component for the Egyptian cement industry is expected to remain at a lower price according
to market forecasts causing maintaining a low energy COGS/ton. However, the problem facing
cement makers is acquiring the foreign currency needed for importing the coal in addition to
the unstable EGP/USD rate which is expected to reach EGP9.4/USD by 2019. EBITDA declined
by 10% y-o-y to EGP536mn in 9M15, whereas EBITDA margin recorded 31% versus 33% in
9M14. Furthermore, the recent adjustment in income tax law resulting in a reduction in the
income tax from 30% to 22.5%. Therefore net profit stood at EGP246.3mn, recording a 22% Y-
o-y increase. We estimate the company net profit to reach EGP 291.5mn in 2015. Gross profit
margin is expected to drop to 35% on the back of lower prices despite full implementation of
coal in 2015 while EBITDA margin is expected to stand at 32%. Net profit margins would stand
at 14% despite high margins due to FX losses and interest expense.
ACC pioneered shifting towards coal after the energy crisis in 2014 gaining competitive
advantage Egypt suffered from a shortage in energy in 2013 causing the constant power cuts.
As a result the government decided to change policy and dedicate all the required natural gas
supply for households. Meanwhile, cement producers were unable to operate at full utilization
due to the lack of their main energy source. The company operated at a utilization rate of 64%
due to the continuous energy cuts. Furthermore, natural gas prices were raised from
USD6/mmbtu to USD8/mmbtu (versus USD0.75/mmbtu in KSA) Furthermore, this helped the
company operate at one the market’s lowest COGS/ton of EGP 354 due to the contribution of
coal which cut the costs significantly.
Dropping coal prices benefit ACC From a global view, coal prices continued to decline, as
China alone consumes 50% of coal; currently china is having a slow-down in its GDP growth in
general and in industrial sector in specific. Moreover, the Chinese government has recently
devaluated its currency, a one-time correction as the government stated, in attempt to
support their industrial sector through boosting export with cheaper products. This is
perceived as an advantage for companies which operate using coal as they are able to import
coal at a lower cost. Coal has contributed as 70% of ACC’s energy and its price decline led to a
direct decrease in ACC’s COGS/ton. With its correlation to oil coal is expected to grow at a
slower rate. The main risk for ACC would be the further devaluation of the EGP which will
increase the coal cost.
INVESTMENT GRADE “VALUE” ARABIAN CEMENT
“HOLD” MARKET PRICE EGP 7.25 FAIR VALUE EGP 11.88 POTENTIAL 64% UPSIDE
Company Profile
Arabian Cement Company (ACC) (ARCC.CA)
was founded in 1997 by a group of Egyptian
investors and was later acquired by Spanish
company Cementos La Union. The firm
acquired a license for a production line of
2.5mtpa capacity (Cement) in its plant in Ain El
Sokhna. After the acquisition the plan was
adjusted to add a second line to reach a full
capacity of 5mtpa (Cement). In 2014 the firm
was offered for sale to the public via an IPO
that priced common equity at EGP 9/share.
Following the government’s decision to allow
the use of coal as a substitute for the
unavailable natural gas ACC was one of the
first market players to shift towards a
coal/RDF energy mix gaining a competitive
advantage with other suppliers suffering from
a shortage in natural gas.
16
PRIME INVESTMENT RESEARCH CEMENT SECTOR COVERAGE
FEBRUARY, 2016
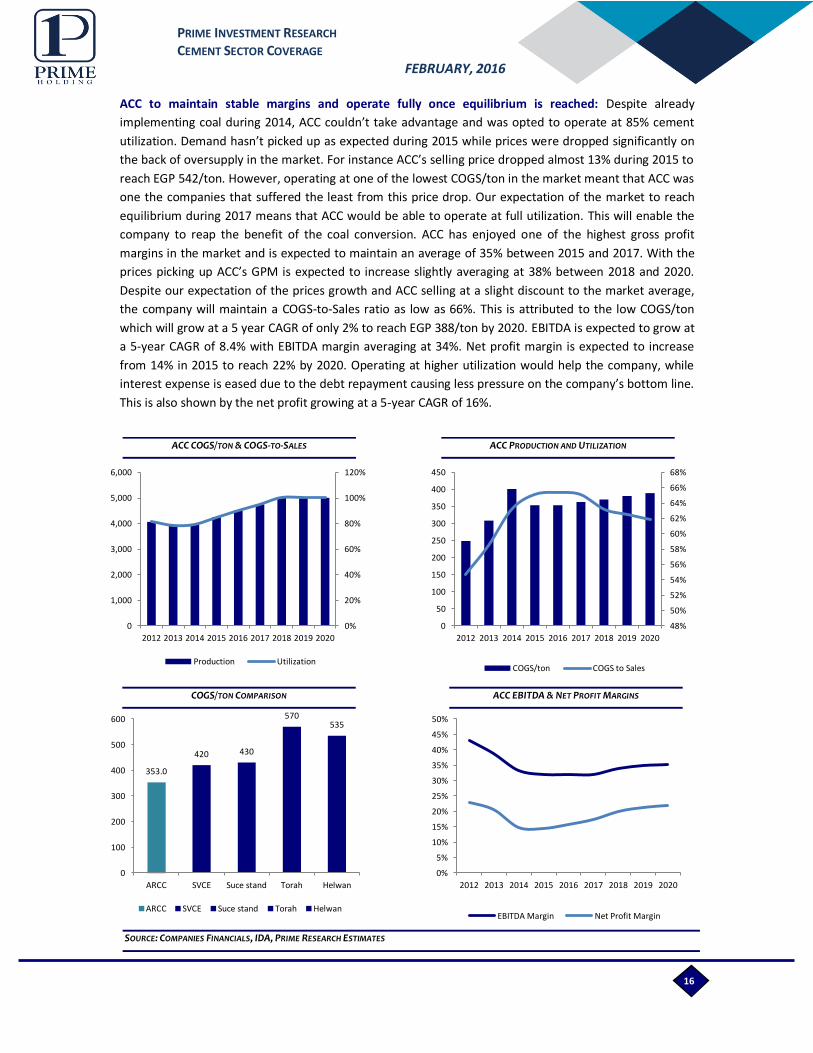
ACC PRODUCTION AND UTILIZATION ACC COGS/TON & COGS-TO-SALES
COGS/TON COMPARISON ACC EBITDA & NET PROFIT MARGINS
SOURCE: COMPANIES FINANCIALS, IDA, PRIME RESEARCH ESTIMATES
ACC to maintain stable margins and operate fully once equilibrium is reached: Despite already
implementing coal during 2014, ACC couldn’t take advantage and was opted to operate at 85% cement
utilization. Demand hasn’t picked up as expected during 2015 while prices were dropped significantly on
the back of oversupply in the market. For instance ACC’s selling price dropped almost 13% during 2015 to
reach EGP 542/ton. However, operating at one of the lowest COGS/ton in the market meant that ACC was
one the companies that suffered the least from this price drop. Our expectation of the market to reach
equilibrium during 2017 means that ACC would be able to operate at full utilization. This will enable the
company to reap the benefit of the coal conversion. ACC has enjoyed one of the highest gross profit
margins in the market and is expected to maintain an average of 35% between 2015 and 2017. With the
prices picking up ACC’s GPM is expected to increase slightly averaging at 38% between 2018 and 2020.
Despite our expectation of the prices growth and ACC selling at a slight discount to the market average,
the company will maintain a COGS-to-Sales ratio as low as 66%. This is attributed to the low COGS/ton
which will grow at a 5 year CAGR of only 2% to reach EGP 388/ton by 2020. EBITDA is expected to grow at
a 5-year CAGR of 8.4% with EBITDA margin averaging at 34%. Net profit margin is expected to increase
from 14% in 2015 to reach 22% by 2020. Operating at higher utilization would help the company, while
interest expense is eased due to the debt repayment causing less pressure on the company’s bottom line.
This is also shown by the net profit growing at a 5-year CAGR of 16%.
48%
50%
52%
54%
56%
58%
60%
62%
64%
66%
68%
0
50
100
150
200
250
300
350
400
450
2012 2013 2014 2015 2016 2017 2018 2019 2020
COGS/ton COGS to Sales
353.0
420 430
570 535
0
100
200
300
400
500
600
ARCC SVCE Suce stand Torah Helwan
ARCC SVCE Suce stand Torah Helwan
0%
5%
10%
15%
20%
25%
30%
35%
40%
45%
50%
2012 2013 2014 2015 2016 2017 2018 2019 2020
EBITDA Margin Net Profit Margin
0%
20%
40%
60%
80%
100%
120%
0
1,000
2,000
3,000
4,000
5,000
6,000
2012 2013 2014 2015 2016 2017 2018 2019 2020
Production Utilization

17
PRIME INVESTMENT RESEARCH CEMENT SECTOR COVERAGE
FEBRUARY, 2016
SOURCE: PRIME RESEARCH ESTIMATES
ACC CAPEX & CAPEX-TO-SALES
ACC facing both country and company specific
risk: Company: Arabian Cement has an ongoing
legal case over its plant license with the IDA.
ACC is currently paying EGP8m/month. The case
has been most recently moved for international
arbitration and is yet to receive a ruling. If the
company loses the case, this could result in an
immediate payment of EGP450mn, putting
temporary pressure on cash flow. In August this
year there were negotiations with Mehlab
government to solve this conflict but they
reached nothing and then the government
resigned and the new government did not made
any negotiations yet.
Country: The EGP rate versus USD has been
fluctuating since the beginning of 2015 starting at EGP7.15/USD to reach a high of EGP7.93/USD last
November. Moreover, there is a high risk of not acquiring the required foreign currency. This is much
needed for the importing of coal from South Africa. With our expectation of further hike in the EGP/USD
rate, it is believed that the coal price would increase which would put further pressure on the gross profit
margin. Furthermore, some of the company’s debt is in USD. Due to the recent energy crisis and the
FX situation they agreed with the bank to pay installments in 4 years not 1.5 years in 16 installments.
Furthermore, prices have remained lower than expected with no sign of drastic increase as we expect
them to grow at a CAGR of 3% by 2020.
Upside Risk Downside Risk 1) Leader in coal conversion process and now fully operational
1) Government intervention through introducing price cap
using coal/RDF/HFO mix. Following coal price decline. 2) Higher than average market utilization rate 85% (9M 2015)
2) Setting an increased carbon tax which would affect the Energy cost.
3) Distribution in high demand areas like Cairo and Delta.
3) FX risk affecting coal imports.
4) One of the lowest Cogs/Ton in the market.
Valuation
We Initiate Coverage for Arabian Cement reaching a fair value of EGP 11.9; implying an upside potential
of 64%, using a DCF valuation methodology. We valued ARCC utilizing an average WAAC over our
forecasted horizon of 14.05%, a risk free rate of 9.7%, an equity risk premium of 8% and a perpetual
growth rate of 3%. We preferred to use a Beta of 0.65 rather than a statistical Beta due to the company
short trading history on EGX.
0%
1%
2%
3%
4%
5%
6%
7%
8%
9%
-
50,000
100,000
150,000
200,000
250,000
2012 2013 2014 2015 2016 2017 2018 2019 2020
CAPEX CAPEX to revenues
18
PRIME INVESTMENT RESEARCH CEMENT SECTOR COVERAGE
FEBRUARY, 2016
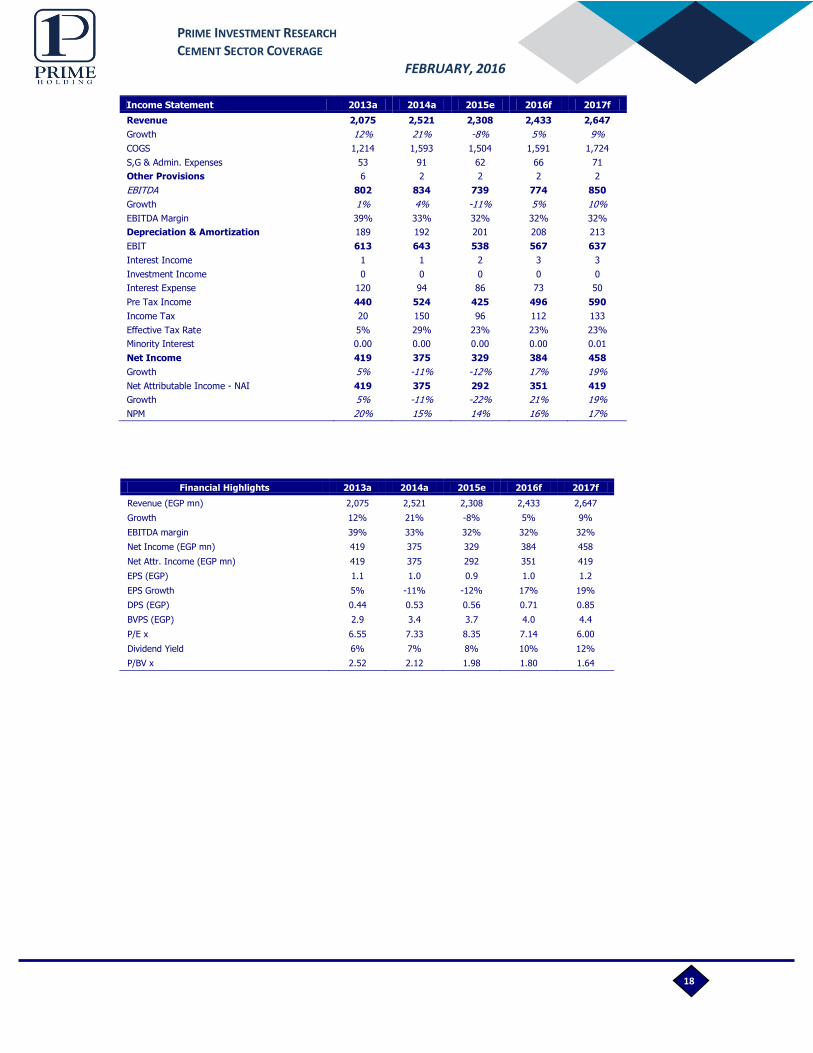
Income Statement 2013a 2014a 2015e 2016f 2017f
Revenue 2,075 2,521 2,308 2,433 2,647
Growth 12% 21% -8% 5% 9%
COGS 1,214 1,593 1,504 1,591 1,724
S,G & Admin. Expenses 53 91 62 66 71
Other Provisions 6 2 2 2 2
EBITDA 802 834 739 774 850
Growth 1% 4% -11% 5% 10%
EBITDA Margin 39% 33% 32% 32% 32%
Depreciation & Amortization 189 192 201 208 213
EBIT 613 643 538 567 637
Interest Income 1 1 2 3 3
Investment Income 0 0 0 0 0
Interest Expense 120 94 86 73 50
Pre Tax Income 440 524 425 496 590
Income Tax 20 150 96 112 133
Effective Tax Rate 5% 29% 23% 23% 23%
Minority Interest 0.00 0.00 0.00 0.00 0.01
Net Income 419 375 329 384 458
Growth 5% -11% -12% 17% 19%
Net Attributable Income - NAI 419 375 292 351 419
Growth 5% -11% -22% 21% 19%
NPM 20% 15% 14% 16% 17%
Financial Highlights 2013a 2014a 2015e 2016f 2017f
Revenue (EGP mn) 2,075 2,521 2,308 2,433 2,647
Growth 12% 21% -8% 5% 9%
EBITDA margin 39% 33% 32% 32% 32%
Net Income (EGP mn) 419 375 329 384 458
Net Attr. Income (EGP mn) 419 375 292 351 419
EPS (EGP) 1.1 1.0 0.9 1.0 1.2
EPS Growth 5% -11% -12% 17% 19%
DPS (EGP) 0.44 0.53 0.56 0.71 0.85
BVPS (EGP) 2.9 3.4 3.7 4.0 4.4
P/E x 6.55 7.33 8.35 7.14 6.00
Dividend Yield 6% 7% 8% 10% 12%
P/BV x 2.52 2.12 1.98 1.80 1.64

19
PRIME INVESTMENT RESEARCH CEMENT SECTOR COVERAGE
FEBRUARY, 2016
B alance Sheet 2013a 2014a 2015e 2016f 2017f
Cash & M arketable Securities 161 159 179 229 249
Trade Receivables-Net 42 56 50 52 57
Inventory 97 202 222 215 222
T o tal C urrent A sset 299 417 450 496 528
Net Fixed Assets 2,653 2,677 2,561 2,537 2,447
Projects Under Implementation 144 99 123 29 0
Other Assets 162 140 118 95 73
T o tal A ssets 3,259 3,334 3,252 3,158 3,048
Short Term Bank Debt 407 364 246 290 284
Accounts Payable 96 138 105 111 121
Other Current Liabilities 223 329 357 369 387
T o tal C urrent Liabilit ies 726 830 708 769 791
Long-Term Debt 1,097 844 793 497 213
Provisions 345 361 363 365 368
T o tal Shareho lders' Equity 1,090 1,298 1,388 1,526 1,676
T o tal Liab.& Shareho lders' Equity 3,259 3,334 3,252 3,158 3,048

20
PRIME INVESTMENT RESEARCH CEMENT SECTOR COVERAGE
FEBRUARY, 2016
“HOLD” MARKET PRICE EGP 16.8 FAIR VALUE EGP 29.6 POTENTIAL 76% UPSIDE
INVESTMENT GRADE “VALUE”
SUEZ CEMENT
Stock Data Outstanding Shares [in mn] 181.86 Mkt. Cap [in mn] 3,049.7 Bloomberg – Reuters SUCE EY / SUCE.CA 52-WEEKS EGP 16.5/EGP 42.5 DAILY AVERAGE TURNOVER (2015) EGP 0.7MN
Ownership Italecemnti Group 55% Abd El Menaam Rashed 7.9% Gazelle 7.61% Free Float 29.4%
Source: SUCE, Prime Estimates All prices are as of 16 February 2016
Source: Bloomberg
0
10
20
30
40
50 SUCE EGX30 - Rebased
Turning to net loss in FY2015, as a result of a compressed gross profit and soaring cogs:
Suez Cement indicators reported a net loss of EGP 60mn for the FY2015, a decline by
112% y.o.y compared to a net profit of EGP 492.6mn in FY2014. Gross profit declined by
61% y.o.y in FY2015 to be EGP 423mn from EGP 1,086mn in FY2014. This plunge in gross
profit is for two main reasons: a- The company sought a decrease of its sales revenues by
8.28% to be EGP 5,642mn in FY2015 from EGP 6,151mn in FY2014. b- Cogs soared by 3%
y.o.y, from EGP 5,065mn in FY2014 to be EGP 5,219mn. The lower sales revenue and
higher cogs are because of: 1- lower selling price which, on average, declined by about 9%
in FY2015 compared to FY2014. 2- Higher cost of energy which soared by 30%. c- Lower
sales volume in FY2015 compared to FY2014. Turning from using HFO to use coal by the
half of 2015, allowed Suez Cement facility to increase its utilization rates. However, as
Tourah still depends on HFO in 2015 and Helwan depends on a mix of HFO and natural
gas as their main sources of energy, cement utilization rates declined in FY2015 for the
two plants. This affected the total sales volume in FY2015 which recorded, in our
estimates, about 8mn ton for Suez Group. All of this resulted in a compressed gross profit
margin of 7.5% in FY2015 compared to a gross profit margin of 17.7% in FY2014. Taking a
closer look on FY2015 results we found that, 4Q was a negative one for SUCE as it turned
from recording net profit of EGP 69mn in 9M 2015, to record net loss of EGP 60mn in the
FY2015 according to the company’s released indicators. This indicates that the company
recorded net loss of more than EGP 120mn in 4Q only. In our opinion, this huge plunge in
the company’s margins in 4Q is mainly stemmed from the increase in cogs. We believe
that, there was a shortage in the government supply of HFO to the plants, this shortage
prompted the facilities to seek HFO supply from other sources, rather than the
government, at higher prices than the official price, and hence, increasing cogs. xx
A market leader aims to maintain its share. Suez Cement with its five cement plants
dominates the local cement industry in Egypt, with a total capacity of over 12mn ton of
cement. Despite of the lower prices in 2015, Suez Cement opted to maintain its leading
market share of 15% through operating at high utilization rates. We believe that, Suez
plant will increase its utilization rates in the coming years, starting 2016, until it reaches
100% utilization rate by 2019. On the other hand, the company’s management informed
us that they received all the required approval to use coal as source of energy in Helwan
and Tourah. And hence, we do not expect any increase in their utilization rates before
conversion is completed in 2018, according to our estimates.
Company Profile
Suez Cement was established in 1977 with a
production capacity of 4 mtpa. The company
started its operations by building its first plant
Suez followed by the Kattameya plant. The
company is traded in the EGX under the
symbol (SUCE) with a paid in capital of EGP
909mn and a par value of EGP 5. Suez Cement
is the largest cement producer in Egypt with a total cement capacity of 12 mtpa through its
five plants: Suez, Kattameya, Tourah, Helwan
and El Minya. The main shareholder of Suez
cement is Italcementi group, ranked as the
fifth cement producer in the world, acquires
55% of the total shares in Suez Cement.>

21
PRIME INVESTMENT RESEARCH CEMENT SECTOR COVERAGE
FEBRUARY, 2016
SOURCE: COMPANY FINANCIALS
SOURCE: COMPANY FINANCIALS
The plan to upgrade Tourah and Helwan into using coal provides a key for growth. As mentioned before
Tourah plant depends on HFO and Helwan plant depends on a mix of HFO and NG as main sources of
energy. As both Tourah and Helwan convert into using coal which is in a lower cost relative to both HFO
and NG, the cost/ton is expected to decline for Suez cement on the consolidated level. In addition, Suez
plants converted to use coal in 2015 which will also reduce cost/ton for the group. However, changing to
use coal in both Tourah and Helwan will not be before 2018, which will affect the cost/ton in the coming 2
years for the two plants affecting the whole company. The inclusion of 100% coal conversion in Tourah
and Helwan plants by 2018 would improve margins for the company. Gross profit margin would increase
by about 4% y.o.y, Meanwhile, EBITDA margin would jump to be 35% in 2018 compared to 24% in 2015
while net profit margin surge to be 7% in 2018.
The main risk to our valuation is the company’s ability to implement conversion plan in Tourah and
Helwan. As the plants are located in resedential areas, this may enforece the government to revoke
theapproval the company received.
One of the main advantages of Suez group is that it is a fully integrated player. Suez Cement has 11
subsidiaries providing complementary services, in addition to its cement plants, such as delivery services
and retail shops outlets for cement.
Company Suez Tourah Helwan
Location It operates 2 plants, one in Kattameya and the other is
in Suez.
It operates 2 plants, one in Al Minya which is 245Km away
from Cairo and the other one is in Tourah.
The plant is in Helwan
Lines 2 lines 2 lines 1 line Capacity 4.9mtpa 3mtpa 4.4mtpa
Company Main Activity Suez Cement Ownership
Tourah Portland Cement Cement production with a total capacity of 3mtpa 66%
Suez Bags the manufacture of bags that is used in packing cement and different products
56%
Helwan Cement Cement production with a total capacity of 4.4mtpa 100%
Ready Mix Concrete El Alamya Ready mix and building materials manufacture 52%
Hilal Cement Group Import, storage and distribution of cement and other building materials
51%
Egyptian Company for Development and Building Materila (DECOM)
The Manufacture of cement and Building materials 52%
Suez for Transportation and Trade Company Transporting and trading cement & building materilas
96%
Development for Industries Company Investing in all types of industrials fields 98%
Axim Egypt Investing in all types of industrials fields 98%
Suez for Imports & Exports Importing & Exporting cement and all kinds of building materials
96%
Suez Lime Company Producing and trading lime with all its different types 50%

22
PRIME INVESTMENT RESEARCH CEMENT SECTOR COVERAGE
FEBRUARY, 2016
SUEZ CEMENT
SOURCE: IDA
TOURAH CEMENT HELWAN CEMENT
SOURCE: COMPANY FINANCIALS & PRIME RESEARCH ESTIMATES
SUEZ CEMENT CONS EBITDA & NPM SUEZ CEMENT CONS CAPEX & CAPEX/SALES
Sales 2009 2010 2011 2012 2013 2014 11M 2015
Suez Sales 12,773,656
11,056,751
9,818,893
8,295,759
7,578,536
7,924,753
7,285,625
Mkt sales 51,031,184
47,846,951
48,214,200
51,135,005
50,094,510
51,283,842
48,591,368
Mkt Share 25% 23% 20% 16% 15% 15% 15%
0%
20%
40%
60%
80%
100%
120%
0
1000
2000
3000
4000
5000
6000
2012
2014
2016
2018
2020
Mn
To
n
Production Utilization
0%
20%
40%
60%
80%
100%
120%
0
500
1,000
1,500
2,000
2,500
3,000
3,500 20
12
2014
2016
2018
2020
Mn
To
n
Production Utilization
0%
2%
4%
6%
8%
10%
12%
14%
16%
-
100,000
200,000
300,000
400,000
500,000
600,000
700,000
800,000
900,000
1,000,000
2013 2014 2015 2016 2017 2018 2019 2020
CAPEX CAPEX to revenues
0%
10%
20%
30%
40%
50%
60%
70%
80%
90%
100%
-
500
1,000
1,500
2,000
2,500
3,000
3,500
4,000
4,500
2012
2013
2014
2015
2016
2017
2018
2019
2020
Mn
To
n
Production Utilization
-5%
0%
5%
10%
15%
20%
25%
30%
35%
40%
2012 2013 2014 2015 2016 2017 2018 2019 2020
EBITDA Margin Net Profit Margin

23
PRIME INVESTMENT RESEARCH CEMENT SECTOR COVERAGE
FEBRUARY, 2016
Valuation
We Initiate Coverage for Suez Cement Group reaching a fair value of EGP 29.6; implying an upside
potential of 76%, using a DCF valuation methodology. We valued SUCE utilizing an average WAAC over
our forecasted horizon of 14.9%, a risk free rate of 9.7%, an equity risk premium of 8% and a perpetual
growth rate of 3%. We preferred to assign SUCE a beta of 0.75 above the statistical Beta of 0.59, we
preferred to increase beta to reflect the risk stemmed of the uncertainty regarding conversion plan in
Tourah and Helwan.
Income Statement 2013a 2014a 2015e 2016f 2017f
Revenue 5,049 6,152 5,561 5,797 6,138
Growth 9.8% 21.8% -9.6% 4.2% 5.9%
COGS 3,736 4,617 4,694 4,625 4,743
S,G & Admin. Expenses -335 -436 -479 -502 -534
EBITDA 1,099 1,187 382 664 854
Growth -1.4% 7.9% -67.8% 73.5% 28.7%
EBITDA Margin 22% 19% 7% 11% 14%
Depreciation & Amortization 379 448 462 486 503
EBIT 720 738 -79 178 351
Interest Expense 13 23 28 58 60
Pre Tax Income 729 765 -83 130 317
Income Tax 221 285 -15 28 71
Effective Tax Rate 30% 37% 18% 21% 23%
Net Income 538 493 -61 85 227
Growth 2.6% -8.5% -112.5% -238.0% 167.9%
Net Attributable Income - NAI 538 493 -61 76 204
Growth 2.6% -8.5% -112.5% -224.2% 167.9%
NPM 10.7% 8.0% -1.1% 1.5% 3.7%
Upside Risk Downside Risk
1) Stability of NG supply for Helwan plants.
1) Withdrawl of the coal licenses in Tourah & Helwan plants, since
2) Higher than expected demand the two plants are located in resedential areas.
3) Higher selling price based on location 2) FX risk for imported coal
3) Lower Demand in Upper Egypt with most of projects
in Cairo and Delta areas

24
PRIME INVESTMENT RESEARCH CEMENT SECTOR COVERAGE
FEBRUARY, 2016
Balance Sheet 2013a 2014a 2015e 2016f 2017f
Cash & Marketable Securities 1,817 1,626 1,265 1,633 1,767
Trade Receivables-Net 204 220 168 166 170
Inventory 844 1,194 1,345 1,325 1,359
Total Current Asset 3,129 3,488 3,128 3,487 3,680
Net Fixed Assets 3,523 3,886 3,788 3,570 3,385
Projects Under Implementation 536 607 319 381 600
Total Assets 9,971 10,765 10,019 10,223 10,449
Short Term Bank Debt 3 67 481 490 479
Total Current Liabilities 1,265 1,953 1,958 2,042 2,034
Long-Term Debt 58 147 149 119 89
Provisions 670 720 785 833 880
Total Shareholders' Equity 7,930 7,865 7,030 7,114 7,311
Total Liab.& Shareholders' Equity 9,971 10,765 10,019 10,223 10,449
Year 2013a 2014a 2015e 2016f 2017f
Revenue (EGP mn) 5,049 6,152 5,561 5,797 6,138
Growth 10% 22% -10% 4% 6%
EBITDA margin 22% 19% 7% 11% 14%
Net Income (EGP mn) 538 493 -61 85 227
Net Attr. Income (EGP mn) 538 493 -61 76 204
EPS (EGP) 3.0 2.7 -0.3 0.5 1.2
EPS Growth 2.6% -8.5% -112.5% -238.0% 167.9%
DPS (EGP) 0.3 0.2 0.0 0.1 0.4
BVPS (EGP) 43.6 43.2 38.7 39.1 40.2
P/E x 5.67 6.19 -49.70 36.01 13.44
Dividend Yield 2% 1% 0% 1% 3%
P/Book x 0.38 0.39 0.43 0.43 0.42

25
PRIME INVESTMENT RESEARCH CEMENT SECTOR COVERAGE
FEBRUARY, 2016
“HOLD” MARKET PRICE EGP 3.53 FAIR VALUE EGP 5.49 POTENTIAL 55% UPSIDE
INVESTMENT GRADE “VALUE” SOUTH VALLEY CEMENT
Stock Data Outstanding Shares [in mn] 482.3 Mkt. Cap [in mn] 1,703.4 Bloomberg – Reuters SVCE EY / SVCE.CA 52-WEEKS EGP 3.3/EGP 7.2 DAILY AVERAGE TURNOVER (2015) EGP 2.3MN
Ownership Blue Nile LTD 37.7% GAZELLE LTD INC 9.3% Al Nahla Co 8.2% Free Float & Others 44.8%
Source: SVCE, Prime Estimates All prices are as of 16 February 2016
Source: Bloomberg
0
2
4
6
8
10 SVCE EGX30 - Rebased
Company Profile
South Valley Cement Company was
established in 1997 to produce top quality
cement and its associated products, as well
as a wide range of other premium building
materials products such as Ready Mix,
beside owning and managing a huge
portfolio of diverse multi sector direct and
indirect investments. The company has
been listed on the EGX since 1998 and
currently operates at a clinker capacity of
1.6mtpa equivalent to 1.76mtpa cement
capacity
Declining net profit for 9M 2015 on the back of lower gross profit and higher Marketing
expenses SVCE reported a 27% y-o-y decline in net profit to reach EGP72.5mn. Despite
maintaining almost an unchanged gross profit the company suffered from a declining
gross profit margin to reach 19% (versus 30% in 9M 2014). The company enjoyed a 56%
revenue increase on the back of increased volume. Like most Egyptian cement producers
the company suffered from natural gas shortage in 2014 causing them to operate at
lower utilization rates with SVCE operating as low as 61%. However during 2015 the
government has ensured the supply of HFO as a substitute for natural gas, which despite
being more costly ensures the continued operations for the companies leading to a
utilization of 87%. In terms of production costs, the company has endured higher costs
due to the increased energy costs after using HFO. The increase in selling and marketing
expenses is also a main reason for the declining net profit which surged 192% to reach
EGP48mn in 9M 2015 causing an additional burden on the company’s EBITDA and net
profit. We expect SVC to record a net profit of EGP 85.4mn in 2015. This is caused by the
declining gross profit due to the its high COGS/ton of EGP 439. The high marketing
expenses are expected to remain and pressure the EBITDA which is expected to drop 33%
y-o-y. As a result EBITDA margin is expected to drop significantly to 20%, while the net
margin is expected to also drop significantly to reach 10%.
Coal conversion key to future improvement of financial position. SVC’s declining gross
margin in 2015 has been mainly caused by the decreasing gross profit margin. While
revenues declined on lower prices COGS inflated mainly based on energy. South Valley
Cement has been operating on a natural gas/ HFO energy mix in 2014, however due to
the lack of natural gas the company was forced to use HFO for 100% of its energy needs
which stands between EGP235/ton – EGP272/ton of cement compared to EGP214/ton of
cement for natural gas. Going forward we expect a complete surge in operations as a
result of coal conversion. SVC is expected to include coal in its energy mix by 2016 with a
much lower current value EGP118/ton of cement. Such conversion would be key to a
higher gross profit margin. The inclusion of coal for 45% of required energy would cause a
5% y-o-y decline for COGS/ton to reach EGP417 by 2016. In 2016 EBITDA margin jumps to
reach 33% (versus 20% in 2015) while net profit margin surge to reach 22%. It is
noteworthy, that global coal forecasts have been cut significantly as we showed
previously in correlation with declining oil prices. That would set a further advantage for
companies converting to coal. COGS/ton would drop further to reach EGP385 by 2017.
However, this stands only for the first production line as the second line relies on
imported clinker at a much higher cost. This explains the significant drop in gross profit
margin which remains at an average of 24% between 2017-2020 compared to 36% in
2016. Both EBITDA and net margins drop as a result of the high cost of imported coal to
average at 22% and 13% for this same period (2017-2020), respectively.

26
PRIME INVESTMENT RESEARCH CEMENT SECTOR COVERAGE
FEBRUARY, 2016
SVC PRODUCTION & UTILIZATION SVC COGS/TON & COGS-TO-SALES
SOURCE: SVC FINANCIALS & PRIME RESEARCH ESTIMATES
South Valley to double capacity by 2017 SVCE is expected to add a further capacity at a total cement
capacity of 1.76mtpa starting 2017. This added capacity is set to increase the company’s market share
after reaching a total capacity of 3.4mtpa. Adding to the companies sold volume would signal improved
the company’s profits due to its higher selling prices. Moreover, the new projects and added demand
which is expected to surpass market capacity by the end of 2017 ensures a market for the increased
production capacity. However, a main concern for this line is that it relies on imported clinker as it doesn’t
own a silo to produce clinker. Imported clinker costs is significantly higher than produced clinker which
would force the company to maintain lower utilization rates for the second line in case it becomes value
destructive. This could be caused by a further devaluation for the Egyptian pound or even the FX shortage
that remains a concern.
New licenses represent key opportunity SVC would benefit from acquiring one of the new licenses as it
enables them to produce clinker for the second line instead of importing them cutting the COGS
significantly in addition to removing any FX risk. Furthermore, SVC would be able to operate at full
utilization for the second line and take advantage of its relatively higher selling prices. Such a key change
would add significant value to the company. We note that such value was not take into our valuation of
the company since no official steps have been taken however if such action occurs it would cause a
revision for the company’s target price.
0%
10%
20%
30%
40%
50%
60%
70%
80%
90%
0
100
200
300
400
500
600
2011 2012 2013 2014 2015 2016 2017 2018 2019 2020
EGP
COGS/ton
COGS/ton (excluding import Cost)
COGS to Sales
0%
10%
20%
30%
40%
50%
60%
70%
80%
90%
100%
0
500
1,000
1,500
2,000
2,500
3,000
3,500
2011 2012 2013 2014 2015 2016 2017 2018 2019 2020
mn
to
ns
Production Utilization

27
PRIME INVESTMENT RESEARCH CEMENT SECTOR COVERAGE
FEBRUARY, 2016
SVC EBITDA & NET MARGINS SVC CAPEX & CAPEX-TO-REVENUES
SOURCE: SVC FINANCIALS & PRIME RESEARCH ESTIMATES
Upside Risk Downside Risk 1) Conversion to coal to ensure lower production costs
1) FX risk for imported coal
2) Obtaining a license would be a great opportunity & would require a revision for current value
2) Lower Demand in Upper Egypt with most of projects
in Cairo and Delta areas
0%
5%
10%
15%
20%
25%
30%
35%
40%
45%
2011 2012 2013 2014 2015 2016 2017 2018 2019 2020
EBITDA Margin Net Profit Margin
-20%
-10%
0%
10%
20%
30%
40%
50%
60%
(200,000)
-
200,000
400,000
600,000
800,000
1,000,000
2012 2013 2014 2015 2016 2017 2018 2019 2020
EGP
, mn
CAPEX CAPEX to revenues
Valuation
We Initiate Coverage for South Valley Cement reaching a fair value of EGP 5.5; implying an upside
potential of 55%, using a DCF valuation methodology. We valued SVCE utilizing an average WAAC over
our forecasted horizon of 16.59%, a risk free rate of 9.7%, an equity risk premium of 8% and a perpetual
growth rate of 3%. We calculated SVCE’s adjusted statistical Beta which came at 1.10.

28
PRIME INVESTMENT RESEARCH CEMENT SECTOR COVERAGE
FEBRUARY, 2016
Income Statement 2013a 2014e 2015f 2016f 2017f
Revenue 572 662 875 926 1,757
Growth 9% 16% 32% 6% 90%
COGS 329 375 589 592 1,327
S,G & Admin. Expenses 23 14 16 17 19
EBITDA 220 273 271 317 412
Growth 56% 18% -33% 77% 31%
EBITDA Margin 38% 41% 31% 34% 23%
Depreciation & Amortization 50 61 68 69 70
EBIT 170 212 203 248 342
Interest Income 2 2 1 15 0
Interest Expense 29 27 19 48 81
Non-Operating Income 0 1 0 0 0
Non-Operating Expenses 0 2 46 0 0
Extra-Ordinary Items -10 -23 -1 0 0
Pre Tax Income 133 163 138 215 262
Net Income 133 163 138 215 262
Growth 25% 13% -44% 139% 22%
Net Attributable Income - NAI 133 163 138 215 262
Growth 25% 13% -44% 139% 22%
NPM 23% 25% 16% 23% 15%
Financial Highlights 2013a 2014e 2015f 2016f 2017f
Revenue (EGP mn) 572 662 875 926 1,757
Growth 9% 16% 32% 6% 90%
EBITDA margin 38% 41% 31% 34% 23%
Net Income (EGP mn) 133 163 138 215 262
EPS (EGP) 0.3 0.3 0.2 0.4 0.5
EPS Growth 26% 14% -44% 139% 22%
DPS (EGP) 0.2 0.0 0.0 0.0 0.1
BVPS (EGP) 6.8 6.7 6.9 7.3 7.8
P/E x 12.75 11.26 19.93 8.35 6.84
Dividend Yield 6% 0% 0% 1% 4%
P/BV x 0.52 0.53 0.51 0.48 0.45

29
PRIME INVESTMENT RESEARCH CEMENT SECTOR COVERAGE
FEBRUARY, 2016
Balance Sheet 2013a 2014e 2015f 2016f 2017f
Cash & Marketable Securities 88 113 304 81 234
Trade Receivables-Net 4 5 6 6 12
Inventory 55 71 71 74 145
Other Current Asset 4 4 7 7 13
Total Current Asset 151 194 388 168 403
Net Fixed Assets 1,683 1,654 1,646 1,596 1,545
Projects Under Implementation 29 24 0 435 870
Subsidiaries & Other Long Term Investments 1,884 1,825 1,790 1,808 1,862
Other Assets 254 257 263 263 263
Total Assets 4,000 3,953 4,087 4,271 4,944
Short Term Bank Debt 230 239 182 90 216
Accounts Payable 75 75 88 89 199
Other Current Liabilities 139 161 162 162 163
Total Current Liabilities 444 476 432 341 577
Long-Term Debt 250 234 325 395 604
Other Non Current Liabilities 1 1 3 3 3
Total Shareholders' Equity 3,305 3,242 3,328 3,531 3,760
Total Liab.& Shareholders' Equity 4,000 3,953 4,087 4,271 4,944

30
PRIME INVESTMENT RESEARCH CEMENT SECTOR COVERAGE
FEBRUARY, 2016

31
PRIME INVESTMENT RESEARCH CEMENT SECTOR COVERAGE
FEBRUARY, 2016
PRIME SALES TEAM
Hassan Samir Managing Director
+202 3300 5611 [email protected]
Mohamed Ezzat Head of Sales & Branches
+202 3300 5784 [email protected]
Shawkat Raslan Heliopolis Branch Manager
+202 3300 5110 [email protected]
Amr Saber Team Head-Institutions
Desk
+202 3300 5659 [email protected]
Amr Alaa, CFTe Manager
+202 3300 5609 [email protected]
Mohamed Elmetwaly Manager
+202 3300 5610 [email protected]
Emad Elsafoury Manager
+202 3300 5624 [email protected]
RESEARCH TEAM
+202 3300 5728
HEAD OFFICE
PRIME SECURITIES S.A.E. Regulated by CMA license no. 179 Members of the Cairo Stock Exchange 2 Wadi El Nil St., Liberty Tower, 7th-8th Floor, Mohandessin, Giza, Egypt Tel: +202 33005700/770/650/649 Fax: +202 3760 7543
Disclaimer Information included in this report has no regard to specific investment objectives, financial situation, advices or particular needs of the report users. The report is published for information purposes only and is not to be construed as a solicitation or an offer to buy or sell any securities or related financial instruments. Unless specifically stated otherwise, all price information is only considered as indicator. No express or implied representation or guarantee is provided with respect to completeness, accuracy or reliability of information included in this report. Past performance is not necessarily an indication of future results. Fluctuation of foreign currency rates of exchange may adversely affect the value, price or income of any products mentioned in this report. Information included in this report should not be regarded by report users as a substitute for the exercise of their own due diligence and analysis based on own assessment and judgment criteria. Any opinions given are subject to change without notice and may significantly differ or be contrary to opinions expressed by other Prime business areas as a result of using different assumptions and criteria. Prime Group is under no obligation responsible to update or keep current the information contained herein. Prime Group, its directors, officers, employees or clients may have or have had interests or long or short positions in the securities and/or currencies referred to herein, and may at any time make purchases and/or sales in them as principal or agent. Prime Group, its related entities, directors, employees and agents accepts no liability whatsoever for any loss or damage of any kind arising from the use of all or part of these information included in this report. Certain laws and regulations impose liabilities which cannot be disclaimed. This disclaimer shall, in no way, constitute a waiver or limitation of any rights a person may have under such laws and/or regulations. Furthermore, Prime Group or any of the group companies may have or have had a relationship with or may provide or have provided other services, within its objectives to the relevant companies. Prime Group 2016 all rights reserved. You are hereby notified that distribution and copying of this document is strictly prohibited without the prior approval of Prime Group.