cement outlook: 2007 annual concrete pavement workshop january 2007 salt lake city, ut steven ko pca...
TRANSCRIPT

Cement Outlook: 2007
Annual Concrete Pavement WorkshopJanuary 2007
Salt Lake City, UT
Steven Ko
PCA Senior Regional Economist

Key Points of Analysis
U.S. Economic Outlook
Construction Outlook
Cement Outlook
Residential
Nonresidential
Public
Demand
Operating Conditions
Residential
Nonresidential
Public
Regional Perspective

Economic Outlook : Real GDP Growth
-2
-1
0
1
2
3
4
5
6
7
8
Q1 Q2 Q3 Q4 Q1 Q2 Q3 Q4 Q1 Q2 Q3 Q4 Q1 Q2 Q3 Q4
2004: 4.2%
Real GDP Annual Growth Rate
----------2004---------- -------2005------- -------2006------ -------2007-------
2005: 3.5%
2006: 3.1%
2007: 2.6%

Economic Growth Conclusions
Consumption Growth Slows 2006-2007Consumption Growth Slows 2006-2007
Interest Rates Gradually RiseInterest Rates Gradually Rise

Snap Shot of Economic Activity
Investment15%
Government18%
Consumer69%
Consumption acts as the anchor for US economic activity.Consumption acts as the anchor for US economic activity.
Any retrenchment in consumer spending will lead to slower economy-wide growth rates

Consumer Spending
1.5%
2.0%
2.5%
3.0%
3.5%
4.0%
4.5%
5.0%
2000 2002 2004 2006 2009
Consumer Spending Outlook
Job & income Job & income growthgrowth
Oil prices, Oil prices,
inflation and inflation and interest ratesinterest rates
Affordability Affordability erosion erosion
Housing & refinancing

Oil Price Outlook
$10
$20
$30
$40
$50
$60
$70
$80
2000 2002 2004 2006 2008 2010
$ Per Barrel, West Texas Intermediate
Oil Prices are Oil Prices are declining as declining as projectedprojected
Strong International Strong International DemandDemand
Supply Disruptions Supply Disruptions ContinueContinue
OPEC ActionsOPEC Actions
2006: $65.85 per 2006: $65.85 per barrel WTI 2007: barrel WTI 2007: $60.30$60.30

Federal Reserve Policy Actions
0
1
2
3
4
5
6
7
2000 2002 2004 2006 2008
Federal Funds Interest Rate, Annual Percentage Rate
Overall Economy & Job Overall Economy & Job Growth SlowingGrowth Slowing
Inflation a growing Inflation a growing concern concern
Dilemma: Inflation or Dilemma: Inflation or Growth?Growth?
Do not count out further Do not count out further Fed TighteningFed Tightening
Risk of Fed over-Risk of Fed over-
reactionreaction
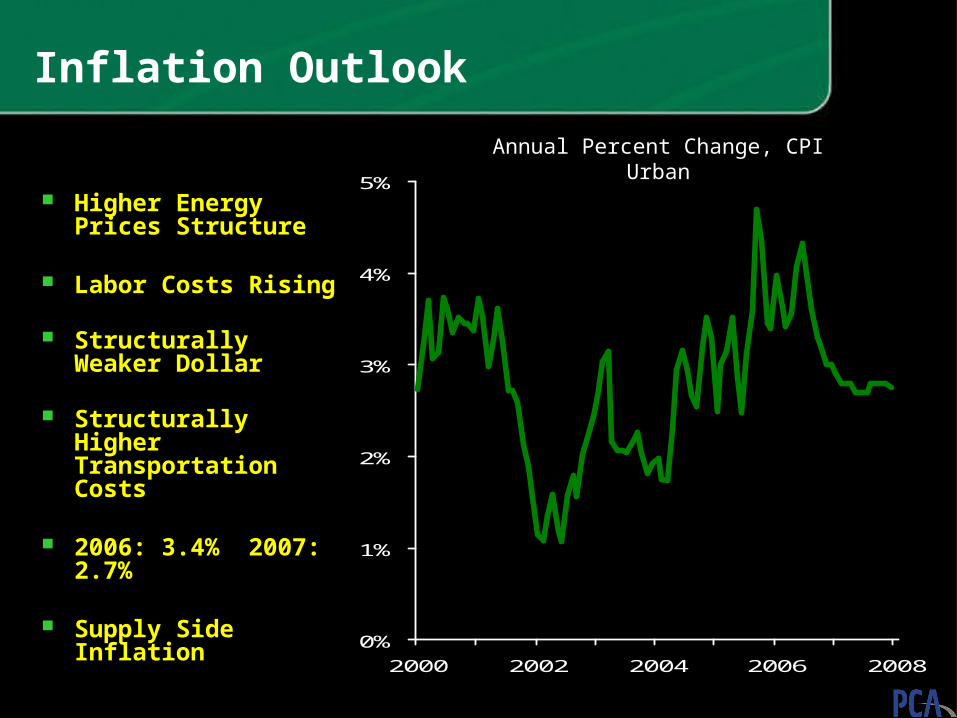
Inflation Outlook
0%
1%
2%
3%
4%
5%
2000 2002 2004 2006 2008
Annual Percent Change, CPI Urban
Higher Energy Higher Energy Prices StructurePrices Structure
Labor Costs RisingLabor Costs Rising
Structurally Weaker Structurally Weaker Dollar Dollar
Structurally Higher Structurally Higher Transportation Transportation CostsCosts
2006: 3.4% 2007: 2006: 3.4% 2007: 2.7%2.7%
Supply Side InflationSupply Side Inflation

Single Family Housing Starts
0
200
400
600
800
1,000
1,200
1,400
1,600
1,800
2,000
2001 2002 2003 2004 2005 2006 2007 2008 2009
(000) Units
Growing Downside Risks

Inventory Draw Required
2.0
3.0
4.0
5.0
6.0
7.0
8.0
2000 2001 2002 2003 2004 2005 2006
Homes on Market/Monthly Selling Rate
Ten Year Average
Inventory Build
Required
Inventory Draw
Required
Highest Level Highest Level Since 1997Since 1997

Mortgage Rate History: 30 Year Conventional
4.0
4.5
5.0
5.5
6.0
6.5
7.0
7.5
8.0
8.5
2000 2001 2002 2003 2004 2005 2006 2008
Annual Growth Rate, 30 Year Conventional
Peak to Peak to Trough Trough
294 Basis 294 Basis Point Point
DeclineDecline
Last 12 Last 12 Months Months
Reflect a Reflect a 100 Basis 100 Basis
Point Point IncreaseIncrease

Growing Home Price & Income Gap
-4.0%
-2.0%
0.0%
2.0%
4.0%
6.0%
8.0%
10.0%
12.0%
14.0%
16.0%
1990 1992 1994 1996 1998 2000 2002 2004
Annual Growth Rate Comparison
Home Prices
Household Income

Sub-Prime Mortgage Resets
0
5,000
10,000
15,000
20,000
25,000
30,000
35,000
40,000
45,000
50,000
2000 2001 2002 2003 2004 2005 2006 2007 2008
Total Loans Scheduled for Reset
Period of Emerging Period of Emerging TroubleTrouble

Single Family Permits - Utah
0
5,000
10,000
15,000
20,000
25,000
30,000
2001 2002 2003 2004 2005 2006 2007 2008 2009
# of units

Multi-Family Permits - Utah
3,300
3,400
3,500
3,600
3,700
3,800
3,900
4,000
4,100
4,200
2001 2002 2003 2004 2005 2006 2007 2008 2009
# of units

Residential Cement ConsumptionUtah
0
50,000
100,000
150,000
200,000
250,000
300,000
350,000
400,000
450,000
500,000
2000 2001 2002 2003 2004 2005 2006 2007 2008 2009
Metric Tons

Affordability Index
Most Affordable
Pacific
MountainWest North Central East North
Central
SouthAtlantic
East South
Central
West South Central
NewEngland
Middle Atlantic
Affordability Ratio
2nd Tier 3rd Tier 4th Tier Least Affordable

Economic Growth Conclusions
Consumption Growth Slows 2006-2007Consumption Growth Slows 2006-2007
Interest Rates Gradually RiseInterest Rates Gradually Rise
Investment Sector Strength Continues Investment Sector Strength Continues
Investment Spending
-10.0%
-5.0%
0.0%
5.0%
10.0%
15.0%
20.0%
2000 2002 2004 2006 2008
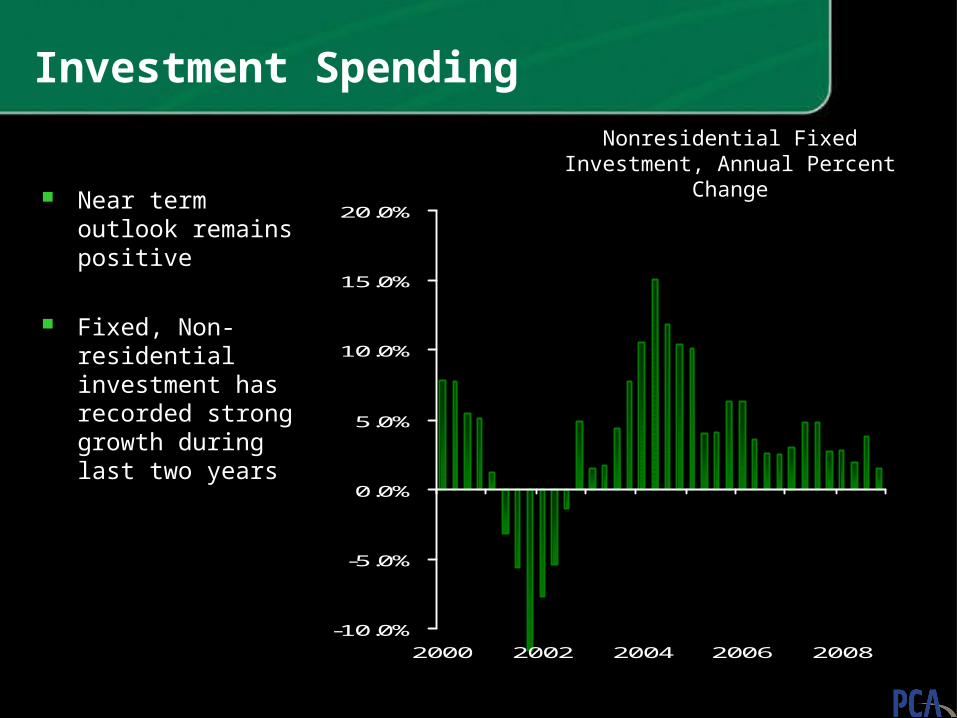
Nonresidential Fixed Investment, Annual Percent Change
Near term outlook Near term outlook remains positiveremains positive
Fixed, Non-residential Fixed, Non-residential investment has investment has recorded strong recorded strong growth during last two growth during last two yearsyears

Nonresidential Construction
-25.0%
-20.0%
-15.0%
-10.0%
-5.0%
0.0%
5.0%
10.0%
15.0%
20.0%
1999 2000 2001 2002 2003 2004 2005 2006
Annual Growth Rate+9.2% 2006 First Half
6.8% Projected 2006

Nonresidential Outlook
Lodging OutlookLodging Outlook
Retail OutlookRetail Outlook
Health Construction Outlook Health Construction Outlook
Office Building OutlookOffice Building Outlook
Industrial OutlookIndustrial Outlook

Labor Market Outlook
-600
-400
-200
0
200
400
600
2000 2002 2004 2006 2008
Monthly Net Job Creation, Payroll Survey
Job growth slowingJob growth slowing
Unemployment risesUnemployment rises
Slow down in trend Slow down in trend
of accelerating of accelerating wageswages
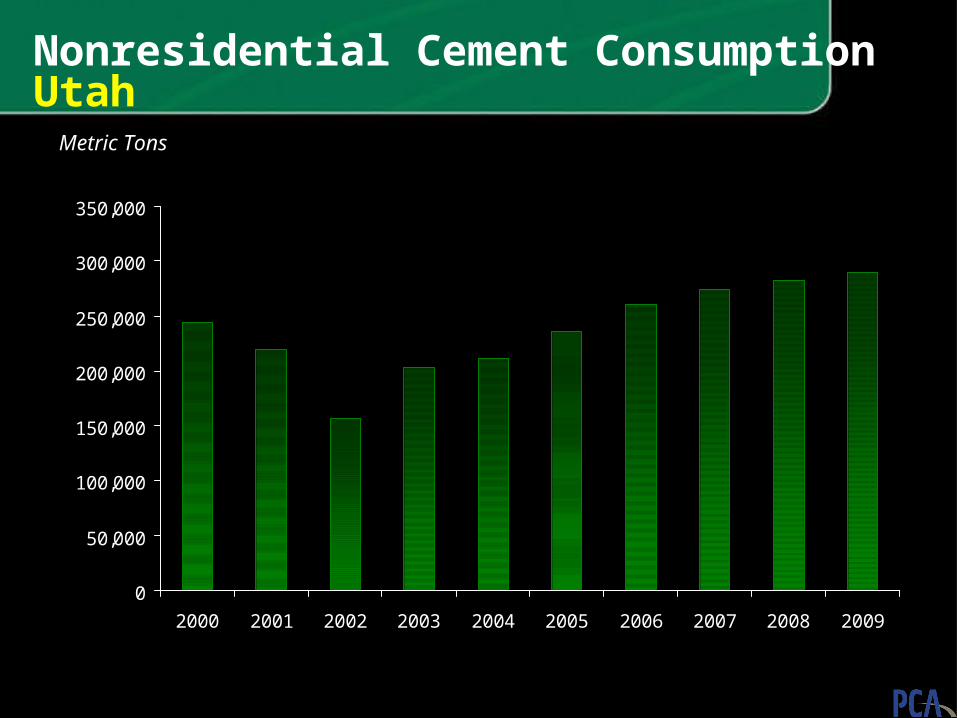
Nonresidential Cement ConsumptionUtah
0
50,000
100,000
150,000
200,000
250,000
300,000
350,000
2000 2001 2002 2003 2004 2005 2006 2007 2008 2009
Metric Tons

Economic Growth Conclusions
Consumption Growth Slows 2006-2007Consumption Growth Slows 2006-2007
Interest Rates Gradually RiseInterest Rates Gradually Rise
Investment Sector Strength Continues Investment Sector Strength Continues
Large Trade Deficit and Federal Deficit Act as Drag on Large Trade Deficit and Federal Deficit Act as Drag on
GrowthGrowth
Foundations for Growth remainFoundations for Growth remain

Public Construction Outlook:State & Local Share of Public Construction
85%
87%
89%
91%
93%
1990 1992 1994 1996 1998 2000 2002 2004
Percent of Total Public Construction Spending

Public Construction Outlook
-60
-40
-20
0
20
40
60
80
1979Q1 1991Q1 2003Q1
93% of public construction 93% of public construction performed at state/local performed at state/local level.level.
State/Local fiscal problems State/Local fiscal problems
fading.fading.
Revenue growth improves Revenue growth improves with economy and job with economy and job growth.growth.
Highway Bill adds strengthHighway Bill adds strength 2006: +4.8% 2007: +5.5%2006: +4.8% 2007: +5.5% Note: 2005: +1.9%Note: 2005: +1.9%
Billion $ State Surplus/Deficit, NIPA

MARI
NH
0-9% 20-29% 30-39%
Pacific
MountainWest North Central
East North Central
SouthAtlantic
East South
Central
District of Columbia
West South Central
NewEngland
Middle Atlantic
10-19%
Deficit as percentage of budget
$.85
$.11
$1.0
$.16$0
$.36
$.4 $.98
$0$1.5
$.05
$.38
$.3
$.12
$38
$3.7
$3.6
$.6
$.22
$.41
$1.0
$.09
$2.4$0
$2.0
$.75
$.5
$.49
$1.3
$1.7
$.2
$.2
$2.4
$9.3
$2.0
$.74
$4.6
$.14$.4
$.15$3.0$.17
$.85$.2
NJ$1.9CT
MDDE
VT
$.25$1.1
$2.0
$.03
$.08
Primary Source: Newsweek July 28, 2003
Secondary Sources:Nat’l Conf. of State Leg., Center on Budget and Policy Priorities, Nat’l Assn. of State Budget Officers, Calif. Budget Project
Dollar figures, in billions, indicate amount states had to save to balance 2004 budget.
KEY
Public Construction Outlook: State Deficit Estimates Fiscal Year 2004

MARI
NH
Public Construction Outlook: State Deficit Estimates Fiscal Year 2005
0-9% 20-29% 30-39%
Pacific
MountainWest North Central
East North Central
SouthAtlantic
East South
Central
District of Columbia
West South Central
NewEngland
Middle Atlantic
10-19%
Deficit as percentage of budget
$0
$0
$0
$0
$.3
$1.1
$.17
$15
$0
$2
$.5
$.34
$.71
$.19
$.0
$.6
$.62
$.17
$.9
$0
$5.1
$5
$.14
$0$1.5$.19
$.74
NJ$.2CT
MD$.93
$.8
Secondary Source: National Association of Budget Officers
Dollar figures, in billions, indicate amount states had to save to balance 2005 budget.
KEY
No availabledata
DE $0
$0
$.9
$0
$.6$.2
$.9
$0
$.21
$0
$0
$0
$.3
$0
$.5
$0
$0
VT $0
$.12
$0
Primary Source: Center on Budget Policy and Priorities Feb / 04

Public Cement Consumption Utah
0
200,000
400,000
600,000
800,000
1,000,000
1,200,000
2000 2001 2002 2003 2004 2005 2006 2007 2008 2009
Metric Tons

Changing Composition of Construction Spending
Growth Leader: ResidentialGrowth Leader: Residential
Public: Weak Tax Public: Weak Tax RevenuesRevenues
Growth Laggard: Growth Laggard: NonresidentialNonresidential
Growth Leader : Growth Leader : NonresidentialNonresidential
Public: Tax Revenues Public: Tax Revenues RecoverRecover
Growth Laggard : Growth Laggard : ResidentialResidential
2001-2005 2006-2009
Low Interest Rates, Weak Economy
Rising Interest Rates, Strong Economy

-6.0%
-4.0%
-2.0%
0.0%
2.0%
4.0%
6.0%
8.0%
2000 2002 2004 2006 2008 2010
0
20,000
40,000
60,000
80,000
100,000
120,000
140,000
160,000
Growth Rate Yellow Line Volume, Green Bar
Portland Cement Outlook
Thousand Metric TonsAnnual Percent Change

No Shortage Tight Supplies
Cement Supply Survey Summer 2006
Spot Tight Supplies

Market Balances: Trend
0
20000
40000
60000
80000
100000
120000
140000
160000
2002 2004 2006 2008 2010
-6,000
-4,000
-2,000
0
2,000
4,000
6,000
8,000
2002 2004 2006 2008 2010
0
5
10
15
20
25
Inventory Adjustment
Adjusted Supply Vs ConsumptionGreen: Domestic Yellow: Imports
Green: Inventory Red: Day Supply

50,000
60,000
70,000
80,000
90,000
100,000
110,000
120,000
1980 1985 1990 1995 2000 2005 2010
$5.0 Billion Committed to Expansion
Thousand Metric Tons Clinker
Cement Capacity Outlook

Domestic Supply Conclusions
Tight market conditions dramatically reducedTight market conditions dramatically reduced
Characterized by high operating ratesCharacterized by high operating rates
Persistently lean inventory positionPersistently lean inventory position
Major expansion does not materialize until 2008.Major expansion does not materialize until 2008.
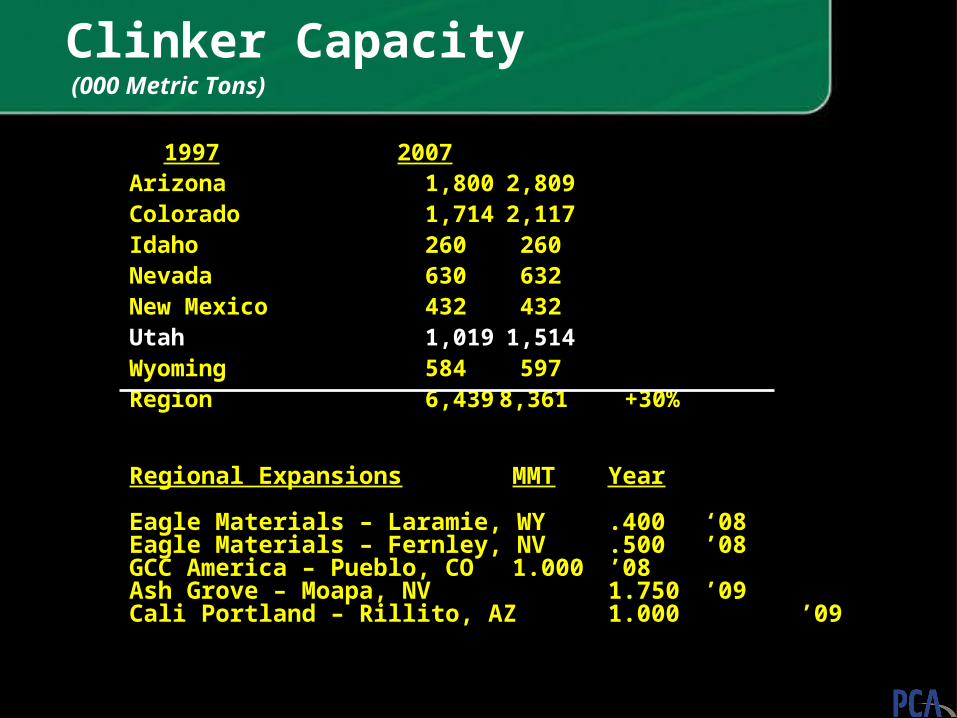
Clinker Capacity (000 Metric Tons)
19971997 20072007ArizonaArizona 1,8001,800 2,8092,809ColoradoColorado 1,7141,714 2,1172,117IdahoIdaho 260260 260260NevadaNevada 630630 632632New MexicoNew Mexico 432432 432432UtahUtah 1,0191,019 1,5141,514WyomingWyoming 584584 597597RegionRegion 6,4396,439 8,361 8,361 +30%+30%
Regional Expansions MMT Year
Eagle Materials – Laramie, WY .400 ‘08Eagle Materials – Fernley, NV .500 ’08GCC America – Pueblo, CO 1.000 ’08Ash Grove – Moapa, NV 1.750 ’09Cali Portland – Rillito, AZ 1.000 ’09

20032003 20042004 20052005 20062006 20072007
ArizonaArizona 3.613.61 4.124.12 4.674.67 4.614.61 4.714.71 %Change%Change 10%10% 14%14% 13%13% -1%-1% 2%2%
ColoradoColorado 2.292.29 2.442.44 2.592.59 2.612.61 2.692.69% Change% Change -12%-12% 7% 7% 6%6% 1%1% 3%3%
IdahoIdaho 0.590.59 0.690.69 0.710.71 0.710.71 0.700.70 %Change%Change 4%4% 16%16% 3%3% 1%1% -1%-1%
NevadaNevada 2.032.03 2.382.38 2.602.60 2.652.65 2.702.70 %Change%Change 10%10% 18%18% 9%9% 2%2% 2%2%
New MexicoNew Mexico 0.810.81 0.940.94 0.900.90 0.920.92 0.940.94 %Change%Change -1%-1% 16%16% -4%-4% 3%3% 1%1%
UtahUtah 1.201.20 1.371.37 1.541.54 1.601.60 1.661.66 %Change%Change 3%3% 14%14% 12%12% 4% 4% 4%4%
WyomingWyoming 0.420.42 0.460.46 0.480.48 0.480.48 0.490.49 %Change%Change 3%3% 9%9% 4%4% 1%1% 2%2%
U.S.U.S.%Change%Change 4%4% 7%7% 6%6% 1%1% 1%1%
Regional Portland Cement Consumption(Million Metric Tons)

Key Markets Exposure - Utah
Cement Consumption as % of Total State Cement Consumption
Residential: Residential: 27 %27 % National: 35%National: 35%
Nonresidential: Nonresidential: 16%16% National: 18%National: 18%
Public: Public: 56%56% National: 47%National: 47% Highway: Highway: 34%34% National: 30%National: 30%
Cement per Capita U.S.: .41
Cement per Capita Utah: .64

Residential Spending: Regional
1 Idaho 39.5%
United States 35.2%
2 New Mexico 32.1%
3 Arizona 31.2%
4 Colorado 28.6%
5 Utah 27.4%
6 Nevada 26.7%
7 Wyoming 13.0%
Cement Consumption as % of Total State Cement Consumption

Nonresidential Spending: Regional
1 Wyoming 38.7%
2 Colorado 27.6%
3 New Mexico 26.6%
4 Idaho 25.7%
5 Nevada 21.2%
6 Arizona 19.7%
United States 18.1%
7 Utah 16.3%
Cement Consumption as % of Total State Cement Consumption

Public Spending: Regional
1 Utah 56.0%
2 Nevada 52.0%
3 Arizona 48.9%
4 Wyoming 48.2%
United States 47.0%
5 Colorado 43.7%
6 New Mexico 41.1%
7 Idaho 34.3%
Cement Consumption as % of Total State Cement Consumption

Street & Highway Spending: Regional
1 Wyoming 38.5%
2 Utah 33.6%
3 Nevada 32.5%
United States 29.9%
4 Arizona 26.4%
5 Idaho 23.5%
6 Colorado 23.3%
7 New Mexico 23.3%
Cement Consumption as % of Total State Cement Consumption

Cement Outlook - Utah
0
200,000
400,000
600,000
800,000
1,000,000
1,200,000
1,400,000
1,600,000
1,800,000
2000 2001 2002 2003 2004 2005 2006 2007 2008 2009
Metric TonsYear
2005 12.2%
2006 3.6%
2007 4.1%
2008 0.1%

Conclusions
Slower Economic Growth AheadSlower Economic Growth Ahead
Construction Market FlatteningConstruction Market Flattening
Cement Supply Slow to Adjust to Slower Growth Cement Supply Slow to Adjust to Slower Growth
Environment Environment
Slower Growth in Cement ConsumptionSlower Growth in Cement Consumption

Cement Outlook: 2007
Annual Concrete Pavement WorkshopJanuary 2007
Salt Lake City, UT
Steven Ko
PCA Senior Regional Economist