cembranolides from the stem bark of the southern african medicinal
TRANSCRIPT

1
Cembranolides from the stem bark of the southern African medicinal plant,
Croton gratissimus (Euphorbiaceae)
Dulcie A. Mulholland,a,b,1 Moses K. Langat,a,b Neil R. Crouch,b,c Helen M. Coley,d
Emily M. Mutambi e and Jean-Marc Nuzillard. f
a Division of Chemical Sciences, Faculty of Health and Medical Sciences, University
of Surrey, Guildford, GU2 7XH, Surrey, UK. b School of Chemistry, University of KwaZulu-Natal, Durban, 4041, South Africa c Ethnobotany Unit, South African National Biodiversity Institute, PO Box 52099,
Berea Road 4007, Durban, South Africa d Division of Biochemical Sciences, Faculty of Health and Medical Sciences,
University of Surrey, Guildford, GU2 7XH, Surrey, UK. e University of Bristol, School of Chemistry, Cantocks Close, BS8 1TS, Bristol, UK f Pharmacognosy Laboratory, University of Reims, Moulin de la House, BP 1039,
51687 Reims Cedex 2, France
Abstract: The stem bark of Croton gratissimus (Euphorbiaceae) yielded four novel
cembranolides, including the first reported example of a 2,12-cyclocembranolide,
(+)–[1R*,2S*,7S*,8S*,12R*]–7,8-epoxy-2,12-cyclocembra-3E,10Z-dien-20,10-olide,
whose structure was confirmed by means of single crystal X-ray analysis. This
compound showed moderate activity against the PEO1 and PEO1TaxR ovarian cancer
cell lines.
Keywords: Croton gratissimus, Euphorbiaceae, cembranoids, (+)–
[1R*,2S*,7S*,8S*,12R*]–7,8-epoxy-2,12-cyclocembra-3E,10Z-dien-20,10-olide; (+)–
[1R*,10*R]-cembra-2E,4E,7E,11Z-tetraen-20,10-olide; (+)–[1R*,4S*,10R*]-4-
hydroxycembra-2E,7E,11Z-trien-20,10-olide; (-)–[1R*,4R*,10R*]-4-hydroxycembra-
2E,7E,11Z-trien-20,10-olide; Logic for Structure Determination Programme; PEO1
and PEO1TaxR ovarian cancer cell lines; Single crystal X-ray analysis.
1 Corresponding Author: D.A.Mulholland, Division of Chemical Sciences, University of Surrey, Guildford, GU2 7XH, United Kingdom. [email protected]. Tel =44 (0)1483 686827.

2
1. Introduction:
Of the approximately 750 species of Croton L. (Euphorbiaceae) distributed
throughout the tropics, some 50 are found in Africa (Mabberley 2008), and only 10
species are native to the Flora of southern Africa region. Croton gratissimus Burch.
(syn. C. zambesicus Müll. Arg.; C. microbotryus Pax.) is represented by two varieties,
the typical one (C. gratissimus Burch. var. gratissimus) being the subject of this
account. This semi-deciduous tree species is widespread in sub-Saharan Africa,
occurring on stony or rocky hillsides throughout much of the warmer and drier
regions, from South Africa northeastwards to the horn of Africa. The leaves produce a
pleasant lavender-like scent when crushed, and are used dried and powdered for their
perfume (Palmer and Pitman, 1972). Across its range it is an important
ethnomedicinal species: the Zulu use milk infusions of the bark as purgatives for
stomach and intestinal disorders, despite its toxic reputation (Bryant, 1966).
Elsewhere several other crotons including the Asian C. tiglium L., and C. flavens L.
from the Caribbean have been so employed, although diterpenes from both have been
implicated in indirect carcinogenesis (oesophageal cancer) through activation of the
Epstein-Barr virus (Hecker, 1981; Bruneton, 1995). The Zulu further treat unspecified
uterine disorders with powdered bark blown into the womb. They also remedy
pleurisy or pleurodynia by rubbing the powdered bark into chest skin incisions to act
as a counter-irritant, given its cutaneous eruptive irritant and stimulant properties
(Bryant 1966). As a cure for insomnia and restlessness, the leaves are ground with
goat fat and those of two other Croton species, the paste heated on coals and the
fumes inhaled (Palmer and Pitman, 1972). Gerstner (1941) further recorded the
purgative properties of the roots, and documented their application in treating fevers.
Zimbabweans treat coughs with smoke from leaves, and take root infusions for
abdominal pains and as an aphrodisiac (Gelfand et al., 1985). In Botswana a
decoction prepared with leaves is taken for coughs (Hedberg and Staugård, 1989).
Watt and Breyer-Brandwijk (1962) documented the use of C. gratissimus bark in
treating painful respiratory conditions (including intercostal neuralgia), unspecified
plant parts as a remedy for fevers, charred, powdered bark for bleeding gums, and
leaves to treat both eye disorders and rheumatism. In Venda, leaves are dried and
smoked for influenza, colds and fevers (Mabogo, 1990). Doubts about the toxicity of
this species have been raised due to the esteem with which leaves have been held as a
stock food in Namibia (Watt and Breyer-Brandwijk, 1962).

3
In this country roots and leaves of this taxon have found application as a treatment for
colds and coughs, bark for ear problems, and roots for chest ailments and fever (Von
Koenen, 2001). From the above usage profiles of C. gratissimus the following diverse
bioactivities are indicated: analgesia, febrifugal, aphrodisiac, purgative, emetic,
soporific, antibiotic and antiviral. The febrifugal activity of C. gratissimus (in the
context of malaria) has earlier been demonstrated: Clarkson et al. (2004) found DCM
extracts of the leaves to show a high antiplasmodial activity in vitro of 3.5 µg/ml. In
the current study, congnisance has been taken of the use of this species for
unspecified abdominal pains (Gelfand et al., 1985), an indication of potential
antineoplastic applications (Charlson, 1980), especially as the Zulu treat unspecified
uterine disorders with powdered bark preparations (Bryant, 1966). Accordingly,
isolates from the bark were screened against PEO1 and PEO1TaxR ovarian cancer
cell lines.
Previous investigations of the genus Croton have yielded pimarane (Block et al.,
2004), kaurane (Kuo et al., 2007 ), labdane (Garcia et al., 2006 ), clerodane (Garcia et
al., 2006) and cembrane (Pudhom et al., 2007) diterpenoids, isoquinoline alkaloids
(New World species only) (Charris et al., 2000 ) and triterpenoids (Block et al.,
2004).
2. Results and discussion:
The hexane and dichloromethane extracts of the stem bark of Croton gratissimus
yielded lupeol, 4(15)-eudesmene-1,6-diol, -glutinol and four novel cembrane
diterpenoids, 1 - 4.
HREIMS of compound 1 indicated a molecular formula of C20H28O3. The IR
spectrum showed a peak at 1777 cm-1 and a resonance at 183.6 indicating the
presence of a carbonyl group. Interestingly, this was the only one of the four
compounds that was very stable on standing and crystalline. These spectroscopic
values differed considerably from the carbonyl stretch which occurred at 1733-1740
cm-1 in the IR spectra and at approximately 174 in the 13C NMR spectra of
compounds 2-4. The 13C NMR spectrum showed that compound 1 had two
trisubstituted double bonds (128.5 (CH), 136.0 (C); 151.2 (C), 110.6 (CH))

4
indicating, in conjunction with the molecular formula, that the molecule contained
four rings. The 1H NMR spectrum showed the presence of two secondary methyl
groups ( 0.85 (d, J=6.6 Hz), 0.92 (d, J=6.6 Hz)) which were ascribed to H3-16 and
H3-17 of a cembranoid structure. These resonances were seen to be coupled to the H-
15 resonance (1.68) which was coupled further to the H-1 resonance at 1.70. The
H-1 resonance showed further coupling with the two H-14 resonances (1.84 and
1.67), and a single proton resonance which could be ascribed to H-2 ( 2.91, t, J =
9.6 Hz). The H-2 resonance showed coupling in the COSY spectrum with an alkene
proton resonance ( 4.85, d, J=9.6 Hz) which was assigned to H-3, enabling
placement of the first double bond at C-3. The H-3 resonance showed long range
coupling with the H3-18 proton resonance at 1.52. The corresponding C-18
resonance occurred at 15.1, confirming the E-configuration of the double bond
(Lange et al., 1986). Interestingly, the H-2 resonance showed correlations in the
HMBC spectrum with the carbonyl carbon resonance (183.6) and the second alkene
carbon resonance (110.6), suggesting a linkage across the cembranoid. The presence
of an epoxide ring was suggested with resonances at 63.0 (CH) and 61.9 (C)
leaving a methyl group, and four further methylene groups to be placed. Use was
made of the Logic for Structure Determination Program to complete the structure of
the molecule and to rule out the possibility of any other possible structure. According
to the usual LSD protocol (Nuzillard, 2003; Nuzillard, 2008), the 13C NMR
resonances of 1 were first identified by numbers ranging from 1 to 20, in the
decreasing order of chemical shift values. The 1H NMR resonances were identified
using the HSQC spectrum, so that a carbon atom and a hydrogen atom that are
directly bonded share the same identifier. Then, a status was assigned to each atom,
which is defined by its chemical element, its hybridization state and the number of
bonded hydrogen atoms (also named, multiplicity). Only the carbon atoms whose
chemical shift is over 110 ppm are doubtless sp2 hybridized. There must be an even
number of sp2 atoms in a molecule and therefore one of the oxygen atoms is sp2.
Carbon 1 (LSD numbering) at δ 183.62 is thus supposed to be doubly bonded to an
oxygen atom. The number of hydrogen atoms that are bonded to each carbon atom
was determined from the 1D J-modulated 13C NMR spectrum and from the 2D HSQC
spectrum. Overall, 28 hydrogen atoms were counted, leading to the presence of 2 sp3
oxygen atoms with no exchangeable proton. For each atom, the status and the

5
identifiers of the protons that correlate in the HMBC spectrum are reported in
Supplementary Material 1. Moreover, the protons of the methyl groups 17 and 19
appear as doublets and therefore carbons 17 and 19 have a methine group as
neighbours. In addition, the protons of the methyl groups 18 and 20 appear as singlets
and therefore carbons 18 and 20 have quaternary carbons as neighbours. With these
constraints, LSD produced 169 structures. All carbons with δ < 34 were then
considered to have only carbon atoms as neighbours. LSD then produced 13
solutions. In many of them, there were bonds between sp3 oxygens and sp3 carbons
that were not really compatible with the measured 13C NMR chemical shifts, unless an
epoxide were present. Only three solutions were produced after an epoxide was
imposed. The first one contained a cyclobutanone fragment for which the chemical
shift of C-1 was not realistic. In the second one, C-10 (LSD numbering) was bonded
to an oxygen atom within a five-membered lactone ring. The chemical shift of C-10 at
δ 53.17 was not realistic. The third solution was the one that was finally retained for
compound 1. The unusual cyclic enol ester group correctly explained the strong
chemical shift difference of C-10 and C-11 (structure 1 numbering). The LSD input
file for this determination is supplied as Supplementary Information 2. The molecule
is the first example of a cembrane-derived diterpenoid with a C-2, C-12 bond,
resulting in a spirocyclic C-12.
The NOESY spectrum showed correlations between the H3-16 and H3-17 resonances
and H-2, between H-2 and the H3-18 resonance, and between the H3-18 and H3-19
resonances indicating they were on the same face of the molecule, and between H-1
and H-3, H-3 and H-11 and between H-11 and H-7, showing they were on the
opposite face. Single crystal X-ray analysis (Fig 1) confirmed the structure and
relative stereochemistry as (+)–[1R*,2S*,7S*,8S*,12R*]–7,8-epoxy-2,12-
cyclocembra-3E,10Z-dien-20,10-olide.
Compound 2 was isolated as a colourless oil and identified as (+)–[1R*,10R*]-
cembra-2E,4E,7E,11Z-tetraen-20,10-olide. The HRMS indicated a molecular formula
of C20H28O2 and the FTIR spectrum gave an absorption band at 1745 cm-1, consistent
with an α,β–unsaturated γ-lactone (Pavia et al., 2009). The 13C NMR spectrum
displayed twenty carbon resonances, including a carbonyl carbon resonance at δ 174.0
and eight double bond carbon resonances. The 1H NMR spectrum showed the

6
presence of four methyl group proton resonances at δ 1.70 (s), 1.78 (s) and 0.89 (d, J
= 6.8 Hz) and 0.82 (d, J = 6.8 Hz), indicating two vinylic methyl groups (H3-19, H3-
18, respectively), and the presence of an isopropyl group, as in 1. The two methyl
group doublets (H3-16, H3-17) were each seen to be coupled to a methine proton
resonance at δ 1.55 (H-15), which showed further coupling with a resonance at δ 1.72
(m) (H-1). The H-1 resonance was seen to be coupled with an alkene proton
resonance at δ 5.26 (dd, J =15.4, 10.0 Hz) (H-2), which showed further coupling with
a doublet proton resonance at δ 6.00 (d, J=15.4 Hz), ascribed to H-3. The
configuration of the 2- double bond was assigned as E, based on the magnitude of
the coupling constant J2,3 = 15.4 Hz (Olsson et al., 1993). The HMBC spectrum
showed correlations between the H-3 proton resonance and the C-1 (δ 50.1), C-2 (δ
130.2), C-4 (δ 135.3), C-5 (δ 125.1) and C-18 (δ 19.1) resonances. The 13C NMR
chemical shift for the C-18 methyl group of δ 19.6 indicated an E geometry for the Δ4
- double bond, therefore the H3-18 methyl group was trans to the H-5 (δ 5.49 t J = 7.5,
15.0 Hz) alkene proton (Crombie et al., 1975, Lange et al., 1986, Olsson et al., 1993,
Pudhom et al., 2007). The H-5 resonance showed coupling with two H-6 proton
resonances (δ 2.41 (m) and 3.05 (m)), which, in turn, showed coupling with the H-7 (δ
5.10, d, J=9.5 Hz) alkene proton resonance. The H-7 resonance showed correlations
in the HMBC spectrum with the C-6 (δ 26.4), C-19 (δ 18.0) and C-9 resonances (δ
41.9). The chemical shift for C-19 (δ 18.0) indicated an E geometry for the Δ7-double
bond (Lange et al., 1986). The H2-9 resonances (δ 2.78, d, J = 14.5 Hz and 2.46, m)
were seen to be coupled with the H-10 resonance (δ 5.04, br s, W1/2 = 8.1 Hz) which
showed further coupling with H-11 of the α,β–unsaturated γ-lactone. The lactone
carbonyl carbon showed correlations in the HMBC spectrum with the overlapped H2-
13 resonances (δ 2.33, m). The H2-13 resonances showed coupling with the two H-14
resonances (δ 2.41 (m), 1.38 (m)), which showed coupling with the previously
assigned H-1 resonance. The H3-18 and H3-19 methyl groups were placed on the β
face of the molecule as for compound 1, and, following compound 1, where the
stereochemistry at C-1 was determined to be R, the isopropyl group was placed in the
β–orientation. Note that it is the conformation which the molecule adopts that results
in such substituents, attached to sp2 carbons, pointing above or below the general
plane of the molecule. The H-10 proton was determined to be in the β-configuration
due to an observed correlation in the NOESY spectrum with the H3-19 proton

7
resonance. The optical rotation for compound 2 was found to be +23.77. Compound
2 was identified as (+)–[1R*,10R*]-cembra-2E,4E,7E,11Z-tetraen-20,10-olide.
Compounds 3 and 4 were found to be C-4 epimers and HRMS analysis indicated a
molecular formula of C20H30O3. They differed from compound 2 in having a hydrated
4-double bond. The IR spectrum of 3 showed a carbonyl stretch at 1738 cm-1,
indicating an ,-unsaturated 5-membered lactone (Pavia et al., 2009) and a O-H
stretch band at 3411 cm -1. A tertiary hydroxyl group was present at C-4 ( 72.5), and
the H3-18 methyl group proton resonance now occurred at 1.37.
The relative stereochemistry at the C-1, C-4 and C-10 chiral centres was assigned
using the NOESY experiment and by comparisons with compound 1. The
stereochemistry at C-1 was arbitrarily assumed to be the same as for compound 1, and
H-1 was assigned the -configuration. The H-1 proton resonance showed a
correlation in the NOESY spectrum with the C-4 tertiary hydroxy group proton
resonance at δ 4.36 (s) when the spectrum was acquired in DMSO-d6. This hydroxy
group was therefore placed in the α-orientation and hence the H3-18 (δ1.37) methyl
group proton was assigned as β. A correlation seen between the H3-18 methyl group
proton resonance and the isopropyl group (H-15 and H3-16) in the NOESY spectrum
confirmed this. The H3-19 methyl group proton resonance (δ1.67, s) showed a
correlation with the β–orientated H3-18 resonance and the H-10 (δ5.03, br t, W1/2 =
19.6 Hz) oxymethine proton resonance, hence H-10 was also determined to be β–
configured. The 13C NMR chemical shift of the C-19 methyl group of δ16.5 (< 20
ppm) (Lange et al., 1986) and the absence of a correlation between the H-7 (δ5.37, t,
J=7.5 Hz) proton resonance and the H3-19 (δ1.67, s) methyl group proton resonance
in the NOESY spectrum indicated that the C-7 (δ131.1) , C-8 (δ129.4) double bond
was in the E configuration. Compound 3 was identified as (+)–[1R*,4S*,10R*]-4-
hydroxycembra-2E, 7E,11Z-trien-20,10-olide.
Compound 4 was found to be (-)–[1R*,4R*,10R*]-4-hydroxycembra-2E,7E,11Z-trien-
20,10-olide. The 13C NMR chemical shifts for compound 4 were found to be very
similar to those of compound 3, except for the C-18 carbon resonance at δ 30.3
(δ28.2 for 3) and C-4 resonance at δ73.6 (δ72.5 for 3). The H-1 (δ1.58) proton

8
resonance was assigned as α, as in compound 1. The presence of a correlation
between the H-1 proton resonance and the H3-18 methyl group proton resonance in
the NOESY spectrum allowed for the assignment of the α-orientation of the H3-18
methyl group. Based on the 13C NMR chemical shift for C-19 (δ16.5 < 20 ppm)
(Lange et al., 1986) the H3-19 methyl was also placed on the β-face of the molecule
as in compound 1-3. The H3-19 proton resonance showed a correlation with the H-10
(δ5.03, br s, W1/2=19.9 Hz) proton resonance, indicating it was also in the β–
orientation. The optical rotation for this compound was found to be -82.93.
Compound 4 was identified as (-)–[1R*,4S*,10R*]-4-hydroxycembra-2E,7E,11Z-
trien-20,10-olide.
Compounds 1 and 3 were screened against the PEO1 and PEO1TaxR ovarian cancer
cell lines and were found to have lower potency than paclitaxel (Table 2). However,
sensitivity of taxane sensitive and taxane resistant cells was similar when treated with
compounds 1 and 3. This could point to a tubulin binding site that is different to that
for paclitaxel. Moreover, the data imply that compounds 1 and 3 are not recognized
by the multidrug resistance (MDR) transporter expressed in the PEO1TaxR cells,
which is an important property that deserves further investigation. Experiments were
repeated using stock solution which had been stored at 4o for four days, and the
decrease in activity demonstrated compound instability. Furanocembranoids from
Croton oblongifolius have been shown to be active against BT474 (human breast
ductol carcinoma), CHAGO (human undifferentiated lung carcinoma), Hep-G2
(human liver hepatoblastoma), KATO-3 (human gastric carcinoma), and SW-620
(human colon adrenocarcinoma) cell lines (Pudhom et al., 2007) and neocrotonal,
isolated from the same source exhibited cytotoxicity against P-388 cells in vitro
(Roengsumran et al., 1999)
3. Experimental
3.1 General experiment procedures
1D and 2D NMR spectra were recorded in CDCl3 on a 500 MHz Bruker AVANCE
NMR (University of Surrey) instrument at room temperature. Chemical shifts (δ) are
expressed in ppm and were referenced to the solvent resonances at 7.26 and 77.23
ppm for 1H and 13C NMR respectively. ESI mass spectra were recorded on a Bruker

9
MicroToF mass spectrometer using an Agilent 1100 HPLC to introduce samples
(University of Oxford). Optical rotaions were determined in CHCl3 on a JASCO P-
1020 polarimeter (University of Surrey). FTIR spectra were recorded using a Perkin-
Elmer (2000) spectrometer.
3.2 Plant material
Stem bark of Croton gratissimus Burch. var. gratissimus was collected from a mature
tree cultivated on the campus of the University of KwaZulu-Natal, Durban, South
Africa, identified by N.R. Crouch and a voucher retained for verification purposes
(Crouch 1051, NH).
3.3 Extraction and isolation of compounds
The ground stem bark (1570 g) of C. gratissimus was extracted using a Soxhlet
apparatus for 48 h successively using hexane, methylene chloride, ethyl acetate and
methanol. After evaporation of the solvent in vacuo the following extracts were
obtained: hexane (19.53 g), methylene chloride (18.29 g), ethyl acetate (20.26 g) and
methanol (57.79 g). The hexane and methylene chloride extracts were examined in
this study. Column chromatography over silica gel (Merck 9385) using a 5 cm
diameter gravity column, collecting fractions (75 ml each) using a hexane/methylene
chloride step gradient starting with 100% hexane and gradually increasing the
methylene chloride concentration to 100%, followed by 5% methanol in methylene
chloride, was used to separate the constituents. Final purification was undertaken
using 1 cm diameter gravity column.
The hexane and methylene chloride extracts yielded compound 1 (Fraction 192, 6.1
mg, 50% hexane/50% CH2Cl2), 2, (Fractions 18–25, 23.0 mg, 80% hexane/20%
CH2Cl2) 3, (Fraction 227, 12.0 mg, 100% CH2Cl2), 4, (Fraction 145, 6.8 mg, 100%
CH2Cl2), lupeol (Fraction 223, 20.3 mg, 100% CH2Cl2), 4(15)-eudesmene-1,6-diol
(Fraction 227, 7.8 mg, 100 % CH2Cl2) and -glutinol (Fraction 100, 15.0 mg, 100%
CH2Cl2). The identity of 4(15)-eudesmene-1,6-diol and -glutinol were confirmed
by comparison of acquired NMR data against literature values (Sun et al., 2004; Olea
et al., 1993). NMR data for compounds 1-4 is given in Table 1.

10
3.3.1 (+)–[1R*,2S*,7S*,8S*,12R*]–7,8-Epoxy-2,12-cyclocembra-3E,10Z-dien-20,10-
olide (1). White needle-like crystals; [α]D23.6 +39.5 (c 0.0022, CHCl3); IR νmax
(NaCl) cm-1 3103, 2964, 2874 cm-1 (C – H stretches) and 1777 cm-1 (C = O stretch), 1H (500 MHz, CDCl3) and 13C NMR (125 MHz, CDCl3) spectroscopic data, see Table
1; HRESIMS m/z 339.1921 [M + Na]+ (calc. for C20H28O3Na 339.193615).
3.3.2 (+)–[1R*,10R*]-Cembra-2E,4E,7E,11Z-tetraen-20,10-olide (2)
Colourless oil; [α]D23.6 +23.77 (c 0.0042, CHCl3); IR νmax (NaCl) cm-1 2952, 2918,
2845 (C – H stretch) and 1745 (C = O stretch), (500 MHz, CDCl3) and 13C NMR (125
MHz, CDCl3) spectroscopic data, see Table 1; HRESIMS m/z 323.1980 [M + Na]+
(calc. for C20H28O2Na 323.19870).
3.3.3 (+) –[1R*,4S*,10R*]-4-Hydroxycembra-2E,7E,11Z-trien-20,10-olide (3)
Yellow oil; [α]D23.6 +65.0 (c 0.0018, CHCl3); IR νmax (NaCl) cm-1 3411 (O – H
stretch) and 1738 (C = O stretch); 1H (500 MHz, CDCl3) and 13C NMR (125 MHz,
CDCl3) spectroscopic data, see Table 1; HRESIMS m/z 341.2079 [M + Na]+ (calc. for
C20H30O3Na 341.209265).
3.3.4 (-)–[1R*,4R*,10R*]-4-Hydroxycembra-2E,7E,11Z-trien-20,10-olide (4)
Colourless oil; [α]D23.6 -82.93 (c 0.0061, CHCl3); IR νmax (NaCl) cm-1 3433 (O – H
stretch) and 1736 (C = O stretch); 1H (500 MHz, CDCl3) and 13C NMR (125 MHz,
CDCl3) spectroscopic data, see Table 1; HRESIMS m/z 341.2079 [M + Na]+ (calc. for
C20H30O3Na 341.209265).
3.4 Single-crystal X-ray Analysis of 1
Crystal data: C20H28O3, space group P212121, a= 6.198(2) Å, b= 11.676(5) Å,
c=24.257(9) Å, V= 1755.5(11) Å3, Z=4, D (calc) = 1.197 g/cm3, λ (Mo Kα) ) 0.
71073 Å. Crystallographic data for compound 1 were collected at the University of
Bristol X-ray Crystallography service a Bruker-Apex CCD diffractometer with Mo-
Ka X-ray radiation (λ = 0.71073 Å) . Data were corrected for absorption using
empirical methods (SADABS) (Bruker, 2004) based on symmetry-equivalent
reflections combined with measurements at different azimuthal angles. The crystal
structure was solved and refined by direct methods against all F2 values using the

11
SHELXTL suite of programs and refined by least squares on weighted F2 values for
all reflections (see Supplementary Information 3) (Sheldrick, 2008). All non-
hydrogen atoms were assigned anisotropic displacement parameters and refined
without positional constraints. All the hydrogen atoms were located in the electron
density difference map, and refined with appropriate distance restraints. The positions
of the methyl hydrogen atoms were assigned by a rotating group refinement with
fixed, idealised C-H distances. All other hydrogen atoms were constrained to ideal
geometries. The hydrogen atoms were assigned isotropic displacement parameters
equal to 1.5 times (methyl hydrogen atoms) or 1.2 times (all other hydrogen atoms)
that of their parent atom. Refinement proceeded smoothly to give the residuals shown
in Supplementary Information 3. A total of 1695 reflections were observed. In the
absence of heavy atom in the structure, Friedel pairs were not collected, and the
absolute configuration of the structure 1 was not determined.
3.5 Screening
All tissue culture reagents were obtained from Sigma Aldrich (Poole, UK), unless
stated otherwise. The PEO1 ovarian cancer cell line was originally developed by
Langdon et al. and obtained from Prof F. Balkwill (formerly of ICRF laboratories,
Lincoln Inn Fields, London, UK). The PEO1TaxR (paclitaxel resistant) cell line was
derived in-house and possesses approximately 12- fold resistance to its inducing agent
(referred to in Coley et al., 2006). PEO1 cell lines were cultured as monolayers in
RPMI-1640 medium supplemented with 10% foetal calf serum (heat inactivated,
obtained from Invitrogen, Paisley, UK) and 2 mM Glutamax (Invitrogen). Cells in
monolayer culture were subjected to trypsinisation (trypsin-EDTA solution; Sigma
Aldrich) prior to use in cytotoxicity testing (see below).
Working stock solutions of compounds 1 and 3 were prepared by dissolving
compounds in chloroform to give a concentrated solution of 50 mM. Cytotoxicity was
determined by means of the colorimetric assay MTT (3-[4,5-dimethylthiazol-2-yl]-
2,5-diphenyltetrazolium bromide). Cultured cell monolayers were reduced to a single
cell suspension (as described above) and then seeded into 96-well tissue culture plates
at a density of 6 x 10³ cells per well for all cell lines. This was calculated to allow for
exponential growth of the cultures throughout the incubation period. Cells were
allowed to settle for 24 h, under standard culture incubation conditions and then drug
12
treated in quadruplicate with a dose range spanning 2-logs of drug concentration, each
drug aliquot being administered in a 50 l volume. All drug dilutions were carried out
in complete culture medium. After 72 h incubation under standard culture conditions
MTT solution (5 mg/ml in PBS) was added in a 20 l volume and incubated for a
further 4 h. The MTT/medium mixture was then removed and the resulting formazan
crystals dissolved in 200 l of DMSO. The optical density of the purple color product
was measured at 550 nm in a plate reading spectrophotometer. The quantity of live
cells was expressed as T/C values by comparison with untreated control
microcultures. The concentration of complexes that decreased absorption by 50%
were calculated by interpolation and expressed as IC50 values.
4. Supplementary information
Supplementary data associated with this article can be found, in the online version,
XXXXXXXXXXX. Crystallographic data for structure 1 is deposited at the
Cambridge Crystallographic Data Centre as supplementary publication no. CCDC
764183. Copies of the data can be obtained free of charge on application to CCDC,
12 UnionRoad, Cambridge CB2 1EZ, UK (Fax: + 44 1223 336033; E-mail:
Acknowledgements
ML wishes to acknowledge a PhD studentship from the University of Surrey. This
research was funded by the University of Surrey and South African National Research
Foundation (NRF)
5. References
Block, S., Baccelli, C., Tinant, B., Meervelt, L.C., Rozenberg, R., Jiwan, H.J.,
Llabres, G., Pauw–Gillet, D.M., Quetib – Leclercq, J. 2004. Diterpenes from the
leaves of Croton zambesicus. Phytochemistry 65, 1165 – 1171.
Bruker, 2004. APEX2, XPREP and SAINT. Bruker AXS Inc., Madison, Wisconsin, USA., Bruneton, J. 1995. Pharmacognosy, phytochemistry, medicinal plants. Intercept
Limited, Andover, UK.
Bryant, A.T. 1966. Zulu medicine and medicine-men. Struik, Cape Town.

13
Charlson, A.J. 1980. Antineoplastic constituents of some southern African plants.
Journal of Ethnopharmacology 2, 323 – 335.
Charris, J., Dominguez, J., De la Rosa, C., Caro, C. 2000. (-) - Amuronine from the
leaves of Croton flavens L. (Euphorbiaceae). Biochem. Syst. Ecol. 28, 795 – 797.
Clarkson, C., Maharaj, V.J., Crouch, N.R., Grace, O.M., Pillay, P., Matsabisa, M.G.,
Bhagwandin, N., Smith, P.J., Folb, P.I. 2004. In vitro antiplasmodial activity of
medicinal plants native to or naturalised in South Africa. Journal of
Ethnopharmacology 92, 177 – 191.
Coley, M.H., Shotton, C.F., Ajose-Adeogun, A., Modjtahedi, H., Thomas, H. 2006.
Receptor tyrosine kinase (RTK) inhibition is effective in chemosensitising EGFR-
expressing drug resistant human ovarian cancer cell lines when used in combination
with cytotoxic agents. Biochem. Pharmacol. 72, 941 – 948.
Crombie, L., King, R. W., Whiting, D.A. 1975. Carbon-13 magnetic resonance
spectra. Synthetic presqualene esters, related cyclopropanes, and isoprenoids. J.
Chem. Soc., Perkin Trans. 1. 913 – 915.
Garcia, A., Ramirez-Apan, T., Cogordan, J.A., Delgado, G. 2006. Absolute
configuration assignments by experimental and theoretical approaches of ent-labdane
and cis-ent-clerodane-type diterpenes isolated from Croton glabellus. Can. J. Chem.
84, 1593 – 1602.
Gelfand, M., Mavi, S., Drummond, R.B., Ndemera, B. 1985. The traditional medical
practitioner in Zimbabwe. His principles of practice and pharmacopoeia. Mambo
Press, Gweru.
Gerstner, J. 1941. A preliminary check list of Zulu names of plants, with short notes.
Bantu Studies 15, 277 – 301.
Hecker, E. 1981. Cocarcinogenesis and tumor promoters of the diterpene ester type as
possible carcinogenic risk factors. Journal of Cancer Research and Clinical Oncology
99: 103 – 124.
Hedberg, I., Staugård, F. 1989. Traditional medicine in Botswana. Traditional
medicinal plants. Ipeleng Publishers, Gaborone.
Hooft, R.W.W. 1998. COLLECT data collection software, Nonius BV, The
Netherlands.
Kuo, P.C., Shen, Y.C., Yang, M.L., Wang, S.H., Thang, T.D., Dung, W.X., Chiang,
P.C., Lee, K.H., Lee, E.J., Wu, T.S. 2007. Crotonkinins A and B and related

14
diterpenoids from Croton tonkinensis as anti-inflammatory and anti-tumor agents. J.
Nat. Prod. 70, 1906 – 1909.
Lange, L.G., Lee, M. 1986. 13C NMR determination of the configuration of methyl-
substituted double bonds in medium- and large-ring terpenoids. Magn. Res. Chem.
24, 656 – 658.
Mabberley, D.J. 2008. Mabberley’s plant-book. A portable dictionary of plants, their
classification, and uses. 3rd edition. Cambridge University Press, Cambridge.
Mabogo, D.E.N. 1990. The ethnobotany of the Vhavenda. Unpublished MSc,
University of Pretoria.
Nuzillard, J.M. 2010. Logic for structure determination software:. www.univ-
reims.fr/LSD.
Nuzillard, J.M. 2003. Automatic Structure Determination of Organic Molecules:
Principles and Implementation of the LSD Program. Chin. J. Chem. 21, 1263 – 1267.
Olea, R. S. G., Torres, L. M. B., Roque, L. C. and Roque, N. F. 1993. 13C NMR
spectroscopic data for glutinol and derivatives. Magn. Res. Chem. 32, 378-379.
Olsson, E., Berg, J., Wahlberg, I. 1993. Eight new cembranoids from Tobacco-
Structural elucidation and conformational studies. Tetrahedron. 49, 4975– 4992.
Otwinowski, Z., Minor, W. 1997. Processing of X-ray diffraction data collected in
oscillation mode. Macromolecular Crystallography, Pt A. 276, 307 – 326.
Palmer, E., Pitman, N. 1972. Trees of southern Africa. Vol 2. A.A. Balkema, Cape
Town.
Pavia, D. L., Lampman, G.M., Kriz, G.S., Vyvan, J.R. 2009. Introduction to
Spectroscopy. 4th ed. Brooks/Cole, USA.
Pudhom, K., Vilaivan, T., Ngamrojanavanich, N., Dechangvipart, S., Sommit, D.,
Petsom, A. and Roengsumran, S. 2007. Furano-cembranoids from the stem bark of
Croton oblongifolius. J. Nat. Prod. 70, 659 – 661.
Roengsumran, S., Singtothong,P., Pudhom, K., Ngamrochanavanich, N., Petsom, A.,
and Chaichantipyuth, C. 1999. Neocrotocembranal from Croton oblongifolius
J. Nat. Prod. 62, 1163-1164.
Sheldrick, G. M. 2003. SADABS version 2.10, University of Göttingen. Germany.
Sheldrick, G. M. 2008. Acta Crystallogr., Sect. A: Found. Crystallogr., A64, 112-122.
Sun, Z., Chen, B., Zhang, S. and Hu, C. 2004. Four new eudesmanes from Caragana
intermedia and their biological activities. J. Nat. Prod. 67, 1975 – 1979.

15
Von Koenen, E. 2001. Medicinal, poisonous and edible plants in Namibia. Kluas Hess
Publishers, Windhoek and Göttingen.
Watt, J.M., Breyer-Brandwijk, M.G. 1962. The medicinal and poisonous plants of
southern and eastern Africa. E. &. S. Livingstone Ltd., Edinburgh and London.

16
Figure 1: ORTEP illustration for compound 1: (+)–[1R*,2S*,7S*,8S*,12R*]–7, 8-
Epoxy-2,12-cyclocembra-3E,10Z-dien-20,10-olide
17
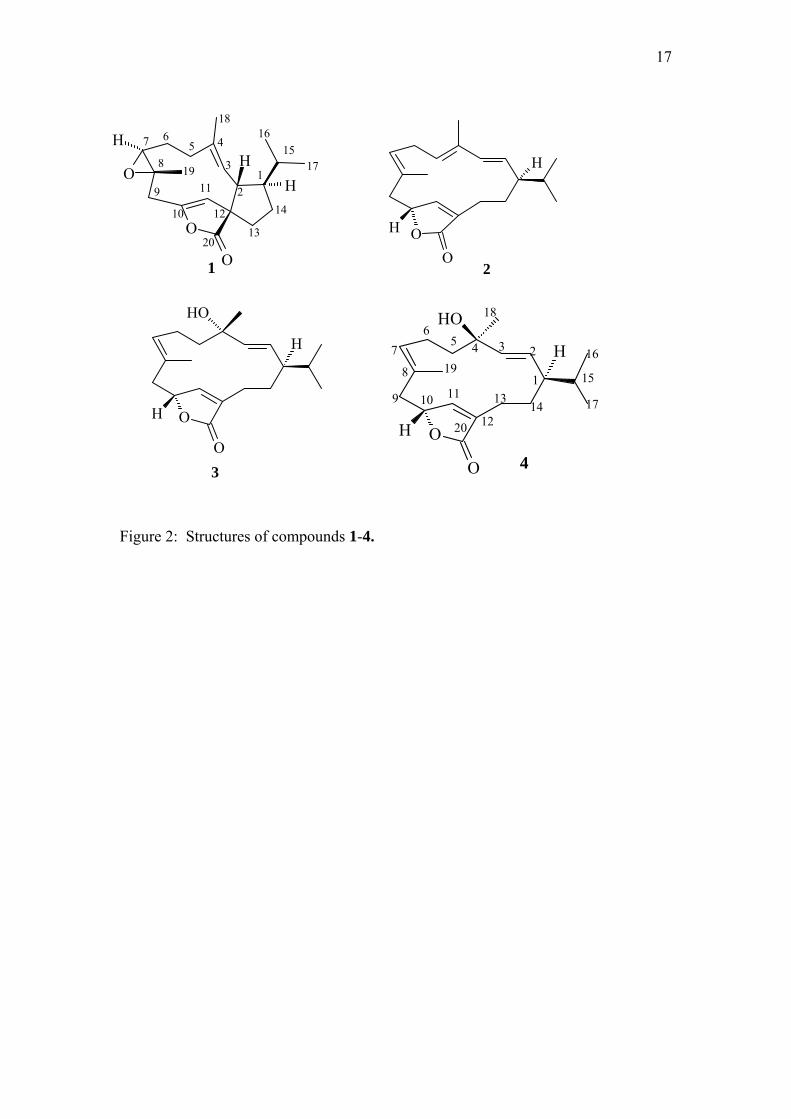
Figure 2: Structures of compounds 1-4.
O
O
H
HO
H
3
O
O
H
H
2
1
23456
7
8
9 10 11
12
1314
15
16
17
18
19
20O
O
H
HO
H
4
3
4567
8
9
18
19
1
10
11
20O
O
H
OH
H2
1
14
13
1517
16
12

18
Table 1: 1H NMR (500 MHz) and 13C NMR (125 MHz) chemical shifts in CDCl3 for compounds 1 - 4
1 2 3 4
No 13C NMR 1H NMR 13C NMR 1H NMR 13C NMR 1H NMR 13C NMR 1H NMR
1 54.0 CH 1.70 m 50.1 CH 1.72 m 48.4 CH 1.58 m 48.7 CH 1.58 m
2 54.8 CH 2.91 t J = 9.6 Hz 130.2 CH 5.26 dd J = 15.4, 10.0 Hz 131.4 CH 5.41 m 130.5 CH 5.35 t J = 7.3 Hz
3 128.5 CH 4.85 d J = 9.6 Hz 130.8 CH 6.00 d J = 15.4 Hz 138.0 CH 5.60 d J = 15.7 Hz 138.6 CH 5.50 d J = 16.9 Hz
4 136.0 C - 135.3 C - 72.5 C - 73.6 C -
5α 38.5 CH2 2.23 dd J = 3.9, 8.8 Hz 125.1 CH 5.49 t J = 7.5 Hz 43.7 CH2 1.92 m 43.8 CH3 1.85 m
5β 1.51 m 1.58 m
6α 23.2 CH2 1.87 m 26.4 CH2 2.41 m 25.6 CH2 2.34 m 25.7 CH2 2.40 m
6β 1.57 m 3.05 m 1.59 m 2.30 m
7α 63.0 CH 2.64 d J = 9.9 Hz 129.1 CH 5.10 d J = 9.6 Hz 131.1 CH 5.37 t J = 7.5 Hz 129.5 CH 5.51 m
8 61.9 C - 128.1 C - 129.4 C - 129.9 C -
9α 39.0 CH2 1.98 d J = 13.5 Hz 41.9 CH2 2.46 m 44.7 CH2 2.07 dd J = 2.6,12.7 Hz 44.6 CH2 2.10 dd J = 10.2, 12.6 Hz
9β 2.86 q J = 4.3 Hz 2.78 d J = 14.6 Hz 2.80 dd J = 7.3,12.7 Hz 2.81 dd J = 5.4, 12.6 Hz
10 151.2 C - 81.8 CH 5.04 br s W1/2 = 8.1 Hz 80.3 CH 5.03 br s W1/2 = 19.6 Hz 80.3 CH 5.03 br s W1/2 = 19.9 Hz
11 110.6 CH 5.05 br s W1/2 = 2.8 Hz 151.3 CH 6.80 s 149.6 CH 6.98 d J = 1.6 Hz 149.5 CH 7.02 d J = 1.7 Hz
12 58.3 C - 132.5 C - 133.6 C - 133.9 C -
13α 33.3 CH2 1.78 m 25.1 CH2 2.33 m 22.7 CH2 2.20 m 23.4 CH2 2.00 m
13β 2.14 m 2.35 m
14α 28.2 CH2 1.84 m 26.5 CH2 2.41 m 28.1 CH2 1.94 m 28.7 CH2 1.85 m
14β 1.67 m 1.38 m 1.49 m 1.58 m
15 29.9 CH 1.68 m 33.0 CH 1.55 m 33.9 CH 1.60 m 34.0 CH 1.58 m
16 18.8 CH3 0.85 d J = 6.6 Hz 20.0 CH3 0.82 d J = 6.8 Hz 19.6 CH3 0.84 d J = 6.5 Hz 19.5 CH3 0.82 d J = 6.4 Hz
17 22.0 CH3 0.92 d J = 6.6 Hz 20.9 CH3 0.89 d J = 6.8 Hz 20.4 CH3 0.89 d J = 6.5 Hz 20.6 CH3 0.88 d J = 6.4 Hz
18 15.1 CH3 1.52 d J = 1.2 Hz 19.6 CH3 1.78 s 28.2 CH3 1.37 s 30.3 CH3 1.30 s
19 19.2 CH3 1.42 s 18.0 CH3 1.70 s 16.5 CH3 1.67 s 16.5 CH3 1.67 s
20 183.6 C - 174.0 C - 174.2 C - 174.2 C -

19
Table 2: Chemosensitivity testing in taxane sensitive (PEO1) and resistant PEO1TaxR human ovarian cancer cells (data shown are IC50 drug concentrations in nM amounts) for compounds 1 and 3.
Compound PEO1 PEO1TaxR Resistance Factor 1 132 200 1.5
3 125 135 < 1.0
Paclitaxel 2.3 30.5 13.3

20
SUPPLEMENTARY INFORMATION 1
Table 1. Atom and NMR correlation description of compound 1, used as input to the
LSD structure generator.
LSD
Atom # Statusa
HMBC
correlationb
Atom #
in 1
1 C sp2 0 5, 9, 13 20
2 C sp2 0 5, 11 10
3 C sp2 0 9, 12, 20 4
4 C sp2 1 9, 12, 20 3
5 C sp2 1 9, 11, 13 11
6 C sp3 1 11, 12, 18 7
7 C sp3 0 6, 11, 16, 18 8
8 C sp3 0 5, 9, 13 12
9 C sp3 1 – 2
10 C sp3 1 4, 9, 17, 19 1
11 C sp3 2 18 9
12 C sp3 2 4, 6, 16 5
13 C sp3 2 – 13
14 C sp3 1 9, 19 15
15 C sp3 2 13 14
16 C sp3 2 6, 12 6
17 C sp3 3 19 16
18 C sp3 3 11 19
19 C sp3 3 17 17
20 C sp3 3 4, 12 18
21 O sp2 0 – –
22 O sp3 0 – –
23 O sp3 0 – – aThe status is defined by the element,
hybridization state, multiplicity triplet. bHydrogen
atom numbers.

21
SUPPLEMENTARY INFORMATION 2
Computer file for the LSD-assisted structure elucidation of compound 1.
; Compound 1 ; Cembranoid from ; Croton gratissimus ; CDCl3 77.233 ; Atom 1 is a C, sp2, ; 0 H attached. MULT 1 C 2 0 ; 183.62 MULT 2 C 2 0 ; 151.16 MULT 3 C 2 0 ; 135.96 MULT 4 C 2 1 ; 128.50 MULT 5 C 2 1 ; 110.65 MULT 6 C 3 1 ; 63.01 MULT 7 C 3 0 ; 61.92 MULT 8 C 3 0 ; 58.32 MULT 9 C 3 1 ; 54.82 MULT 10 C 3 1 ; 53.97 MULT 11 C 3 2 ; 39.03 MULT 12 C 3 2 ; 38.48 MULT 13 C 3 2 ; 33.33 MULT 14 C 3 1 ; 29.92 MULT 15 C 3 2 ; 28.17 MULT 16 C 3 2 ; 23.19 MULT 17 C 3 3 ; 22.02 MULT 18 C 3 3 ; 19.22 MULT 19 C 3 3 ; 18.75 MULT 20 C 3 3 ; 15.15 MULT 21 O 2 0 MULT 22 O 3 0 MULT 23 O 3 0 ; C4 is bonded to H4 HMQC 4 4 HMQC 5 5 HMQC 6 6 HMQC 9 9 HMQC 10 10 HMQC 11 11 HMQC 12 12 HMQC 13 13 HMQC 14 14 HMQC 15 15 HMQC 16 16 HMQC 17 17 HMQC 18 18 HMQC 19 19 HMQC 20 20 ; C1 correlates ; with H5 in HMBC HMBC 1 5 HMBC 1 9 HMBC 1 13 HMBC 2 5 HMBC 2 11 HMBC 3 9 HMBC 3 12
HMBC 3 20HMBC 4 9 HMBC 4 12 HMBC 4 20 HMBC 5 9 HMBC 5 11 HMBC 5 13 HMBC 6 11 HMBC 6 12 HMBC 6 18 HMBC 7 11 HMBC 7 6 HMBC 7 16 HMBC 7 18 HMBC 8 5 HMBC 8 9 HMBC 8 13 HMBC 10 4 HMBC 10 9 HMBC 10 17 HMBC 10 19 HMBC 11 18 HMBC 12 4 HMBC 12 6 HMBC 12 16 HMBC 14 9 HMBC 14 19 HMBC 15 13 HMBC 16 6 HMBC 16 12 HMBC 17 19 HMBC 18 11 HMBC 19 17 HMBC 20 4 HMBC 20 12 ; L1: quaternary C QUAT L1 ; L2: methine C CH L2 ; Atoms 17 and 19 are ; bonded to a methine C PROP 17 1 L2 PROP 19 1 L2 ; Atoms 18 and 20 are ; bonded to a quat. C PROP 18 1 L1 PROP 20 1 L1 ; the carbonyl group BOND 1 21 ; L7: atoms with ; all carbon neighbours LIST L7 13 14 15 16 22 23 ; L8: all carbon atoms CARB L8
; Each atom in L7 ; has all (0) its ; neighbours in L8. ; Next line may be ; commented (;) PROP L7 0 L8 ; remove substructure ; constraint. ; Next line may be ; commented (;) SUBS 0 ; Cyclopropane description ; Sub-atom S1 is a C, sp3, ; with 0 or 1 or 2 H ; atom attached SSTR S1 C 3 (0 1 2) SSTR S2 C 3 (0 1 2) SSTR S3 O 3 0 ; Sub-atom bonds LINK S1 S2 LINK S1 S3 LINK S2 S3

22
SUPPLEMENTARY INFORMATION 3
Crystal data and intensity collection for compound 1
Empirical formula C20 H28 O3
Formula weight 316.42 Temperature 100(2) K Wavelength 0.71073 Å Crystal system Orthorhombic Space group P 21 21 21 Unit cell dimensions a = 6.198(2) Å α = 90° b = 11.676(5) Å β = 90°
c = 24.257(9) Å δ = 90°
Volume 1755.5(11) Å3
Z 4
Density (calculated) 1.197 Mg/m3
Absorption coefficient 0.079 mm-1
F(000) 688 Crystal size (mm) 0.247 x 0.189 x 0.06 θ range for data collection 1.68 to 26.56° Index ranges -7<=h<=7, -14<=k<=14, -30<=l<=30 Reflections collected 11828 No. of Friedel pairs 1695
Independent reflections 2113 [Rint = 0.0704]
Completeness to θ =28.56°, 99.9 % Absorption correction Semi-empirical from equivalents Max. and min. transmission 0.993 and 0.982
Refinement method Full-matrix least-squares on F2
Data / restraints / parameters 2136 / 0 / 212
Goodness-of-fit on F2 S 1.042 R indices [for 1665reflections, I>2δ(I)]
R1 = 0.0386, wR2 = 0.0801
R indices (for all 2136 data) R1 = 0.0587, wR2 = 0.0878
Absolute structure (Flack) parameter 0.03(2)
Largest diff. peak and hole 0.183 and -0.181 eÅ-3