cells were fabricated on pre-patterned used as received ito-coated glass substrates. prior to...
TRANSCRIPT

Supplementary Information
Barbiturate End-Capped Non-Fullerene Acceptors for Organic Photovoltaics: Tuning Acceptor Energetics to
Suppress Geminate Recombination Losses
Ching-Hong Tana, Jeffrey Gormanb, Andrew Wadswortha, Sarah Holliday*c, Selvam Subramaniyand,
Samson A. Jenekhed, Derya Barane, Iain McCullocha, e James R. Durrant*a
a. Department of Chemistry and Centre for Plastic Electronics, Imperial College London SW7 2AZ
London, United Kingdom.
b. Cavendish Laboratory, University of Cambridge, CB2 1TN, United Kingdom.
c. Department of Materials Science and Engineering, University of Washington, Seattle, WA 98195,
United States of America.
d. Departments of Chemical Engineering and Chemistry, University of Washington, Seattle, Washington
98195-1750, United States
e. Physical Sciences and Engineering Division, KAUST Solar Centre (KSC), King Abdullah University
of Science and Technology (KAUST), Thuwal, 23955-6900, Kingdom of Saudi Arabia.
[email protected] and [email protected]
Contents Figure/Table
1. Experimental procedures and synthetic procedure for FTB and FTTB Figure S1-S4
2. Minimum energy conformation calculation of FTB and FTTB molecules using
Gaussian (B3LYP/6-13G*)
Figure S5
3. UV-vis absorption measurements and CV of neat FTB, FTTB and PSEHTT films Table S1/Figure
S6-S8
4. Device optimization of PSEHTT:acceptor systems Table S2-S3
5. XRD measurements of neat FTB, FTTB, PSEHTT with and without annealing Figure S9
6. XRD measurements and UV-vis spectra of the blend films with and without
annealing
Figure S10
7. PL measurement of neat PSEHTT, FTB and FTTB and the blend films excited at
650 and 460 nm
Figure S11 and S
12
8. Electron and hole mobility measurement and calculation of PSEHTT:FTB and
PSEHTT:FTTB devices
Figure S13-
S14/Table S4
9. TA spectra of neat PSEHTT, FTB and FTTB films Figure S15
10. Excitation dependence decays of FTB:PSEHTT and FTTB:PSEHTT blends Figure S16
Experimental Procedures
OSC Device Fabrication and Characterisation
Electronic Supplementary Material (ESI) for ChemComm.This journal is © The Royal Society of Chemistry 2018

Solar cells were fabricated on pre-patterned used as received ITO-coated glass substrates. Prior to spin-coating
deposition, substrates were cleaned using: detergent, deionized water, acetone, and isopropanol sequentially in
sonication and treated with oxygen plasma for around 8 min. A ZnO-precursor solution (219.5 mg zinc acetate
dehydrate precursor in 2 mL 2-methoxyethanol and 60 μL monoethanolamine) was spun coated on the
substrates giving a thickness of around 30nm followed by annealing at 150°C for 20 min. Devices were
transferred to a N2-filled glovebox where the optimized blend layers (encompassing of 1:2 ratio
donor:acceptor in 10 mg/mL chlorobenzene solution stirred for about 24 hours at 60°C) of around 70-80 nm
thickness were deposited by spin coating between 3000-5000 rpm for 1 min on the substrates. 10 nm MoO3
and 100 nm Ag layers were consecutively deposited on the substrates in an evaporation chamber at 2x10-
6mbar through a shadow mask of 0.045 cm2 active area. Completed devices were kept in glovebox conditions.
J-V curves were recorded using a Xenon lamp set at AM1.5G and 1 sun (100 mWcm-2) illumination from
Oriel Instruments and calibrated using a Si reference cell with a Keithley 2400 source meter. External
quantum efficiency (EQE) was measured with a 100W tungsten-halogen lamp (Bentham IL1 with Bentham
605 stabilised current power supply) illumination connected to a monochromator with an automated stepper
motor. Photon flux was calibrated to a Si reference cell using a Keithley 2400 source meter for spectra
mismatch correction.
Material Characterisation1H and 13C NMR spectra were recorded on a Bruker AV-400 spectrometer at 298 K, reported in ppm. UV-vis
spectra were obtained using a Shimadzu UV-Vis Spectrophotometer UV-26000. Mass spectrometry was
carried out with a Micromass matrix assisted laser desorption ionisation with time-of-flight (MALDI-ToF).
DSC thermograms were recorded on a TA Instruments DSC Q20 at a heating rate of 5 °C min-1, samples were
drop-cast from CHCl3 solutions onto glass slides to allow solvent to evaporate and then these samples were
transferred to DSC pans. Specular X-Ray Diffraction was measured on a PANalytical X’Pert PRO MRD
diffractometer with a Ni-filtered Cu-Kα1 beam (λ= 0.154184 nm) and X’Celerator detector (current 40 mA,
accelerating voltage 40 kV). Cyclic voltammetry (CV) was measured on an Autolab PGSTAT101 potentiostat
with a three-electrode setup using Ag/AgCl reference electrode, Pt counter-electrode, and with thin films spin
coated on ITO as the working electrode. A 0.1 M tetrabutylammonium hexafluorophosphate in dry
acetonitrile electrolyte was used. Outputs were referenced against a ferrocene electrolyte with Pt working
electrode. HOMO levels were calculated using: HOMO (eV) = Ered – EFc +4.8, where Ered is the onset of
reduction and EFc is the half-wave potential of the ferrocene reference.
Photoluminescence (PL) and fs-transient absorption (TA) spectroscopies
Films for fs-TAS and PL were coated on glass with the same active layer processing conditions as optimised
photovoltaic devices.
PL spectra employing excitation wavelengths of 460 and 650 nm were recorded with a steady state
spectrofluorometer (Horiba Jobin Yvon, Spex Fluoromax 1).

fs-TAS measurement was carried out using a 800 nm (1 kHz, 90 fs) laser-pulse with a Solstice (Newport
Corporation) Ti:sapphire regenerative amplifier. Part of the laser pulse, of which spot size is 0.5mm, was used
as the 650 nm, 2 μJ cm-2 pump-laser with a TOPAS-Prime (Light conversion) optical parametric amplifier.
The other laser output generated the probe light in the infrared continuum (850-1400 nm) with a sapphire
crystal. Spectra and decays were obtained by a HELIOS transient absorption spectrometer (450–1450 nm) and
decays to 6 ns. Films were measured in an N2 atmosphere and blend spectra was deconvoluted by fitting the
singlet PSEHTT exciton (Sexciton) and blend polaron (Spolaron) at 6 ns to the blend spectra using: Δ𝑂𝐷 = 𝐷 * 𝑆𝑒𝑥𝑐𝑖𝑡𝑜𝑛(1300 𝑛𝑚) + 𝑃 * 𝑃𝑝𝑜𝑙𝑎𝑟𝑜𝑛(1050 𝑛𝑚)
where D and P are linear coefficients of exciton and polaron respective in the blend spectra. Sexciton and Ppolaron
are the exciton and polaron spectra of PSEHTT donor and blend.
Charge Mobility
Electron-only devices were fabricated in ITO/ZnO/Active Layer/Ca/Al and hole-only in
ITO/PEDOT:PSS/Active Layer/MoO3/Ag architectures. Device J-V curves were measured under dark
conditions between -8 V to 8 V at slow 0.05 V step changes using a Keithley 2400 source meter. Blend
mobility was calculated using the SCLC expression described by the Mott-Gurney law were the j-V follows
the space-charge regime:
𝐽 =98
𝜀0𝜀𝑟𝜇𝑉2
𝐿3
Where ε0 is vacuum permittivity, εr = 3, μ is the carrier mobility, L is active layer thickness, and V is the
applied voltage.
Synthetic Procedure
2,7-Bis(4,4,5,5-tetramethyl-1,3,2-dioxaborolan-2-yl)-9,9-dioctylfluorene (1) was synthesized by according to
literature procedures.1, 2 All other reagents and solvents were purchased from commercial sources (Sigma-
Aldrich, Alfa Aesar, Acros Organics or TCI) and used as received. Reactions were carried out in an inert
argon atmosphere using conventional Schlenk line techniques.
Scheme S1: Synthesis of FTB.
5,5'-(9,9-dioctyl-9H-fluorene-2,7-diyl)bis(thiophene-2-carbaldehyde) (2) was synthesised according to a
modified procedure3: A solution of 2,7-bis(4,4,5,5-tetramethyl-1,3,2-dioxaborolan-2-yl)-9,9-dioctylfluorene
(2.50 g, 3.89 mmol) (1) in dimethoxyethane (20 cm3) was purged with argon gas for 1 hr before the addition
of 5-bromo-2-thiophenecarboxaldehyde (1.39 cm3, 11.7 mmol) and Pd(PPh3)4 (0.22 g, 0.19 mmol). After
further purging this solution with argon gas for 1 hr, a pre-purged solution of aq. Na2CO3 (2M, 12 cm3) was

added and the mixture was heated overnight at 90 °C. The reaction was then cooled to room temperature and
extracted with CH2Cl2, dried over MgSO4 and the solvent was removed in vacuo. Column chromatography
(silica gel, CH2Cl2) followed by recrystallization from CH2Cl2/methanol gave 2 as a yellow solid (1.8 g, 76%). 1H NMR (400 MHz, CDCl3) δ: 9.91 (s, 2H), 7.78-7.75 (m, 4H), 7.70 (dd, J = 8.2 Hz, 1.8 Hz, 2H), 7.64 (d, J =
1.6 Hz, 2H), 7.49 (d, J = 3.9 Hz, 2H), 2.05-1.97 (m, 4H), 1.15-1.02 (m, 20H), 0.78 (t, J = 7 Hz, 6H), 0.70-0.61
(m, 4H). 13C NMR (101 MHz, CDCl3) δ: 182.68, 154.78, 152.27, 142.27, 141.64, 137.40, 134.59, 132.43,
125.73, 124.05, 120.79, 120.72, 55.57, 40.21, 31.74, 29.88, 29.14, 23.77, 22.57, 14.03.
FTB was synthesised according to a modified procedure4: 1,3-dimethylbarbituric acid (0.17 g, 1.08 mmol)
and 2 (0.22 g, 0.36 mmol) were dissolved in tert-butyl alcohol (15 cm3) with gentle heating. 1 drop piperidine
was added and the solution was stirred overnight at 85 °C. After cooling to room temperature, the crude
product was purified by column chromatography on silica gel (CH2Cl2) followed by recrystallization from
CH2Cl2/ethanol, yielding FTB as a red solid (0.24g, 74%). 1H NMR (400 MHz, Chloroform-d) δ 8.70 (s, 2H),
7.90 (d, J = 4.4 Hz, 2H), 7.85 (dd, J = 8.1, 1.5 Hz, 2H), 7.81 – 7.73 (m, 4H), 7.61 (d, J = 4.3 Hz, 2H), 3.46 (d,
J = 15.4 Hz, 12H), 2.21 – 1.94 (m, 4H), 1.24 – 0.94 (m, 20H), 0.76 (t, J = 7.0 Hz, 6H), 0.63 (tt, J = 11.3, 6.5
Hz, 4H). 13C NMR (101 MHz, CDCl3) δ: 162.80, 162.19, 161.12, 152.42, 151.44, 148.72, 147.20. 142.20,
136.14, 132.69, 126.18, 124.78, 120.89, 109.23, 55.86, 40.29, 31.74, 29.98, 29.21, 29.17, 28.95, 28.20, 23.79,
22.57, 14.04. MS (MALDI-ToF): m/z calculated for C51H58N4O6S2: 886.38; m/z found 887.9 (M + 1)+.
Scheme S2: Synthesis of FTTB.
FTTB was synthesised according to a modified procedure5: 1,3-diethyl-2-thiobarbituric acid (0.24 g, 1.22
mmol) and 2 (0.25 g, 0.41 mmol) were dissolved in tert-butyl alcohol (20 cm3) with gentle heating. 1 drop
piperidine was added and the solution was stirred overnight at 85 °C. After cooling to room temperature, the
crude product was purified by column chromatography on silica gel (CH2Cl2) followed by recrystallization
from CH2Cl2/ethanol, yielding FTTB as a red solid (0.32 g, 80%). 1H NMR (400 MHz, CDCl3) δ 8.70 (s, 2H),
7.92 (d, J = 4.1 Hz, 2H), 7.87 (dd, J = 8.0, 1.5 Hz, 2H), 7.82 – 7.74 (m, 4H), 7.64 (d, J = 4.2 Hz, 2H), 4.63
(dq, J = 21.1, 6.9 Hz, 8H), 2.19 – 2.05 (m, 4H), 1.36 (dt, J = 22.1, 6.9 Hz, 12H), 1.21 – 1.00 (m, 20H), 0.76 (t,
J = 6.9 Hz, 6H), 0.70 – 0.57 (m, 4H). 13C NMR (101 MHz, CDCl3) δ 161.93, 160.01, 152.47, 149.64, 147.44,
142.33, 126.37, 125.11, 120.96, 110.19, 77.33, 77.22, 77.02, 76.70, 55.88, 44.03, 43.18, 40.28, 31.72, 29.86,
29.16, 23.80, 22.56, 12.57.

Figure S1: 1H-NMR of FTB in CDCl3.
Figure S2: 13C-NMR of FTB in CDCl3.

Figure S3: 1H-NMR of FTTB in CDCl3.

Figure S4: 13C-NMR of FTTB in CDCl3
Figure S5: Minimum energy conformation of FTB and FTTB molecules calculated using Gaussian (B3LYP/6-
13G*) and a visualization of their respective LUMO and HOMO distributions

Table S1: Optoelectronic properties of FTB, FTTB and PSEHTT
εmax
(104 M-1cm-1)a
Film Egopt
(eV)b
HOMO
(eV)c
LUMO
(eV)d
FTB 7.71 2.16 -5.66 -3.50
FTTB 8.92 2.03 -5.75 -3.72
PSEHTT -- 1.84 -5.17 -3.33 aCalculated from 10-6 M chloroform, bCalculated from as-cast UV-vis, cCalculated from film CV, dCalculated
from HOMO + Egopt.
-2.0 -1.5 -1.0 -0.5 0.0 0.5 1.0 1.5 2.0
FTB FTTB
Cur
rent
(mA
)
Voltage (V)
0.125 mA
Figure S6: CV of neat FTB and FTTB films

0.0 0.5 1.0 1.5
Cur
rent
(mA
)
Potential Applied (V)
PSEHTT
Figure S7: CV of PSEHTT film
350 400 450 500 550 600 650 700 750 800 8500.0
0.2
0.4
0.6
0.8
1.0
Nor
mal
ised
Abs
oban
ce (a
.u.)
Wavelength (nm)
PSEHTT PSEHTT annealed
Figure S8: UV-vis absorption of neat PSEHTT film with and without annealing at 175°C for 10min
Table S2: Device optimization of PSEHTT:FTTB (1:2) with different concentrations in chlorobenzene (CB).
Blend (1:2) SolventConcentration
(mg/mL)Jsc (mAcm-2) Voc (V) FF PCE (%)
PSEHTT:FTTB CB 8 8.13 ± 0.630.97 ±
0.05
0.48 ±
0.053.78 ± 0.73

10 11.90 ± 0.871.00 ±
0.01
0.52 ±
0.026.17 ± 0.50
15 7.72 ± 0.881.00 ±
0.01
0.46 ±
0.043.60 ± 0.68
Table S3: Device optimization of blends with various solvents, annealing durations/temperatures, and D:A
ratio at concentration of 10mg/mL including DIO (1, 8-diiodooctane), TMB (1, 2, 4-trimethylbenzene), PN (1-
phenylnapthalene), DCB (1, 3-dichlorobenzene), THN (tetralin).
PSEHTT:
(10 mg/mL)Solvent D:A
Anneal
(10 mins.)Jsc (mAcm-2) Voc (V) FF
PCE (PCEmax)
(%)
-- 6.76 ± 0.53 1.18 ± 0.02 0.44 ± 0.01 3.51 ± 0.32 (4.11)1:1
175 4.90 ± 0.94 0.96 ± 0.04 0.45 ± 0.04 2.11 ± 0.52 (2.92)
-- 8.17 ± 0.68 1.15 ± 0.04 0.52 ± 0.03 4.84 ± 0.33 (5.42)
110 5.86 ± 1.04 1.11 ± 0.01 0.55 ± 0.00 3.54 ± 0.67 (4.22)
140 4.77 ± 0.78 1.06 ± 0.01 0.56 ± 0.01 2.86 ± 0.48 (3.46)1:2
175 5.94 ± 0.55 0.94 ± 0.14 0.43 ± 0.04 2.43 ± 0.59 (3.15)
-- 6.42 ± 0.40 1.14 ± 0.01 0.55 ± 0.02 4.00 ± 0.29 (4.36)
CB
1:3175 6.75 ± 0.50 0.89 ± 0.03 0.53 ± 0.06 2.67 ± 0.40 (3.58)
CB + 3%
DIO-- 0.00 ±0.00 0.00 ±0.00 0.00 ±0.00 0.00 ±0.00 (0.00)
CB + 1%
DIO-- 3.83 ± 0.48 1.08 ± 0.01 0.47 ± 0.01 1.95 ± 0.25 (2.22)
TMB:THN -- 8.19 ± 0.79 1.16 ± 0.01 0.51 ± 0.03 4.83 ± 0.44 (5.32)
FTB
TMB +
2.5% PN
1:2
-- 6.07 ± 0.61 0.81 ± 0.12 0.40 ± 0.05 2.00 ± 0.57 (2.56)
-- 9.23 ± 0.58 1.00 ± 0.00 0.50 ± 0.02 4.63 ± 0.25 (4.98)1:1
175 6.76 ± 0.39 0.78 ± 0.01 0.46 ± 0.01 2.42 ± 0.16 (2.59)
-- 12.47 ± 0.83 1.00 ± 0.00 0.51 ± 0.03 6.38 ± 0.44 (7.17)1:2
175 6.79 ± 0.44 0.75 ± 0.02 0.44 ± 0.01 2.26 ± 0.21 (2.53)
-- 8.15 ± 0.44 0.04 ± 0.01 0.47 ± 0.02 3.58 ± 0.33 (3.92)
CB
1:3175 6.43 ± 0.22 0.87 ± 0.02 0.45 ± 0.02 2.56 ± 0.09 (2.67)
CB + 3%
DIO-- 5.97 ± 0.62 0.78 ± 0.02 0.36 ± 0.01 1.68 ± 0.12 (1.68)
FTTB
CB:DCB
(1:1)
1:2
-- 7.11 ± 0.92 0.99 ± 0.03 0.53 ± 0.05 3.72 ± 0.57 (3.75)

CB:DCB
(9:1)-- 4.43 ± 0.87 0.96 ± 0.03 0.49 ± 0.03 2.07 ± 0.41 (2.35)
TMB:THN -- 6.68 ± 1.05 1.12 ± 0.01 0.52 ± 0.03 3.84 ± 0.55 (4.97)
TMB +
2.5% PN-- 5.25 ± 0.78 0.94 ± 0.02 0.53 ± 0.02 2.64 ± 0.42 (2.96)
5 10 15 20 25 30 350
1000
2000
3000
4000
5000
6000
5 10 15 20 25 30 350
100
200
300
Inte
nsity
(a.u
.)2(Degrees)
FTB FTB annealed FTTB FTTB annealed PSEHTT PSEHTT annealed
Inte
nsity
(a.u
.)
2(Degrees)
Figure S9: Drop-cast powder-XRD neat FTTB, FTB and PSEHTT films as-cast without and with annealing at
175 °C for 10 mins , inset focus on FTTB and PSEHTT at lower-intensity in the range of 15-25°
5 10 15 20 25 30 350
100
200
300
400
500
Inte
nsity
(a.u
.)
2(Degrees)
PSEHTT:FTB PSEHTT: FTB annealed PSEHTT:FTTB PSEHTT:FTTB annealed
350 400 450 500 550 600 650 700 750 800 8500.0
0.2
0.4
0.6
0.8
1.0
Nor
mal
ised
Abs
oban
ce (a
.u.)
Wavelength (nm)
PSEHTT:FTB PSEHTT:FTB annealed PSEHTT:FTTB PSEHTT:FTTB annealed
Figure S10: Drop-cast powder-XRD (left) and UV-vis absorption (right) of PSEHTT:FTB and
PSEHTT:FTTB films with and without annealing at 175°C for 10 minutes
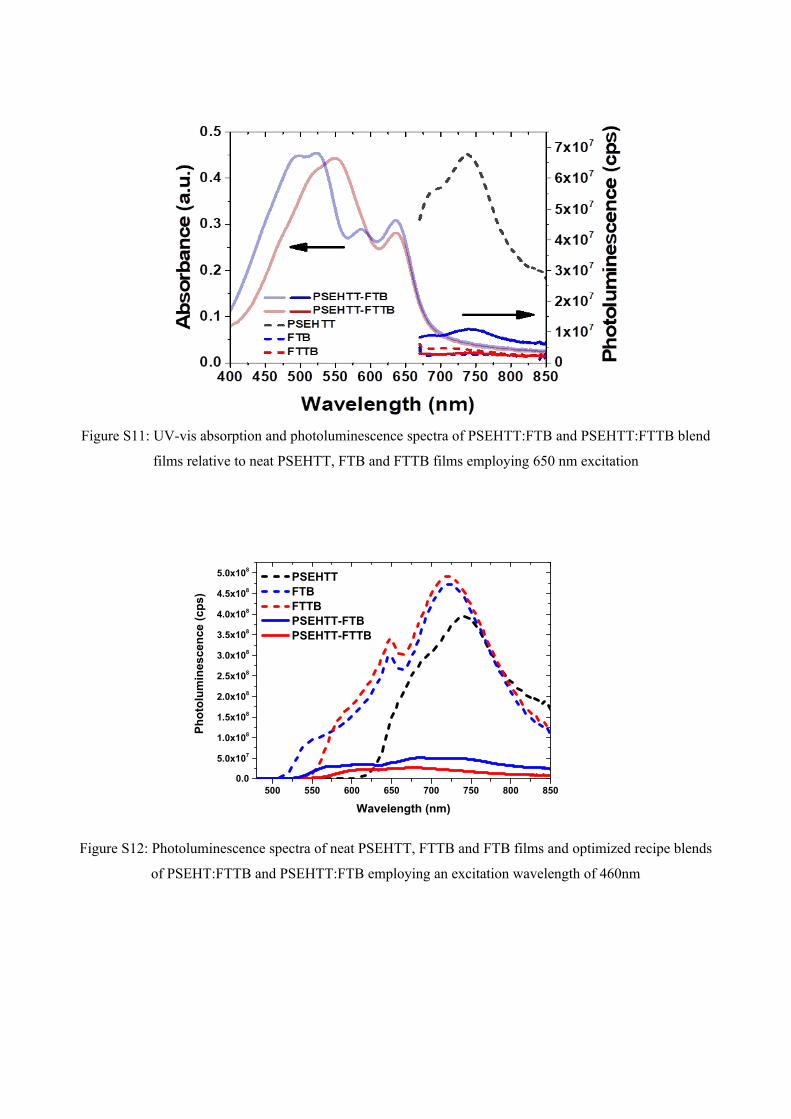
Figure S11: UV-vis absorption and photoluminescence spectra of PSEHTT:FTB and PSEHTT:FTTB blend
films relative to neat PSEHTT, FTB and FTTB films employing 650 nm excitation
500 550 600 650 700 750 800 8500.0
5.0x10⁷
1.0x10⁸
1.5x10⁸
2.0x10⁸
2.5x10⁸
3.0x10⁸
3.5x10⁸
4.0x10⁸
4.5x10⁸
5.0x10⁸
Phot
olum
ines
cenc
e (c
ps)
Wavelength (nm)
PSEHTT FTB FTTB PSEHTT-FTB PSEHTT-FTTB
Figure S12: Photoluminescence spectra of neat PSEHTT, FTTB and FTB films and optimized recipe blends
of PSEHT:FTTB and PSEHTT:FTB employing an excitation wavelength of 460nm

0 1 2 3 4 51E-6
1E-5
1E-4
1E-3
0.01
Cur
rent
Den
sity
(mA
cm-2
)
Voltage (V)
PSEHTT:FTB PSEHTT:FTTB
Figure S13: Hole blend change mobility (unfilled circles) and Mott-Gurney fitting (solid lines)
0 1 2 3 4 51E-141E-131E-121E-111E-10
1E-91E-81E-71E-61E-51E-41E-30.01
Cur
rent
Den
sity
(mA
cm-2
)
Voltage (V)
PSEHTT:FTB PSEHTT:FTTB
Figure S14: Electron blend change mobility (unfilled circles) and Mott-Gurney fitting (solid lines)
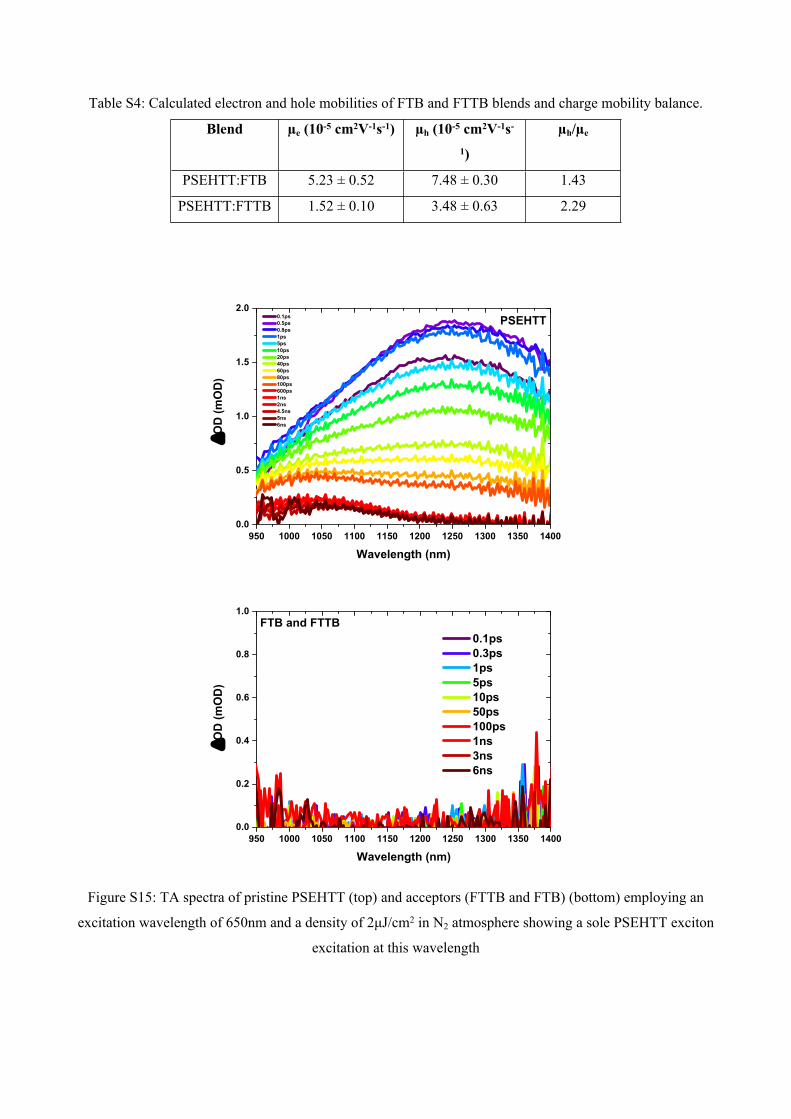
Table S4: Calculated electron and hole mobilities of FTB and FTTB blends and charge mobility balance.
Blend µe (10-5 cm2V-1s-1) µh (10-5 cm2V-1s-
1)
µh/µe
PSEHTT:FTB 5.23 ± 0.52 7.48 ± 0.30 1.43
PSEHTT:FTTB 1.52 ± 0.10 3.48 ± 0.63 2.29
950 1000 1050 1100 1150 1200 1250 1300 1350 14000.0
0.5
1.0
1.5
2.0
O
D (m
OD
)
Wavelength (nm)
0.1ps 0.5ps 0.8ps 1ps 5ps 10ps 20ps 40ps 60ps 80ps 100ps 600ps 1ns 2ns 4.5ns 5ns 6ns
PSEHTT
950 1000 1050 1100 1150 1200 1250 1300 1350 14000.0
0.2
0.4
0.6
0.8
1.0
O
D (m
OD
)
Wavelength (nm)
0.1ps 0.3ps 1ps 5ps 10ps 50ps 100ps 1ns 3ns 6ns
FTB and FTTB
Figure S15: TA spectra of pristine PSEHTT (top) and acceptors (FTTB and FTB) (bottom) employing an
excitation wavelength of 650nm and a density of 2μJ/cm2 in N2 atmosphere showing a sole PSEHTT exciton
excitation at this wavelength

100 10000.0
0.2
0.4
0.6
0.8
1.0
1.2
1.4
Nor
mal
ized
O
D
t (ps)
1J/cm2
2J/cm2
10J/cm2
PSEHTT:FTB
100 10000.0
0.2
0.4
0.6
0.8
1.0
1.2
1.4
Nor
mal
ized
O
D
t (ps)
1J/cm2
2J/cm2
10J/cm2
PSEHTT:FTTB
Figure S16: Kinetics probed at 1050nm (polaron) of FTB:PSEHTT (top) and FTTB:PSEHTT (bottom) films
employing an excitation wavelength of 650nm and densities of 1μJ/cm2, 2μJ/cm2, 10μJ/cm2 in N2 atmosphere
References
1. A. P. Zoombelt, S. G. J. Mathijssen, M. G. R. Turbiez, M. M. Wienk and R. A. J. Janssen, Journal of Materials Chemistry, 2010, 20, 2240-2246.
2. S. Y. Cho, A. C. Grimsdale, D. J. Jones, S. E. Watkins and A. B. Holmes, Journal of the American Chemical Society, 2007, 129, 11910-11911.
3. K. N. Winzenberg, P. Kemppinen, F. H. Scholes, G. E. Collis, Y. Shu, T. Birendra Singh, A. Bilic, C. M. Forsyth and S. E. Watkins, Chemical Communications, 2013, 49, 6307-6309.
4. E. Lim, Bulletin of the Korean Chemical Society, 2017, 38, 285-288.5. W. Ni, M. Li, B. Kan, F. Liu, X. Wan, Q. Zhang, H. Zhang, T. P. Russell and Y. Chen, Chemical
Communications, 2016, 52, 465-468.