cellprofiler tracer: exploring and validating high ... · software open access cellprofiler tracer:...
TRANSCRIPT

SOFTWARE Open Access
CellProfiler Tracer: exploring and validatinghigh-throughput, time-lapse microscopyimage dataMark-Anthony Bray and Anne E. Carpenter*
Abstract
Background: Time-lapse analysis of cellular images is an important and growing need in biology. Algorithms forcell tracking are widely available; what researchers have been missing is a single open-source software package tovisualize standard tracking output (from software like CellProfiler) in a way that allows convenient assessment oftrack quality, especially for researchers tuning tracking parameters for high-content time-lapse experiments. Thismakes quality assessment and algorithm adjustment a substantial challenge, particularly when dealing withhundreds of time-lapse movies collected in a high-throughput manner.
Results: We present CellProfiler Tracer, a free and open-source tool that complements the object tracking functionalityof the CellProfiler biological image analysis package. Tracer allows multi-parametric morphological data to be visualizedon object tracks, providing visualizations that have already been validated within the scientific community for time-lapseexperiments, and combining them with simple graph-based measures for highlighting possible tracking artifacts.
Conclusions: CellProfiler Tracer is a useful, free tool for inspection and quality control of object tracking data, availablefrom http://www.cellprofiler.org/tracer/.
Keywords: CellProfiler, Time lapse, Quality assessment, Fluorescence microscopy, Image analysis, Data visualization,Data exploration
BackgroundTime-lapse assays probe biological questions that canonly be investigated by observing the dynamic behaviorof organisms, cells, organelles, or molecular assembliesover time [1]. The combination of automated imagingand large-scale, high-content, live-cell experiments iscapable of delivering large amounts of data in very littletime [2]. However, time-lapse imaging is acutely susceptibleto many artifacts that negatively affect the proper identifica-tion and tracking of cells; the appearance of such anomaliesin a single frame can ruin an entire time series. Thus, imageand image analysis quality requirements for time-lapsemicroscopy are more stringent and, due to the volume ofdata, automated quality control is more necessary.Interfaces for review or correction of time-lapse data
are sometimes provided in customizable open-sourcesoftware but are usually manual in nature, requiring
visual inspection to detect aberrations [3, 4]. Alternately,commercial software may present such functionalitywithin a polished interface (e.g., Imaris by Bitplane,Volocity by Perkin-Elmer, MetaMorph by MolecularDevices), but such packages are not open-source, preclud-ing access to or adjustment of features and underlying algo-rithms. We saw a need for a tool that would link cellimages themselves directly to their morphological measure-ments within a tracking assessment tool; without this, avaluable opportunity is missed for the researcher to visuallyassess important changes in cell morphology and cellularcontext that accompany particular tracking results.The CellProfiler biological image analysis package is
widely used for collecting an extensive suite of morpho-logical, intensity, and textural features for cells and or-ganisms in high-content screens [5, 6]. Moreover, itincludes modular cell-tracking capabilities for time-lapseassays, such as the linear assignment problem (LAP) ap-proach [7], which provides robust tracking by closingtemporal gaps and capturing object merges and splits.
* Correspondence: [email protected] Institute of MIT and Harvard, 415 Main St, Cambridge, MA 02142, USA
© 2015 Bray and Carpenter. Open Access This article is distributed under the terms of the Creative Commons Attribution 4.0International License (http://creativecommons.org/licenses/by/4.0/), which permits unrestricted use, distribution, andreproduction in any medium, provided you give appropriate credit to the original author(s) and the source, provide a link tothe Creative Commons license, and indicate if changes were made. The Creative Commons Public Domain Dedication waiver(http://creativecommons.org/publicdomain/zero/1.0/) applies to the data made available in this article, unless otherwise stated.
Bray and Carpenter BMC Bioinformatics (2015) 16:368 DOI 10.1186/s12859-015-0759-x
CellProfiler is one of the few options for convenientlycombining the need for robust cellular identification andthe ability to process large numbers of time-lapse movies[8–10]. However, configuring tracking algorithm param-eters has been tedious without a tool to readily assesstrack quality. We present CellProfiler Tracer to enablethe visualization of the rich set of cellular features char-acteristic of high-content time-lapse assays, as well as toprovide measures for assessing track quality.
ImplementationCellProfiler Tracer is implemented as part of the CellPro-filer Analyst software package [11] (available from http://www.cellprofiler.org). Although most seamlessly used withdata from CellProfiler, the Tracer software is intended as avisualization and quality assessment tool compatible withhigh-content object tracking data derived from any two-dimensional time-lapse image sets, which most commonlyinvolve fluorescence or brightfield microscopy. Thus,Tracer is not itself a tracking algorithm, nor a general-purpose image visualization tool, nor a tool for manualtrack editing, but may be used in conjunction with othersoftware for those purposes [12, 13]. We used CellProfilerAnalyst as the foundation for Tracer, as CellProfiler Ana-lyst was designed for visualizing large, multi-parametric
data sets, with the ability to create various plots of cellularfeatures. It emphasizes linking the plotted data to the ori-ginating image for visual inspection and improved bio-logical interpretation. To create Tracer, we addedvisualizations to CellProfiler Analyst that are specific totime-lapse tracking data and that have already beenproven useful in the scientific community but have not asyet existed in a single freely-available and open-sourcesoftware package, namely the following:
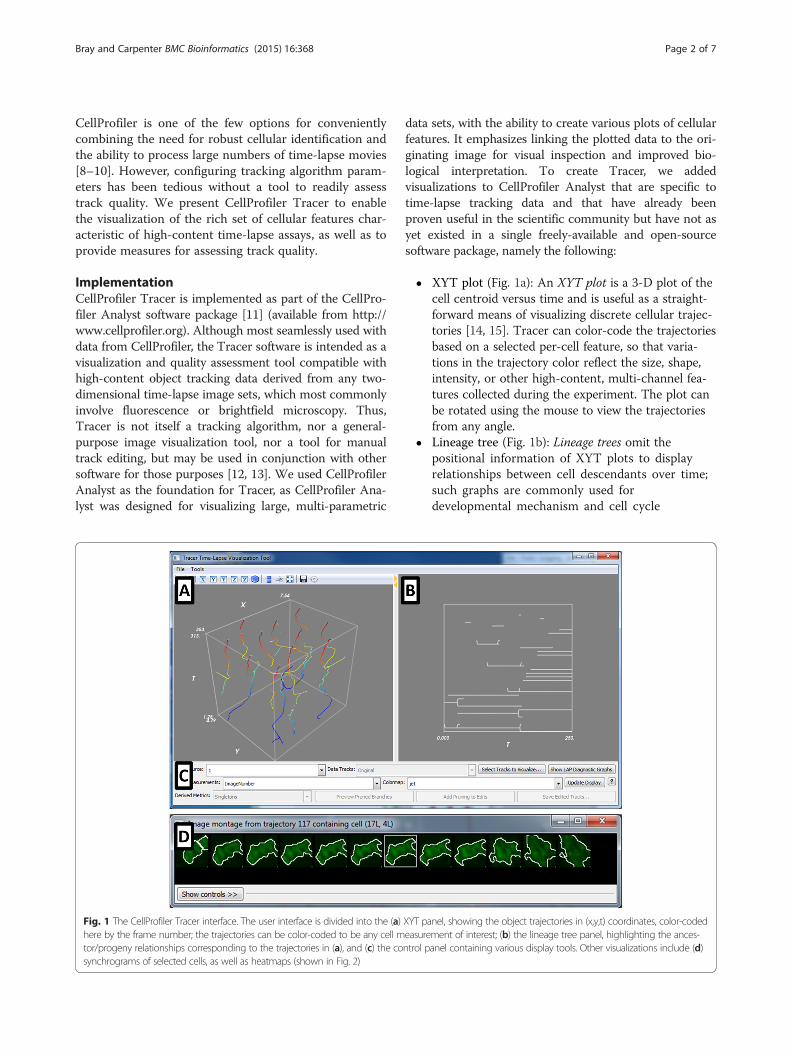
� XYT plot (Fig. 1a): An XYT plot is a 3-D plot of thecell centroid versus time and is useful as a straight-forward means of visualizing discrete cellular trajec-tories [14, 15]. Tracer can color-code the trajectoriesbased on a selected per-cell feature, so that varia-tions in the trajectory color reflect the size, shape,intensity, or other high-content, multi-channel fea-tures collected during the experiment. The plot canbe rotated using the mouse to view the trajectoriesfrom any angle.
� Lineage tree (Fig. 1b): Lineage trees omit thepositional information of XYT plots to displayrelationships between cell descendants over time;such graphs are commonly used fordevelopmental mechanism and cell cycle
Fig. 1 The CellProfiler Tracer interface. The user interface is divided into the (a) XYT panel, showing the object trajectories in (x,y,t) coordinates, color-codedhere by the frame number; the trajectories can be color-coded to be any cell measurement of interest; (b) the lineage tree panel, highlighting the ances-tor/progeny relationships corresponding to the trajectories in (a), and (c) the control panel containing various display tools. Other visualizations include (d)synchrograms of selected cells, as well as heatmaps (shown in Fig. 2)
Bray and Carpenter BMC Bioinformatics (2015) 16:368 Page 2 of 7

progression studies [4, 16–19]. Each cell at agiven timepoint is represented as a node,connected by edges to the tracked predecessorsand successors. As with the XYT plot, the nodescan be color-coded according to the desired per-cell image feature. Errors in object segmentationoften appear and disappear within a few frames,which results in an object split followed by a re-merge (or vice versa). This topological distortionis most obvious in the lineage display and is usedto call attention to the need for adjustment tothe image analysis parameters.
� Synchrograms (Fig. 1d): A synchrogram is asequence of images of an individual cell over time.This visualization helps track the progression of sub-cellular processes [20]. The selected cell is centeredin each frame to remove motion as a visual degreeof freedom; this also makes frame-to-frame trackingerrors immediately apparent. This tool allows forfollow-up on suspect trajectories or lineages identi-fied with the other tools, using a simple point-and-click interface linked to the other plots.
� Heatmaps (Fig. 2): Heatmaps are used to representnumerical data graphically as a colored two-dimensional matrix. Tracer can average each per-object feature across all trajectories at each time-point and display a heatmap of the result. This dis-play provides a simple means for the user to visuallyevaluate the data for significant trends in the cellpopulation, even if the time-lapse data is not tem-porally synchronous. This can be helpful for qualitycontrol purposes (e.g., a given timepoint was transi-ently out of focus) or perhaps relevant to the pheno-type under investigation (e.g., observing trends inresponse to drug treatment).
A control panel (Fig. 1c) is used to adjust variousaspects of the display panels. Other visualization fea-tures, such as plots and trajectory selections, are pro-vided via a context menu available on the displaypanels (Additional file 1: Figure S1). In addition, diag-nostics related to the LAP tracking method [21] andother quality metrics (described below) may also bedisplayed as an aid to tracking optimization(Additional file 1: Figure S2).Tracer is designed to process and explore any MySQL-
or SQLite-based database of image-based screening datastructured according to the following simple schema:
� An image table where each row corresponds to animage acquired at a unique timepoint and field ofview and the columns contain the image data (e.g.,the name of the treatment condition, the path toand filename of the original image, etc.). A
requirement for this table is an image index, givenas a column of integers referencing each site (i.e.,field of view) acquired.
� An object table in which each row represents anobject (e.g., cells) from a given image and thecolumns contain the collected object measurements(e.g., area of the cell, intensity of DNA stain in thenucleus, location of the cell in the original image).Required for this table is an image index asdescribed above, as well as an object index given asa column of integers referencing each objectidentified in an image. An (x,y) location for eachobject is also required (e.g., the cell centroid) ascolumns in the table; this permits limited 3D + tfunctionality if a 2D centroid of each 3D object is
Fig. 2 Heatmap of high-content cellular time-lapse measurements.The per-nucleus measurements from a Drosophila time-lapse movieare averaged over all nuclei for each timepoint; the measurementswere collected by CellProfiler software. Feature values werenormalized from 0 to 1 for visualization purposes. Feature nameswere omitted for conciseness but are provided in the Tracer display;the features shown are listed in order in the Additional file 3: TableS1, and are further described in the CellProfiler documentation
Bray and Carpenter BMC Bioinformatics (2015) 16:368 Page 3 of 7

provided rather than an entire 3D segmentation,e.g., by using a maximum projection into the XYplane or a particular Z-slice.
� In addition, an object relationship table is alsorequired. Each row corresponds to the image andobject index for a given object and that of its“parent”, i.e., tracked predecessor.
The above data tables can be automatically generated byCellProfiler using its ExportToDatabase and ExportToS-preadsheet modules; example files are provided at http://www.cellprofiler.org/tracer/. However, these schema areintended to be simple enough that a third-party softwarepackage (e.g., MATLAB, another object tracking package)can easily format its data accordingly. Using this format, atrajectory (defined as the frame-to-frame path followed byan object over time) can be captured by following theancestor-progeny mapping for an object. The relationshiptable captures both one-to-many and many-to-one objectmappings created by splits and merges, as well as tem-poral gaps produced by transient object disappearances.The primary challenge in handling aberrations in
time-lapse data is discriminating between natural bio-logical behaviors versus analysis artifacts (e.g., cell div-ision during mitosis versus improper cell splitting due tomis-segmentation). To address this issue, Tracer allowsthe user to assess the quality of object trajectories bytreating the trajectories as a network graph andhighlighting possible aberrations in the graph connectivity.The use of graph-based methods to analyze and resolve de-fects in time-lapse tracking data has been explored previ-ously [16, 22–25]; here, we use Tracer to simply bringattention to aspects of the network that may represent pos-sible mistakes in cellular segmentation and tracking.
Results and discussionWe demonstrate the data analysis and quality assessmentfeatures of CellProfiler Tracer using two time-lapsemovies that reveal the dynamics of nuclear division: aDrosophila blastoderm embryo with GFP-histone markingthe nuclear DNA (Foe lab, University of Washington, un-published data used with permission) and MCF-7 nucleitagged with NLS-mCerulean fusion protein (Ramaswamylab, Massachusetts General Hospital Cancer Center, un-published data used with permission); further details onthese data and permissions for use are included in theAdditional file 2. We used CellProfiler to identify the nu-clei, track them over time, and measure over 130 featuresof area, shape, intensity and texture (see the Additional file3: Table S1 for the full list of cellular features); the imagedata and CellProfiler pipelines are available from http://www.cellprofiler.org/tracer/. In the case of the Drosophilaembryos, the nuclei proceed through the cell cycle in syn-chrony, due to their sharing a common cytoplasm. From
the heatmap shown in Fig. 2, one can see that the rich setof features derived from GFP-histone expression at eachtime point of the movie could be used to fingerprint nu-clei at particular phases of the cell cycle. Similarly, any ofthe features collected can be visualized on the XYT andlineage panels by selecting the desired measurement forcolor-coding the object tracks; Additional file 1: Figure S3shows examples for the two data sets. Hypotheses aboutcell behavior can be generated and tested using this view.Cells typically exhibit a limited range of dynamic be-
havior, and hence the resultant network graphs are ex-pected to assume only certain topologies, as shown in amovie of MCF-7 nuclei (Fig. 3a). Therefore, deviationsfrom expected topologies (Fig. 3b) may indicate thatsomething is amiss in the tracking. The user can selectto display three different graph deviations in the Tracerinterface: loops, crossings, and singletons; all of these areevaluated when the data is first loaded. For example,transient split/merge ("loops") or merge/split ("cross-ings") events are unlikely to occur in typical biologicalsettings and may indicate an object mis-segmentation(Fig. 3c, d). Likewise, a very short trajectory ("single-ton", although the precise number of frames can beselected by the researcher) may correspond to aspurious object detection. For singletons, the user canproduce a display showing the distribution of tracklengths and a chart listing the total number of tracksand the median, 10th and 90th percentiles of thetrack lengths (Additional file 1: Figure S4).CellProfiler Tracer examines the tracking data for
these deviations and highlights suspect nodes by color-coding them in the display panels. In the case of single-tons, these nodes may be removed to create a newnetwork graph saved with the original data for retrievalacross Tracer sessions. It should be emphasized that thehighlighted nodes are intended to call attention to pos-sible object segmentation or tracking problems; the ab-sence of suspect nodes in a particular dataset does notpreclude other errors. However, a large number ofhighlighted nodes would indicate the need for furtheroptimization of the original cell segmentation settings.While other tracking interfaces include manual or semi-supervised segmentation editing [4, 26], this functionalityis currently outside the scope of Tracer. This is becausethe tool aims to support the completely automated ana-lysis of thousands of time-lapse image sets, for whichmanual intervention is impossible and some amount ofautomated error must be tolerated. Thus, the tool is de-signed to assist researchers in selecting appropriate seg-mentation and tracking parameters in other software (likeCellProfiler), such that the resulting data files are as highquality as possible. If feasible and necessary (e.g., forsmall-scale experiments), manual editing of individual tra-jectories can be carried out using other software, after
Bray and Carpenter BMC Bioinformatics (2015) 16:368 Page 4 of 7

Tracer has assisted in optimizing the automated segmen-tation and tracking parameters.To illustrate the use of CellProfiler Tracer for optimiz-
ing parameters, we tracked nuclei in the MCF-7 time-lapse data set using CellProfiler; for this movie, thedefault settings for its LAP tracking method yielded sub-stantial errors (Additional file 1: Figure S5). Anecdotally,researchers have reported that the lack of visual feed-back makes adjusting the algorithm’s many parametersextremely challenging. Using Tracer to visualize andassess the resulting tracks, the tracking settings in Cell-Profiler were then changed accordingly and the nucleire-analyzed to produce revised tracks. This procedurewas iteratively repeated until the final tracks reflectedthe actual temporal behavior of the nuclei; these opti-mized settings were then confirmed in Tracer to repro-duce the expected tracking behavior for a differentMCF-7 data set (Additional file 1: Figure S6). It bearsnoting that while only the lineage panel is shown inAdditional file 1: Figure S5 for brevity, all threevisualization tools were employed for optimization.While this one particular movie could have been ana-lyzed more quickly using a tool for manual correc-tion; the value in using Tracer is to optimizeautomated settings on subsets of time-lapse data, sothat they can be applied to hundreds of thousands of
data sets, for example, using CellProfiler’s high-throughput interface.
ConclusionsAs cellular tracking matures and the size of microscopydata sets continues to increase, progress in validatingtracking quality will make powerful time-lapse experi-ments on larger data sets feasible [26–29]. CellProfilerTracer is a tool that augments the cell-tracking function-ality of the CellProfiler biological image analysis packageby visualizing multi-parametric time-lapse data. Thesoftware incorporates graph-based assessment of track-ing quality, and makes it easy to produce and interactwith XYT plots, lineage trees, synchrograms and heat-maps — visualizations that have proven useful but havenot as yet existed in a single freely-available and open-source software package.
Availability and requirements
� Project name: CellProfiler Tracer� Project home page: http://www.cellprofiler.org/
tracer/ (installer), https://github.com/CellProfiler/CellProfiler-Analyst/tree/cellprofiler-tracer(source code)
� Operating systems: Windows, 64-bit
Fig. 3 Schematics of tracking errors. a An inset of the lineage panel for a movie of MCF-7 cells, with various tracking topologieshighlighted. b-d Tracking errors are reflected in synchrograms of MCF-7 nuclei (top panel) and graph topologies (bottom panel) withcolor indicating the unique object label. b Typical graphs with no tracking errors. c Mis-segmentation of neighboring objects producestransient merging and erroneous object creation. d A brief mis-segmentation of an object results in a transient (and incorrect) split
Bray and Carpenter BMC Bioinformatics (2015) 16:368 Page 5 of 7

� Programming language: Python� Other requirements: The Tracer source code for
CellProfiler Analyst requires the followinglibraries (see the project page for the most up-to-date requirements):○ For basic CellProfiler Analyst functionality■ Python 2.8 or greater (3.0 is not currently
supported)■ NumPy 1.71 or greater■ SciPy■ wxPython■ scikit-learn■ MySQLdb■ matplotlib■ javabridge■ python-bioformats■ verlib (required by distutils)
○ For Tracer functionality■ Enthought Tool Suite (for Mayavi2)■ VTK, 5.10 or greater■ NetworkX, 1.7 or greater■ configobj (required by Enthought)
� License: GNU General Public License, Version 2.� Any restrictions to use by non-academics: None
Additional files
Additional file 1: Figures S1–S6. Referenced in the main manuscripttext. (PDF 742 kb)
Additional file 2: Details of the cellular image data including celltype, acquisition technique, resolution and temporal resolution.(PDF 119 kb)
Additional file 3: Listing of high-content image-based featuresgenerated by CellProfiler, categorized by feature type. (XLS 33 kb)
Competing interestsThe authors declare that they have no competing interests.
Authors’ contributionsMAB developed and implemented the software, and drafted the manuscript.AEC contributed to the design of the software and case studies and wasinvolved in writing and editing the manuscript. Both authors reviewed andapproved the final manuscript.
AcknowledgmentsThe authors thank the members of the Foe and Ramaswamy laboratories forcontributing image data to the development of the software and this article,as well as John Albeck, Albert Yeh, and Evgeny Shlevkov for their helpfulfeedback on the Tracer tool. We are also grateful to Lee Kamentsky andVebjørn Ljoså for helpful advice, coding edits and discussions oncompilation, and the Imaging Platform team members for comments duringmanuscript preparation.This work was supported by the National Science Foundation (NSF RIG DBI1119830 to MAB) and National Institutes of Health (NIH R01 GM089652 to AEC).
Received: 8 April 2015 Accepted: 3 October 2015
References1. Spiller DG, Wood CD, Rand DA, White MRH. Measurement of single-cell
dynamics. Nature. 2010;465:736–45.
2. Neumann B, Walter T, Hériché J-K, Bulkescher J, Erfle H, Conrad C, et al.Phenotypic profiling of the human genome by time-lapse microscopyreveals cell division genes. Nature. 2010;464:721–7.
3. Meijering E, Dzyubachyk O, Smal I. Methods for cell and particle tracking.Methods Enzymol. 2012;504:183–200.
4. Winter M, Wait E, Roysam B, Goderie SK, Ali RAN, Kokovay E, et al. Vertebrateneural stem cell segmentation, tracking and lineaging with validation andediting. Nat Protoc. 2011;6:1942–52.
5. Carpenter AE, Jones TR, Lamprecht MR, Clarke C, Kang IH, Friman O, et al.Cell Profiler: image analysis software for identifying and quantifying cellphenotypes. Genome Biol. 2006;7:R100.
6. Kamentsky L, Jones TR, Fraser A, Bray M-A, Logan DJ, Madden KL, et al.Improved structure, function and compatibility for Cell Profiler: modularhigh-throughput image analysis software. Bioinformatics. 2011;27:1179–80.
7. Jaqaman K, Loerke D, Mettlen M, Kuwata H, Grinstein S, Schmid SL, et al.Robust single-particle tracking in live-cell time-lapse sequences. NatMethods. 2008;5:695–702.
8. Failmezger H, Fröhlich H, Tresch A. Unsupervised automated highthroughput phenotyping of RNAi time-lapse movies. BMC Bioinformatics.2013;14:292.
9. Rees P, Wills JW, Brown MR, Tonkin J, Holton MD, Hondow N, et al.Nanoparticle vesicle encoding for imaging and tracking cell populations.Nat Methods. 2014;11:1177–81.
10. Frechin M, Stoeger T, Daetwyler S, Gehin C, Battich N, Damm E-M, et al.Cell-intrinsic adaptation of lipid composition to local crowding drives socialbehaviour. Nature. 2015;523:88–91.
11. Jones TR, Kang IH, Wheeler DB, Lindquist RA, Papallo A, Sabatini DM, et al.Cell Profiler Analyst: data exploration and analysis software for compleximage-based screens. BMC Bioinformatics. 2008;9:482.
12. Chenouard N, Smal I, de Chaumont F, Maška M, Sbalzarini IF, Gong Y, et al.Objective comparison of particle tracking methods. Nat Methods.2014;11:281–9.
13. Peng H, Bria A, Zhou Z, Iannello G, Long F. Extensible visualization andanalysis for multidimensional images using Vaa3D. Nat Protoc.2014;9:193–208.
14. Li K, Miller ED, Chen M, Kanade T, Weiss LE, Campbell PG. Cell populationtracking and lineage construction with spatiotemporal context. Med ImageAnal. 2008;12:546–66.
15. Tvaruskó W, Bentele M, Misteli T, Rudolf R, Kaether C, Spector DL, et al.Time-resolved analysis and visualization of dynamic processes in living cells.Proc Natl Acad Sci U S A. 1999;96:7950–5.
16. Amat F, Lemon W, Mossing DP, McDole K, Wan Y, Branson K, et al. Fast,accurate reconstruction of cell lineages from large-scale fluorescencemicroscopy data. Nat Methods. 2014;11:951–8.
17. Al-Kofahi O, Radke RJ, Goderie SK, Shen Q, Temple S, Roysam B.Automated cell lineage construction: a rapid method to analyze clonaldevelopment established with murine neural progenitor cells. CellCycle. 2006;5:327–35.
18. Murray JI, Bao Z, Boyle TJ, Waterston RH. The lineaging of fluorescently-labeled Caenorhabditis elegans embryos with StarryNite and AceTree. NatProtoc. 2006;1:1468–76.
19. Megason SG. In toto imaging of embryogenesis with confocal time-lapsemicroscopy. Methods Mol Biol. 2009;546:317–32.
20. Sigal A, Milo R, Cohen A, Geva-Zatorsky N, Klein Y, Alaluf I, et al. Dynamicproteomics in individual human cells uncovers widespread cell-cycledependence of nuclear proteins. Nat Methods. 2006;3:525–31.
21. Jaqaman K, Danuser G. Computational image analysis of cellular dynamics:a case study based on particle tracking. Cold Spring Harb Protoc.2009;2009:db.top65.
22. Liu M, Yadav RK, Roy-Chowdhury A, Reddy GV. Automated tracking of stemcell lineages of Arabidopsis shoot apex using local graph matching. Plant J.2010;62:135–47.
23. Santella A, Du Z, Bao Z. A semi-local neighborhood-based framework forprobabilistic cell lineage tracing. BMC Bioinformatics. 2014;15:217.
24. Schiegg M, Hanslovsky P, Haubold C, Koethe U, Hufnagel L, Hamprecht FA.Graphical model for joint segmentation and tracking of multiple dividingcells. Bioinformatics. 2015;31:948–56.
25. Schiegg M, Heuer B, Haubold C, Wolf S, Koethe U, Hamprecht FA. Proof-reading guidance in cell tracking by sampling from tracking-by-assignmentmodels. In 2015 IEEE 12th International Symposium on Biomedical Imaging(ISBI). IEEE:394–398.
Bray and Carpenter BMC Bioinformatics (2015) 16:368 Page 6 of 7
26. Wait E, Winter M, Bjornsson C, Kokovay E, Wang Y, Goderie S, et al.Visualization and correction of automated segmentation, tracking andlineaging from 5-D stem cell image sequences. BMC Bioinformatics.2014;15:328.
27. Maška M, Ulman V, Svoboda D, Matula P, Matula P, Ederra C, et al. Abenchmark for comparison of cell tracking algorithms. Bioinformatics.2014;30:1609–17.
28. Chen Y, Ladi E, Herzmark P, Robey E, Roysam B. Automated 5-D analysis ofcell migration and interaction in the thymic cortex from time-lapsesequences of 3-D multi-channel multi-photon images. J Immunol Methods.2009;340:65–80.
29. Adanja I, Megalizzi V, Debeir O, Decaestecker C. A new method to addressunmet needs for extracting individual cell migration features from a largenumber of cells embedded in 3D volumes. PLoS One. 2011;6:e22263.
Submit your next manuscript to BioMed Centraland take full advantage of:
• Convenient online submission
• Thorough peer review
• No space constraints or color figure charges
• Immediate publication on acceptance
• Inclusion in PubMed, CAS, Scopus and Google Scholar
• Research which is freely available for redistribution
Submit your manuscript at www.biomedcentral.com/submit
Bray and Carpenter BMC Bioinformatics (2015) 16:368 Page 7 of 7