cell to cell communication and ph in the frog lens
TRANSCRIPT

Cell to Cell Communication and pH in
the Frog Lens
RICHARD T. MATHIAS, GLORIA RIQUELME, a n d JAMES L. RAE
From the Department of Physiology and Biophysics, State University of New York at Stony Brook, Stony Brook, New York 11794-8661; and Departments of Physiology and Biophysics and Ophthalmology, Mayo Foundation, Rochester, Minnesota 55905
A B ST R A C T Fiber cells of the lens are electrically and diffusionally interconnected through extensive gap junctions. These junctions allow fluxes of small solutes to move between inner cells and peripheral cells, where the majority of transmem- brane transport takes place. We describe here a method utilizing two intracellular microelectrodes to measure the cell to cell resistance between fiber cells at any given distance into the intact lens. We also use ion-sensitive microelectrodes to record intracellular pH at various depths in the intact lens. We find that gap junctions connecting inner fiber cells differ in pH sensitivity as well as normal coupling resistance from those connecting peripheral cells. The transition occurs in a zone between 500 and 650 p.m into the lens. Fiber cells peripheral to this zone have a specific coupling resistance of 1.1 ~cm 2, whereas those inside have a specific coupling resistance of 2.7 l'lcm ~. However, when the cytoplasm of fiber cells is acidified by bubbling with CO~, peripheral cells uncouple and the cell to cell resistance goes up more than 40-fold, whereas junctions inside this zone are essentially unaffected by changes in intraceUular pH. In a normal frog lens, the intracellular pH in fiber cells near the lens surface is 7.02, a value significantly alkaline to electrochemical equilibrium. Our data suggest that Na/H exchange and perhaps other Na gradient-dependent mechanisms in the peripheral cells maintain this transmembrane gradient. Deep in the lens, the fiber cell cytoplasm is signifi- cantly more acidic (pH i 6.81) due to influx of hydrogen across the inner fiber cell membranes and production of H + by the inner fiber cells. Because of the normally acid cytoplasm of interior fiber cells, their loss of gap junctional sensitivity to pH may be essential to lens survival.
I N T R O D U C T I O N
T h e pr imary function of the lens is to focus light on the retina. It is able to do so because o f its shape, high index of refraction, and lack o f light-scattering elements. Blood vessels and intracellular organelles scatter light, so the lens has evolved a physiological system (reviewed in Mathias and Rae, 1985, 1989) in which its fiber cells are able to survive without these structures. In brief, the surface epithelial and differentiating fiber cells provide the majority o f the transport. They extrude sodium,
Address reprint requests to Dr. Richard T. Mathias, Department of Physiology and Biophysics, State University of New York at Stony Brook, Stony Brook, NY 11794-8661.
j . GEN. PHYSIOL. © The Rockefeller University Press • 0022-1295 / 91 / 12/1085 / 19 $2.00 1085 Volume 98 December 1991 1085-1103
Dow
nloaded from http://rupress.org/jgp/article-pdf/98/6/1085/1249981/1085.pdf by guest on 21 N
ovember 2021

1086 THE JOURNAL OF GENERAL PHYSIOLOGY • VOLUME 98 • 1991
take in potassium, and regulate pH and calcium. The inner fiber cells are connected by gap junctions to these peripheral cells, thus allowing fiber cells to maintain t ransmembrane ion gradients, a resting voltage, and constant volume. Hence, gap junctions are essential to the survival of inner cells.
Active transport by surface cells and the tightly coupled syncytium of fiber and peripheral cells confer on the lens some properties like those of a giant single cell. However, a single cell is small (micrometer distances) and relies on simple intracellu- lar diffusion of small solutes transported across its surface membrane. The lens is much larger (millimeter distances) and diffusion through gap junctions from surface to the inner cells is slow. Moreover, diffusion over long distances requires a significant concentration difference. Circulating ionic currents (Kinsey and Reddy, 1965; Candia, Bentley, and Mills, 1971a; Robinson and Patterson, 1983; Parmalee, 1986) driven by standing voltage gradients (Mathias and Rae, 1985; Candia, Bentley, Mills, and Toyofuku, 1971b) augment simple diffusion in the lens. Mathias (1985) suggested that fluid flow also assists in moving solutes through the lens. Nevertheless, standing concentration gradients for intracellular ions have been recorded (Paterson, 1972, 1973), and ions like hydrogen (Bassnett and Duncan, 1985) or calcium (Jacob, 1983), which are known to affect gap junctions, are at different concentrations in fiber cells at different depths within the lens. Moreover, the structure of lens gap junctional proteins changes as one looks from the peripheral cells to central cells (Lo and Harding, 1986; Takemoto, Takehama, and Horwitz, 1986; Kistler and BuUivant, 1987).
The purpose of this paper is to describe some of the functional properties of tens fiber cell gap junctions. Because of the above described variation in both environ- ment and structure of junctions, we used a unique frequency domain impedance technique to study the junctions at specific locations within the intact lens.
Preliminary accounts of various aspects of this work have appeared in abstract form (Mathias and Rae, 1986; Mathias, Riquelme, and Rae, 1988).
M E T H O D S
Small grass frogs (Rana pipiem) were killed and the lenses were dissected as described in Mathias, Rae, and Eisenberg (1979). The intact lens is left suspended by its zonules to retinal and scleral tissue, which is cut into four flaps that are subsequently pinned into a Sylgard-lined bath. As described in Mathias, Rae, Ebihara, and McCarthy (1985), the bath could be exchanged in ~ 3 s.
The composition of solutions is given below in millimolar. Normal Ringer: 108.5 Na*, 2.5 K ÷, 118 CI-, 2 Ca 2÷, 1.5 Mg 2÷, and 0.1 PO~, pH 7.4. High Ca 2÷ Ringer: 78.5 Na t, 2.5 K *, 124 CI-, 20 Ca 2÷, 1.5 Mg ~÷, 5 HEPES, titrated to pH 7.4 with NaOH. pH calibration: 10 Na ~, 100 K ÷, 110 CI-, 5 HEPES, titrated to pH 6.2 or 8.0 with NaOH. Voltage electrode: 2,500 K ÷, 2,500 C1-. Current electrode: 2,500 K ÷, 2,500 acetate.
Impedance Studies
Two intraceUular microelectrodes of 3-10 Mft resistance were positioned so that the current- passing electrode was as close to the center of the lens as possible and the voltage-recording electrode was at a known depth and angular distance from the anterior or posterior pole. A differential voltage electrode was placed in the bathing solution to subtract voltage drops in the bath and bath electrode. We utilized the circuits described in Mathias, Rae, and Eisenberg
Dow
nloaded from http://rupress.org/jgp/article-pdf/98/6/1085/1249981/1085.pdf by guest on 21 N
ovember 2021

MATHtAS vr At.. Cell Communication and pH in the Lens 1087
(1981) to record voltage and current. Both intracellular electrodes were shielded to within 1 mm of their tips with grounded silver paint and then insulated from the bath with varnish, as described in Mathias et al. (1981).
A random current of selected average bandwidth was generated using a noise generator (model 3722A; Hewlett-Packard Co., Palo Alto, CA). The voltage and current waveforrns were digitized on a Fourier analyzer (model 5420A; Hewlett-Packard Co.) and the frequency domain impedance was computed in real time. Data were collected as described in Mathias et al. (1981). We usually recorded three impedance data sets plus a calibration curve. The Fourier analyzer records and averages 256 frequency lines, which we selected to be between 0 and 12, 100, or 800 Hz. The calibration curve was 0-800 Hz. The impedance and calibration data were subsequently transferred to an IBM PC-AT for analysis.
Our data analysis procedure has changed very little from the procedure described in Mathias et al. (1979, 1981, 1985). The 800-Hz data were corrected using the calibration curve. The three data sets were then merged into one set, which was approximately equally spaced on a log frequency scale from 0.08 to 800 Hz. We collected many more frequency lines than were needed to specify our model; hence, we dropped the majority of the data during the merging process and used just 128 frequency lines for curve fitting. The merged data were properly scaled, transformed to magnitude and phase format, and wild point edited using a manual cursor--controUed program. Data at 60-Hz multiples are usually several standard deviations off of the curves, so we manually identified these points and the computer replaced them with the average value of several neighboring points on either side.
The final magnitude and phase impedance data were analyzed by one of two methods. In those studies designed to simply measure changes in cell to cell coupling, we used the magnitude at 800 Hz to determine the effective intracellular resistivity as described in the Theory section. In many circumstances we were interested in determining the fiber cell and surface cell membrane conductances. In these studies we used the Levenberg-Marquardt nonlinear curve-fitting algorithm (IMSI Inc., Houston, TX) as described in Mathias et al. (1979) to minimize the sum square error of impedance data minus theory (magnitude and phase at 128 frequency points between 0.08 and 800 Hz) by adjusting the parameters in the model. Mathias et al. (1979) describe the various tests we have applied to ensure that the curve-fitting procedure provides reliable estimates of the parameter values.
Intracellular pH Studies
Single-barreled microelectrodes were pulled from 1.5 mm o.d. microfilament glass (#6030; A-M Systems, Inc., Everett, WA). Immediately before pulling, the glass was thoroughly cleaned (Munoz, Deyhimi, and Coles, 1983). We first washed the glass pipettes in nitric acid, then sonicated them in ethanol for 2 rain, rinsed and boiled them in filtered distilled water, and finally dried them in an oven. The microelectrodes were silanized as described in Dresdner, Kline, and Witt (1989). In a covered beaker they were exposed to vapor of trimethyl- chlorosilane (Sigma Chemical Co., St. Louis, MO) for 15 rain. They were then removed and baked for 2 h at 200°C. The silanized micropipettes were back-filled with the pH-sensitive liquid ion exchange resin (World Precision Instruments, New Haven, CT) to a distance 200-500 I~m from the tip. The filling process was monitored at )<400 magnification. Those electrodes that properly filled with resin were back-filled from a syringe with 2.5 M KCI (pH 7); their resistance was 1--4 GO.
Special circuits were needed to interface with the high resistance resin-filled electrodes. We fabricated a simple follower circuit (see the differential amplifier in Fig. 1 of Mathias et al., 1979), which utilized an OPA 111 (Burr Brown, NY) FET input operational amplifier (input bias current _< 1 pA and input resistance ~ 105 Gil L A similar circuit was used to interface with a second, normal KCl-filled microelectrode used to record the intracellular voltage. Each
Dow
nloaded from http://rupress.org/jgp/article-pdf/98/6/1085/1249981/1085.pdf by guest on 21 N
ovember 2021

1088 THE JOURNAL OF GENERAL PHYSIOLOGY ' VOLUME 98 • 1991
electrode was connected to a resistor by a relay-controlled switch so a pulse of current could be passed at any time during the experiment and the resistance of the electrodes determined. Driven shields around the microetectrodes enhanced the bandwidth, which was at least 10 Hz (< 20 ms response time constant).
The pH-sensitive microelectrodes were calibrated before and after the experiments. We used four solutions: normal Ringer, pH 7.4; pH calibration solutions, pH 6.2 and 8.0; and normal Ringer bubbled with 100% CO~, pH 5.8. The average slope for the 14 electrodes we used was 53 ± 3 (SEM) mV per 10-fold pH change. The initial and final voltages in each calibration solution were always within 10 mV, or ±5 mV, from the average.
The pH-sensitive microelectrode and a voltage-recording microelectrode were inserted into opposite sides of the lens 45 ° from the posterior pole and positioned at the same distance from the surface. The voltage microelectrode recorded the resting potential and the difference between the voltage and pH-sensitive electrodes gave the intracellular pH.
T H E O R Y
Equat ions for radia l cur ren t flow in a spherical ly symmetr ic syncytial tissue (Eisen- berg, Barcilon, and Mathias, 1979) are based on the equivalent circuit shown in Fig. 1. For simplicity, the effects o f spher ical convergence are no t shown. T h e cur ren t I (amps) is in jected into a cell at the cen te r of the lens, r = 0. Cur ren t flows to the surface a long two paths : R~ (~cm) is the effective resistivity o f the in t racel lu lar pa th , where cur ren t flows f rom cell to cell t h rough gap junct ions ; Re (l)cm) is the effective resistivity o f the ext race l lu lar pa th between cells, where cur ren t follows a narrow tor tuous pa th to the surface. T h e int racel lular and ext racel lu lar c o m p a r t m e n t s are s epa ra t ed by the fiber cell m e m b r a n e s whose specific conductance is gm (S/cm2) and capaci tance is cm (F/cm2). At the surface of the lens, r = a, the ext racel lu lar space is
Extra- cellular
R e
Lens Center
~ • <
<
< < < < cn l ~ < < < <
Bath
R i
I <
Intra- cellular
t G s
FIGURE 1. The equivalent circuit for radial current flow in a spherically symmetric syncytial tissue. For sim- plicity, the spherical convergence of the structures is not shown. Current is injected into a cell at the lens center (r = 0). Current flows radially to the surface (r = a ) from cell to cell through gap junctions along the resis- tive path R v At the surface, intracellu- lar current must cross the surface cell membranes (G s + joC , ) to flow to the bath electrode. Current can also cross the membranes of the inner cells (gin +jO~Cm), enter the extracellular compartment, and flow radially to the bath along the small tortuous extra- cellular spaces indicated by the resis- tive path R e.
Dow
nloaded from http://rupress.org/jgp/article-pdf/98/6/1085/1249981/1085.pdf by guest on 21 N
ovember 2021

MATHIAS ET AL. Cell Communication and pH in the Lens 1089
open to the bath, where we assume the potential is zero, whereas the intracellular compartment is insulated by the surface cell membranes, whose specific conductance is G, (S/cm ~) and capacitance is Cs (F/cmZ). The current density in the intracellular and extraceUular space, respectively, is:
1 d+i(r) i i= -R, d----~ (amp/cm2) (1)
1 dt~,(r) ie = R, dr (amp/cm2) (2)
where +ix(r) (volts) is the voltage in the intraceUular, extracellular space at a distance r (cm) from the lens center. Total current is
d,, I = -4wr" [~ ~ r + R, dr j (amp) (3)
The transmembrane current equals the change in current per unit length along the extracellular space. In spherical geometry this is given by
1 d ( r 2 1 d * , k Sm r ~ dr ( ! R , dr ! = -~, (gm + j~Cm)(t~e -- 0i) (4)
where Sm/V t (cm -~) is the surface of membrane per unit volume of tissue andjto (s -1) is the Fourier transform variable: j = ~ ' ~ and to (rad/s) is angular frequency.
At the lens surface
~e(a) = 0 (5)
I dt~i(a) Ri dr - (G~ + jtoC,)+i(a) (6)
The solution for the intracellular voltage depends on two terms, one that depends on frequency and one that is frequency independent but depends on the location within the lens.
t~i = IZL(jto, r) (7)
ZL = Z~(jto) + R~(r) (8)
Eisenberg et al. (1979) derived ZL when R~ and R e are constants. Mathias et al. (1981) extended this analysis to allow R~ t o take on two values, one in the interior (r < 0.67a) and one in the periphery (r > 0.67a). Both of these studies used a perturbation approach based on R/(R~ + Re) being a small parameter everywhere. Under these conditions,
1 Ri Zm ---- 4waZ(G s + jtoCs + Ye) (l't) Ri + Rc
~/ coth ~/a + (S/cm ~) Y e - R ~ + R ¢
~. o (9)
( l o )
Dow
nloaded from http://rupress.org/jgp/article-pdf/98/6/1085/1249981/1085.pdf by guest on 21 N
ovember 2021

1 0 9 0 THE JOURNAL OF GENERAL PHYSIOLOGY • VOLUME 9 8 " 1 9 9 1
"y = Ri + Re)"-~t (gm + jta~Cm) (cm-') ( 1 1 )
Based on many previous impedance studies (Mathias et al., 1979, 1981; reviewed in Mathias and Rae, 1985) as well as data reported in this paper, typical values for the components in Fig. 1 are:
Gs = 5 × 10 -4 S/cm 2
gm = 5 × 10 -7 8 / c m 2
R i = 3.5 × 10 ~ c m
Cs = 5 x 10 -6 F /cm z
Cm = 1 X 10 -6 F / c m 2
R e = 5 0 × 1 0 3 f l c m
For r _< 0.67a, Mathias et al. (1981) found that R~ increased by a factor of 2 to 3. In the studies repor ted in this paper, we induce uncoupl ing o f fiber cells and cause
R~ to become rather large, so the perturbat ion approach is not valid. Moreover, we find that R~(r) is a continuous function o f radial location. Under these conditions we could not find generally valid approximate solutions to these equations; however, at high frequencies the membrane impedance goes to zero and the following approxi- mations are general and useful:
~ ( r ) ---} d)i(r) jo~ --* ~ (12)
If Eq. 12 is substituted into Eq. 3, we find
d~i RiRe dr - - I 4,rrr2(R i + Re) jto ~ ~ (13)
The boundary conditions at the surface (Eqs. 5 and 6) become
~(a) ---, t~(a) = 0 ]co ~ ~ (14)
Integrat ion of Eq. 13 with boundary condition Eq. 14 yields
fa r, R~R e d r
+i(r~) = - I 4"rr(Ri + Re) r z - I R s ( a , rl) j~o ---, ~ (15)
From the mean value theorem,
Rs(a , r l) - R j + R e 4~r -
where R~ (llcm) is the value of R~(r) for some r in the interval (r l ,a) . In a normal lens with a relatively constant R~ << Re, Eq. 16 simplifies to the point source series resistance defined in Eisenberg et al. (1979) or Mathias et al. (1981).
gq. 16 is most useful when the interval (rt, a) is sufficiently small so that R~ is representative o f the value o f R~(r) everywhere on the interval. To estimate R~ at locations deep within the lens, we measured the intracellular voltage at two different radial locations that are close together. At high frequencies, the voltage difference asymptotes to
Illi(r2) - - t~ i ( r l ) = I R s ( r 1, r2) j0~ ---, 00 (17)
Dow
nloaded from http://rupress.org/jgp/article-pdf/98/6/1085/1249981/1085.pdf by guest on 21 N
ovember 2021

MATHIAS ET AL. Cell Communication and pH in the Lens 1091
Assuming r~ > r 2 so Rs(r~, r~) is positive, we have
1/1 1) Rs(r,, r~) - t ~ 7 - ~ ~ I~ - ~ (18)
where R2 (l'lcm) is the value of Ri(r) for some r in the interval (r 2, r 0. Eqs. 12-18 are valid without regard to the size ofRJ(R~ + Re) or radial variation in
R~(r) or R,(r). The form o f Z g in Eq. 8 is also generally valid; however, when Ri(r) and Re(r) vary with radial location, we could not find an expression for Zm.
R E S U L T S
The magnitude of the input impedance of the lens, [ZL(jto, r)[, is defined as the peak intraceUular voltage divided by peak injected current, when both are sinusoids of frequency oa = 2"rrf. We inject the current into a cell near the lens center and record the voltage in a different cell at distance r cm from the center. Fig. 2 illustrates IZLt at r = 0.9a as a function of frequency in either normal conditions or after 20 h in high calcium Ringer (A), or after 30 min in normal Ringer solution bubbled with 100% CO2 (B). The dotted lines in Fig. 2 illustrate R,(a, r) in each condition. Eq. 16 of the Theory section relates Rs to the effective intracellular resistivity R~, which depends on cell to cell coupling by gap junctions.
The results in Fig. 2 A were the longest study we performed in high calcium. The uncoupling of cells was not large, whereas the deterioration of the lens was apparent. For the data in Fig. 2A, the value of Ri increased from 3.7 kD, cm to 6.8 kf~cm over a period of 20 h. The membrane-dependent component of the impedance, Zm in Eq. 8 or 9, dropped considerably. The input resistance (Zm(0)) started at 8 kl~ but dropped to 2.65 kl~, and the resting potential went from - 7 1 to - 5 7 mV over the course of the study. Moreover, the appearance of the lens was dramatically affected by the high calcium. Over the first few hours the lens became opaque, and by the end of the experiment it appeared that substantial cell death had occurred. Under similar conditions, Jacob (1983) reported a rise in intracellular calcium from 0.7 to 260 ~M and uncoupling of fiber cell junctions. Our observations suggest that the rise in intracellular calcium is but one of several effects, many of which are irreversible. From these data and the data in Fig. 3 we conclude that the effects of calcium on lens gap junctions is relatively small in comparison to pHi, at least over a range of intracellular concentrations of up to a few hundred micromolar.
Fig. 2 B shows the dramatic (and reversible) effect of bubbling the bathing solution with COs. Under these conditions, the bath pH drops to ~ 5.8, but more importantly, the CO2 readily crosses cell membranes and causes acidification of the cytoplasm (see Fig. 6). The total impedance increases at all frequencies, primarily because Rs increases from 200 to 5,200 1~. In the normal Ringer solution the value of Ri is 2.7 kD, cm (from Eq. 16 with r = 0.14 cm, a = 0.16 cm, and Re -- 51 kftcm), whereas in 100% CO2 the parallel resistivity of Ri with Re is 60 kfhzm, so Ri has increased enormously, Ri >> 60 kl-tcm, and R e = 60 kD, cm. The membrane-dependent component of the impedance increased slightly and Zm(0) went from 5 kf~ in normal Ringer to 6.1 kft in 100% COs. This small increase in the membrane-dependent
Dow
nloaded from http://rupress.org/jgp/article-pdf/98/6/1085/1249981/1085.pdf by guest on 21 N
ovember 2021

1092 THE JOURNAL OF GENERAL PHYSIOLOGY • VOLUME 9 8 " 1 9 9 1
c o m p o n e n t o f the lens resistance may actually reflect a reduc t ion in the length constant for ext racel lu lar cur ren t flow due to the increase in Ri and Re (analogous to decreas ing Ye in Eq. 10). In contras t to the small increase in Zm(0), the lens depolar izes significantly, going f rom - 6 4 mV in no rma l Ringer to - 2 4 mV in 100% COz. Mathias et al. (1985) sugges ted that the f iber cell membranes were selective for
-5 N
-5 N
6 .
4"
2"
o'.l
••Norma] Ringer
i i'o 16o io'oo Frequency (Hz)
6
4 . . . . . t ~00% C 0 2 . "
2 ~ . .
0 0 . 1 i l0 10'00
Frequency (Hz)
FIGURE 2. The magnitude of the lens impedance as a func- tion of frequency. The dotted lines represent the series resis- tance (R~ in Eq. 8), which de- pends on gap junctional cou- pling as indicated in Eqs. 15 and 16. The membrane-depen- dent component of the imped- ance (Z m in Eq. 8) is the differ- ence between the total impedance and the series resis- tance. (A) The magnitude of the impedance in normal Ringer and after 20 h in high calcium Ringer. The high cal- cium causes an increase in R, and a decrease in Z m. R~ changes from 300 to 550 ~I, indicating uncoupling of the peripheral cells. The input re- sistance Zm(0 ) falls from 8,000 to 2,650 f~ in the high calcium. Moreover, the resting potential depolarizes from -71 to - 5 7 mV. This lens had radius a = 0.169 cm and we recorded the impedance at r = 0.144 cm. (B) The magnitude of the imped- ance in normal Ringer and af-
ter 30 min of bubbling normal Ringer with 100% CO~. The CO~ readily crosses cell membranes and acidifies the cytoplasm through CO 2 + H20 ~ H + + HCO3. The drop in pH, causes an increase in R s from 200 to 4,300 l-l, indicating massive uncoupling of the peripheral cells. The membrane impedance increases slightly in the 100% CO 2, with Zm(0) going from 5,000 to 6,100 [l. The lens also depolarizes in the 100% CO 2, going from - 6 4 to - 2 4 mV in this experiment. All of these changes are reversible. This lens had radius a = 0.160 cm and we recorded the impedance at r = 0.140 cm.
sodium and chlor ide and had an unusually small conduc tance for potassium. If so, then the negat ive res t ing vol tage normal ly r eco rded in the fiber cells is due to coupl ing to the ou te r epi the l ia l and di f ferent ia t ing cells, which have a relatively high po tass ium conductance . By closing the gap junc t ions with 100% CO2, we may be uncoup l ing the K+-selective cells without actually blocking K ÷ channels . In this way a
Dow
nloaded from http://rupress.org/jgp/article-pdf/98/6/1085/1249981/1085.pdf by guest on 21 N
ovember 2021

MATHIAS ET AL. Cell Communication and pH in the Lens 1093
large depo la r i za t ion can occur without much change in m e m b r a n e conductance; instead, the depo la r i za t ion is due to the increase in Ri.
Calcium Effects on Fiber Cell Coupling
Fig. 3 A summarizes our da ta on lenses soaked in h igh Ca 2÷ Ringer solution. As can be seen, the ra te o f uncoup l ing is slow and no t monotonic , and the deg ree o f uncoup l ing is much less than that in low ph i . T o achieve significant uncoupl ing , we had to wait ~ 6 h, a t ime tha t al lowed irreversible d a m a g e to occur. We used the Ca 2+ i o n t o p h o r e A23187 to enhance the effect, but Fig. 3 B shows that the degree of
,¢ c~
x
r r +
co e r
c r
10 ̧ E
Y 8 c~
6. ( I + .~ 4 ~
a
E
o
~0 A
8. 20 mM Ca p+ .'~'~,v~-
. . - . . . . . . . . . . . . . . . . . . . . . . . . . . . . . . . . .
4. Normal Run Down
2 - r =0.9a
o o 5 6 6 fo f2 1'4
Time (hours}
B
-~-'~J / / 20 mM Ca 2+ "~...*-~/ + A23187
r=0. ga
~ 6 ~ 1'o Time (hours)
FIGURE 3. A summary of all results on uncoupling in high calcium solu- tion. These data suggest that gap junctional coupling of peripheral fi- ber cells is much less sensitive to changes in intracellular calcium than in phi. The average value of R i ± SEM is graphed as a function of time in the solutions. (,4) The value of R~ as a function of time in normal Ringer or high calcium Ringer. In normal Ringer we recorded R i in three lenses. In these studies R~ increased at a rate of ~90 f~cm/h (2%/h), presumably due to run-down of the dissected lens. The resting voltage did not change over 8 h. In the high calcium Ringer in six lenses, R~ started at 4.2 kO, cm and increased to 7.9 kD, cm. During this time period, the lenses depolar- ized from - 7 0 _+ 8 mV (SD) to - 5 6 + 15 inV. (B) The solid line is the aver- age Ri in six lenses bathed in high calcium Ringer plus 1 ~M of the cal- cium iontophore A23187. The dashed line is from one lens in which we extended the study to 10 h.
uncoup l ing is still relatively small. T h e value of Ri app rox ima te ly doubles in 6 h; however, in the one e x p e r i m e n t where we waited 10 h (dashed line in Fig. 3 B), there was litt le fur ther increase in Ri. In one study, we used a pH-sensi t ive microe lec t rode du r ing the exposu re to 20 mM Ca ~+ with A23187 (data no t shown). We de tec ted no significant change in p h i over a 1-h per iod , but small changes in p h i over long t ime pe r iods are difficult to de tec t with this method . In summary, owing to i r reversible d a m a g e induced by long- te rm exposu re to h igh ba th Ca 2+, we could not rel iably study the effect o f e levated in t racel lu lar Ca 2÷ on R~ in intact lenses. We do conclude, however, that our da ta on p H - i n d u c e d uncoup l ing are unlikely to be re la ted to changes in [Ca]i.
Dow
nloaded from http://rupress.org/jgp/article-pdf/98/6/1085/1249981/1085.pdf by guest on 21 N
ovember 2021

1094 THE JOURNAL OF GENERAL PHYSIOLOGY - VOLUME 98 • 1991
pH Effects on Fiber Cell Coupling
Fig. 4 A summarizes our data on coupl ing of per ipheral fiber cells in lenses exposed to Ringer solution bubbled with 100% COz. In normal Ringer R~R,/(R~ + R,) = R~ = 3.5 kl]cm. O n exposure to 100% COy R~R,/(R~ + R,) increases to an average value of 120 kl)cm in a per iod of ~ 50 rain. This requires that R, must increase by a factor of 2 to 3, probably owing to fiber cell swelling and the accompanying reduct ion in volume of the extraceUular space, and R~ has increased enormously to a value >> 120 kflcm (i.e., a >40-fo ld increase). Fig. 4 B illustrates that the CO~ effect on R~ is > 95% reversed after ~ 80 rain back in normal Ringer. Exposure to 100% CO 2 also
c l
r r +
n -
160
120 '
80'
40'
160
a 120
?G 80.
rr
~- 40.
n-
O
$
#
÷ ÷ + Ioo% co 2
÷
Normal Ringers
20 4'0
Time (min)
• • •
iOOg CO 2
go Time (min)
r=0.9a
60
r : 0 . 9 a
I00 150
FIGURE 4. The dependence of Rfl~/ (Ri + Re) on time in Ringer solution bubbled with 100% CO 2. The bath exchange was essentially complete in 3 s. (A) The average -+ SEM of the effect in six lenses. In normal Ringer (triangles at bottom of graph) Re > R~, so the measured resistivity is ap- proximately equal to R i = 3.5 kf),cm, whereas Re = 50 kO, cm. In 100% CO 2, both resistivities increase. Re is at least 120 kD, cm, or some three-fold higher than normal, probably due to cell swelling and the consequent reduc- tion in extracellular volume (R e is in- versely proportional to the volume fraction of extracellular space). R i has increased enormously to a value >> 120 k~cm, indicating closure of the gap junctions connecting periph- eral cells. Exposure to the 100% CO~ solution also caused depolarization of these lenses from - 72 -+ 6 to - 29 -+ 3 mV after 50 rain in the 100% CO~ solution. The average radius of these lenses was a = 0.168 _4- 0.012 cm and
the average point of recording was at r = 0.149 --- 0.013 cm, which we round off to ~ 0.9a. (B) An extended study from one lens showing the onset and reversibility of the 100% CO 2 effect.
caused the lenses to reversibly depolarize from - 7 2 mV in normal to - 2 9 mV in 100% CO2. The depolar izat ion followed the t ime course of the change in B, (see Fig.
6A). The average radius of the lenses we used for these studies was a = 0.168 cm, so the
average point of recording at r = 0.149 cm is ~ 200 ~,m below the lens surface. The data in Fig. 4 are therefore representat ive of what happens to R~ and Re in the outermost 200-~m-thick layer of fiber cells. To study coupl ing between more inter ior cells, we advanced the voltage recording microelectrode toward the center of the lens and measured the high frequency impedance at ~ 200-~m intervals. We subtracted
Dow
nloaded from http://rupress.org/jgp/article-pdf/98/6/1085/1249981/1085.pdf by guest on 21 N
ovember 2021

MATHIAS ET XL. Cell Communication and pH in the Lens 1095
the high frequency magnitude of the impedance at two neighboring depths, as indicated in Eq. 17, to obtain the average value of RiRe/(Ri + Re) between the two locations. The spatial resolution is thus ~ 200 Ixm. The amplitude is determined by subtracting two large resistances to obtain a relatively small one, so the results are subject to significant variance. Nevertheless, the data in Fig. 5 strongly suggest that the pH effect on R i does not extend beyond ~ 600 I~m into the lens, regardless of how long we waited (in one experiment we waited 12 h but most of the data were recorded 1.5 h after exposure to CO~).
Spatial Variation in Cell to Cell Coupling
Fig. 5 A shows the dependence ofRiRJ(R~ + Re) on radial location in 100% CO~. The data were recorded from five different lenses. In two lenses the voltage-recording microelectrode was inserted at 45 ° from the posterior pole and advanced toward the lens center. In the other three lenses, the point of insertion was 45 ° from the anterior pole. The lens is symmetric about an axis that goes from anterior to posterior pole, so the data are equivalent to measuring in a single lens along a line that enters the lens at 45 ° from the posterior pole, passes through the center, and exits at 45 ° from the anterior pole. To within the resolution of our measurement, the CO 2 effect seems to be the same in the anterior and posterior hemispheres, so we present all of our data as a function of distance from the lens center in Fig. 5 B.
Fig. 5 B compares the radial dependence of Rfl¢/(R~ + R¢) in 100% CO2 (anterior and posterior data) with posterior measurements in normal Ringer. Note that the resistivity is plotted on a log scale which amplifies the variance of the low resistivity data. The triangles are a scatter graph of all the data in Fig. 5 A. The open circles are a scatter graph of studies from 11 lenses in which we recorded the radial dependence in normal Ringer. The filled circles at r = 0.9a are averages of the data at r -- 0.9a. The filled circles at r = 0.3a are averages of all the data at r < 0.6a. In normal Ringer, R~R¢/(R~ + Re) = R i . Mathias et al. (1981) suggested that R i a s s u m e s two values, switching at r = 0.67a. Indeed, there seems to be a rather abrupt change in R~ between r = 0.6a and 0.7a, with R~ --- 3.5 klqcm for r peripheral to this zone and R~ = 9 k~cm for r inside this zone. The change is too abrupt to be proportional to a diffusion gradient of an intracellular substance, though a very steep nonlinear dependence of the junctions on some substance cannot be ruled out. However, it seems more likely that the junctions undergo some structural modification. This hypothesis is consistent with the pH effect in 100% CO2, since junctions inside this zone appear to have a different pH sensitivity than peripheral junctions.
There are at least three possible reasons for the lack of uncoupling of interior junctions: (1) communication between interior fiber cells could be mediated by cell to cell fusions (Kuszak, Macsai, Bloom, Rae, and Weinstein, 1985) rather than gap junctions, and fusions are presumably not sensitive to pH; (2) because of diffusion limitations, the CO2 was not reaching the interior cells; or (3) the junctions between interior cells are not sensitive to pH. With regard to (1), if fusions provide a continuous path, each cell must fuse at least once with each of four to six neighbors. Assuming that fusions are semirandom, we estimate that a minimum of 10 fusions per fiber cell are needed to insure continuity between all interior cells. Mathias and Rae (1989) use the data in Kuszak et al. (1985) to calculate the number of fusions per fiber cell at various depths into the lens. The number is on the order of 1 fusion per
Dow
nloaded from http://rupress.org/jgp/article-pdf/98/6/1085/1249981/1085.pdf by guest on 21 N
ovember 2021

1096
11o
E (J I c~ 2~
Or 4" -r--i
fr
°r*4 cr
Anterior tBO •
D
~20
6 0 ¸
T H E J O U R N A L O F G E N E R A L P H Y S I O L O G Y • V O L U M E 98 • 1991
A Posterior
l lo
I00
E U • I
eo •
Q m
o15 o o15 p/a
B b~ /
I00 % CO z ~ /~ i l
o ~ t ~
o N O R M A L . ~ - o - - ~ , l i
, i
O 0.5 1.0
rio
FIGURE 5. The dependence of R~Re/(R i + Re) on radial loca- tion in 100% CO 2 and normal Ringer solutions. (A) These data are a scatter graph of RiR j (R i + Re) vs. radial loca- tion in five lenses exposed to 100% CO 2 for ~1 .5 h. The distance from the surface of the lens appeared to be the most important factor, so we normal- ized the position of recording to r/a and present the data ac- cordingly. For these lenses, the average radius was a = 0.167 ± 0.013 cm (SD). Two lenses were impaled through the posterior surface at a point 45 ° from the posterior pole. Three lenses were impaled through the ante- rior surface at a point 45 ° from the anterior pole. Given the symmetry of the lens about its polar axis, the data effectively fall along a line that goes from the posterior surface, through the center, to the anterior sur- face. To the accuracy of our measurement, the data appear symmetric, so we plot all values as a function of r/a in B. (B) The resistivity is now graphed on a log scale to compare the
radial variation in normal Ringer (circles) with that in 100% CO 2 Ringer (triangles). Over a zone of r --- 0.6a-0.7a the properties of the gap junctions appear to change. Junctions peripheral to this zone have a lower coupling resistance in normal conditions but can be induced to uncouple by acidification of the cytoplasm, whereas junctions inside this zone have little if any sensitivity to acidification. The filled circles at r = 0.9a are mean ± SEM of R~Re/(R ~ + R~) in 100% CO 2 from six lenses, and in normal Ringer from five lenses. The filled circles ± SEM at r = 0.3a are from all the data at r < 0.6a.
10 f iber cells. T h e s e a re m u c h too sparse to have a s ignif icant ef fec t on Ri. With
r e g a r d to (2), we used ion-sens i t ive m i c r o e l e c t r o d e s to r e c o r d the in t race l lu la r p H
(see Figs. 6 -8) , a n d c o n c l u d e tha t p H changes do i n d e e d occur in the i n n e r f iber
cells. T h u s , hypo thes i s (3) a p p e a r s to be the best one : the i n t e r i o r f iber cell j u n c t i o n s
d i f fe r f r o m those c o n n e c t i n g p e r i p h e r a l cells.
Intracellular p H
Fig. 6 shows the t ime course o f t he c h a n g e in pHi a n d in t race l lu la r vo l tage , r e c o r d e d
at r ---- 0.9a, d u r i n g e x p o s u r e to R i n g e r so lu t ion b u b b l e d wi th 100% COs. T h e t i m e
Dow
nloaded from http://rupress.org/jgp/article-pdf/98/6/1085/1249981/1085.pdf by guest on 21 N
ovember 2021

MATHIAS ET AL, Cell Communication and pH in the Lens 1097
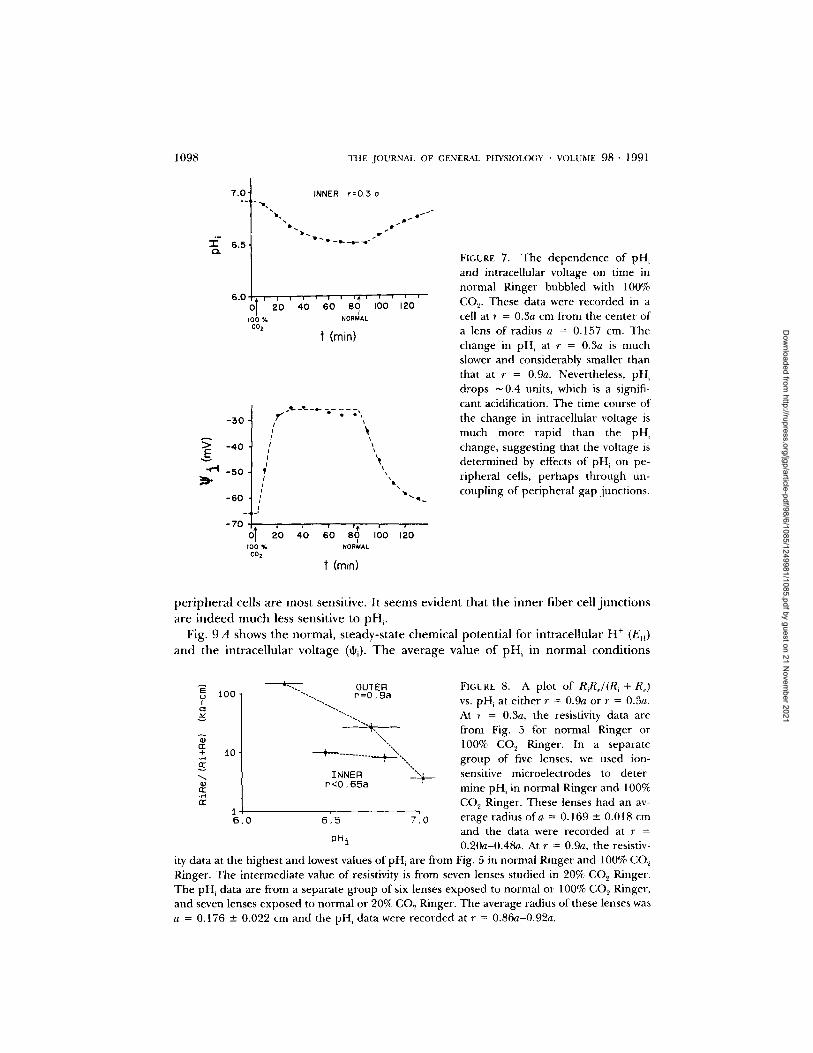
course of the change in pHi is similar to that of RiRe/(R ~ + R¢) shown in Fig. 4, though slightly faster. The change in intracellular voltage in Fig. 6 more closely parallels the change in resistivity in Fig. 4. Fig. 7 shows the result of the same kind of experiment, except that the pH and voltage are now recorded in a cell at r = 0.3a. The voltage change still parallels the change in coupling between peripheral cells (see Fig. 4), whereas the pH change is much slower. The ApH in the interior cells is only about half that in peripheral cells; nevertheless it is significant (ApH[0.3a] -- -0.4) and
7.0:
I - 6.5 ¢2.
6.0
- 3 0
- 4 0
- 5 0
-r-'l - 6 0
- 7 0
- 8 0
, OUTER r : O . 9 o
~O / ~% / 9
% I
i ~01 ~ i i i i i O| 5 t 15 2 0 ?-5 3 0 ~5
t
I 0 0 % NORMAL CO z
1' (min)
/
/
/ I i / I I
I
J
!
OI 5 I 0 0 %
C02
6
\
i i i
I0 I 15 20 25 NORMAL
t (rain)
~ e . , w
i i
:50 35
FIGURE 6. The dependence of pH~ and intracellular voltage on time in normal Ringer bub- bled with 100% CO¢. These data were recorded in a cell at r = 0.9a cm from the center of a lens of radius a = 0.195 cm. The change in pH~ is large (0.8 units) and somewhat faster than the effect on coupling shown in Fig. 4. The delay could repre- sent the time constant of chan- nel gating, the time constant of binding H + to the channels, or the occurrence of other events between the drop in pH, and closure of junctions. The change in intracellular voltage is somewhat slower and more closely parallels the closure of peripheral gap junctions.
should have caused significant uncoupling if the inner junctions had the same pH sensitivity as peripheral ones. This point is emphasized in Fig. 8 by comparing the dependence of peripheral and inner junctions on pHi.
Fig. 8 is a graph of the average value o f R f l e / ( R ~ + Re) from one group of lenses vs. the average pHi from another. The three points in the upper curve (r = 0.9a) were determined using normal Ringer, 20% CO2, and 100% CO2. In the bottom curve (r = 0.3a) we used normal Ringer and 100% CO2. Though the change in pH~ in the inner cells is less than that in peripheral cells, it occurs over a range of pHi where
Dow
nloaded from http://rupress.org/jgp/article-pdf/98/6/1085/1249981/1085.pdf by guest on 21 N
ovember 2021
1098 THE JOURNAL OF GENERAL P H Y S I O L O G Y • VOLUME 9 8 - 1 9 9 1
7 . 0 " ---4
"~- 6 . 5 . o .
6.0
) 0 % co 2
-30
> -4O E
v
.r-I -5O
l
- 6 0
- 7 0 2~0
100 % COz
INNER r = 0 . 3 0 ° " 1
~ i 4 ' 0 ' ' ~ ' ~ ' ' ' ' ' 2 0 6 0 8 0 I 0 0 1 2 0 t
NORMAL
t (min)
i i 16 I t 4 0 6 0 8 0 I 0 0 1 2 0
/
NORMAL
t (rain)
FIGURE 7. The dependence of pH~ and intracellular voltage on time in normal Ringer bubbled with 100% CO s. These data were recorded in a cell at r = 0.3a cm from the center of a lens of radius a = 0.157 cm. The change in pH~ at r = 0.3a is much slower and considerably smaller than that at r = 0.9a. Nevertheless, pH~ drops ~ 0.4 units, which is a signifi- cant acidification. The time course of the change in intracellular voltage is much more rapid than the pH, change, suggesting that the voltage is de te rmined by effects of pH~ on pe- r ipheral cells, pe rhaps th rough un- coupling of per ipheral gap junct ions.
p e r i p h e r a l cells a r e m o s t sens i t ive . I t s e e m s e v i d e n t t h a t t h e i n n e r f ibe r cell j u n c t i o n s
a r e i n d e e d m u c h less sens i t ive to p H v
Fig. 9 A shows t h e n o r m a l , s t e a d y - s t a t e c h e m i c a l p o t e n t i a l for i n t r a c e l l u l a r H ÷ (E . )
a n d t h e i n t r a c e l l u l a r v o l t a g e (+~). T h e a v e r a g e v a l u e o f pH~ in n o r m a l c o n d i t i o n s
I c~
r r +
o er
r r
1 0 0 -
t 0 "
1 6 . 0
~" OUTER FIGURE 8. A plot of R~Re/(R ~ + Re) """ ...... p = 0 . 9 a
............. vs. pH, at e i t he r r = 0.9a o r r = 0.3a.
, At r = 0.3a, the resistivity data are .... ~,, from Fig. 5 for normal Ringer or
" ' , 100% CO~ Ringer. In a separate t ............... ~ " " , group of five lenses, we used ion-
INNER ,,~ sensitive microelectrodes to deter- r < 0 . 6 5 a mine pH~ in normal Ringer and 100%
COz Ringer. These lenses had an av- 6' .5 7'.0 erage radius o f a = 0.169 +- 0.018 cm
and the data were recorded at r = PHi 0.20a-0.48a. At r = 0.9a, the resistiv-
ity data at the highest and lowest values ofpH~ are from Fig. 5 in normal Ringer and 100% CO,~ Ringer. The in termediate value of resistivity is from seven lenses studied in 20% CO 2 Ringer. T he pH~ data are from a separate group of six lenses exposed to normal or 100% CO 2 Ringer, and seven lenses exposed to normal or 20% CO~ Ringer. The average radius of these lenses was a = 0.176 +- 0.022 cm and the pH. data were recorded at r = 0.86a-0.92a.
Dow
nloaded from http://rupress.org/jgp/article-pdf/98/6/1085/1249981/1085.pdf by guest on 21 N
ovember 2021

MATHIAS El" AL.
0
- 2 0
-40
- 6 0
- 8 0
- 1 0 0
5O
0 J 40
CI
30
a : 4- • ,~ 20 •
iO n- .r-4 ,1"
o 0
Cell Communication and pH in the Lens
A
EH ............
. . . . . . . . . . . . . . . . . . . . . . . . . . . . . . . . . . . . . . . . . . . . +
o12 0'4 o16 o's P / a
o,Q
line %o • D o* oeo
• • ee e e e
• ." 0 Na + • °
oe e
e" •
• r ' = O . g a " , • e°oeo e
20% CO 2
T~me (min)
1099
FIGURE 9. The normal steady- state chemical (Nernst) poten- tial for intracellular H ÷ (EH) with respect to the bath and the intracellular voltage (+i) are shown in A. (.4) The chemical potentials for intracellular H ÷ are calculated from the normal Ringer values of pH i shown in Fig. 8. The dashed line con- necting the values of E H at r = 0.9a and 0.3a has no theoreti- cal significance, but shows the gradient in pH~ with location. The normal intracellular volt- age in the same lenses is illus- trated by the lower two filled circles. The dashed curve con- necting the voltage points is calculated as described in Ma- thias and Rae (1985). It illus- trates the expected shape of the radial gradient in intracel- lular voltage due to radially cir- culating ionic current carried primarily by Na ÷. A curve of this shape accurately describes high resolution measurements of ~i vs. r as shown in Mathias
and Rae (1985). These data illustrate that H ÷ at r = 0.9a is well out of electrochemical equi- librium. Moreover, the change in EH between r = 0.3a and 0.9a is opposite to the change in ~. Thus the electrochemical potential for intracellular H ÷ (+~ - EH) is more negative at r = 0.9a, so there will be a radial flux of H + from inner fiber cells, through gap junctions to the surface cells. (B) The value ofRiR,/(R~ + R,) in 20% CO~ is used to detect changes in pHi. When Na ÷ in the bath is replaced with either choline or tetramethyl ammonium (data not shown) there is a rapid (and reversible) increase in coupling resistance, suggesting a drop in pHi. Similar results are obtained when amiloride (1 p.M) is added to the bath instead of removing Na +. All of these studies were performed in peripheral fiber cells at the posterior surface. The results suggest that these cells use N a / H exchange as one mechanism of extruding the H ÷ that is moving from the lens center to peripheral cells. In the study shown, a = 0.190 cm, r = 0.156 cm, and exposure to 20% CO 2 caused the lens to depolarize from - 8 7 to - 4 9 inV.
d r o p s f r o m ~ 7.02 at r = 0.9a to 6.81 at r = 0.3a. I f e x t r u s i o n o f h y d r o g e n p r imar i ly
occurs at t he lens surface (Wolosin, Alvarez , a n d Cand ia , 1988, 1990; Bassnet t , 1990),
t he in t race l lu la r p H at t he c e n t e r o f t he lens (r -- 0) is p robab ly e v e n lower. G a p
j u n c t i o n s b e t w e e n i n n e r f iber cells a r e thus r e q u i r e d to exis t in a relat ively acid
e n v i r o n m e n t . T h e i r lack o f sensit ivity to low p H is t h e r e f o r e n o t l ikely to be
for tu i tous ; r a ther , it seems essent ia l to the p e r f o r m a n c e o f the i r n o r m a l func t ion .
As can be seen in Fig. 9A, e x t r u s i o n o f h y d r o g e n is aga ins t its e l e c t r o c h e m i c a l
g r a d i e n t (also see Discussion) so an act ive A T P a s e o r s econda ry active c o t r a n s p o r t
Dow
nloaded from http://rupress.org/jgp/article-pdf/98/6/1085/1249981/1085.pdf by guest on 21 N
ovember 2021

1100 THE JOURNAL OF GENERAL PHYSIOLOGY • VOLUME 9 8 " 1991
system is required. Wolosin et al. (1988, 1990) have characterized a sodium-hydrogen cotransport system and a sodium-dependent bicarbonate transporter in the epithelial cells of the toad lens. Bassnett (1990) reported Na /H exchange in epithelial cells from the chick lens. Ye and Zadunaisky (1990) have reported evidence for Na /H exchange in vesicles made from fiber cell membrane, but the source of the membrane was not localized within the lens. The Na /H transporter (reviewed in Bashford, 1990) uses the electrochemical gradient for sodium as the source of energy to transport hydrogen out of the lens in an electrically neutral 1Na + for 1H + exchange. We tested for the presence of this transporter in the frog lens as shown in Fig. 9 B. By bubbling with 20% CO2 we partially close gap junctions and stimulate extrusion of H +. Under these conditions the coupling of peripheral fiber cells is very sensitive to any further modification of pH~ (see Fig. 7). When sodium is removed from the bath, there is an immediate increase in coupling resistance, suggesting a drop in pH~ due to a sodium-dependent transport system or systems. Amiloride does not affect membrane conductance in the frog lens but should block sodium/hydrogen exchange, so we repeated the protocol in Fig. 9 B except that amiloride was added instead of removing sodium. The result was the same, suggesting that sodium/ hydrogen exchange is one mechanism for regulating pH~ in the frog lens. The rapidity of the effect on Ri of removing bath sodium (or adding amiloride) suggests that this mechanism is primarily localized to surface ceils. These studies were performed in peripheral fiber cells (r = 0.9a) at the posterior surface of the lens; hence these fiber cells as well as the epithelial cells appear to utilize Na /H exchange.
D I S C U S S I O N
To summarize, we have shown that gap junctions connecting peripheral fiber cells are different from those connecting inner fiber cells. The differences we observe are in pH sensitivity and in the average cell to cell coupling resistance.
A rather abrupt change in the cell to cell resistance occurs in a zone that is between 650 and 500 I~m from the lens surface (r -- 0.7a to 0.6a in these small lenses, where a = 0.16 cm). The effective intracellular resistivity Ri is on average 3,500 ~ c m in cells peripheral to this zone and 9,000 l~cm in the interior cells. The cell to cell resistance in a unit area of membrane can be calculated by multiplying R~ by the average cell width (~ 3 I~m for fiber cells). The cell to cell resistance thus calculated varies with radial location from 1.1 to 2.7 l'Icm ~, so all of the cells are exceptionally well coupled. The change in cell to cell resistance could be due to a change in the density of junctions, a change in the number of open channels per junction, or a change in the single channel conductance. The last two possibilities require some modification of protein structure or state within the junctions. Moreover, the dramatic loss of pH sensitivity in roughly the same zone cannot be attributed to a simple change in the number of junctions. Rae, Thomson, and Eisenberg (1982) also found that dinitro- phenol caused uncoupling of fiber cells peripheral to this zone but not inside it. A hypothesis consistent with all of these observations is that the peripheral differenti- ating fiber cells synthesize the gap junctional proteins that connect peripheral fiber ceils. These junctions are internalized as the lens grows and ages and the protein structure is modified by this process. The modified proteins form higher resistance gap junctions, which do not close during acidification. This modification is essential
Dow
nloaded from http://rupress.org/jgp/article-pdf/98/6/1085/1249981/1085.pdf by guest on 21 N
ovember 2021

MATHIAS ET AL. Cell Communication and p H in the Lens 1101
to the survival of inner cells since the physiological mechanism of handling hydrogen ion balance cannot keep the inner cells at neutral pH.
Hydrogen ions are transported out of the lens across the membranes of surface epithelial and differentiating fiber cells. We do not know all of the transport mechanisms but, at a minimum, sodium-hydrogen exchange appears to be utilized. The transport mechanisms must be energy dependent because they maintain internal hydrogen well out of electrochemical equilibrium. The transmembrane electrochem- ical gradient for hydrogen, 0i - +~ - EH, equals about - 5 0 mV near the surface (r = 0.9a; ~ = - 7 2 mV; t~e = 0; EH = --22 mV). The electrochemical gradient across inner fiber cell membranes is not known since pH, in the extracellular spaces between fiber cells has not been measured; however, as described below, we can be reasonably certain that hydrogen is out of equilibrium by at least - 2 7 mV.
Our view of the handling of hydrogen by the lens can be visualized by looking at Fig. 1. Hydrogen leaks into the lens cells through gm and Gs down its electrochemical gradient. Hydrogen is also produced in the fiber cells (the Ri compartment) as a byproduct of anaerobic metabolism (Bassnett, Croghan, and Duncan, 1987). The change in electrochemical potential for hydrogen between cells at r = 0.3a to r = 0.9a is 22 mV (t~i[0.3a ] = - 6 2 mV; t~i[0.9a ] = - 7 2 mV; ApH i = 0.21). A flux of hydrogen moves down this gradient from inner cells through gap junctions to surface cells where it is extruded. If hydrogen is moving into fiber cells through gm, then there must be a flux of hydrogen along the extracellular clefts (Re in Fig. 1), moving from the surface toward the center. We can bound the value of pile by considering two limiting situations: (1) Assume that metabolic production of hydrogen is zero so the intracellular flux from center to surface is equal and opposite to the extracellular flux. The value of Re is about five times greater than Ri; hence, the extracellular gradient would have to be about five times greater than the intracellular. The electrochemical potential for extraceUular hydrogen at r = 0.3a would therefore have to be - 1 1 0 mV with respect to the bath. From other studies (Mathias and Rae, 1985) we know that +e(0.3a) = - 3 0 mV, so pHe would have to be ~8.8. However, the t ransmembrane electrochemical gradient becomes outward for pile greater than ~ 7.4, which is contrary to our initial assumption, so the intracellular flux from central to peripheral fiber cells must be partially due to metabolic production of hydrogen. (2) Assume that the intracellular flux of hydrogen is entirely due to metabolic production so there is no flux along the extracellular spaces. Hydrogen would then have to be in equilibrium with d)e, so at r -- 0.3a, t~ e = - 3 0 mV implies that pile is ~ 6.9. However, in this situation the t ransmembrane gradient at r = 0.3a is not zero; rather, it is about - 2 7 mV, which should cause a t ransmembrane flux contrary to our initial assumption. We can therefore assume that pile at r = 0.3a is greater than 6.9 but less than 7.4. We also conclude that metabolic production and a t ransmembrane flux of hydrogen both contribute significantly to the observed intracellular gradient.
One issue not addressed by this study is the angular variation in the electrical properties of the lens. As mentioned earlier, the lens is symmetric about an axis that goes from the posterior pole through the center to the anterior pole. However, the anterior surface consists of a layer of epithelial cells, whereas the posterior surface consists of foot-like projections at the ends of differentiating fiber cells. The value of
Dow
nloaded from http://rupress.org/jgp/article-pdf/98/6/1085/1249981/1085.pdf by guest on 21 N
ovember 2021

1102 THE JOURNAL OF GENERAL PHYSIOLOGY • VOLUME 98" 1991
surface m e m b r a n e c o n d u c t a n c e we r e p o r t is t he ave r age o f the a n t e r i o r a n d p o s t e r i o r
values. P re l imina ry s tudies o n the rat lens r e p o r t e d in abs t rac t f o r m (Baldo, Mathias ,
a n d H a g s t r o m , 1990) f o u n d that the gap j u n c t i o n a l res i s tance c o u p l i n g p e r i p h e r a l
cells at t he e q u a t o r is m u c h lower than at e i t h e r pole . T h e s tudies r e p o r t e d h e r e
m e a s u r e d R~ halfway b e t w e e n the p o l e a n d equa to r , which is whe re it takes on a va lue
equa l to its a n g u l a r ave rage . We a re cu r ren t ly w o r k i n g on a quan t i t a t ive desc r ip t ion
o f b o t h the a n g u l a r a n d radia l d e p e n d e n c e o f R~ in the rat lens, bu t t he theore t i ca l
analysis is m u c h m o r e c o m p l e x than tha t p r e s e n t e d here .
We would like to thank Dr. George Baldo for critically reading a preliminary version of this paper and for his help in producing the figures. We also thank Nancy McCaffrey for preparing the typescript.
The work was supported by NIH grants EY-06391, EY-03282, and EY-06005.
Original version received 25 March 1991 and accepted version received 23 August 1991.
R E F E R E N C E S
Baldo, G. J., R. T. Mathias, and T. Hagstrom. 1990. Gap junctional coupling in the rat lens. Investigative Ophthalmology & Visual Science. 31:363a. (Abstr.)
Bashford, C. L. 1990. Electroneutral transport and exchange. In Monovalent Cations in Biological Systems. C. A. Pasternak, editor. CRC Press, Inc., Boca Raton, FL. 103-116.
Bassnett, S. 1990. Intracellular pH regulation in the embryonic chicken lens epithelium. Journal of Physiology. 431:445-464.
Bassnett, S., P. C. Croghan, and G. Duncan. 1987. Diffusion of lactate and its role in determining intracetlular pH in the lens of the eye. Experimental Eye Research. 44:143-147.
Bassnett, S., and G. Duncan. 1985. Direct measurement of pH in the rat lens by ion-sensitive microelectrodes. Experimental Eye Research. 40:585-590.
Candia, O. A., P. J. Bentley, and C. D. Mills. 1971a Short-circuit current and active Na transport across isolated lens of the toad. American Journal of Physiology. 220:558-564.
Candia, O. A., P.J. Bentley, C. D. Mills, and H. Toyofuku. 1971b. Asymmetrical distribution of the potential differences in toad lens. Nature. 227:852-853.
Dresdner, K. P., Jr, R. P. Kline, and A. Witt. 1989. Intracellular pH of canine subendocardial Purkinje cells surviving in l-day-old myocardial infarcts. Circulation Research. 65:554-565.
Eisenberg, R. S., V. Barcilon, and R. T. Mathias. 1979. Electrical properties of spherical syncytia.
Biophysical Journal. 25:151-181. Jacob, T. J. C. 1983. Raised intracellular free calcium within the lens causes opacification and cellular
uncoupling in the frog.Journal of Physiology. 341:595-601. Kinsey, V. E., and D. V. N. Reddy. 1965. Studies of the crystalline lens XI. The relative role of the
epithelium and capsule in transport. Investigative Ophthalmology & Visual Science. 4:104-116. Kistler, J., and S. Bullivant. 1987. Protein processing in lens intercellular junctions: cleavage of MP70
to MP38. Investigative Ophthalmology & Visual Science. 28:1687-1692. Kuszak, J. R., M. S. Macsai, K.J. Bloom, J. L. Rae, and R. S. Weinstein. 1985. Ceil-to-cell fusion of
lens fiber cells in situ: correlative light, scanning electron microscopic and freeze-fracture studies. Journal of Ultrastructure and Molecular Structure Research. 93:144-160.
Lo, W., and C. V. Harding. 1986. Structure and distribution of gap junctions in lens epithelium and fiber cells. Cellular and Tissue Research. 244:253-263.
Mathias, R. T. 1985. Steady state voltages, ion fluxes and volume regulation in syncytial tissues. Biophysical Journal. 48:435--448.
Dow
nloaded from http://rupress.org/jgp/article-pdf/98/6/1085/1249981/1085.pdf by guest on 21 N
ovember 2021

MATHIAS ET AL. Cell Communication and pH in the Lens 1103
Mathias, R. T., and J. L. Rae. 1985. Transport properties of the lens. American Journal of Physiology. 249 (Cell Physiology 18): C181-C190.
Mathias, R. T., and J. L. Rae. 1986. Modulation of electrical coupling between cells of the lens. Biophysical Journal. 49:202a. (Abstr).
Mathias, R. T., and J. L. Rae. 1989. Cell to cell communication in the lens. In Cell Interactions and Gap Junctions. Vol. 1. N. Sperelakis and W. C. Cole, editors. CRC Press, Inc., Boca Raton, FL.
29-50.
Mathias, R. T., J. L. Rae, E. Ebihara, and R. T. McCarthy. 1985. The localization of transport properties in the frog lens. Biophysical Journal. 48:423-434.
Mathias, R. T., J. L. Rae, and R. S. Eisenberg. 1979. Electrical properties of structural components of
the crystalline lens. Biophysical Journal. 25:181-201. Mathias, R. T., J. L. Rae, and R. S. Eisenberg. 1981. The lens as a nonuniform spherical syncytium.
Biophysical Journal. 34:61-83.
Mathias, R. T., G. Riquelme, and J. L. Rae. 1988. Measurement of intracellular pH in the frog lens and its effect on intercellular communication. Biophysical Journal. 53:52a. (Abstr.)
Munoz, J. L., F. Deyhimi, and J. A. Coles. 1983. Silanization of glass in the making of ion selective
microelectrodes. Journal of Neuroscience Methods. 8:231-247. Parmelee, J. T. 1986. Measurement of steady currents around the frog lens. Experimental Eye Research.
42:433-441.
Paterson, C. A. 1972. Distribution and movement of ions in the ocular lens. Documenta Ophthalmolog- ica. 31:1-28.
Paterson, C. A. 1973. Anteroposterior cation gradients in bovine lenses. Investigative Ophthalmology & Visual Science. 12:861-863.
Rae, J. L., R. D. Thomson, and R. S. Eisenberg. 1982. The effect of 2-4 dinitrophenol on cell to cell communication in the frog lens. Experimental Eye Research. 35:597-609.
Robinson, K. R., and J. w. Patterson. 1983. Localization of steady currents in the lens. Current Eye Research. 12:843-847.
Takemoto, L., M. Takehana, and J. Horwitz. 1986. Covalent changes in MIP26K during aging of the
human lens membrane. Investigative Ophthalmology & Visual Science. 27:443-446.
Wolosin, J., L. Alvarez, and O. Candia. 1988. Cellular pH and Na÷-H ÷ exchange activity in lens
epithelium of Bufo marinus toad. American Journal of Physiology. 255:C595-C602. Wolosin, J., L. Alvarez, and O. Candia. 1990. HCO~ transport in the toad lens epithelium is mediated
by electronegative Na+-dependent symport. American Journal of Physiology. 258:C855-C861.
Ye, J., and J. A. Zadunaisky. 1990. Na/H exchanger and stimulatory effect of EGF on lens fiber and epithelial membrane vesicles studied with fluorescent dyes. Investigative Ophthalmology & Visual Science. 31:442a. (Abstr.)
Dow
nloaded from http://rupress.org/jgp/article-pdf/98/6/1085/1249981/1085.pdf by guest on 21 N
ovember 2021