新生銀行 東証: 8303) shinsei bank (tse: 8303)...新生銀行(東証: 8303) shinsei bank (tse:...
TRANSCRIPT

新生銀行(東証: 8303)Shinsei Bank (TSE: 8303)
四半期データブック 2019年12月末
Quarterly Data Book for the Fiscal Year Ended December 31, 2019

目次 頁 Contents PageSection 1. 新生銀行 連結財務関連データ 1 Section 1. Shinsei Bank Consolidated P/L and B/S Data 1
財務の概要 1 Results of Operations 1業務粗利益 1 Total Revenue 1経費 1 General and Administrative Expenses 1与信関連費用 1 Net Credit Costs 1のれん及び無形資産償却額 1 Amortization of Goodwill and Other Intangible Assets 1その他利益 1 Other Gains 1非支配株主に帰属する四半期純利益 1 Profit Attributable to Noncontrolling Interests 1
資金運用/調達(リース・割賦売掛金を含む)の状況 (平均残高) 2 Interest-Earning Assets and Interest-Bearing Liabilities (Average Balance) 2資金運用/調達(リース・割賦売掛金を含む)の状況 (利息) 3 Interest-Earning Assets and Interest-Bearing Liabilities (Interest) 3資金運用/調達(リース・割賦売掛金を含む)の状況 (利回り(%)) 4 Interest-Earning Assets and Interest-Bearing Liabilities (Yield/Rate (%)) 4資金調達内訳 4 Overall Funding Composition 4連結貸借対照表 5 Consolidated Balance Sheets 5連結損益計算書 6 Consolidated Statements of Income 6連結包括利益計算書 6 Consolidated Statements of Comprehensive Income 6買入金銭債権 7 Other Monetary Claims Purchased 7金銭の信託 7 Monetary Asset Held in Trust 7有価証券 7 Securities 7有価証券保有区分別残高 7 Securities by Category 7業種別貸出内訳 8 Loans by Borrower Industry 8無形固定資産 8 Intangible Assets 8繰越欠損金(納税主体ベース) 8 Tax Loss Carryforwards (Taxable Entity Basis) 81株当たり配当金(円) 8 Dividends Per Share (JPY) 8リスク管理債権 9 Risk Monitored Loans 9子会社別連結リスク管理債権 9 Consolidated Risk Monitored Loans by Subsidiary 9貸倒引当金 9 Reserve for Credit Losses 9預金期末残高 9 Deposits and Negotiable Certificates of Deposits (NCDs) 9
Section 2. 新生銀行 連結セグメント別データ 10 Section 2. Shinsei Bank Consolidated Business Line Data 10Section 2.1 セグメント別業務粗利益 10 Section 2.1 Business Line Total Revenue 10法人業務 業務粗利益 10 Institutional Business Total Revenue 10個人業務 業務粗利益 10 Individual Business Total Revenue 10経営勘定/その他 業務粗利益 11 Corporate/Other Total Revenue 11経費 11 General and Administrative Expenses 11実質業務純益 11 Ordinary Business Profit 11与信関連費用 12 Net Credit Costs 12与信関連費用加算後 実質業務純益 12 Ordinary Business Profit after Net Credit Costs 12
Section 2.2 セグメント別主要データ 13 Section 2.2 Business Line Key Data 13法人業務 営業性資産 13 Institutional Business Operating Assets 13個人業務 営業性資産、負債 13 Individual Business Operating Assets and Liabilities 13

財務比率 14 Financial Ratios 14自己資本関連情報(バーゼルⅢ、国内基準) 14 Capital Adequacy Data (Basel Ⅲ, Domestic Standard) 14参考情報 14 Reference 141株当たり数値(円) 14 Per Share Data (JPY) 14株式数 14 Share Data 14格付け(新生銀行) 15 Credit Ratings (Shinsei Bank) 15格付け(昭和リース) 15 Credit Ratings (Showa Leasing) 15格付け(新生証券) 15 Credit Ratings (Shinsei Securities) 15格付け(アプラスフィナンシャル) 15 Credit Ratings (APLUS FINANCIAL) 15格付け(新生フィナンシャル) 15 Credit Ratings (Shinsei Financial) 15連結対象会社数 16 Subsidiaries and Affiliates Data 16その他主要データ 16 Other Key Data 16
Section 4. 無担保ローン事業主要計数 17 Section 4.Unsecured Loan Business Data 17レイク事業主要計数 Lake Business Summary of Major Business Information無担保ローン(レイク事業) 17 Unsecured Personal Loan (Lake Business) 17店舗・チャネル(レイク事業) 17 Number of Branches and Channels (Lake Business) 17年齢別残高構成比(レイク事業) 17 Balance by Age (Lake Business) 17性別、既婚・未婚別残高構成比(レイク事業) 17 Balance by Gender and Marital Status (Lake Business) 17実行残高別残高構成比(レイク事業) 17 Balance by Amount of Origination (Lake Business) 17年収別残高構成比(レイク事業) 17 Balance by Annual Income (Lake Business) 17貸出金利帯別残高(レイク事業) 18 Breakdown of Loans by Lending Rates (Lake Business) 18債務者区分別残高(レイク事業) 18 Balance by Obligor Classification (Lake Business) 18
ノーローン主要計数 19 NOLOAN Summary of Major Business Information 19無担保ローン(ノーローン) 19 Unsecured Loans (NOLOAN) 19成約率(ノーローン) 19 Approval Rate (NOLOAN) 19店舗・チャネル(ノーローン) 19 Number of Branches and Channels (NOLOAN) 19貸出金利帯別残高(ノーローン) 19 Balance by Obligor Classification (NOLOAN) 19年齢別残高構成比(ノーローン) 20 Balance by Age (NOLOAN) 20性別、既婚・未婚別残高構成比(ノーローン) 20 Balance by Gender and Marital Status (NOLOAN) 20実行残高別残高構成比(ノーローン) 20 Balance by Amount of Origination (NOLOAN) 20年収別残高構成比(ノーローン) 20 Balance by Annual Income (NOLOAN) 20
利息返還関連 21 Grey Zone Related Information 21利息返還関連(新生フィナンシャル) 21 Grey Zone Related Information (Shinsei Financial) 21利息返還関連(ノーローン) 21 Grey Zone Related Information (NOLOAN) 21利息返還関連(アプラスフィナンシャル) 21 Grey Zone Related Information (APLUS FINANCIAL) 21
Section 5. 主要子会社の財務データ他 22 Section 5. Subsidiaries' Financial and Business Data 22新生フィナンシャルの、銀行の勘定科目体系に組替後の、連結損益計算書、 22 Shinsei Financial Consolidated P/L and B/S Data, after reclassification to 22貸借対照表データ(新生銀行への連結会計処理前) conform to Bank's Financial Statements, before Consolidating to Shinsei Bank
連結損益計算書 22 Consolidated Statements of Income 22連結貸借対照表 22 Consolidated Balance Sheets 22
Section 3. 連結財務諸比率、自己資本、1株当たり数値、格付け情報他 14 Section 3. Shinsei Bank Consolidated Financial Ratios, Capital Adequacy and Per ShareData, and Credit Ratings 14

株式会社アプラスフィナンシャルの、銀行の勘定科目体系に組替後の、
連結損益計算書、貸借対照表データ(新生銀行への連結会計処理前)
連結損益計算書 23 Consolidated Statements of Income 23連結貸借対照表 23 Consolidated Balance Sheets 23アプラスフィナンシャル開示の連結データ 24 APLUS FINANCIAL Consolidated Data Disclosure 24連結損益の概要 24 Summary of Income Statement 24営業債権残高 25 Account Receivables 25顧客数 25 Number of Customers (Thousands) 25店舗・チャネル 25 Number of Branches and Channels 25平均貸出金利 25 Average Lending Rates 25融資残高内訳 26 Breakdown of Loan Receivables 26延滞残高、比率 26 Balance and Ratio of Delinquent Unsecured Personal Loans 26加重平均借入金利 26 Weighted Average Funding Rate 261口座あたり残高(千円) 26 Credit Outstanding Per Account (Thousands of Yen) 26年齢別残高構成比 26 Balance by Age 26性別残高構成比 26 Balance by Gender 26実行残高別残高構成比 26 Balance by Amount of Origination 26
昭和リース株式会社の、銀行の勘定科目体系に組替後の、連結損益計算書、
貸借対照表データ(新生銀行への連結会計処理前)
連結損益計算書 27 Consolidated Statements of Income 27連結貸借対照表 27 Consolidated Balance Sheets 27
Section 6. 新生銀行 単体財務関連データ 28 Section 6. Shinsei Bank Nonconsolidated P/L and B/S Data 28単体損益の概要 28 Results of Operations (Nonconsolidated) 28単体損益計算書 28 Nonconsolidated Statements of Operations 28与信関連費用 (単体) 28 Net Credit Costs (Nonconsolidated) 28資金運用/調達の状況(平均残高)(単体) 29 29資金運用/調達の状況(利息)(単体) 29 29資金運用/調達の状況(利回り(%))(単体) 29 29単体貸借対照表 30 Nonconsolidated Balance Sheets 30リスク管理債権(単体) 31 Risk Monitored Loans (Nonconsolidated) 31業種別貸出残高(単体) 31 Loans by Borrower Industry (Nonconsolidated) 31業種別リスク管理債権残高(単体) 32 Risk Monitored Loans by Borrower Industry (Nonconsolidated) 32
Coverage Ratios for Non-Performing Claims Disclosed under the Financial Revitalization Law (Nonconsolidated)
貸倒引当金(単体) 32 Reserve for Credit Losses (Nonconsolidated) 32債務者区分別の引当率(単体) 33 Reserve Ratios for Borrowers' Category (Nonconsolidated) 33
(参考) 33 (Reference) 33換算為替レート 33 Exchange Rate Information 33
APLUS FINANCIAL Consolidated P/L and B/S Data, after reclassification to conform toBank's Financial Statements, before Consolidating to Shinsei Bank
Showa Leasing Consolidated P/L and B/S Data, after reclassification to conform toBank's Financial Statements, before Consolidating to Shinsei Bank
23
3232金融再生法の開示基準に基づく債権と保全率(単体)
Interest-Earning Assets and Interest-Bearing Liabilities (Yield/Rate (%)) (Nonconsolidated)
23
27 27
Interest-Earning Assets and Interest-Bearing Liabilities (Average Balance) (Nonconsolidated)Interest-Earning Assets and Interest-Bearing Liabilities (Interest) (Nonconsolidated)
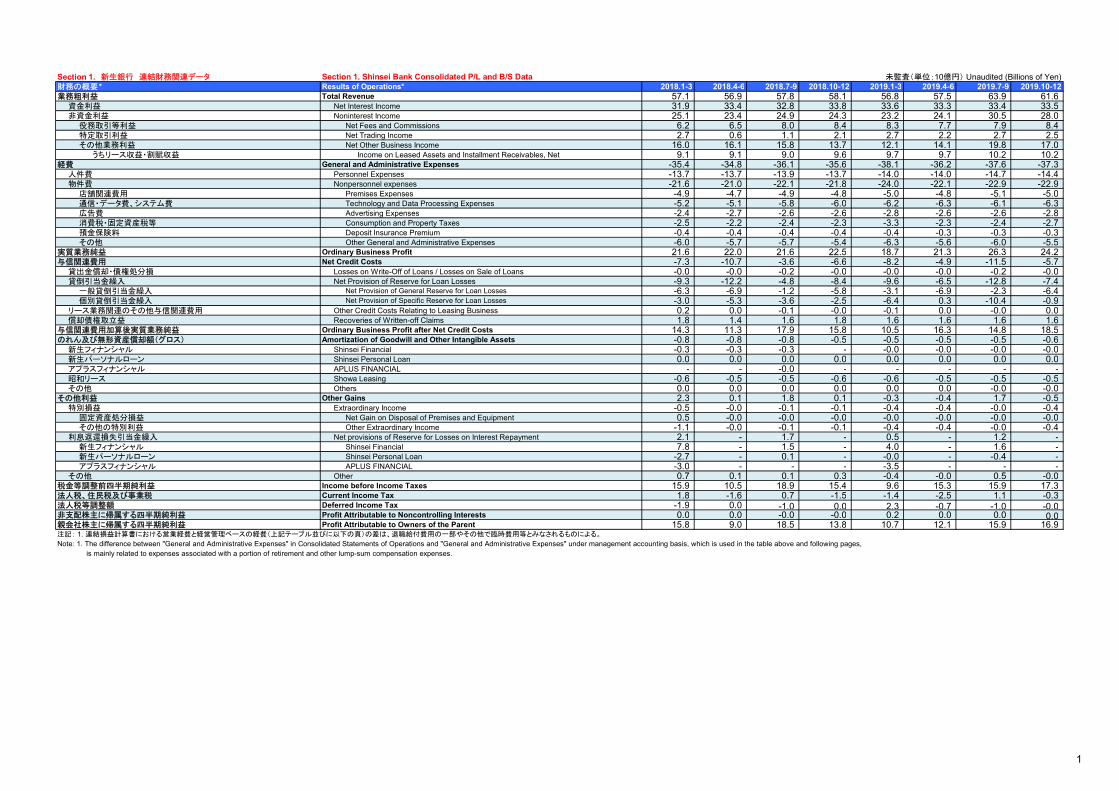
Section 1. 新生銀行 連結財務関連データ Section 1. Shinsei Bank Consolidated P/L and B/S Data 未監査(単位:10億円) Unaudited (Billions of Yen)財務の概要* Results of Operations* 2018.1-3 2018.4-6 2018.7-9 2018.10-12 2019.1-3 2019.4-6 2019.7-9 2019.10-12業務粗利益 Total Revenue 57.1 56.9 57.8 58.1 56.8 57.5 63.9 61.6
資金利益 Net Interest Income 31.9 33.4 32.8 33.8 33.6 33.3 33.4 33.5 非資金利益 Noninterest Income 25.1 23.4 24.9 24.3 23.2 24.1 30.5 28.0
役務取引等利益 Net Fees and Commissions 6.2 6.5 8.0 8.4 8.3 7.7 7.9 8.4 特定取引利益 Net Trading Income 2.7 0.6 1.1 2.1 2.7 2.2 2.7 2.5 その他業務利益 Net Other Business Income 16.0 16.1 15.8 13.7 12.1 14.1 19.8 17.0
うちリース収益・割賦収益 Income on Leased Assets and Installment Receivables, Net 9.1 9.1 9.0 9.6 9.7 9.7 10.2 10.2 経費 General and Administrative Expenses -35.4 -34.8 -36.1 -35.6 -38.1 -36.2 -37.6 -37.3
人件費 Personnel Expenses -13.7 -13.7 -13.9 -13.7 -14.0 -14.0 -14.7 -14.4 物件費 Nonpersonnel expenses -21.6 -21.0 -22.1 -21.8 -24.0 -22.1 -22.9 -22.9
店舗関連費用 Premises Expenses -4.9 -4.7 -4.9 -4.8 -5.0 -4.8 -5.1 -5.0 通信・データ費、システム費 Technology and Data Processing Expenses -5.2 -5.1 -5.8 -6.0 -6.2 -6.3 -6.1 -6.3 広告費 Advertising Expenses -2.4 -2.7 -2.6 -2.6 -2.8 -2.6 -2.6 -2.8 消費税・固定資産税等 Consumption and Property Taxes -2.5 -2.2 -2.4 -2.3 -3.3 -2.3 -2.4 -2.7 預金保険料 Deposit Insurance Premium -0.4 -0.4 -0.4 -0.4 -0.4 -0.3 -0.3 -0.3 その他 Other General and Administrative Expenses -6.0 -5.7 -5.7 -5.4 -6.3 -5.6 -6.0 -5.5
実質業務純益 Ordinary Business Profit 21.6 22.0 21.6 22.5 18.7 21.3 26.3 24.2 与信関連費用 Net Credit Costs -7.3 -10.7 -3.6 -6.6 -8.2 -4.9 -11.5 -5.7
貸出金償却・債権処分損 Losses on Write-Off of Loans / Losses on Sale of Loans -0.0 -0.0 -0.2 -0.0 -0.0 -0.0 -0.2 -0.0 貸倒引当金繰入 Net Provision of Reserve for Loan Losses -9.3 -12.2 -4.8 -8.4 -9.6 -6.5 -12.8 -7.4
一般貸倒引当金繰入 Net Provision of General Reserve for Loan Losses -6.3 -6.9 -1.2 -5.8 -3.1 -6.9 -2.3 -6.4 個別貸倒引当金繰入 Net Provision of Specific Reserve for Loan Losses -3.0 -5.3 -3.6 -2.5 -6.4 0.3 -10.4 -0.9
リース業務関連のその他与信関連費用 Other Credit Costs Relating to Leasing Business 0.2 0.0 -0.1 -0.0 -0.1 0.0 -0.0 0.0 償却債権取立益 Recoveries of Written-off Claims 1.8 1.4 1.6 1.8 1.6 1.6 1.6 1.6
与信関連費用加算後実質業務純益 Ordinary Business Profit after Net Credit Costs 14.3 11.3 17.9 15.8 10.5 16.3 14.8 18.5 のれん及び無形資産償却額(グロス) Amortization of Goodwill and Other Intangible Assets -0.8 -0.8 -0.8 -0.5 -0.5 -0.5 -0.5 -0.6
新生フィナンシャル Shinsei Financial -0.3 -0.3 -0.3 - -0.0 -0.0 -0.0 -0.0 新生パーソナルローン Shinsei Personal Loan 0.0 0.0 0.0 0.0 0.0 0.0 0.0 0.0
アプラスフィナンシャル APLUS FINANCIAL - - -0.0 - - - - - 昭和リース Showa Leasing -0.6 -0.5 -0.5 -0.6 -0.6 -0.5 -0.5 -0.5 その他 Others 0.0 0.0 0.0 0.0 0.0 0.0 -0.0 -0.0
その他利益 Other Gains 2.3 0.1 1.8 0.1 -0.3 -0.4 1.7 -0.5 特別損益 Extraordinary Income -0.5 -0.0 -0.1 -0.1 -0.4 -0.4 -0.0 -0.4
固定資産処分損益 Net Gain on Disposal of Premises and Equipment 0.5 -0.0 -0.0 -0.0 -0.0 -0.0 -0.0 -0.0 その他の特別利益 Other Extraordinary Income -1.1 -0.0 -0.1 -0.1 -0.4 -0.4 -0.0 -0.4
利息返還損失引当金繰入 Net provisions of Reserve for Losses on Interest Repayment 2.1 - 1.7 - 0.5 - 1.2 - 新生フィナンシャル Shinsei Financial 7.8 - 1.5 - 4.0 - 1.6 - 新生パーソナルローン Shinsei Personal Loan -2.7 - 0.1 - -0.0 - -0.4 -
アプラスフィナンシャル APLUS FINANCIAL -3.0 - - - -3.5 - - - その他 Other 0.7 0.1 0.1 0.3 -0.4 -0.0 0.5 -0.0
税金等調整前四半期純利益 Income before Income Taxes 15.9 10.5 18.9 15.4 9.6 15.3 15.9 17.3 法人税、住民税及び事業税 Current Income Tax 1.8 -1.6 0.7 -1.5 -1.4 -2.5 1.1 -0.3 法人税等調整額 Deferred Income Tax -1.9 0.0 -1.0 0.0 2.3 -0.7 -1.0 -0.0 非支配株主に帰属する四半期純利益 Profit Attributable to Noncontrolling Interests 0.0 0.0 -0.0 -0.0 0.2 0.0 0.0 0.0 親会社株主に帰属する四半期純利益 Profit Attributable to Owners of the Parent 15.8 9.0 18.5 13.8 10.7 12.1 15.9 16.9 注記: 1. 連結損益計算書における営業経費と経営管理ベースの経費(上記テーブル並びに以下の頁)の差は、退職給付費用の一部やその他で臨時費用等とみなされるものによる。
Note: 1. The difference between "General and Administrative Expenses" in Consolidated Statements of Operations and "General and Administrative Expenses" under management accounting basis, which is used in the table above and following pages, is mainly related to expenses associated with a portion of retirement and other lump-sum compensation expenses.
1

未監査(単位:10億円) Unaudited (Billions of Yen)資金運用/調達(リース・割賦売掛金を含む)の状況 Interest-Earning Assets and Interest-Bearing Liabilities 2018.1-3 2018.4-6 2018.7-9 2018.10-12 2019.1-3 2019.4-6 2019.7-9 2019.10-12 (平均残高)* (Average Balance)*資金運用勘定: Interest-Earning Assets: 貸出金 Loans and Bills Discounted 4,883.3 4,915.4 4,926.8 4,896.1 5,080.0 4,976.9 4,988.1 5,172.6 リース債権およびリース投資資産・割賦売掛金 Leased Assets and Installment Receivables 748.2 751.0 741.6 744.1 748.8 780.1 782.9 884.0 有価証券 Securities 1,101.7 1,151.6 1,200.7 1,134.8 1,115.2 1,093.0 1,037.2 1,043.7 その他資金運用勘定 Other Interest-Earning Assets 141.3 161.2 197.8 210.2 191.0 225.8 261.5 249.1 資金運用勘定合計 (A) Total Interest-Earning Assets (A) 6,874.6 6,979.3 7,067.1 6,985.4 7,135.1 7,075.9 7,069.9 7,349.6 資金調達勘定: Interest-Bearing Liabilities: 預金・譲渡性預金 Deposits, including Negotiable Certificates of Deposit 5,976.5 6,068.1 6,075.9 6,015.2 5,972.7 5,843.9 5,817.6 6,088.4 借用金 Borrowed Money 738.6 755.7 709.4 848.3 832.7 752.9 688.5 734.9 劣後借入 Subordinated Debt 12.4 12.3 2.5 -0.0 0.0 - - - その他借用金 Other Borrowed Money 726.2 743.4 706.9 848.3 832.6 752.9 688.5 734.9 社債 Corporate Bonds 86.6 82.4 88.5 96.6 92.3 91.5 81.4 102.2 劣後社債 Subordinated Bonds 25.0 22.3 14.9 13.8 0.2 - - - その他社債 Other Corporate Bonds 61.5 60.0 73.5 82.7 92.1 91.5 81.4 102.2 その他資金調達勘定 Other Interest-Bearing Liabilities 739.8 833.6 895.6 896.5 831.0 1,150.8 1,229.6 1,202.1 資金調達勘定合計 (B) Total Interest-Bearing Liabilities (B) 7,541.6 7,740.0 7,769.6 7,856.7 7,728.8 7,839.2 7,817.2 8,127.7
非金利負債 Noninterest-Bearing Sources of Funds: ネット非金利負債(非金利資産) Noninterest-Bearing (Assets) Liabilities, Net -1,520.0 -1,617.5 -1,567.9 -1,748.0 -1,481.8 -1,659.0 -1,600.2 -1,687.3 純資産の部合計-非支配株主持分 Total Equity Excluding Noncontrolling Interest in Subsidiaries 852.9 856.9 865.4 876.8 888.0 895.7 852.9 909.1 非金利負債合計 (C) Total Noninterest-Bearing Sources of Funds (C) -667.0 -760.6 -702.5 -871.2 -593.7 -763.2 -747.2 -778.1
資金調達勘定・非金利負債合計 (D)=(B)+(C) 6,874.6 6,979.3 7,067.1 6,985.4 7,135.1 7,075.9 7,069.9 7,349.6
Ordinary Income Basis Interest Earning Assets 資金運用勘定合計 Total Balance of Interest-Earning Assets 6,874.6 6,979.3 7,067.1 6,985.4 7,135.1 7,075.9 7,069.9 7,349.6 差引:リース債権およびリース投資資産・割賦売掛金 Less: Leased Assets and Installment Receivables 748.2 751.0 741.6 744.1 748.8 780.1 782.9 884.0 経常収益ベース資金運用勘定 Ordinary Income Basis Interest Earning Assets 6,126.3 6,228.3 6,325.4 6,241.3 6,386.2 6,295.8 6,286.9 6,465.5 資金調達費用 Total Interest Expense - - - - - - - -資金利益 Net Interest Income - - - - - - - -注記: 1. 前期の数値については、有価証券の平均残高と利回りの訂正による修正を行っております。
2. 前期の数字は今期の表記に調整されています。
Note: 1. Previous period figures for average balance and yield are adjusted to conform to recalculation of the average balance of securities. 2. Previous periods have been adjusted to conform to current period presentation.
Sum of Total Interest-Bearing Liabilities and Total Noninterest-Bearing Sources ofFunds (D)=(B)+(C)
経常収益ベース資金運用勘定/収益への組み替えReconciliation of Total Interest-Earning Assets to
2

未監査(単位:10億円) Unaudited (Billions of Yen)資金運用/調達(リース・割賦売掛金を含む)の状況 Interest-Earning Assets and Interest-Bearing Liabilities 2018.1-3 2018.4-6 2018.7-9 2018.10-12 2019.1-3 2019.4-6 2019.7-9 2019.10-12(利息)* (Interest)*資金運用勘定: Interest-Earning Assets: 貸出金 Loans and Bills Discounted 33.8 34.6 35.0 35.1 35.4 35.0 35.1 35.3 リース債権およびリース投資資産・割賦売掛金 Leased Assets and Installment Receivables 9.1 9.1 9.0 9.6 9.7 9.7 10.2 10.2 有価証券 Securities 2.6 3.4 2.5 3.7 2.7 2.6 2.4 2.8 その他資金運用勘定 Other Interest-Earning Assets 0.5 0.5 0.4 0.5 0.5 0.7 0.7 0.6 資金運用勘定合計 (A) Interest Earned on Interest-Earning Assets (A) 46.0 47.7 47.0 49.0 48.4 48.0 48.6 49.0 資金調達勘定: Interest-Bearing Liabilities: 預金・譲渡性預金 Deposits, including Negotiable Certificates of Deposit 2.2 2.1 1.9 2.2 1.4 1.3 1.4 1.6 借用金 Borrowed Money 0.8 0.8 0.9 0.7 0.7 0.6 0.6 0.8 劣後借入 Subordinated Debt - 0.0 0.0 - - - - - その他借用金 Other Borrowed Money 0.7 0.8 0.8 0.7 0.7 0.6 0.6 0.8 社債 Corporate Bonds 0.1 0.1 0.1 0.1 0.0 0.0 0.0 0.0 劣後社債 Subordinated Bonds 0.1 0.1 0.0 0.0 - - - - その他社債 Other Corporate Bonds - 0.0 0.0 0.0 0.0 0.0 0.0 0.0 その他資金調達勘定 Other Interest-Bearing Liabilities 1.6 1.9 2.1 2.4 2.8 2.9 2.8 2.7 資金調達勘定合計 (B) Expense Incurred on Interest-Bearing Liabilities (B) 4.9 5.1 5.1 5.6 5.1 4.9 4.9 5.2 純資金利鞘(ネットインタレストマージン) (A)-(B) Net Interest Margin (A)-(B) 41.1 42.6 41.9 43.4 43.3 43.1 43.6 43.8 非金利負債 Noninterest-Bearing Sources of Funds: ネット非金利負債(非金利資産) Noninterest-Bearing (Assets) Liabilities, Net - - - - - - - - 純資産の部合計-非支配株主持分 Total Equity Excluding Noncontrolling Interest in Subsidiaries - - - - - - - -非金利負債合計 (C) Expense Incurred on Noninterest-Bearing Sources of Funds (C) - - - - - - - -
資金調達勘定・非金利負債合計 (D)=(B)+(C) 4.9 5.1 5.1 5.6 5.1 4.9 4.9 5.2
資金利益/資金運用利回り(リース・割賦売掛金を含む) (A)-(D) Interest Earned Less Expense Incurred (A)-(D) 41.1 42.6 41.9 43.4 43.3 43.1 43.6 43.8
Total Interest Income 資金運用勘定合計 Interest Earned on Interest-Earning Assets 46.0 47.7 47.0 49.0 48.4 48.0 48.6 49.0 差引:リース債権およびリース投資資産・割賦売掛金 Less: Leased Assets and Installment Receivables 9.1 9.1 9.0 9.6 9.7 9.7 10.2 10.2 経常収益ベース資金運用勘定 Ordinary Income Basis Interest Earned on Interest-Earning Assets 36.9 38.5 38.0 39.4 38.7 38.3 38.3 38.8 資金調達費用 Total Interest Expense 4.9 5.1 5.1 5.6 5.1 4.9 4.9 5.2 資金利益 Net Interest Income 31.9 33.4 32.8 33.8 33.6 33.3 33.4 33.5 注記: 1. 前期の数値については、有価証券の平均残高と利回りの訂正による修正を行っております。
2. 前期の数字は今期の表記に調整されています。
Note: 1. Previous period figures for average balance and yield are adjusted to conform to recalculation of the average balance of securities. 2. Previous periods have been adjusted to conform to current period presentation.
Sum of Expense Incurred on Interest-Bearing Liabilities and Expense Incurred onNoninterest-Bearing Sources of Funds (D)=(B)+(C)
経常収益ベース資金運用勘定/収益への組み替えReconciliation of Interest Earned on Interest-Earning Assets to
3

未監査(単位:10億円) Unaudited (Billions of Yen)資金運用/調達(リース・割賦売掛金を含む)の状況 Interest-Earning Assets and Interest-Bearing Liabilities 2018.1-3 2018.4-6 2018.7-9 2018.10-12 2019.1-3 2019.4-6 2019.7-9 2019.10-12(利回り(%))* (Yield/Rate (%))*資金運用勘定: Interest-Earning Assets: 貸出金 Loans and Bills Discounted 2.81 2.83 2.82 2.85 2.83 2.82 2.80 2.71 リース債権およびリース投資資産・割賦売掛金 Leased Assets and Installment Receivables 4.94 4.88 4.84 5.13 5.26 5.00 5.21 4.61 有価証券 Securities 0.96 1.19 0.84 1.33 1.01 0.96 0.96 1.09 その他資金運用勘定 Other Interest-Earning Assets *** *** *** *** *** *** *** ***資金運用勘定合計 (A) Yield on Interest-Earning Assets (A) 2.72 2.74 2.64 2.79 2.76 2.73 2.74 2.66資金調達勘定: Interest-Bearing Liabilities: 預金・譲渡性預金 Deposits, including Negotiable Certificates of Deposit 0.16 0.14 0.13 0.15 0.10 0.09 0.10 0.11 借用金 Borrowed Money 0.47 0.48 0.50 0.37 0.38 0.37 0.36 0.43 劣後借入 Subordinated Debt 2.37 2.37 2.39 0.00 - - - - その他借用金 Other Borrowed Money 0.43 0.44 0.50 0.37 0.38 0.37 0.36 0.43 社債 Corporate Bonds 0.89 0.84 0.53 0.47 0.27 0.26 0.26 0.26 劣後社債 Subordinated Bonds 2.20 2.14 1.69 1.67 - - - - その他社債 Other Corporate Bonds 0.36 0.36 0.30 0.27 0.27 0.26 0.26 0.26 その他資金調達勘定 Other Interest-Bearing Liabilities *** *** *** *** *** *** *** ***資金調達勘定合計 (B) Rate on Interest-Bearing Liabilities (B) 0.27 0.27 0.26 0.28 0.27 0.25 0.25 0.26純資金利鞘(ネットインタレストマージン) (A)-(B) Net Interest Margin (A)-(B) 2.45 2.47 2.38 2.50 2.49 2.47 2.48 2.40非金利負債 Noninterest-Bearing Sources of Funds: ネット非金利負債(非金利資産) Noninterest-Bearing (Assets) Liabilities, Net - - - - - - - - 純資産の部合計-非支配株主持分 Total Equity Excluding Noncontrolling Interest in Subsidiaries - - - - - - - -非金利負債合計 Rate on Noninterest-Bearing Sources of Funds - - - - - - - -
資金調達勘定・非金利負債合計 0.29 0.29 0.29 0.32 0.29 0.28 0.28 0.28
資金利益/資金運用利回り(リース・割賦売掛金を含む) Yield on Net Interest Income (Incl. Leased Assets and Installment Receivables) 2.42 2.45 2.35 2.47 2.47 2.44 2.46 2.37
Total Interest Income 資金運用勘定合計 Yield on Interest-Earning Assets 2.72 2.74 2.64 2.79 2.76 2.73 2.74 2.66 差引:リース債権およびリース投資資産・割賦売掛金 Less: Leased Assets and Installment Receivables 4.94 4.88 4.84 5.13 5.26 5.00 5.21 4.61経常収益ベース資金運用勘定 Ordinary Income Basis Yield on Interest-Earning Assets 2.45 2.48 2.39 2.51 2.46 2.44 2.43 2.39 資金調達費用 Total Interest Expense - - - - - - - -資金利益 Net Interest Income - - - - - - - -注記: 1. 前期の数値については、有価証券の平均残高と利回りの訂正による修正を行っております。
2. 前期の数字は今期の表記に調整されています。
Note: 1. Previous period figures for average balance and yield are adjusted to conform to recalculation of the average balance of securities. 2. Previous periods have been adjusted to conform to current period presentation.
資金調達内訳 * Overall Funding Composition* 2018.3 2018.6 2018.9 2018.12 2019.3 2019.6 2019.9 2019.12 顧客からの資金調達 Total Customer Based Funding 6,067.5 6,059.7 6,041.3 6,047.0 5,922.1 5,899.6 5,926.3 6,230.9 法人預金 Institutional Deposits 1,182.5 1,181.2 1,278.9 1,316.9 1,327.5 1,292.6 1,362.5 1,531.5 リテール預金 Retail Deposits 4,884.5 4,878.4 4,762.4 4,730.0 4,594.5 4,607.0 4,563.7 4,699.3 仕組預金 Structured Deposits 289.3 298.1 308.4 274.4 267.9 242.2 225.4 227.2 コールマネー及び売渡手形 Call Money - - 5.3 0.7 145.0 274.8 345.0 290.0 売現先勘定 Payables under Repurchase Agreements 55.9 51.8 64.3 42.7 59.0 33.5 39.2 36.4 債券貸借取引受入担保金 Collateral Related Securities Lending Transactions 433.4 463.1 542.0 504.6 510.2 454.3 454.9 430.8 コマーシャル・ペーパー Commercial Paper - - - - - - - - 借用金 Borrowed Money 739.5 712.9 700.2 688.7 684.0 644.9 679.5 692.5 社債及び短期社債 Corporate Bonds and Short-Term Corporate Bonds 260.7 268.9 281.2 304.6 283.3 320.3 311.8 390.9 資金調達内訳 Overall Funding Composition 7,557.2 7,556.6 7,634.6 7,589.1 7,604.3 7,628.5 7,757.6 8,072.5 注記: 1. 前期の数字は今期の表記に調整されています。
Note: 1. Previous periods have been adjusted to conform to current period presentation.
Sum of Rate on Interest-Bearing Liabilities and Rate on Noninterest-Bearing Sources ofFunds
経常収益ベース資金運用勘定/収益への組み替えReconciliation of Total Revenue on Interest-Earning Assets to
4

未監査(単位:10億円) Unaudited (Billions of Yen)連結貸借対照表 Consolidated Balance Sheets 2018.3 2018.6 2018.9 2018.12 2019.3 2019.6 2019.9 2019.12資産の部: Assets: 現金預け金 Cash and Due from Banks 1,465.6 1,505.7 1,396.7 1,360.5 1,355.9 1,373.4 1,309.1 1,452.8 コールローン及び買入手形 Call Loans and Bills Bought - - - - - - - - 買現先勘定 Receivables under Resale Agreements - - - - - - - - 債券貸借取引支払保証金 Receivables under Securities Borrowing Transactions 2.6 2.6 0.5 1.5 2.1 2.1 1.6 1.0 買入金銭債権 Other Monetary Claims Purchased 36.3 32.4 29.4 29.6 30.9 74.8 74.6 70.2 特定取引資産 Trading Assets 205.2 202.8 188.5 192.3 204.4 234.8 226.4 183.2 金銭の信託 Monetary Assets Held in Trust 234.9 255.2 267.5 274.9 305.8 314.0 346.5 428.8 有価証券 Securities 1,123.5 1,121.6 1,217.5 1,118.6 1,130.2 1,065.7 1,053.0 981.0 貸出金 Loans and Bills Discounted 4,895.9 4,846.7 4,877.0 4,943.4 4,986.8 4,921.1 5,002.6 5,119.7 外国為替 Foreign Exchanges 32.5 22.5 33.4 30.2 29.5 32.2 55.6 50.3 リース債権及びリース投資資産 Lease Receivables and Leased Investment Assets 171.4 164.6 159.2 178.1 176.5 175.2 197.7 193.8 その他資産 Other Assets 856.2 849.8 900.5 920.1 851.2 937.9 1,010.2 1,062.0 割賦売掛金 Installment Receivables 558.8 556.2 549.3 563.3 562.2 566.9 626.6 653.9 有形固定資産 Premises and Equipment 50.2 47.3 47.6 46.0 45.3 44.9 68.2 69.4 有形リース資産 Tangible Leased Assets as Lessor 27.9 26.0 26.1 25.2 24.4 23.7 47.6 47.4 無形固定資産 Intangible Assets 59.4 68.2 67.0 67.3 67.1 66.5 67.5 66.4 のれん Goodwill 11.9 11.2 10.6 10.4 10.9 11.4 11.4 10.9 無形資産 Intangible Assets Acquired in Business Combinations 1.2 1.0 0.8 0.7 0.6 0.6 2.6 2.5 退職給付に係る資産 Assets for Retirement Benefits 13.2 14.0 14.3 14.5 10.9 11.0 11.2 11.3 繰延税金資産 Deferred Tax Assets 14.7 15.0 14.3 14.5 15.0 13.7 12.6 13.8 支払承諾見返 Customers' Liabilities for Acceptances and Guarantees 395.3 408.2 422.1 441.4 456.7 481.4 501.9 507.0 貸倒引当金 Reserve for Credit Losses -100.8 -103.5 -100.7 -101.1 -98.0 -95.2 -98.5 -98.0 資産の部合計 Total Assets 9,456.6 9,453.8 9,535.5 9,532.4 9,571.1 9,654.0 9,840.7 10,113.5 負債及び純資産の部 Liabilities and Equity負債の部: Liabilities: 預金 Deposits 5,628.1 5,617.4 5,561.5 5,524.8 5,351.5 5,394.4 5,437.8 5,763.9 譲渡性預金 Negotiable Certificates of Deposit 438.9 442.2 479.7 522.1 570.5 505.1 488.5 466.9 債券 Debentures 0.4 - - - - - - - コールマネー及び売渡手形 Call Money and Bills Sold - - 5.3 0.7 145.0 274.8 345.0 290.0 売現先勘定 Payables under Repurchase Agreements 55.9 51.8 64.3 42.7 59.0 33.5 39.2 36.4 債券貸借取引受入担保金 Payables under Securities Lending Transactions 433.4 463.1 542.0 504.6 510.2 454.3 454.9 430.8 特定取引負債 Trading Liabilities 184.5 179.9 166.4 171.1 182.3 193.2 200.6 163.9 借用金 Borrowed Money 739.5 712.9 700.2 688.7 684.0 644.9 679.5 692.5 外国為替 Foreign Exchanges 0.1 0.0 0.0 0.5 0.4 0.9 0.7 0.9 短期社債 Short-Term Corporate Bonds 175.7 193.4 193.9 212.3 191.0 238.0 239.6 274.4 社債 Corporate Bonds 85.0 75.5 87.3 92.3 92.3 82.3 72.2 116.5 その他負債 Other Liabilities 367.7 361.1 355.8 364.8 347.3 373.1 395.8 376.7 賞与引当金 Accrued Employees' Bonuses 8.4 2.5 4.9 5.9 8.5 2.4 4.9 5.9 役員賞与引当金 Accrued Directors' Bonuses 0.0 0.0 0.0 0.0 0.0 0.0 0.0 0.0 退職給付に係る負債 Liabilities for Retirement Benefits 8.3 8.3 8.3 8.4 8.2 8.2 8.3 8.3 役員退職慰労引当金 Reserve for directors' retirement benefits - - - - - - 0.0 0.0 睡眠債券払戻損失引当金 Reserve for Reimbursement of Debentures 4.1 4.0 4.0 3.9 3.7 3.6 3.5 3.5 利息返還損失引当金 Reserve for Losses on Interest Repayments 74.6 70.9 65.7 62.1 63.0 60.2 56.2 53.3 繰延税金負債 Deferred Tax Liabilities - - - - - - 0.2 0.2 支払承諾 Acceptances and Guarantees 395.3 408.2 422.1 441.4 456.7 481.4 501.9 507.0 負債の部合計 Total Liabilities 8,600.6 8,592.0 8,662.2 8,647.1 8,674.5 8,751.0 8,929.5 9,191.8 純資産の部: Equity: 資本金 Common Stock 512.2 512.2 512.2 512.2 512.2 512.2 512.2 512.2 資本剰余金 Capital Surplus 78.5 78.5 78.5 78.5 78.5 78.5 78.5 78.5 利益剰余金 Retained Earnings 361.3 303.5 322.1 336.0 346.5 356.1 372.1 389.1 自己株式 Treasury Stock, at Cost -89.5 -27.4 -37.3 -37.7 -37.7 -40.9 -46.8 -52.5 株主資本合計 Total Shareholders' Equity 862.5 866.8 875.5 889.0 899.5 905.9 916.0 927.2 その他有価証券評価差額金 Unrealized Gain (Loss) on Available-for-Sale Securities 5.1 6.9 6.6 7.2 10.0 11.4 8.4 4.8 繰延ヘッジ損益 Deferred Gain (Loss) on Derivatives under Hedge Accounting -14.4 -14.4 -12.3 -14.3 -16.3 -17.1 -18.1 -17.0 為替換算調整勘定 Foreign Currency Translation Adjustments -1.5 -1.9 -1.1 -1.9 -1.5 -2.7 -2.8 -1.2 退職給付に係る調整累計額 Defined Retirement Benefit Plans 2.0 2.1 2.3 2.4 0.3 0.4 0.4 0.3 その他の包括利益累計額合計 Total Accumulated Other Comprehensive Income -8.7 -7.1 -4.5 -6.5 -7.5 -8.0 -12.1 -13.0 新株予約権 Stock Acquisition Rights 0.3 0.1 0.1 0.0 0.0 0.1 0.1 0.1 非支配株主持分 Noncontrolling Interests 1.9 2.0 2.1 2.7 4.4 5.0 7.1 7.4 純資産の部合計 Total Equity 856.0 861.8 873.2 885.3 896.6 903.0 911.2 921.6 負債及び純資産の部合計 Total Liabilities and Equity 9,456.6 9,453.8 9,535.5 9,532.4 9,571.1 9,654.0 9,840.7 10,113.5
5

未監査(単位:10億円) Unaudited (Billions of Yen)連結損益計算書 Consolidated Statements of Income 2018.1-3 2018.4-6 2018.7-9 2018.10-12 2019.1-3 2019.4-6 2019.7-9 2019.10-12経常収益 Ordinary Income 97.7 91.7 95.6 91.7 93.0 91.5 105.9 101.3 資金運用収益 Interest Income 36.9 38.5 38.0 39.4 38.7 38.3 38.3 38.8 貸出金利息 Interest on Loans and Bills Discounted 33.8 34.6 35.0 35.1 35.4 35.0 35.1 35.3 有価証券利息配当金 Interest and Dividends on Securities 2.6 3.4 2.5 3.7 2.7 2.6 2.4 2.8 その他の資金運用収益 Other Interest Income 0.5 0.5 0.4 0.5 0.5 0.7 0.7 0.6 役務取引等収益 Fees and Commissions Income 12.6 12.7 14.4 14.1 14.0 15.0 14.3 14.8 特定取引収益 Trading Income 2.7 0.9 1.3 1.7 2.6 2.2 2.7 2.5 その他業務収益 Other Business Income 35.8 34.9 34.5 30.7 33.7 32.4 39.8 39.7 その他経常収益 Other Ordinary Income 9.6 4.4 7.3 5.7 3.8 3.3 10.6 5.3 経常費用 Ordinary Expenses 81.3 81.1 76.5 76.1 82.9 75.7 89.9 83.4 資金調達費用 Interest Expenses 4.9 5.1 5.1 5.6 5.1 4.9 4.9 5.2 預金利息 Interest on Deposits 2.2 2.1 1.9 2.2 1.4 1.2 1.4 1.6 借用金利息 Interest on Borrowings 0.8 0.8 0.9 0.7 0.7 0.6 0.6 0.8 社債利息 Interest on Corporate Bonds 0.1 0.1 0.1 0.1 0.0 0.0 0.0 0.0 その他の資金調達費用 Other Interest Expenses 1.6 1.9 2.1 2.4 2.8 2.9 2.8 2.7 役務取引等費用 Fees and Commissions Expenses 6.3 6.1 6.4 5.6 5.7 7.3 6.4 6.4 特定取引費用 Trading Losses - 0.2 0.1 -0.3 -0.1 - - - その他業務費用 Other Business Expenses 23.0 20.3 21.3 19.4 22.9 19.6 26.2 25.6 営業経費 General and Administrative Expenses 36.2 35.8 37.3 36.2 39.1 36.8 38.3 37.9 のれん償却額 Amortization of Goodwill 0.6 0.6 0.6 0.4 0.5 0.5 0.5 0.5 無形資産償却額 Amortization of Intangible Assets Acquired in Business Combinations 0.2 0.2 0.2 0.0 0.0 0.0 0.0 0.0 営業経費(のれん及び無形資産償却を除く) Other General and Administrative Expenses 35.4 34.9 36.4 35.7 38.5 36.3 37.7 37.2 その他経常費用 Other Ordinary Expenses 10.8 13.4 6.1 9.4 10.1 6.9 13.9 8.2 貸倒引当金繰入額 Provision of Reserve for Credit Losses 9.3 12.2 4.8 8.4 9.6 6.5 12.8 7.4 その他 Other 1.4 1.2 1.2 1.0 0.4 0.4 1.0 0.7 経常利益 Ordinary Profit 16.4 10.6 19.0 15.6 10.1 15.7 16.0 17.8 特別利益 Extraordinary Gains 0.6 0.2 0.0 0.0 -0.0 0.0 0.0 0.0 特別損失 Extraordinary Losses 1.1 0.2 0.1 0.1 0.4 0.4 0.0 0.4 税金等調整前四半期純利益 Income before Income Taxes 15.8 10.5 18.9 15.4 9.6 15.3 15.9 17.3 税金 Income Taxes: 法人税、住民税及び事業税 Income Taxes (Benefits) - Current -1.8 1.6 -0.7 1.5 1.4 2.5 -1.1 0.3 法人税等調整額 Income Taxes (Benefits) - Deferred 1.9 0.0 1.0 -0.0 -2.3 0.7 1.0 0.0 非支配株主に帰属する四半期純利益 Profit Attributable to Noncontrolling Interests -0.0 0.0 0.0 0.0 -0.2 -0.0 -0.0 -0.0 親会社株主に帰属する四半期純利益 Profit Attributable to Owners of the Parent 15.8 9.0 18.5 13.8 10.7 12.1 15.9 16.9
連結包括利益計算書 Consolidated Statements of Comprehensive Income 2018.1-3 2018.4-6 2018.7-9 2018.10-12 2019.1-3 2019.4-6 2019.7-9 2019.10-12 純利益 Profit 15.7 9.0 18.6 13.9 10.5 12.0 15.9 16.9 その他の包括利益 Other Comprehensive Income -3.6 -2.3 2.6 -2.0 -0.9 -0.6 -4.0 -1.0 その他有価証券評価差額金 Unrealized Gain on Available-for-Sale Securities -3.5 -2.5 -1.2 0.0 3.4 1.0 -4.2 -3.8 繰延ヘッジ損益 Deferred Gain on Derivatives under Hedge Accounting -0.4 0.0 2.0 -1.9 -2.0 -0.7 -1.0 1.1 為替換算調整勘定 Foreign Currency Translation Adjustments 0.0 -0.5 -0.1 0.1 0.4 -0.1 -0.0 0.3 退職給付に係る調整額 Defined Retirement Benefit Plans 2.9 0.1 0.1 0.1 -2.0 0.0 0.0 -0.0 持分法適用会社に対する持分相当額 Share of Other Comprehensive Income in Affiliates -2.7 0.6 1.9 -0.4 -0.7 -0.8 1.2 1.4 包括利益 Comprehensive Income 12.1 6.7 21.3 11.8 9.5 11.4 11.8 15.9 親会社株主に係る包括利益 Owners of the Parent 12.2 6.7 21.2 11.8 9.8 11.5 11.9 15.9 非支配株主に係る包括利益 Noncontrolling Interests -0.1 -0.0 0.0 -0.0 -0.2 -0.1 -0.0 -0.0
6

未監査(単位:10億円) Unaudited (Billions of Yen)買入金銭債権 Other Monetary Claims Purchased 2018.3 2018.6 2018.9 2018.12 2019.3 2019.6 2019.9 2019.12 売買目的の買入金銭債権 Trading Purpose 1.7 n/a 1.7 n/a 2.8 n/a 2.7 n/a その他の買入金銭債権 Other 34.6 n/a 27.6 n/a 28.1 n/a 71.9 n/a買入金銭債権 Total Other Monetary Claims Purchased 36.3 32.4 29.4 29.6 30.9 74.8 74.6 70.2
金銭の信託 Monetary Assets Held in Trust 2018.3 2018.6 2018.9 2018.12 2019.3 2019.6 2019.9 2019.12 運用目的の金銭の信託 Trading Purpose 17.2 n/a 15.7 n/a 12.5 n/a 10.8 n/a その他の金銭の信託 Other 217.6 n/a 251.8 n/a 293.3 n/a 335.6 n/a金銭の信託 Total Monetary Assets Held in Trust 234.9 255.2 267.5 274.9 305.8 314.0 346.5 428.8
有価証券 Securities 2018.3 2018.6 2018.9 2018.12 2019.3 2019.6 2019.9 2019.12 国債 Japanese National Government Bonds 504.5 n/a 554.6 n/a 501.5 n/a 446.4 n/a 地方債 Japanese Local Government Bonds 2.3 n/a 3.2 n/a - n/a - n/a 社債 Japanese Corporate Bonds 157.4 n/a 165.1 n/a 171.1 n/a 171.8 n/a 株式 Japanese Equity Securities 32.7 n/a 32.8 n/a 30.6 n/a 28.0 n/a その他の証券 Foreign Bonds and Other 426.5 n/a 461.5 n/a 426.9 n/a 406.7 n/a有価証券 Total Securities 1,123.5 1,121.6 1,217.5 1,118.6 1,130.2 1,065.7 1,053.0 981.0
有価証券保有区分別残高 Securities by Category 2018.3 2018.6 2018.9 2018.12 2019.3 2019.6 2019.9 2019.12 売買目的有価証券のうち有価証券に含まれるもの Trading Securities 0.0 n/a 0.0 n/a 0.0 n/a 0.0 n/a 満期保有目的の債券 Securities Being Held to Maturity 481.3 450.7 455.2 429.7 399.2 368.6 338.1 307.6 国債 Japanese National Government Bonds 481.3 450.7 455.2 429.7 399.2 368.6 338.1 307.6 社債 Japanese Corporate Bonds - - - - - - - - その他 Other - - - - - - - - その他有価証券 Securities Available for Sale 587.6 n/a 698.4 n/a 670.3 n/a 653.1 n/a その他有価証券で時価のあるもの Securities Carried at Fair Value 534.7 564.3 652.2 582.1 624.5 589.3 605.6 558.8 株式 Equity Securities 21.1 20.6 20.6 16.7 17.3 17.5 12.9 14.0 国債 Japanese National Government Bonds 23.2 61.2 99.4 87.6 102.3 108.1 108.2 86.2 地方債 Japanese Local Government Bonds 2.3 2.4 3.2 - - - - - 社債 Japanese Corporate Bonds 157.4 150.4 165.1 146.8 171.1 172.8 171.8 168.7 その他 Other, Mainly Foreign Debt Securities 330.6 329.6 363.7 330.8 333.6 290.7 312.5 289.7 外国証券 Foreign Securities 326.1 324.3 358.6 325.5 332.6 289.2 311.1 288.9 外貨外国公社債 249.6 250.4 282.7 252.1 259.7 206.8 229.0 206.7 邦貨外国公社債 72.5 68.9 69.1 67.6 67.0 78.4 78.8 78.8 外国株式・その他 Foreign Equity Securities and Others 3.9 4.8 6.7 5.6 5.8 4.0 3.2 3.3 その他証券 Other Securities 4.4 5.3 5.1 5.3 0.9 1.4 1.4 0.8 その他有価証券で時価を把握することが極めて困難なもの Securities Carried at Cost whose Fair Value cannot be Reliably Determined 52.9 n/a 46.2 n/a 45.7 n/a 47.4 n/a 株式 Equity Securities 8.9 n/a 9.0 n/a 9.8 n/a 11.2 n/a 社債 Japanese Corporate Bonds - n/a - n/a - n/a - n/a 外国証券 Foreign Securities 33.9 n/a 26.6 n/a 23.4 n/a 20.6 n/a その他 Other 9.9 n/a 10.5 n/a 12.5 n/a 15.5 n/a 非連結子会社・関連会社株式 54.5 n/a 63.7 n/a 60.7 n/a 61.7 n/a有価証券 Total Securities 1,123.5 1,121.6 1,217.5 1,118.6 1,130.2 1,065.7 1,053.0 981.0
Foreign Currency Denominated Foreign Corporate and Government BondsYen-Denominated Foreign Corporate and Government Bonds
Equity Securities of Unconsolidated Subsidiaries and Affiliates
7

未監査(単位:10億円) Unaudited (Billions of Yen)業種別貸出内訳 Loans by Borrower Industry 2018.3 2018.6 2018.9 2018.12 2019.3 2019.6 2019.9 2019.12 国内(除く特別国際金融取引勘定分) Domestic Offices (excluding Japan Offshore Market Account): 製造業 Manufacturing 189.6 191.9 191.7 203.0 190.0 196.6 202.5 219.1 農業、林業 Agriculture and Forestry 0.0 0.0 0.0 0.0 0.0 0.0 0.0 0.0 漁業 Fishery - - - 0.1 - 0.1 0.1 0.2 鉱業、砕石業、砂利採取業 Mining, Quarrying and Gravel Extraction 0.4 0.6 0.4 0.7 0.3 0.6 0.6 0.7 建設業 Construction 7.6 7.4 7.7 8.2 9.1 8.9 8.2 12.1 電気・ガス・熱供給・水道業 Electric Power, Gas, Heat Supply and Water Supply 250.1 252.0 268.8 298.4 320.7 316.9 331.2 350.2 情報通信業 Information and Communications 70.5 69.6 64.6 60.8 55.1 54.3 47.2 58.4 運輸業、郵便業 Transportation and Postal Service 197.9 195.4 195.7 198.5 195.2 193.4 199.4 206.2 卸売業、小売業 Wholesale and Retail 114.5 108.0 111.8 112.5 122.5 115.9 114.4 102.0 金融業、保険業 Finance and Insurance 509.1 491.0 530.3 514.3 521.5 520.0 521.7 519.8 不動産業 Real Estate 565.9 556.3 574.1 572.2 584.9 611.2 649.0 666.2 各種サービス業 Services 344.6 345.0 315.9 340.0 341.8 339.2 346.9 372.2 地方公共団体 Local Government 68.4 57.2 58.0 55.1 52.4 52.8 66.0 65.3 その他 Others 2,437.3 2,430.4 2,406.2 2,401.1 2,402.7 2,321.8 2,297.8 2,290.8 個人向け貸出(住宅ローン、無担保ローン、クレジットカードキャッシング、 住関連ローン等)
1,998.2 1,984.9 1,971.6 1,950.7 1,934.5 1,915.5 1,907.8 1,899.5
国内合計 (A) Total Domestic (A) 4,756.4 4,705.3 4,725.6 4,765.3 4,796.9 4,732.4 4,785.7 4,863.7 海外及び特別国際金融取引勘定分 Overseas Offices (including Japan Offshore Market Account): 政府等 Governments 0.3 0.3 0.2 0.2 0.1 0.1 0.0 0.0 金融機関 Financial Institutions 30.8 30.4 29.0 30.7 32.6 29.7 30.3 36.7 その他 Others 108.3 110.5 121.9 147.1 157.1 158.8 186.4 219.1 海外合計 (B) Total Overseas (B) 139.5 141.3 151.3 178.1 189.9 188.7 216.8 256.0 合計 (A)+(B) Total (A)+(B) 4,895.9 4,846.7 4,877.0 4,943.4 4,986.8 4,921.1 5,002.6 5,119.7
無形固定資産 Intangible Assets 2018.3 2018.6 2018.9 2018.12 2019.3 2019.6 2019.9 2019.12 のれん Goodwill 11.9 11.2 10.6 10.4 10.9 11.4 11.4 10.9 新生フィナンシャル Shinsei Financial 0.3 0.1 - - 1.0 1.0 0.9 0.8 新生パーソナルローン Shinsei Personal Loan -3.4 -3.3 -3.2 -3.1 -3.0 -2.9 -2.8 -2.8 アプラスフィナンシャル APLUS FINANCIAL - - - - - - - - 昭和リース Showa Leasing 15.0 14.4 13.9 13.6 13.0 12.4 11.9 11.3 ファイナンシャル・ジャパン FINANCIAL JAPAN - - - - - 0.9 0.9 0.9 全国賃貸保証 ZenkokuRent Guarantor Service - - - - - - 0.5 0.5 その他 Others -0.0 -0.0 -0.0 -0.0 -0.0 -0.0 -0.0 -0.0 連結に伴う無形資産 Intangible Assets Related with Acquisitions 1.2 1.0 0.8 0.7 0.6 0.6 2.6 2.5 新生フィナンシャル Shinsei Financial 0.3 0.1 - - - - - - 昭和リース Showa Leasing 0.9 0.8 0.8 0.7 0.6 0.6 0.5 0.5 全国賃貸保証 ZenkokuRent Guarantor Service - - - - - - 2.0 2.0 その他 Others - - - - - - - - その他 Other 46.2 55.9 55.5 56.1 55.5 54.4 53.4 52.9 無形固定資産 Intangible Assets 59.4 68.2 67.0 67.3 67.1 66.5 67.5 66.4
繰越欠損金(納税主体ベース) Tax Loss Carryforwards (Taxable Entity Basis) 2018.3 2018.6 2018.9 2018.12 2019.3 2019.6 2019.9 2019.12新生銀行(連結納税) Shinsei Bank (Consolidated Tax) 156.0 n/a n/a n/a 147.2 n/a n/a n/aアプラスフィナンシャル(連結納税) APLUS FINANCIAL (Consolidated Tax) 41.9 n/a n/a n/a 46.2 n/a n/a n/a
1株当たり配当金(円) Dividends Per Share (JPY) 2018.3 2018.6 2018.9 2018.12 2019.3 2019.6 2019.9 2019.12普通株 Common Share 10 - - - 10 - - -
Loans to Individual Customers (Housing Loan, Unsecured Loan, Cashing by CreditCard, Housing Related Loan, etc.)
8
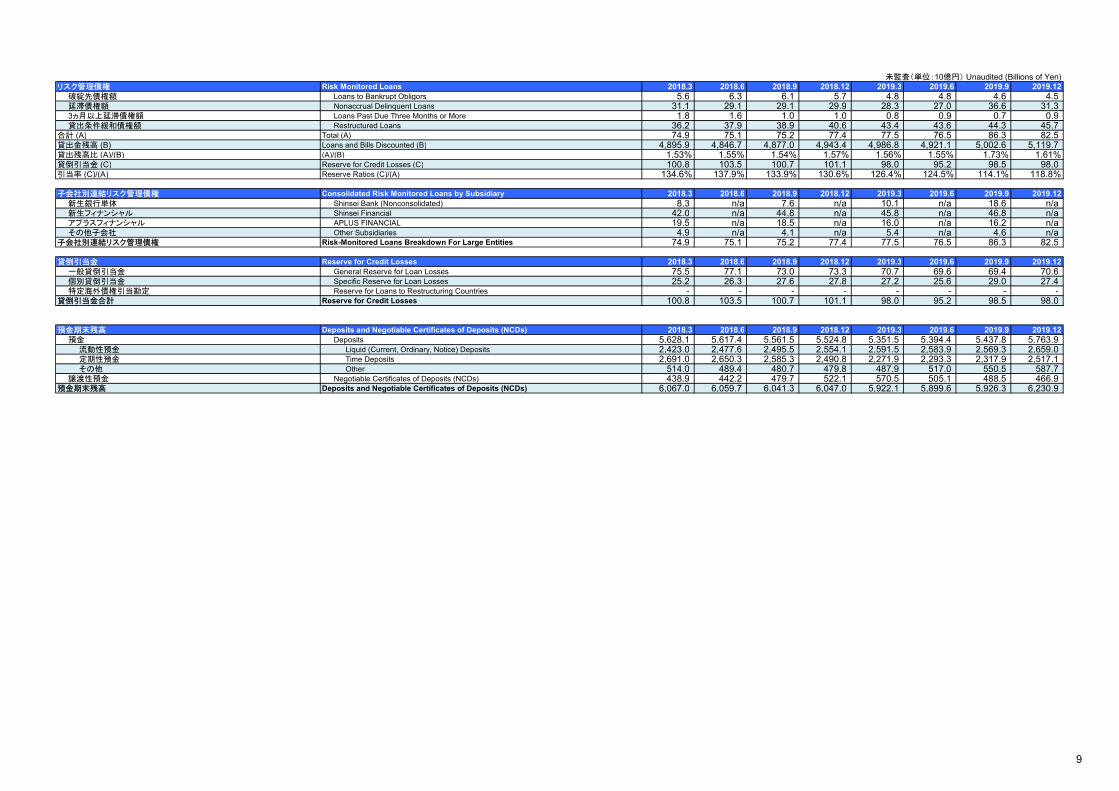
未監査(単位:10億円) Unaudited (Billions of Yen)リスク管理債権 Risk Monitored Loans 2018.3 2018.6 2018.9 2018.12 2019.3 2019.6 2019.9 2019.12 破綻先債権額 Loans to Bankrupt Obligors 5.6 6.3 6.1 5.7 4.8 4.8 4.6 4.5 延滞債権額 Nonaccrual Delinquent Loans 31.1 29.1 29.1 29.9 28.3 27.0 36.6 31.3 3ヵ月以上延滞債権額 Loans Past Due Three Months or More 1.8 1.6 1.0 1.0 0.8 0.9 0.7 0.9 貸出条件緩和債権額 Restructured Loans 36.2 37.9 38.9 40.6 43.4 43.6 44.3 45.7 合計 (A) Total (A) 74.9 75.1 75.2 77.4 77.5 76.5 86.3 82.5 貸出金残高 (B) Loans and Bills Discounted (B) 4,895.9 4,846.7 4,877.0 4,943.4 4,986.8 4,921.1 5,002.6 5,119.7 貸出残高比 (A)/(B) (A)/(B) 1.53% 1.55% 1.54% 1.57% 1.56% 1.55% 1.73% 1.61%貸倒引当金 (C) Reserve for Credit Losses (C) 100.8 103.5 100.7 101.1 98.0 95.2 98.5 98.0 引当率 (C)/(A) Reserve Ratios (C)/(A) 134.6% 137.9% 133.9% 130.6% 126.4% 124.5% 114.1% 118.8%
子会社別連結リスク管理債権 Consolidated Risk Monitored Loans by Subsidiary 2018.3 2018.6 2018.9 2018.12 2019.3 2019.6 2019.9 2019.12 新生銀行単体 Shinsei Bank (Nonconsolidated) 8.3 n/a 7.6 n/a 10.1 n/a 18.6 n/a 新生フィナンシャル Shinsei Financial 42.0 n/a 44.8 n/a 45.8 n/a 46.8 n/a アプラスフィナンシャル APLUS FINANCIAL 19.5 n/a 18.5 n/a 16.0 n/a 16.2 n/a その他子会社 Other Subsidiaries 4.9 n/a 4.1 n/a 5.4 n/a 4.6 n/a子会社別連結リスク管理債権 Risk-Monitored Loans Breakdown For Large Entities 74.9 75.1 75.2 77.4 77.5 76.5 86.3 82.5
貸倒引当金 Reserve for Credit Losses 2018.3 2018.6 2018.9 2018.12 2019.3 2019.6 2019.9 2019.12 一般貸倒引当金 General Reserve for Loan Losses 75.5 77.1 73.0 73.3 70.7 69.6 69.4 70.6 個別貸倒引当金 Specific Reserve for Loan Losses 25.2 26.3 27.6 27.8 27.2 25.6 29.0 27.4 特定海外債権引当勘定 Reserve for Loans to Restructuring Countries - - - - - - - -貸倒引当金合計 Reserve for Credit Losses 100.8 103.5 100.7 101.1 98.0 95.2 98.5 98.0
預金期末残高 Deposits and Negotiable Certificates of Deposits (NCDs) 2018.3 2018.6 2018.9 2018.12 2019.3 2019.6 2019.9 2019.12 預金 Deposits 5,628.1 5,617.4 5,561.5 5,524.8 5,351.5 5,394.4 5,437.8 5,763.9 流動性預金 Liquid (Current, Ordinary, Notice) Deposits 2,423.0 2,477.6 2,495.5 2,554.1 2,591.5 2,583.9 2,569.3 2,659.0 定期性預金 Time Deposits 2,691.0 2,650.3 2,585.3 2,490.8 2,271.9 2,293.3 2,317.9 2,517.1 その他 Other 514.0 489.4 480.7 479.8 487.9 517.0 550.5 587.7 譲渡性預金 Negotiable Certificates of Deposits (NCDs) 438.9 442.2 479.7 522.1 570.5 505.1 488.5 466.9 預金期末残高 Deposits and Negotiable Certificates of Deposits (NCDs) 6,067.0 6,059.7 6,041.3 6,047.0 5,922.1 5,899.6 5,926.3 6,230.9
9

Section 2. 新生銀行 連結セグメント別データ Section 2. Shinsei Bank Consolidated Business Line Data
Section 2.1 セグメント別業務粗利益 Section 2.1 Business Line Total Revenue
・個人業務「新生フィナンシャル」では、経営管理上、新生フィナンシャルならびに「新生銀行カードローン エル」、「新生銀行スマートカードローン プラス」、「新生銀行スマートマネーレンディング」による収益を合算して表示し
ております。新生銀行レイクは2019年11月28日に「新生銀行カードローン エル」に名称変更しました。
未監査(単位:10億円) Unaudited (Billions of Yen)法人業務 業務粗利益 * 2018.1-3 2018.4-6 2018.7-9 2018.10-12 2019.1-3 2019.4-6 2019.7-9 2019.10-12 資金利益 Net Interest Income 6.2 6.6 5.6 7.0 6.8 6.6 7.2 7.9 法人営業 Corporate Business 2.4 2.5 2.4 2.5 2.5 2.5 2.5 2.8 ストラクチャードファイナンス Structured Finance 2.5 2.4 2.4 2.6 2.7 2.7 2.9 3.1 プリンシパルトランザクションズ Principal Transactions 0.8 1.1 0.3 1.5 0.7 0.4 0.9 1.3 昭和リース Showa Leasing -0.0 -0.0 -0.1 -0.0 0.1 -0.0 -0.0 -0.0 市場営業 Markets 0.3 0.3 0.3 0.3 0.4 0.7 0.8 0.5 その他金融市場 Other Global Markets 0.1 0.1 0.1 0.1 0.1 0.1 0.1 0.1 非資金利益 Noninterest Income 11.9 9.8 11.7 9.7 9.8 8.6 14.7 13.9 法人営業 Corporate Business 1.5 1.0 1.5 1.7 2.3 1.2 4.5 1.5 ストラクチャードファイナンス Structured Finance 1.8 1.0 2.3 2.1 1.6 1.6 1.4 2.8 プリンシパルトランザクションズ Principal Transactions 0.4 2.3 2.6 1.0 -0.5 0.4 2.8 2.3 昭和リース Showa Leasing 5.1 3.8 3.3 3.0 4.0 3.1 3.9 3.6 市場営業 Markets 2.4 0.9 1.4 1.3 1.8 1.3 1.1 2.5 その他金融市場 Other Global Markets 0.5 0.5 0.4 0.3 0.4 0.7 0.8 1.0 法人業務 業務粗利益 18.2 16.5 17.4 16.8 16.6 15.2 22.0 21.8 法人営業 Corporate Business 4.0 3.6 4.0 4.3 4.8 3.8 7.0 4.3 ストラクチャードファイナンス Structured Finance 4.3 3.5 4.8 4.7 4.4 4.4 4.4 5.9 プリンシパルトランザクションズ Principal Transactions 1.3 3.5 3.0 2.5 0.1 0.9 3.7 3.7 昭和リース Showa Leasing 5.0 3.8 3.1 2.9 4.2 3.1 3.8 3.5 市場営業 Markets 2.7 1.3 1.7 1.7 2.2 2.0 1.9 3.0 その他金融市場 Other Global Markets 0.7 0.6 0.5 0.5 0.5 0.8 0.9 1.1 法人業務 業務粗利益 18.2 16.5 17.4 16.8 16.6 15.2 22.0 21.8 注記: 1. 前期の数字は今期の表記に調整されています。
Note: 1. Previous periods have been adjusted to conform to current period presentation.
個人業務 業務粗利益* Individual Business Total Revenue* 2018.1-3 2018.4-6 2018.7-9 2018.10-12 2019.1-3 2019.4-6 2019.7-9 2019.10-12 資金利益 Net Interest Income 25.9 26.4 26.4 26.2 25.7 25.8 26.1 26.1 リテールバンキング Retail Banking 5.6 5.8 5.9 6.1 5.9 6.0 5.9 5.9 貸出 Loans 2.5 2.5 2.4 2.4 2.3 2.3 2.3 2.3 預金等 Deposits 3.0 3.3 3.4 3.6 3.5 3.6 3.6 3.6 新生フィナンシャル Shinsei Financial 17.3 17.5 17.4 17.3 17.0 17.1 17.4 17.5 うちレイク事業 Lake Businesses 15.8 16.0 15.9 15.8 15.6 15.7 15.9 16.1 アプラスフィナンシャル APLUS FINANCIAL 2.8 2.8 2.7 2.6 2.5 2.4 2.5 2.4 その他個人 Other Individual 0.1 0.1 0.2 0.2 0.2 0.2 0.2 0.1 非資金利益 Noninterest Income 12.8 12.2 12.5 13.5 12.4 12.5 13.2 13.5 リテールバンキング Retail Banking 0.4 0.4 0.5 0.8 1.0 1.0 1.2 1.3 資産運用商品関連 Asset Management Products 1.7 1.7 1.7 1.6 1.7 1.6 2.5 2.2 その他手数料(ATM、為替送金、外為等) Other Fees (ATM, Fund Transfer, FX etc.) -1.2 -1.2 -1.1 -0.7 -0.6 -0.5 -1.2 -0.8 新生フィナンシャル Shinsei Financial 0.0 0.0 -0.0 -0.0 -0.0 -0.2 -0.2 -0.2 アプラスフィナンシャル APLUS FINANCIAL 11.1 11.4 11.5 12.1 12.0 11.7 12.1 12.2 その他個人 Other Individual 1.3 0.3 0.4 0.5 -0.5 0.0 0.0 0.1 個人業務 業務粗利益 Individual Business Total Revenue 38.8 38.6 38.9 39.8 38.2 38.4 39.3 39.6 リテールバンキング Retail Banking 6.0 6.3 6.5 7.0 7.0 7.0 7.2 7.3 新生フィナンシャル Shinsei Financial 17.3 17.5 17.4 17.3 16.9 16.9 17.1 17.3 アプラスフィナンシャル APLUS FINANCIAL 14.0 14.2 14.2 14.8 14.5 14.1 14.6 14.7 その他個人 Other Individual 1.4 0.5 0.7 0.7 -0.2 0.3 0.3 0.3 個人業務 業務粗利益 Individual Business Total Revenue 38.8 38.6 38.9 39.8 38.2 38.4 39.3 39.6 注記: 1. 前期の数字は今期の表記に調整されています。Note: 1. Previous periods have been adjusted to conform to current period presentation.
・Income of Shinsei Financial , "Shinsei Bank Card Loan L", "Shinsei Bank Smart Card LoanPlus", and “Shinsei Bank Smart Money Lending” are combined on a management accountingbasis. "Bank Lake" was renamed as "Shinsei Bank Card Loan L" on 28th Nov 2019.
Institutional Business Total Revenue*
Institutional Business Total Revenue
Institutional Business Total Revenue
10

未監査(単位:10億円) Unaudited (Billions of Yen)経営勘定/その他 業務粗利益* Corporate/Other Total Revenue* 2018.1-3 2018.4-6 2018.7-9 2018.10-12 2019.1-3 2019.4-6 2019.7-9 2019.10-12 資金利益 Net Interest Income -0.2 0.3 0.7 0.4 1.0 0.9 -0.0 -0.5 トレジャリー Treasury -0.2 0.3 0.7 0.4 1.0 0.9 -0.0 -0.5 経営勘定/その他(トレジャリー除く) Corporate/Other (excluding Treasury) -0.0 -0.0 0.0 0.0 0.0 0.0 0.0 0.0 非資金利益 Noninterest Income 0.2 1.2 0.6 1.0 0.9 2.8 2.6 0.5 トレジャリー Treasury 0.0 1.0 0.4 0.8 0.9 2.7 2.5 0.4 経営勘定/その他(トレジャリー除く) Corporate/Other (excluding Treasury) 0.2 0.1 0.1 0.1 0.0 0.1 0.1 0.1 経営勘定/その他 業務粗利益 Corporate/Other Total Revenue 0.0 1.6 1.3 1.4 2.0 3.8 2.5 0.0 トレジャリー Treasury -0.2 1.4 1.2 1.3 2.0 3.6 2.4 -0.1 経営勘定/その他(トレジャリー除く) Corporate/Other (excluding Treasury) 0.2 0.1 0.1 0.1 0.0 0.1 0.1 0.1 経営勘定/その他 業務粗利益 Corporate/Other Total Revenue 0.0 1.6 1.3 1.4 2.0 3.8 2.5 0.0
経費* General and Administrative Expenses* 2018.1-3 2018.4-6 2018.7-9 2018.10-12 2019.1-3 2019.4-6 2019.7-9 2019.10-12 法人業務 Institutional Business -10.0 -10.0 -10.2 -10.0 -10.2 -10.2 -10.7 -10.5 法人営業 Corporate Business -2.9 -3.0 -2.9 -2.9 -2.9 -3.1 -3.1 -3.1 ストラクチャードファイナンス Structured Finance -1.7 -1.9 -1.9 -1.9 -1.9 -2.0 -2.1 -2.0 プリンシパルトランザクションズ Principal Transactions -1.1 -0.9 -1.0 -1.0 -1.0 -1.0 -1.0 -1.0 昭和リース Showa Leasing -2.5 -2.3 -2.3 -2.4 -2.6 -2.3 -2.8 -2.7 市場営業 Markets -0.8 -0.9 -0.9 -0.9 -0.9 -0.8 -0.8 -0.8 その他金融市場 Other Global Markets -0.8 -0.8 -0.8 -0.8 -0.8 -0.7 -0.7 -0.7 個人業務 Individual Business -24.3 -24.6 -25.4 -25.4 -25.6 -24.9 -25.7 -25.8 リテールバンキング Retail Banking -7.0 -6.9 -6.9 -6.8 -6.9 -6.5 -7.1 -7.1 新生フィナンシャル Shinsei Financial -7.9 -8.2 -8.2 -8.3 -8.6 -8.3 -8.4 -8.5 アプラスフィナンシャル APLUS FINANCIAL -8.9 -8.9 -9.7 -9.7 -9.6 -9.4 -9.6 -9.6 その他個人 Other Individual -0.3 -0.4 -0.4 -0.4 -0.4 -0.4 -0.4 -0.4 経営勘定/その他 Corporate/Other -1.1 -0.1 -0.5 -0.1 -2.1 -1.0 -1.1 -0.9 トレジャリー Treasury -0.4 -0.4 -0.4 -0.4 -0.4 -0.4 -0.3 -0.4 経営勘定/その他(トレジャリー除く) Corporate/Other (excluding Treasury) -0.6 0.2 -0.1 0.2 -1.7 -0.6 -0.7 -0.5 経費 General and Administrative Expenses -35.4 -34.8 -36.1 -35.6 -38.1 -36.2 -37.6 -37.3 注記: 1. 前期の数字は今期の表記に調整されています。
Note: 1. Previous periods have been adjusted to conform to current period presentation.
実質業務純益 * Ordinary Business Profit* 2018.1-3 2018.4-6 2018.7-9 2018.10-12 2019.1-3 2019.4-6 2019.7-9 2019.10-12 法人業務 Institutional Business 8.1 6.5 7.2 6.7 6.3 5.0 11.2 11.3 法人営業 Corporate Business 1.0 0.6 1.0 1.3 1.9 0.6 3.8 1.2 ストラクチャードファイナンス Structured Finance 2.6 1.6 2.8 2.8 2.5 2.3 2.3 3.8 プリンシパルトランザクションズ Principal Transactions 0.1 2.6 2.0 1.5 -0.8 -0.1 2.7 2.7 昭和リース Showa Leasing 2.5 1.4 0.7 0.4 1.6 0.8 1.0 0.7 市場営業 Markets 1.8 0.3 0.8 0.8 1.3 1.2 1.1 2.2 その他金融市場 Other Global Markets -0.1 -0.1 -0.2 -0.3 -0.2 0.1 0.1 0.4 個人業務 Individual Business 14.5 14.0 13.5 14.4 12.5 13.5 13.6 13.8 リテールバンキング Retail Banking -0.9 -0.5 -0.4 0.1 0.0 0.4 0.0 0.1 新生フィナンシャル Shinsei Financial 9.3 9.2 9.2 8.9 8.3 8.5 8.7 8.7 アプラスフィナンシャル APLUS FINANCIAL 5.0 5.2 4.4 5.0 4.8 4.7 4.9 5.0 その他個人 Other Individual 1.1 0.0 0.2 0.2 -0.7 -0.1 -0.1 -0.1 経営勘定/その他 Corporate/Other -1.1 1.4 0.8 1.3 -0.0 2.7 1.4 -0.8 トレジャリー Treasury -0.6 1.0 0.7 0.9 1.6 3.2 2.0 -0.5 経営勘定/その他(トレジャリー除く) Corporate/Other (excluding Treasury) -0.4 0.4 0.0 0.3 -1.6 -0.5 -0.5 -0.3 実質業務純益 Ordinary Business Profit 21.6 22.0 21.6 22.5 18.7 21.3 26.3 24.2 注記: 1. 前期の数字は今期の表記に調整されています。
Note: 1. Previous periods have been adjusted to conform to current period presentation.
11
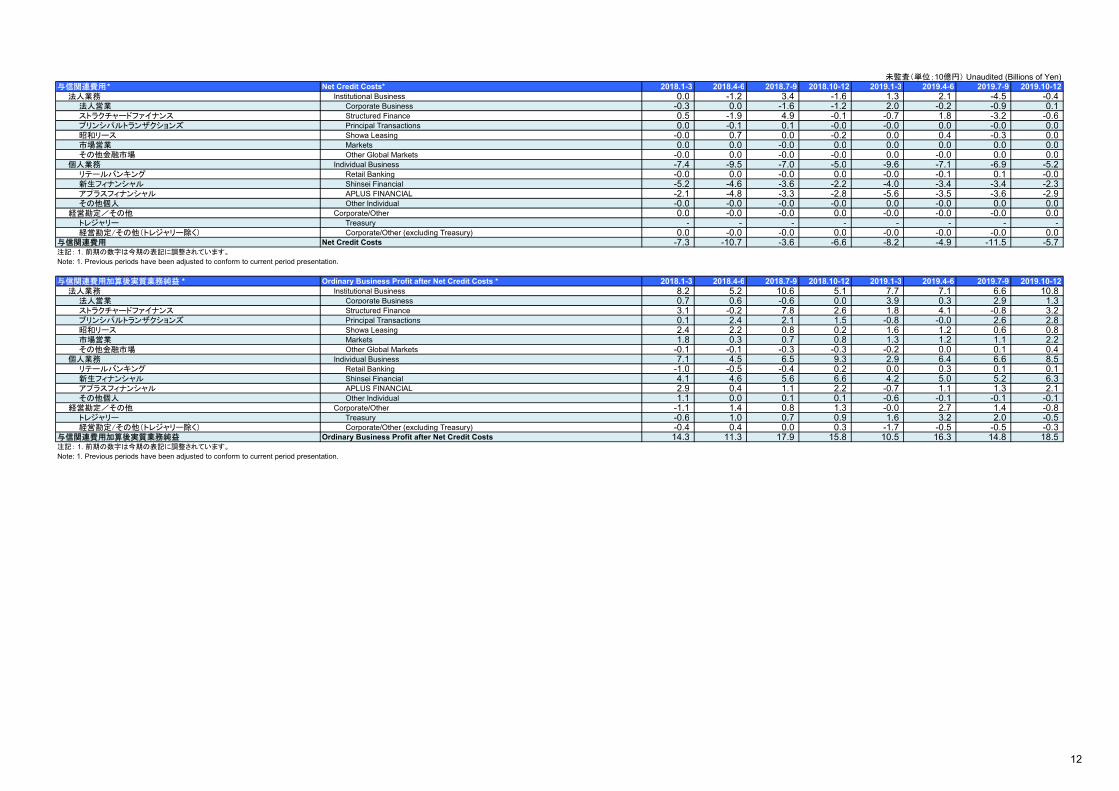
未監査(単位:10億円) Unaudited (Billions of Yen)与信関連費用 * Net Credit Costs* 2018.1-3 2018.4-6 2018.7-9 2018.10-12 2019.1-3 2019.4-6 2019.7-9 2019.10-12 法人業務 Institutional Business 0.0 -1.2 3.4 -1.6 1.3 2.1 -4.5 -0.4 法人営業 Corporate Business -0.3 0.0 -1.6 -1.2 2.0 -0.2 -0.9 0.1 ストラクチャードファイナンス Structured Finance 0.5 -1.9 4.9 -0.1 -0.7 1.8 -3.2 -0.6 プリンシパルトランザクションズ Principal Transactions 0.0 -0.1 0.1 -0.0 -0.0 0.0 -0.0 0.0 昭和リース Showa Leasing -0.0 0.7 0.0 -0.2 0.0 0.4 -0.3 0.0 市場営業 Markets 0.0 0.0 -0.0 0.0 0.0 0.0 0.0 0.0 その他金融市場 Other Global Markets -0.0 0.0 -0.0 -0.0 0.0 -0.0 0.0 0.0 個人業務 Individual Business -7.4 -9.5 -7.0 -5.0 -9.6 -7.1 -6.9 -5.2 リテールバンキング Retail Banking -0.0 0.0 -0.0 0.0 -0.0 -0.1 0.1 -0.0 新生フィナンシャル Shinsei Financial -5.2 -4.6 -3.6 -2.2 -4.0 -3.4 -3.4 -2.3 アプラスフィナンシャル APLUS FINANCIAL -2.1 -4.8 -3.3 -2.8 -5.6 -3.5 -3.6 -2.9 その他個人 Other Individual -0.0 -0.0 -0.0 -0.0 0.0 -0.0 0.0 0.0 経営勘定/その他 Corporate/Other 0.0 -0.0 -0.0 0.0 -0.0 -0.0 -0.0 0.0 トレジャリー Treasury - - - - - - - - 経営勘定/その他(トレジャリー除く) Corporate/Other (excluding Treasury) 0.0 -0.0 -0.0 0.0 -0.0 -0.0 -0.0 0.0 与信関連費用 Net Credit Costs -7.3 -10.7 -3.6 -6.6 -8.2 -4.9 -11.5 -5.7 注記: 1. 前期の数字は今期の表記に調整されています。
Note: 1. Previous periods have been adjusted to conform to current period presentation.
与信関連費用加算後実質業務純益 * Ordinary Business Profit after Net Credit Costs * 2018.1-3 2018.4-6 2018.7-9 2018.10-12 2019.1-3 2019.4-6 2019.7-9 2019.10-12 法人業務 Institutional Business 8.2 5.2 10.6 5.1 7.7 7.1 6.6 10.8 法人営業 Corporate Business 0.7 0.6 -0.6 0.0 3.9 0.3 2.9 1.3 ストラクチャードファイナンス Structured Finance 3.1 -0.2 7.8 2.6 1.8 4.1 -0.8 3.2 プリンシパルトランザクションズ Principal Transactions 0.1 2.4 2.1 1.5 -0.8 -0.0 2.6 2.8 昭和リース Showa Leasing 2.4 2.2 0.8 0.2 1.6 1.2 0.6 0.8 市場営業 Markets 1.8 0.3 0.7 0.8 1.3 1.2 1.1 2.2 その他金融市場 Other Global Markets -0.1 -0.1 -0.3 -0.3 -0.2 0.0 0.1 0.4 個人業務 Individual Business 7.1 4.5 6.5 9.3 2.9 6.4 6.6 8.5 リテールバンキング Retail Banking -1.0 -0.5 -0.4 0.2 0.0 0.3 0.1 0.1 新生フィナンシャル Shinsei Financial 4.1 4.6 5.6 6.6 4.2 5.0 5.2 6.3 アプラスフィナンシャル APLUS FINANCIAL 2.9 0.4 1.1 2.2 -0.7 1.1 1.3 2.1 その他個人 Other Individual 1.1 0.0 0.1 0.1 -0.6 -0.1 -0.1 -0.1 経営勘定/その他 Corporate/Other -1.1 1.4 0.8 1.3 -0.0 2.7 1.4 -0.8 トレジャリー Treasury -0.6 1.0 0.7 0.9 1.6 3.2 2.0 -0.5 経営勘定/その他(トレジャリー除く) Corporate/Other (excluding Treasury) -0.4 0.4 0.0 0.3 -1.7 -0.5 -0.5 -0.3 与信関連費用加算後実質業務純益 Ordinary Business Profit after Net Credit Costs 14.3 11.3 17.9 15.8 10.5 16.3 14.8 18.5 注記: 1. 前期の数字は今期の表記に調整されています。
Note: 1. Previous periods have been adjusted to conform to current period presentation.
12

Section 2.2 セグメント別主要データ Section 2.2 Business Line Key Data 未監査(単位:10億円) Unaudited (Billions of Yen)法人業務 営業性資産* Institutional Business Operating Assets* 2018.3 2018.6 2018.9 2018.12 2019.3 2019.6 2019.9 2019.12 法人営業 Corporate Business 1,592.7 1,562.1 1,541.7 1,570.3 1,577.1 1,586.1 1,597.0 1,672.4 ストラクチャードファイナンス Structured Finance 1,396.6 1,421.1 1,512.3 1,546.9 1,643.6 1,674.3 1,774.5 1,880.7 不動産ファイナンス Real Estate Finance 556.7 565.1 596.9 583.6 652.6 666.0 725.4 781.1 不動産法人営業 Real Estate Companies 319.6 332.3 342.1 347.1 352.8 370.3 382.0 390.8 スペシャルティファイナンス Specialty Finance 234.8 238.1 257.2 266.7 274.3 273.1 292.4 318.0 プロジェクトファイナンス Project Finance 285.3 285.5 316.0 349.3 363.8 364.8 374.5 390.6 プリンシパルトランザクションズ Principal Transactions 193.7 196.1 195.0 191.1 190.7 193.2 183.4 186.5 昭和リース Showa Leasing 502.8 482.6 475.0 491.1 490.7 483.1 581.2 578.6 金融市場 Global Markets 202.4 206.8 216.2 208.7 203.5 193.3 187.8 196.6 法人業務 Total Corporate Business 3,888.4 3,869.0 3,940.3 4,008.4 4,105.9 4,130.2 4,324.0 4,515.0
個人業務 営業性資産、負債 * Individual Business Operating Assets and Liabilities* 2018.3 2018.6 2018.9 2018.12 2019.3 2019.6 2019.9 2019.12 リテールバンキング Retail Banking 1,282.9 1,260.9 1,240.1 1,221.3 1,203.0 1,182.2 1,171.8 1,164.4 コンシューマーファイナンス Consumer Finance 1,601.8 1,626.2 1,640.7 1,670.9 1,696.1 1,719.1 1,754.4 1,789.8 新生フィナンシャル Shinsei Financial 524.0 521.7 519.6 514.3 524.3 525.4 526.6 524.7 うちレイクALSA Lake ALSA - 4.6 10.7 17.5 27.0 38.7 50.8 61.7 うち新生銀行カードローンエル Shinsei Bank Card Loan L 287.3 282.8 277.6 270.2 264.3 258.7 252.6 245.5 アプラスフィナンシャル APLUS FINANCIAL 1,032.6 1,057.1 1,070.2 1,099.7 1,116.8 1,138.6 1,173.1 1,207.8 その他個人 Other Individual 45.0 47.3 50.7 56.7 54.9 54.9 54.5 57.2 個人業務 Individual Business Total 2,884.8 2,887.1 2,880.8 2,892.2 2,899.1 2,901.4 2,926.2 2,954.2 預り総資産 Assets under Management (AUM) 5,904.3 5,908.3 5,808.4 5,791.1 5,676.0 5,706.1 5,657.2 5,765.6 リテール預金 Retail Deposits 4,884.5 4,878.4 4,762.4 4,730.0 4,594.5 4,607.0 4,563.7 4,699.3 仕組預金 Structured Deposits 289.3 298.1 308.4 274.4 267.9 242.2 225.4 227.2 投信/保険 Mutual Funds and Insurance 783.4 783.7 788.8 798.5 813.3 826.0 834.3 832.2 投資信託 Mutual Funds 354.0 342.1 332.7 324.1 318.4 311.6 304.3 296.4 保険 Insurance 429.3 441.6 456.0 474.4 494.9 514.4 529.9 535.7 仕組債(金融商品仲介業務) Structured Bonds (Financial Product Intermediary Business) 235.5 246.0 257.2 262.5 268.0 264.0 248.2 220.4 その他(金銭の信託) Other (Monetary Assets Held in Trust) 9.0 10.8 13.5 支払承諾 Acceptances and Guarantees 375.1 388.5 399.8 417.4 438.2 455.8 479.0 486.2 リテール口座数(千口座) Total Number of Retail Accounts (Thousands) 3,143.5 3,148.6 3,142.6 3,131.2 3,112.4 3,107.6 3,102.7 3,097.0 パワースマート住宅ローン顧客数(千人) Total Number of PowerSmart Housing Loan Customers (Thousands) 68.9 68.2 67.7 67.1 66.6 65.9 65.6 65.4 レイク事業顧客数(千人) Number of Lake Business Customers (Thousands) 845.6 840.9 840.9 840.3 846.9 854.2 858.5 859.6 ノーローン 顧客数(千人) Number of NOLOAN Customers (Thousands) 69.3 68.7 68.1 67.0 66.6 66.2 65.3 63.7アプラスフィナンシャル 有効カード会員数(千人) Number of APLUS FINANCIAL Available Cardholders (Thousands) 5,283.0 5,236.7 5,140.2 5,172.8 5,121.9 5,040.2 4,960.0 4,914.8 注記: 1. 預り総資産残高にはリテール債券残高および未償還債券残高を含んでおります。
2. 前期の数字は今期の表記に調整されています。
Note: 1. AUM includes retail debentures and unclaimed debentures. 2. Previous periods have been adjusted to conform to current period presentation.
13

Section 3. 連結財務諸比率、自己資本、1株当たり数値、格付け情報他 未監査(単位:10億円) Unaudited (Billions of Yen)財務比率 Financial Ratios 2018.1-3 2018.4-6 2018.7-9 2018.10-12 2019.1-3 2019.4-6 2019.7-9 2019.10-12ROA(年換算後) Return on Assets (Annualized) 0.7% 0.4% 0.8% 0.6% 0.5% 0.5% 0.7% 0.7%ROE(潜在株式調整後) (年換算後) Return on Equity (Fully Diluted) (Annualized) 7.6% 4.3% 8.5% 6.3% 4.9% 5.5% 7.1% 7.4%経費率 Expense-to-Revenue Ratio 62.1% 61.2% 62.6% 61.3% 67.0% 63.0% 58.8% 60.6%
自己資本関連情報(バーゼルⅢ、国内基準) Capital Adequacy Data (Basel Ⅲ, Domestic Standard) 2018.3 2018.6 2018.9 2018.12 2019.3 2019.6 2019.9 2019.12コア資本に係る基礎項目 Core Capital: Instruments and Reserves 899.9 893.8 893.5 891.8 899.5 907.3 918.3 931.0 コア資本に係る調整項目 Core Capital: Regulatory Adjustments -85.8 -91.7 -92.1 -93.8 -104.2 -107.0 -104.8 -102.5 自己資本の額 Total Capital 814.1 802.1 801.4 797.9 795.3 800.2 813.4 828.5 リスクアセット等の額 Risk Assets 6,342.7 6,302.0 6,442.2 6,427.0 6,711.2 6,812.5 7,034.6 7,238.7 コア自己資本比率 Core Capital 12.83% 12.72% 12.44% 12.41% 11.85% 11.74% 11.56% 11.44%注記: 2019年9月期の連結自己資本比率の計算において、一部のエクスポージャーに適用するパラメータ推計値については2019年3月期の数値に調整を加えて使用しております。
Note: In the calculation of the consolidated capital adequacy ratio as of Sep 30, 2019, parameter estimates applied to some exposures are adjusted for the fiscal year ending March 31, 2019.
参考情報 Reference 2018.3 2018.6 2018.9 2018.12 2019.3 2019.6 2019.9 2019.12普通株等Tier1資本 Common Equity Tier1 771.0 771.6 780.4 791.9 802.3 808.7 817.8 829.0 リスクアセット Risk Assets 6,331.4 6,277.8 6,420.3 6,403.5 6,694.9 6,797.9 7,010.7 7,203.1 普通株等Tier1比率 Common Equity Tier1 Ratio (International Standard; Fully Loaded Basis) 12.2% 12.3% 12.2% 12.4% 12.0% 11.9% 11.7% 11.5%リスク資本 Risk Capital 468.2 462.7 469.7 454.8 464.5 472.5 481.9 509.6 注記: 2019年9月期の連結自己資本比率の計算において、一部のエクスポージャーに適用するパラメータ推計値については2019年3月期の数値に調整を加えて使用しております。
Note: In the calculation of the consolidated capital adequacy ratio as of Sep 30, 2019, parameter estimates applied to some exposures are adjusted for the fiscal year ending March 31, 2019.
1株当たり数値(円) Per Share Data (JPY) 2018.3 2018.6 2018.9 2018.12 2019.3 2019.6 2019.9 2019.121株当たり純資産 Common Equity Per Share 3,376.39 3,419.64 3,547.97 3,597.98 3,636.92 3,691.53 3,774.10 3,872.86 潜在株式調整後1株当たり純資産 Fully Diluted Equity Per Share 3,375.99 3,419.25 3,547.56 3,597.56 3,636.49 3,690.82 3,773.36 3,872.09 1株当たり四半期純利益 Basic Earnings Per Share 61.53 35.99 75.13 56.59 43.81 49.65 66.27 71.39 潜在株式調整後1株当たり四半期純利益 Diluted Earnings Per Share 61.52 35.98 75.13 56.58 43.81 49.64 66.25 71.38
株式数 Share Data 2018.3 2018.6 2018.9 2018.12 2019.3 2019.6 2019.9 2019.12潜在株式調整後期末発行済普通株式数 Fully Diluted Number of Shares Outstanding at End of Period 252,898,756 251,421,575 245,519,050 245,303,391 245,303,390 243,290,733 239,567,565 236,089,149
期末発行済普通株式数 Number of Common Shares 252,868,614 251,392,684 245,490,159 245,274,500 245,274,499 243,243,685 239,520,517 236,042,100
ストックオプションによる潜在株式数 Number of Fully Diluted Stock Options 30,142 28,891 28,891 28,891 28,891 47,048 47,048 47,049
(参考)期末自己株式数 (Ref) Treasury Shares at End of Period (not included in the above) 22,166,075 7,642,005 13,544,530 13,760,189 13,760,190 15,791,004 19,514,172 22,992,589
潜在株式調整後期中平均普通株式数 Weighted Average Fully Diluted Number of Shares Outstanding 258,376,805 252,639,539 250,077,018 248,484,864 247,700,391 244,808,393 243,102,387 241,243,824
期中平均普通株式数 Weighted Average Number of Common Shares Outstanding 258,349,136 252,605,416 250,045,525 248,454,242 247,670,196 244,773,118 243,061,193 241,200,670
Section 3. Shinsei Bank Consolidated Financial Ratios, Capital Adequacy and PerShare Data, and Credit Ratings
14
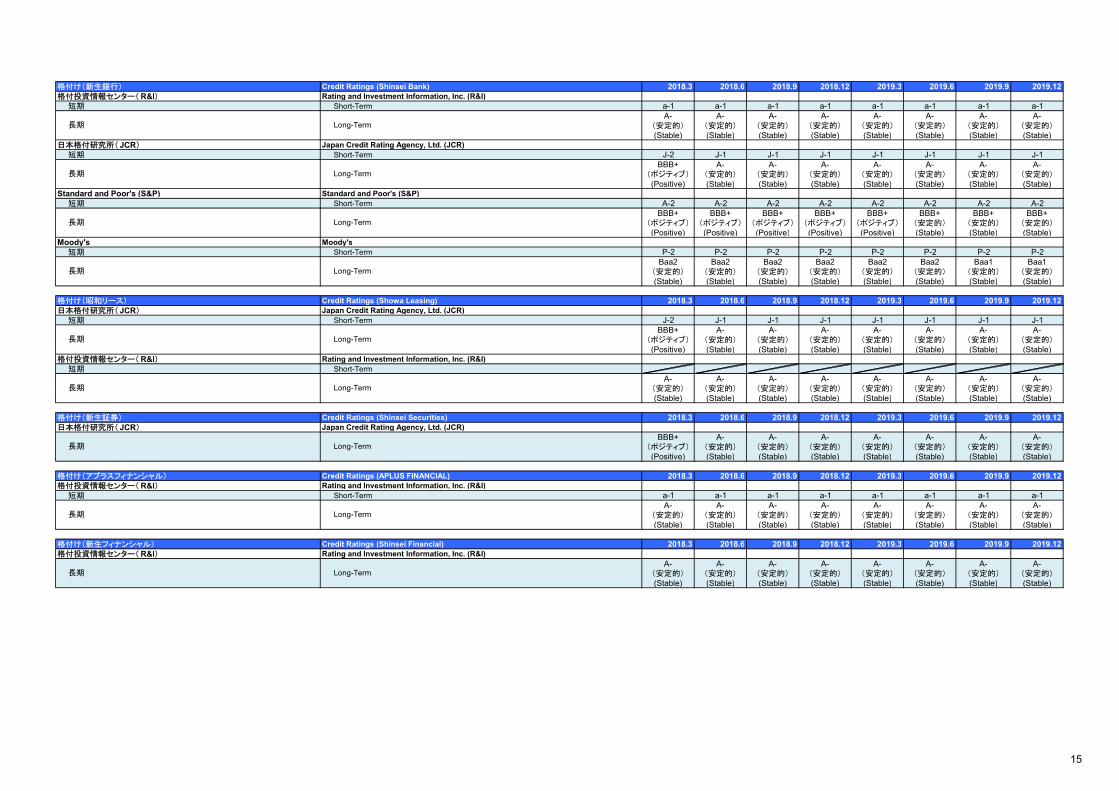
格付け(新生銀行) Credit Ratings (Shinsei Bank) 2018.3 2018.6 2018.9 2018.12 2019.3 2019.6 2019.9 2019.12格付投資情報センター( R&I) Rating and Investment Information, Inc. (R&I) 短期 Short-Term a-1 a-1 a-1 a-1 a-1 a-1 a-1 a-1
A- A- A- A- A- A- A- A-(安定的) (安定的) (安定的) (安定的) (安定的) (安定的) (安定的) (安定的)(Stable) (Stable) (Stable) (Stable) (Stable) (Stable) (Stable) (Stable)
日本格付研究所( JCR) Japan Credit Rating Agency, Ltd. (JCR) 短期 Short-Term J-2 J-1 J-1 J-1 J-1 J-1 J-1 J-1
BBB+ A- A- A- A- A- A- A-(ポジティブ) (安定的) (安定的) (安定的) (安定的) (安定的) (安定的) (安定的)(Positive) (Stable) (Stable) (Stable) (Stable) (Stable) (Stable) (Stable)
Standard and Poor's (S&P) Standard and Poor's (S&P) 短期 Short-Term A-2 A-2 A-2 A-2 A-2 A-2 A-2 A-2
BBB+ BBB+ BBB+ BBB+ BBB+ BBB+ BBB+ BBB+(ポジティブ) (ポジティブ) (ポジティブ) (ポジティブ) (ポジティブ) (安定的) (安定的) (安定的)(Positive) (Positive) (Positive) (Positive) (Positive) (Stable) (Stable) (Stable)
Moody's Moody's 短期 Short-Term P-2 P-2 P-2 P-2 P-2 P-2 P-2 P-2
Baa2 Baa2 Baa2 Baa2 Baa2 Baa2 Baa1 Baa1(安定的) (安定的) (安定的) (安定的) (安定的) (安定的) (安定的) (安定的)(Stable) (Stable) (Stable) (Stable) (Stable) (Stable) (Stable) (Stable)
格付け(昭和リース) Credit Ratings (Showa Leasing) 2018.3 2018.6 2018.9 2018.12 2019.3 2019.6 2019.9 2019.12日本格付研究所( JCR) Japan Credit Rating Agency, Ltd. (JCR) 短期 Short-Term J-2 J-1 J-1 J-1 J-1 J-1 J-1 J-1
BBB+ A- A- A- A- A- A- A-(ポジティブ) (安定的) (安定的) (安定的) (安定的) (安定的) (安定的) (安定的)(Positive) (Stable) (Stable) (Stable) (Stable) (Stable) (Stable) (Stable)
格付投資情報センター( R&I) Rating and Investment Information, Inc. (R&I) 短期 Short-Term
A- A- A- A- A- A- A- A-(安定的) (安定的) (安定的) (安定的) (安定的) (安定的) (安定的) (安定的)(Stable) (Stable) (Stable) (Stable) (Stable) (Stable) (Stable) (Stable)
格付け(新生証券) Credit Ratings (Shinsei Securities) 2018.3 2018.6 2018.9 2018.12 2019.3 2019.6 2019.9 2019.12日本格付研究所( JCR) Japan Credit Rating Agency, Ltd. (JCR)
BBB+ A- A- A- A- A- A- A-(ポジティブ) (安定的) (安定的) (安定的) (安定的) (安定的) (安定的) (安定的)(Positive) (Stable) (Stable) (Stable) (Stable) (Stable) (Stable) (Stable)
格付け(アプラスフィナンシャル) Credit Ratings (APLUS FINANCIAL) 2018.3 2018.6 2018.9 2018.12 2019.3 2019.6 2019.9 2019.12格付投資情報センター( R&I) Rating and Investment Information, Inc. (R&I) 短期 Short-Term a-1 a-1 a-1 a-1 a-1 a-1 a-1 a-1
A- A- A- A- A- A- A- A-(安定的) (安定的) (安定的) (安定的) (安定的) (安定的) (安定的) (安定的)(Stable) (Stable) (Stable) (Stable) (Stable) (Stable) (Stable) (Stable)
格付け(新生フィナンシャル) Credit Ratings (Shinsei Financial) 2018.3 2018.6 2018.9 2018.12 2019.3 2019.6 2019.9 2019.12格付投資情報センター( R&I) Rating and Investment Information, Inc. (R&I)
A- A- A- A- A- A- A- A-(安定的) (安定的) (安定的) (安定的) (安定的) (安定的) (安定的) (安定的)(Stable) (Stable) (Stable) (Stable) (Stable) (Stable) (Stable) (Stable)
長期 Long-Term
長期 Long-Term
長期 Long-Term
長期 Long-Term
長期 Long-Term
長期 Long-Term
長期 Long-Term
長期 Long-Term
長期 Long-Term
15

連結対象会社数 Subsidiaries and Affiliates Data 2018.3 2018.6 2018.9 2018.12 2019.3 2019.6 2019.9 2019.12 連結子会社数 Consolidated Subsidiaries 83 80 81 80 83 86 90 89 持分法適用会社数 Affiliates Accounted for Using the Equity Method 30 31 32 34 35 39 39 39連結対象会社数 Total Number of Consolidated Subsidiaries and Affiliates 113 111 113 114 118 125 129 128
その他主要データ Other Key Data 2018.3 2018.6 2018.9 2018.12 2019.3 2019.6 2019.9 2019.12店舗数(本支店・出張所数・本支店内室) Total Number of Outlets 32 30 30 30 29 29 29 29 本支店 Head Office and Branches 28 26 26 26 26 26 26 26 出張所 Annexes 4 4 4 4 3 3 3 3リテール店舗形態 Retail Banking Business Category 新生フィナンシャルセンター Shinsei Financial Centers 29 27 27 27 27 27 27 27 コンサルティングスポット Shinsei Consulting Spots 1 1 1 1 1 1 1 1 住宅ローンセンター Housing Loan Centers 7 7 7 7 6 6 6 6ATM台数 Number of ATMs - - - - - - - -提携ネットワークATM台数(駅・コンビニATM等) Partner (Train Station, Convenience Store, etc.) ATMs 56,881 57,144 57,354 57,832 58,084 58,074 58,214 58,135従業員数(連結) Number of Employees (Consolidated Basis) 5,307 5,398 5,302 5,231 5,179 5,344 5,430 5,405 法人業務 Institutional Business 1,399 1,416 1,390 1,337 1,315 1,348 1,409 1,389 法人営業 Corporate Business 424 397 ストラクチャードファイナンス Structured Finance 149 145 プリンシパルトランザクションズ Principal Transactions 158 150 昭和リース Showa Leasing 500 468 市場営業 Markets 62 54 その他金融市場 Other Global Markets 106 101 個人業務 Individual Business 3,147 3,214 3,144 3,098 3,073 3,195 3,231 3,229 リテールバンキング Retail Banking 776 808 新生フィナンシャル Shinsei Financial and Shinsei Bank Lake 927 908 アプラスフィナンシャル APLUS FINANCIAL 1,349 1,261 その他個人 Other Individual 95 96 経営勘定/その他 Corporate/Other 761 768 768 796 791 801 790 787従業員数(単体) Number of Employees (Nonconsolidated Basis) 2,392 2,303 2,279 2,277 2,248 2,292 2,249 2,223注記: 1. 住宅ローンセンターには、新生フィナンシャルセンター又はコンサルティングスポットを兼ねる店舗も含まれます。
2. 前期の数字は今期の表記に調整されています。
3. 金融インフラ業務の従業員数は「経営/その他」に含めております。
Note: 1. Housing Loan Centers include outlets which are combined with Shinsei Financial Centers or Shinsei Consulting Spots. 2. Previous periods have been adjusted to conform to current period presentation. 3. Corporate/Others includes employees for banking IT infrastructure.
16
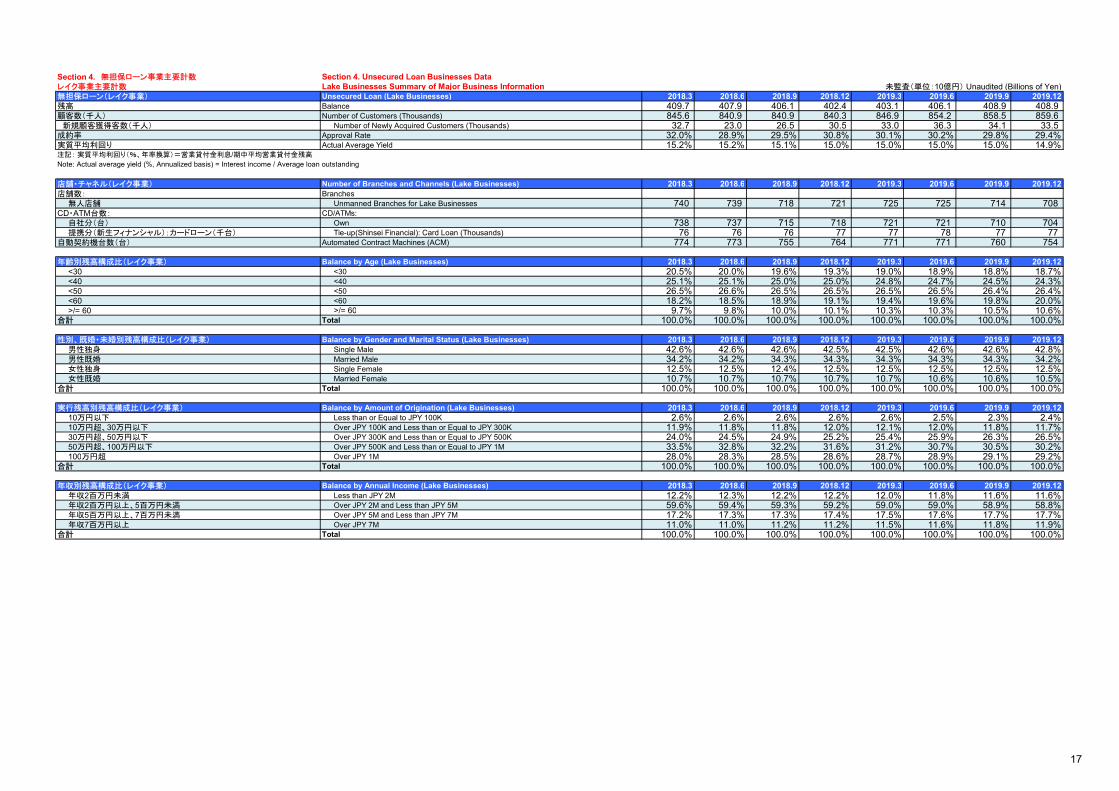
Section 4. 無担保ローン事業主要計数 Section 4. Unsecured Loan Businesses Dataレイク事業主要計数 Lake Businesses Summary of Major Business Information 未監査(単位:10億円) Unaudited (Billions of Yen)無担保ローン(レイク事業) Unsecured Loan (Lake Businesses) 2018.3 2018.6 2018.9 2018.12 2019.3 2019.6 2019.9 2019.12残高 Balance 409.7 407.9 406.1 402.4 403.1 406.1 408.9 408.9 顧客数(千人) Number of Customers (Thousands) 845.6 840.9 840.9 840.3 846.9 854.2 858.5 859.6 新規顧客獲得客数(千人) Number of Newly Acquired Customers (Thousands) 32.7 23.0 26.5 30.5 33.0 36.3 34.1 33.5 成約率 Approval Rate 32.0% 28.9% 29.5% 30.8% 30.1% 30.2% 29.8% 29.4%実質平均利回り Actual Average Yield 15.2% 15.2% 15.1% 15.0% 15.0% 15.0% 15.0% 14.9%注記: 実質平均利回り(%、年率換算)=営業貸付金利息/期中平均営業貸付金残高
Note: Actual average yield (%, Annualized basis) = Interest income / Average loan outstanding
店舗・チャネル(レイク事業) Number of Branches and Channels (Lake Businesses) 2018.3 2018.6 2018.9 2018.12 2019.3 2019.6 2019.9 2019.12店舗数: Branches 無人店舗 Unmanned Branches for Lake Businesses 740 739 718 721 725 725 714 708CD・ATM台数: CD/ATMs: 自社分(台) Own 738 737 715 718 721 721 710 704 提携分(新生フィナンシャル):カードローン(千台) Tie-up(Shinsei Financial): Card Loan (Thousands) 76 76 76 77 77 78 77 77自動契約機台数(台) Automated Contract Machines (ACM) 774 773 755 764 771 771 760 754
年齢別残高構成比(レイク事業) Balance by Age (Lake Businesses) 2018.3 2018.6 2018.9 2018.12 2019.3 2019.6 2019.9 2019.12 <30 <30 20.5% 20.0% 19.6% 19.3% 19.0% 18.9% 18.8% 18.7% <40 <40 25.1% 25.1% 25.0% 25.0% 24.8% 24.7% 24.5% 24.3% <50 <50 26.5% 26.6% 26.5% 26.5% 26.5% 26.5% 26.4% 26.4% <60 <60 18.2% 18.5% 18.9% 19.1% 19.4% 19.6% 19.8% 20.0% >/= 60 >/= 60 9.7% 9.8% 10.0% 10.1% 10.3% 10.3% 10.5% 10.6%合計 Total 100.0% 100.0% 100.0% 100.0% 100.0% 100.0% 100.0% 100.0%
性別、既婚・未婚別残高構成比(レイク事業) Balance by Gender and Marital Status (Lake Businesses) 2018.3 2018.6 2018.9 2018.12 2019.3 2019.6 2019.9 2019.12 男性独身 Single Male 42.6% 42.6% 42.6% 42.5% 42.5% 42.6% 42.6% 42.8% 男性既婚 Married Male 34.2% 34.2% 34.3% 34.3% 34.3% 34.3% 34.3% 34.2% 女性独身 Single Female 12.5% 12.5% 12.4% 12.5% 12.5% 12.5% 12.5% 12.5% 女性既婚 Married Female 10.7% 10.7% 10.7% 10.7% 10.7% 10.6% 10.6% 10.5%合計 Total 100.0% 100.0% 100.0% 100.0% 100.0% 100.0% 100.0% 100.0%
実行残高別残高構成比(レイク事業) Balance by Amount of Origination (Lake Businesses) 2018.3 2018.6 2018.9 2018.12 2019.3 2019.6 2019.9 2019.12 10万円以下 Less than or Equal to JPY 100K 2.6% 2.6% 2.6% 2.6% 2.6% 2.5% 2.3% 2.4% 10万円超、30万円以下 Over JPY 100K and Less than or Equal to JPY 300K 11.9% 11.8% 11.8% 12.0% 12.1% 12.0% 11.8% 11.7% 30万円超、50万円以下 Over JPY 300K and Less than or Equal to JPY 500K 24.0% 24.5% 24.9% 25.2% 25.4% 25.9% 26.3% 26.5% 50万円超、100万円以下 Over JPY 500K and Less than or Equal to JPY 1M 33.5% 32.8% 32.2% 31.6% 31.2% 30.7% 30.5% 30.2% 100万円超 Over JPY 1M 28.0% 28.3% 28.5% 28.6% 28.7% 28.9% 29.1% 29.2%合計 Total 100.0% 100.0% 100.0% 100.0% 100.0% 100.0% 100.0% 100.0%
年収別残高構成比(レイク事業) Balance by Annual Income (Lake Businesses) 2018.3 2018.6 2018.9 2018.12 2019.3 2019.6 2019.9 2019.12 年収2百万円未満 Less than JPY 2M 12.2% 12.3% 12.2% 12.2% 12.0% 11.8% 11.6% 11.6% 年収2百万円以上、5百万円未満 Over JPY 2M and Less than JPY 5M 59.6% 59.4% 59.3% 59.2% 59.0% 59.0% 58.9% 58.8% 年収5百万円以上、7百万円未満 Over JPY 5M and Less than JPY 7M 17.2% 17.3% 17.3% 17.4% 17.5% 17.6% 17.7% 17.7% 年収7百万円以上 Over JPY 7M 11.0% 11.0% 11.2% 11.2% 11.5% 11.6% 11.8% 11.9%合計 Total 100.0% 100.0% 100.0% 100.0% 100.0% 100.0% 100.0% 100.0%
17

未監査(単位:10億円) Unaudited (Billions of Yen)貸出金利帯別残高(レイク事業) Breakdown of Loans by Lending Rates (Lake Businesses) 2018.3 2018.6 2018.9 2018.12 2019.3 2019.6 2019.9 2019.12残高: Balance: ~ 15% ~ 15% 177.4 177.4 178.3 178.1 178.4 179.0 181.2 180.5 ~ 18% ~ 18% 230.7 229.0 226.5 223.0 223.5 225.9 226.6 227.4 ~ 20% ~ 20% 0.1 0.1 0.1 0.1 0.1 0.1 0.1 0.0 ~ 25% ~ 25% 0.5 0.5 0.5 0.4 0.4 0.4 0.4 0.3 ~ 29.2% ~ 29.2% 0.7 0.7 0.6 0.6 0.6 0.5 0.5 0.5 >/= 29.2% Over 29.2% 0.0 0.0 0.0 0.0 0.0 0.0 0.0 0.0合計 Total 409.7 407.9 406.1 402.4 403.1 406.1 408.9 408.9比率: Ratios: ~ 15% ~ 15% 43.4% 43.5% 43.9% 44.3% 44.2% 44.2% 44.4% 44.2% ~ 18% ~ 18% 56.3% 56.2% 55.8% 55.4% 55.5% 55.6% 55.4% 55.6% ~ 20% ~ 20% 0.0% 0.0% 0.0% 0.0% 0.0% 0.0% 0.0% 0.0% ~ 25% ~ 25% 0.1% 0.1% 0.1% 0.1% 0.1% 0.1% 0.1% 0.1% ~ 29.2% ~ 29.2% 0.2% 0.2% 0.2% 0.2% 0.2% 0.1% 0.1% 0.1% >/= 29.2% Over 29.2% 0.0% 0.0% 0.0% 0.0% 0.0% 0.0% 0.0% 0.0%合計 Total 100.0% 100.0% 100.0% 100.0% 100.0% 100.0% 100.0% 100.0%注記: 旧金利体系で契約し、貸金業法完全施行後においても、新たな貸付が発生していない債権の一部については、金利を旧金利体系のまま据え置いており、金利体系として20%超に分類される債権は存在しております。
Note: Interest rates for receivables whose contracts were made under the previous interest rate system, and for which there has been no new borrowing, are not required to be changed after the full implementation of the revised Money-Lending Business Control and Regulation Law. As a result, some receivables are classified as having interest rates of over 20%.
債務者区分別残高(レイク事業) Balance by Obligor Classification (Lake Businesses) 2018.3 2018.6 2018.9 2018.12 2019.3 2019.6 2019.9 2019.12残高: Balance:
正常先 Normal 372.8 370.1 366.6 363.5 363.2 365.8 366.9 367.4要注意先 Need Caution 4.2 3.8 4.6 3.3 3.8 3.9 4.5 3.3要管理先 Substandard 19.7 20.9 21.7 22.9 23.5 24.0 25.0 26.1破綻先 Possibly Bankrupt 5.1 4.9 5.1 4.5 4.5 4.6 4.7 4.4実質破綻先・破綻先 Virtually Bankrupt, Legally Bankrupt 7.7 8.0 7.9 8.0 7.8 7.5 7.5 7.5
18
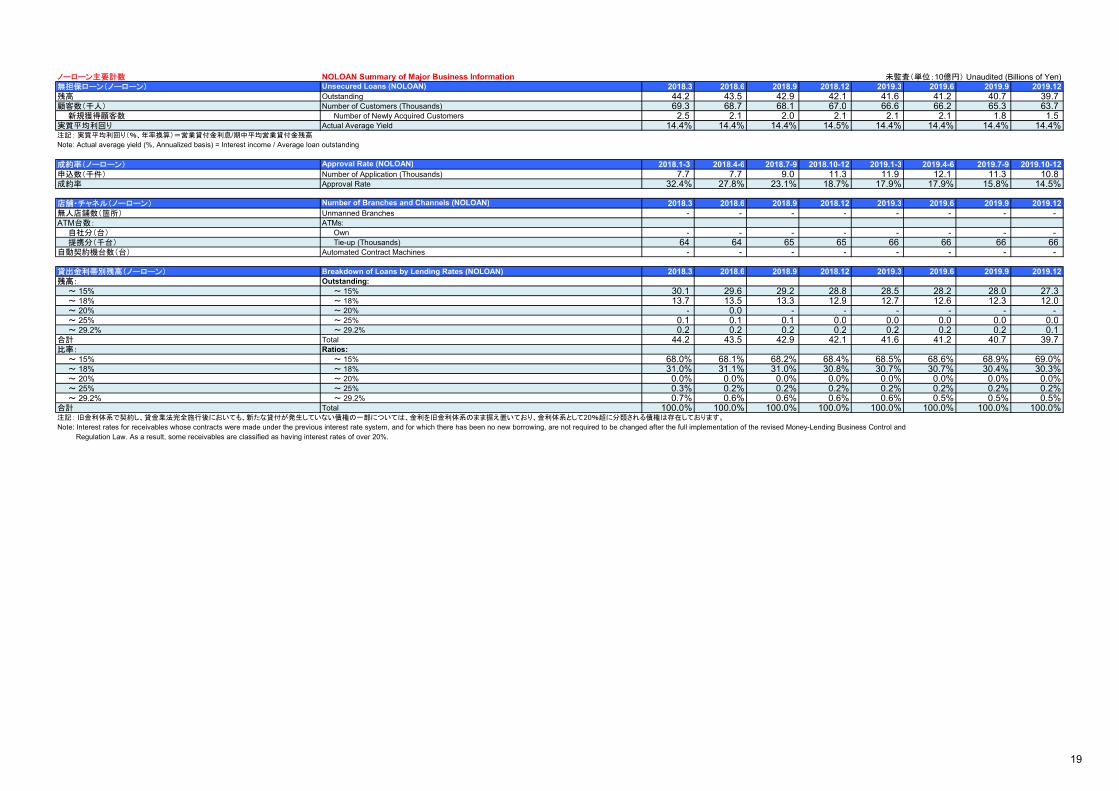
ノーローン主要計数 NOLOAN Summary of Major Business Information 未監査(単位:10億円) Unaudited (Billions of Yen)無担保ローン(ノーローン) 2018.3 2018.6 2018.9 2018.12 2019.3 2019.6 2019.9 2019.12残高 Outstanding 44.2 43.5 42.9 42.1 41.6 41.2 40.7 39.7顧客数(千人) Number of Customers (Thousands) 69.3 68.7 68.1 67.0 66.6 66.2 65.3 63.7 新規獲得顧客数 Number of Newly Acquired Customers 2.5 2.1 2.0 2.1 2.1 2.1 1.8 1.5実質平均利回り Actual Average Yield 14.4% 14.4% 14.4% 14.5% 14.4% 14.4% 14.4% 14.4%注記: 実質平均利回り(%、年率換算)=営業貸付金利息/期中平均営業貸付金残高
Note: Actual average yield (%, Annualized basis) = Interest income / Average loan outstanding
成約率(ノーローン) 2018.1-3 2018.4-6 2018.7-9 2018.10-12 2019.1-3 2019.4-6 2019.7-9 2019.10-12申込数(千件) Number of Application (Thousands) 7.7 7.7 9.0 11.3 11.9 12.1 11.3 10.8成約率 Approval Rate 32.4% 27.8% 23.1% 18.7% 17.9% 17.9% 15.8% 14.5%
店舗・チャネル(ノーローン) 2018.3 2018.6 2018.9 2018.12 2019.3 2019.6 2019.9 2019.12無人店舗数(箇所) Unmanned Branches - - - - - - - - ATM台数: ATMs: 自社分(台) Own - - - - - - - - 提携分(千台) Tie-up (Thousands) 64 64 65 65 66 66 66 66自動契約機台数(台) Automated Contract Machines - - - - - - - -
貸出金利帯別残高(ノーローン) Breakdown of Loans by Lending Rates (NOLOAN) 2018.3 2018.6 2018.9 2018.12 2019.3 2019.6 2019.9 2019.12残高: Outstanding: ~ 15% ~ 15% 30.1 29.6 29.2 28.8 28.5 28.2 28.0 27.3 ~ 18% ~ 18% 13.7 13.5 13.3 12.9 12.7 12.6 12.3 12.0 ~ 20% ~ 20% - 0.0 - - - - - - ~ 25% ~ 25% 0.1 0.1 0.1 0.0 0.0 0.0 0.0 0.0 ~ 29.2% ~ 29.2% 0.2 0.2 0.2 0.2 0.2 0.2 0.2 0.1合計 Total 44.2 43.5 42.9 42.1 41.6 41.2 40.7 39.7比率: Ratios: ~ 15% ~ 15% 68.0% 68.1% 68.2% 68.4% 68.5% 68.6% 68.9% 69.0% ~ 18% ~ 18% 31.0% 31.1% 31.0% 30.8% 30.7% 30.7% 30.4% 30.3% ~ 20% ~ 20% 0.0% 0.0% 0.0% 0.0% 0.0% 0.0% 0.0% 0.0% ~ 25% ~ 25% 0.3% 0.2% 0.2% 0.2% 0.2% 0.2% 0.2% 0.2% ~ 29.2% ~ 29.2% 0.7% 0.6% 0.6% 0.6% 0.6% 0.5% 0.5% 0.5%合計 Total 100.0% 100.0% 100.0% 100.0% 100.0% 100.0% 100.0% 100.0%注記: 旧金利体系で契約し、貸金業法完全施行後においても、新たな貸付が発生していない債権の一部については、金利を旧金利体系のまま据え置いており、金利体系として20%超に分類される債権は存在しております。
Note: Interest rates for receivables whose contracts were made under the previous interest rate system, and for which there has been no new borrowing, are not required to be changed after the full implementation of the revised Money-Lending Business Control and Regulation Law. As a result, some receivables are classified as having interest rates of over 20%.
Unsecured Loans (NOLOAN)
Approval Rate (NOLOAN)
Number of Branches and Channels (NOLOAN)
19

未監査(単位:10億円) Unaudited (Billions of Yen)年齢別残高構成比(ノーローン) Balance by Age (NOLOAN) 2018.3 2018.6 2018.9 2018.12 2019.3 2019.6 2019.9 2019.12 <30 <30 2.4% 2.3% 2.3% 2.3% 2.4% 2.5% 2.5% 2.6% <40 <40 15.2% 14.6% 14.1% 13.6% 13.2% 12.7% 12.3% 11.7% <50 <50 36.8% 36.8% 36.4% 36.0% 35.5% 35.2% 34.9% 34.6% <60 <60 29.9% 30.4% 30.9% 31.5% 31.8% 32.4% 32.9% 33.4% >/= 60 >/= 60 15.7% 15.9% 16.3% 16.6% 17.1% 17.2% 17.4% 17.7%合計 Total 100.0% 100.0% 100.0% 100.0% 100.0% 100.0% 100.0% 100.0%
性別、既婚・未婚別残高構成比(ノーローン) Balance by Gender and Marital Status (NOLOAN) 2018.3 2018.6 2018.9 2018.12 2019.3 2019.6 2019.9 2019.12 男性独身 Single Male 37.4% 37.5% 37.5% 37.4% 37.5% 37.8% 37.9% 37.9% 男性既婚 Married Male 51.6% 51.5% 51.5% 51.6% 51.6% 51.3% 51.2% 51.2% 女性独身 Single Female 6.0% 6.0% 6.0% 6.0% 5.9% 5.9% 5.9% 5.9% 女性既婚 Married Female 5.0% 5.0% 5.0% 5.0% 5.0% 5.0% 5.0% 5.0%合計 Total 100.0% 100.0% 100.0% 100.0% 100.0% 100.0% 100.0% 100.0%
実行残高別残高構成比(ノーローン) Balance by Amount of Origination (NOLOAN) 2018.3 2018.6 2018.9 2018.12 2019.3 2019.6 2019.9 2019.12 10万円未満 Less than JPY 100K 1.7% 1.7% 1.8% 1.8% 1.8% 1.9% 1.9% 2.0% 10万円以上、30万円未満 Over JPY 100K and Less than JPY 300K 6.6% 6.7% 6.7% 6.7% 6.8% 6.8% 6.7% 6.6% 30万円以上、50万円未満 Over JPY 300K and Less than JPY 500K 13.9% 14.0% 14.1% 14.3% 14.3% 14.4% 14.4% 14.4% 50万円以上、100万円未満 Over JPY 500K and Less than JPY 1M 21.7% 21.8% 21.8% 21.7% 21.5% 21.4% 21.4% 21.5% 100万円以上 Over JPY 1M 56.1% 55.8% 55.6% 55.5% 55.6% 55.5% 55.6% 55.5%合計 Total 100.0% 100.0% 100.0% 100.0% 100.0% 100.0% 100.0% 100.0%
年収別残高構成比(ノーローン) Balance by Annual Income (NOLOAN) 2018.3 2018.6 2018.9 2018.12 2019.3 2019.6 2019.9 2019.12 年収2百万円未満 Less than JPY 2M 5.9% 5.8% 5.9% 6.0% 6.0% 6.0% 5.9% 6.0% 年収2百万円以上、5百万円未満 Over JPY 2M and Less than JPY 5M 47.1% 47.1% 46.9% 46.7% 46.4% 46.3% 46.0% 46.0% 年収5百万円以上、7百万円未満 Over JPY 5M and Less than JPY 7M 24.1% 24.3% 24.3% 24.2% 24.3% 24.4% 24.5% 24.4% 年収7百万円以上 Over JPY 7M 22.9% 22.8% 22.9% 23.1% 23.3% 23.3% 23.6% 23.6%合計 Total 100.0% 100.0% 100.0% 100.0% 100.0% 100.0% 100.0% 100.0%
20

利息返還関連 Grey Zone Related Information 未監査(単位:10億円) Unaudited (Billions of Yen)利息返還関連(新生フィナンシャル) Grey Zone Related Information (Shinsei Financial) 2018.1-3 2018.4-6 2018.7-9 2018.10-12 2019.1-3 2019.4-6 2019.7-9 2019.10-12利息返還額 Amount of Refund for Grey Zone Claim 2.6 2.7 2.5 2.4 2.4 2.0 1.9 2.0 債権放棄額 Amount of Debt Write-Off 0.2 0.3 0.3 0.2 0.2 0.2 0.2 0.2 キャッシュアウト利息返還額 キャッシュアウト利息返還額Amount of Interest Repayment 2.3 2.3 2.1 2.1 2.2 1.7 1.6 1.7利息返還損失引当金 Reserve for Losses on Interest Repayment 61.1 58.4 54.3 51.8 50.1 48.1 44.5 42.5 利息返還損失引当金繰入 利息返還損失引当金繰入額Net Provisions of Reserve for Losses on Interest Repayment -7.8 0.0 -1.5 - -4.0 - -1.6 - 利息返還損失引当金使用額 利息返還損失引当金使用額Usage of Reserve for Losses on Interest Repayment 2.6 2.7 2.5 2.4 2.4 2.0 1.9 2.0開示請求件数 Number of Claims 4,050 4,400 3,955 4,037 3,803 3,875 3,627 3,595 注記: 1. 2014年3月末に1,750億円の対価を受領し、同日を以ってGEによる過払い利息返還損失補償は終了しました。
2. 利息返還損失引当金の繰入額と使用額は、貸倒引当金取崩益に計上されているものを除いた金額に変更しております。
Note: 1. The GE indemnity for losses on interest repayment has been concluded as of March 31, 2014 in exchange for a payment of JPY175.0 billion received on the same day as the conclusion of the indemnity. 2. Figures for provision and usage amounts of reserves for losses on interest repayment have been retroactively altered to be net of reversals of reserves for loan losses.
利息返還関連(ノーローン) Grey Zone Related Information (NOLOAN) 2018.1-3 2018.4-6 2018.7-9 2018.10-12 2019.1-3 2019.4-6 2019.7-9 2019.10-12利息返還額 Amount of Refund for Grey Zone Claim 0.3 0.3 0.3 0.3 0.4 0.3 0.3 0.3 債権放棄額 Amount of Debt Write-Off 0.0 0.0 0.0 0.0 0.0 0.0 0.0 0.0 キャッシュアウト利息返還額 Amount of Interest Repayment 0.3 0.3 0.3 0.3 0.4 0.2 0.3 0.3 利息返還損失引当金 Reserve for Losses on Interest Repayment 7.4 7.0 6.5 6.1 5.6 5.3 5.4 5.1 利息返還損失引当金繰入額 Provisions of Reserve for Losses on Interest Repayment 2.7 - -0.1 - - - 0.4 - 利息返還損失引当金使用額 Usage of Reserve for Losses on Interest Repayment 0.3 0.3 0.3 0.3 0.4 0.3 0.3 0.3 開示請求件数 Number of Claims 802 866 775 854 855 835 829 869
利息返還関連(アプラスフィナンシャル) Grey Zone Related Information (APLUS FINANCIAL) 2018.1-3 2018.4-6 2018.7-9 2018.10-12 2019.1-3 2019.4-6 2019.7-9 2019.10-12利息返還額 Amount of Refund for Grey Zone Claim 0.6 0.5 0.6 0.6 0.4 0.4 0.5 0.5 債権放棄額 Amount of Debt Write-Off 0.0 0.0 0.0 0.0 0.0 0.0 0.0 0.0 キャッシュアウト利息返還額 Amount of Interest Repayment 0.5 0.5 0.6 0.6 0.4 0.4 0.5 0.4 利息返還損失引当金 Reserve for Losses on Interest Repayment 6.1 5.4 4.9 4.1 7.1 6.7 6.1 5.6 利息返還損失引当金繰入額 Provisions of Reserve for Losses on Interest Repayment 3.0 - - - 3.5 - - - 利息返還損失引当金使用額 Usage of Reserve for Losses on Interest Repayment 0.6 0.6 0.5 0.7 0.5 0.3 0.5 0.5 開示請求件数 Number of Claims 1,651 1,657 1,375 1,348 1,349 1,855 1,829 1,637注記: 利息返還額のうち債権放棄額には会計上既に償却している債権を一部含んでいることなどから、利息返還額と会計上(利息損失引当金使用額)の金額とは異なっています。
Note: The "loan receivables write-off" amount included in "the amount of refund for grey zone claim" is different from or higher than the accounting loss since a portion of the "loan receivables write-off" includes the amount which has already been recorded as a write-off on an accounting basis.
21

Section 5. 主要子会社の財務データ他 Section 5. Subsidiaries' Financial and Business Data
未監査(単位:10億円) Unaudited (Billions of Yen)連結損益計算書 Consolidated Statements of Income 2018.1-3 2018.4-6 2018.7-9 2018.10-12 2019.1-3 2019.4-6 2019.7-9 2019.10-12経常収益 Ordinary Income 18.6 13.7 15.8 14.7 18.5 14.6 16.2 15.8 資金運用収益 Interest Income 5.8 5.7 5.8 5.9 6.2 6.5 6.9 7.2 役務取引等収益 Fees and Commissions Income 5.6 5.7 5.7 6.2 5.8 5.7 5.6 5.5 その他業務収益 Other Business Income 0.0 - - - - - - - その他経常収益 Other Ordinary Income 7.2 2.1 4.3 2.4 6.3 2.2 3.5 3.0 経常費用 Ordinary Expenses 10.9 12.6 12.1 10.9 13.2 12.4 12.5 11.3 資金調達費用 Interest Expenses 0.0 0.0 0.0 0.0 0.0 0.0 0.0 0.0 役務取引等費用 Fees and Commissions Expenses 0.6 0.7 0.7 0.7 1.1 1.2 1.1 1.0 その他業務費用 Other Business Expenses - - - - - - - - 営業経費 General and Administrative Expenses 3.6 5.6 5.6 5.9 6.2 6.0 6.0 6.0 その他経常費用 Other Ordinary Expenses 6.6 6.2 5.6 4.1 5.7 5.1 5.1 4.0 貸倒引当金繰入額 Provision of Reserve for Credit Losses 6.4 6.0 5.0 3.9 5.5 4.9 4.8 3.9 その他 Other 0.2 0.1 0.6 0.1 0.1 0.1 0.3 0.1 経常利益 Ordinary Profit 7.7 1.0 3.7 3.7 5.3 2.1 3.7 4.5 特別利益 Extraordinary Gains 0.5 - 0 - - - - - 特別損失 Extraordinary Losses 0.0 - 0.0 0.0 0.0 0.0 0.0 0.1 税引前四半期純利益 Income before Income Taxes 8.2 1.0 3.6 3.7 5.3 2.1 3.7 4.4 税金 Income Taxes (Benefit) 0.4 0.1 0.0 -0.1 0.3 0.0 -0.7 0.1 非支配株主に帰属する四半期純利益 Profit Attributable to Noncontrolling Interests - - - - - - - -親会社株主に帰属する四半期純利益 Profit Attributable to Owners of the Parent 7.8 0.9 3.6 3.9 4.9 2.1 4.4 4.2
連結貸借対照表 Consolidated Balance Sheets 2018.3 2018.6 2018.9 2018.12 2019.3 2019.6 2019.9 2019.12資産の部: Assets: 現金預け金 Cash and Due from Banks 22.9 14.9 35.9 30.3 18.1 26.6 16.1 12.0 有価証券 Securities 66.5 66.5 66.5 66.5 66.5 66.5 66.5 66.5 貸出金 Loans and Bills Discounted 184.8 187.7 191.3 194.6 211.4 214.3 222.6 228.6 その他資産 Other Assets 5.3 6.9 6.1 6.7 6.4 12.2 11.6 12.2 割賦売掛金 Installment Receivables 0.0 - - - - - - - 有形固定資産 Premises and Equipment 5.8 5.9 6.0 6.1 6.4 6.2 6.1 6.0 無形固定資産 Intangible Assets 1.8 1.9 1.8 1.7 2.8 2.6 2.5 2.4 繰延税金資産 Deferred Tax Assets 11.0 11.0 10.7 10.7 10.6 10.6 10.6 10.6 貸倒引当金 Reserve for Credit Losses -42.4 -42.7 -42.1 -40.2 -40.4 -39.9 -39.5 -38.2 資産の部合計 Total Assets 255.9 252.5 276.3 276.6 281.9 299.5 296.8 300.4 負債及び純資産 Liabilities and Equity負債の部: Liabilities: 借用金 Borrowed Money 1.1 1.1 27.2 26.3 25.1 44.8 41.9 43.2 その他負債 Other Liabilities 6.7 6.1 4.5 4.3 6.0 4.8 4.1 4.2 利息返還損失引当金 Reserve for Losses on Interest Repayments 68.5 65.4 60.8 58.0 55.8 53.5 50.0 47.6 負債の部合計 Total Liabilities 82.8 78.5 98.6 95.0 95.3 110.8 103.6 102.9 純資産の部: Equity: 株主資本合計 Total Shareholders' Equity 173.0 173.9 177.6 181.6 186.5 188.6 193.1 197.4 資本金 Common Stock 0.1 0.1 0.1 0.1 0.1 0.1 0.1 0.1 純資産の部合計 Total Equity 173.0 173.9 177.6 181.6 186.5 188.6 193.1 197.4 負債及び純資産の部合計 Total Liabilities and Equity 255.9 252.5 276.3 276.6 281.9 299.5 296.8 300.4
新生フィナンシャルの、銀行の勘定科目体系に組替後の、連結損益計算書、貸借対照表データ(新生銀行への連結会計処理前)
Shinsei Financial Consolidated P/L and B/S Data, after Reclassification to Conform toBank's Financial Statements, before Consolidating to Shinsei Bank
22

未監査(単位:10億円) Unaudited (Billions of Yen)連結損益計算書 Consolidated Statements of Income 2018.1-3 2018.4-6 2018.7-9 2018.10-12 2019.1-3 2019.4-6 2019.7-9 2019.10-12経常収益 Ordinary Income 18.6 18.9 19.0 19.4 19.2 19.4 19.6 19.8 資金運用収益 Interest Income 3.4 3.4 3.4 3.3 3.1 3.1 3.1 3.1 役務取引等収益 Fees and Commissions Income 6.9 7.1 7.1 7.3 7.3 7.5 7.7 7.7 その他業務収益 Other Business Income 7.7 7.9 8.0 8.3 8.2 8.3 8.4 8.6 その他経常収益 Other Ordinary Income 0.4 0.4 0.4 0.4 0.3 0.3 0.3 0.3 経常費用 Ordinary Expenses 19.8 16.6 17.4 16.7 22.9 17.5 17.9 17.2 資金調達費用 Interest Expenses 0.5 0.5 0.6 0.6 0.6 0.6 0.6 0.6 役務取引等費用 Fees and Commissions Expenses 3.2 3.1 3.1 3.0 3.0 3.4 3.6 3.5 その他業務費用 Other Business Expenses 0.7 0.7 0.8 0.8 0.8 0.8 0.8 0.8 営業経費 General and Administrative Expenses 8.6 8.6 9.4 9.3 9.2 8.9 9.1 9.1 その他経常費用 Other Ordinary Expenses 6.5 3.4 3.3 2.8 9.1 3.6 3.6 2.9 貸倒引当金繰入額 Provision of Reserve for Credit Losses 3.5 3.4 3.3 2.8 5.6 3.6 3.6 2.9 その他 Other 3.0 0.0 0.0 0.0 3.5 0.0 0.0 0.0 経常利益 Ordinary Profit -1.1 2.3 1.5 2.7 -3.7 1.8 1.7 2.5 特別利益 Extraordinary Gains 0.0 - - - - - - - 特別損失 Extraordinary Losses 0.0 0.0 0.0 0.0 0.0 0.0 0.0 0.0 税引前四半期純利益 Income before Income Taxes -1.1 2.3 1.5 2.7 -3.7 1.8 1.7 2.5 税金 Income Taxes (Benefit) -1.0 1.4 0.0 0.0 -1.2 1.1 0.1 0.1 非支配株主に帰属する四半期純利益 Profit Attributable to Noncontrolling Interests - - - - - - - -親会社株主に帰属する四半期純利益 Profit Attributable to Owners of the Parent -0.0 0.9 1.4 2.6 -2.5 0.7 1.5 2.4
連結貸借対照表 Consolidated Balance Sheets 2018.3 2018.6 2018.9 2018.12 2019.3 2019.6 2019.9 2019.12資産の部: Assets: 現金預け金 Cash and Due from Banks 123.2 182.1 169.0 139.8 251.6 170.4 156.9 142.4 買入金銭債権 Other Monetary Claims Purchased 2.6 2.4 2.2 2.0 1.9 1.8 1.6 1.5 金銭の信託 Monetary Assets Held in Trust 116.2 113.8 111.5 109.5 106.7 104.8 103.0 101.6 有価証券 Securities 0.1 0.1 0.1 0.1 0.1 0.1 0.1 0.1 貸出金 Loans and Bills Discounted 252.0 261.8 270.4 271.9 268.2 267.4 267.0 266.8 その他資産 Other Assets 378.1 389.4 443.6 466.7 405.2 467.3 481.9 517.6 割賦売掛金 Installment Receivables 339.2 342.1 337.1 348.3 350.0 355.7 368.0 396.1 有形固定資産 Premises and Equipment 6.0 5.9 5.7 5.6 5.5 6.4 6.3 6.4 無形固定資産 Intangible Assets 17.6 25.0 23.9 23.7 23.2 22.9 22.4 21.8 のれん Goodwill - - - - - - - - 繰延税金資産 Deferred Tax Assets 6.3 4.0 4.0 3.9 5.0 4.2 4.2 4.2 支払承諾見返 Customers' Liabilities for Acceptances and Guarantees 314.3 329.9 343.9 364.6 388.6 410.9 437.0 451.9 貸倒引当金 Reserve for Credit Losses -30.5 -30.1 -31.2 -31.7 -30.3 -30.5 -31.7 -32.3 資産の部合計 Total Assets 1,196.8 1,297.1 1,357.8 1,373.0 1,444.2 1,446.5 1,472.5 1,508.4 負債及び純資産 Liabilities and Equity負債の部: Liabilities: 借用金 Borrowed Money 364.0 525.2 588.8 561.8 617.7 597.2 578.8 556.3 短期社債 Short-Term Corporate Bonds 142.7 161.4 154.9 153.8 150.0 174.5 183.6 204.6 社債 Corporate Bonds 20.0 20.0 20.0 30.0 30.0 20.0 20.0 30.0 その他負債 Other Liabilities 254.0 160.3 163.5 174.3 168.6 172.1 179.8 190.7 利息返還損失引当金 Reserve for Losses on Interest Repayments 6.1 5.4 4.9 4.1 7.1 6.7 6.1 5.6 繰延税金負債 Deferred Tax Liabilities 0.9 - - - - - - - 支払承諾 Acceptances and Guarantees 314.3 329.9 343.9 364.6 388.6 410.9 437.0 451.9 負債の部合計 Total Liabilities 1,104.0 1,203.3 1,277.6 1,290.0 1,363.7 1,382.3 1,406.7 1,440.1 純資産の部: Equity: 株主資本合計 Total Shareholders' Equity 92.7 93.6 80.0 82.6 80.1 63.7 65.3 67.7 資本金 Common Stock 15.0 15.0 15.0 15.0 15.0 15.0 15.0 15.0 純資産の部合計 Total Equity 92.8 93.7 80.2 82.9 80.5 64.2 65.7 68.2 負債及び純資産の部合計 Total Liabilities and Equity 1,196.8 1,297.1 1,357.8 1,373.0 1,444.2 1,446.5 1,472.5 1,508.4
株式会社アプラスフィナンシャルの、銀行の勘定科目体系に組替後の、連結損益計算書、貸借対照表データ(新生銀行への連結会計処理前)
APLUS FINANCIAL Consolidated P/L and B/S Data, after Reclassification toConform to Bank's Financial Statements, before Consolidating to Shinsei Bank
23

アプラスフィナンシャル開示の連結データ APLUS FINANCIAL Consolidated Data Disclosure 未監査(単位:10億円) Unaudited (Billions of Yen)連結損益の概要 Summary of Income Statement 2018.1-3 2018.4-6 2018.7-9 2018.10-12 2019.1-3 2019.4-6 2019.7-9 2019.10-12 包括信用購入あっせん Credit Card Shopping (Hokatsu ) 4.8 4.8 4.9 5.2 5.1 5.2 5.3 5.3 個別信用購入あっせん Installment Shopping Credit (Kobetsu ) 2.6 2.6 2.6 2.7 2.7 2.6 2.7 2.8 オートクレジット Auto Credit 0.8 0.8 0.7 0.7 0.7 0.6 0.6 0.6 その他ショッピングクレジット Other Shopping Credit 1.8 1.8 1.9 1.9 1.9 2.0 2.0 2.1 信用保証 Credit Guarantee 4.3 4.3 4.3 4.4 4.4 4.4 4.5 4.5 オートクレジット Auto Credit 2.0 2.0 2.0 2.0 2.0 2.0 2.0 2.0 その他ショッピングクレジット Other Shopping Credit 2.1 2.1 2.1 2.2 2.2 2.1 2.3 2.3 その他信用保証 Others 0.1 0.1 0.1 0.1 0.1 0.1 0.1 0.2 融資 Total Loans 3.4 3.4 3.3 3.3 3.1 3.1 3.1 3.1 消費者金融 Consumer Loans 3.3 3.3 3.3 3.2 3.0 3.0 3.0 3.0 カードキャッシング Cashing by Credit Card 0.9 0.9 0.9 0.9 0.9 0.9 0.9 0.9 ローンカード Loan Card 0.4 0.4 0.4 0.3 0.3 0.3 0.3 0.3 その他消費者金融 Other Consumer Loans 2.0 1.9 1.9 1.8 1.7 1.7 1.7 1.7 その他融資 Other Loans 0.0 0.0 0.0 0.0 0.0 0.0 0.0 0.0 金融収益 Financial Income 0.3 0.3 0.4 0.3 0.3 0.3 0.3 0.3 その他 Others 2.9 3.1 3.1 3.3 3.4 3.5 3.5 3.6 営業収益 Operating Revenue 18.6 18.8 19.0 19.4 19.1 19.4 19.6 19.8 販売費及び一般管理費 Total SG&A 19.1 15.9 16.7 15.9 22.2 16.8 17.2 16.5 貸倒引当金繰入額 Net Provision of Allowance for Bad Debts 3.5 3.4 3.3 2.8 5.6 3.6 3.6 2.9 従業員給料・賞与 Personnel Expenses 2.3 2.3 2.3 2.1 2.3 2.3 2.2 2.1 支払手数料 Handling Charges 5.0 5.0 5.2 5.3 5.1 5.6 5.4 5.6 販売促進費 Sales Promotion Costs 1.5 1.6 1.6 1.6 1.6 1.5 1.6 1.7 賃借料 Rent 0.4 0.4 0.4 0.4 0.4 0.4 0.4 0.4 減価償却額 Depreciation and Amortization 0.7 0.6 0.9 1.1 1.1 1.0 1.0 1.0 通信費 Communication Costs 0.5 0.5 0.5 0.4 0.4 0.4 0.4 0.4 その他 Others 4.8 1.7 2.1 1.8 5.3 1.7 2.1 2.0 金融費用 Financial Expenses 0.6 0.6 0.7 0.7 0.6 0.7 0.7 0.7 支払利息 Interest Expenses 0.5 0.5 0.6 0.6 0.6 0.6 0.6 0.6 その他 Others 0.1 0.0 0.0 0.0 0.0 0.0 0.0 0.0営業費用 Operating Expenses 19.8 16.5 17.4 16.7 22.9 17.5 17.9 17.2 営業利益 Operating Income -1.1 2.2 1.5 2.6 -3.7 1.8 1.7 2.6 経常利益 Ordinary Income -1.1 2.3 1.5 2.7 -3.7 1.8 1.7 2.5 特別損益 Net Extraordinary Profit - - - - - - - - 税引前四半期純利益 Net Income before Income Taxes and Noncontrolling Interests -1.1 2.3 1.5 2.7 -3.7 1.8 1.7 2.5 親会社株主に帰属する四半期純利益 Profit Attributable to Owners of the Parent - -0.9 1.4 2.6 -2.5 0.7 1.5 2.4
24

未監査(単位:10億円) Unaudited (Billions of Yen)営業債権残高 2018.3 2018.6 2018.9 2018.12 2019.3 2019.6 2019.9 2019.12 割賦売掛金 Total Installment Receivables 602.9 615.5 619.3 632.0 629.4 633.1 645.0 672.9 包括信用購入あっせん Credit Card Shopping (Hokatsu ) 105.2 102.7 93.4 100.3 97.4 96.1 98.5 103.7 個別信用購入あっせん Installment Shopping Credit (Kobetsu ) 234.1 239.6 244.0 248.2 252.9 259.9 269.9 292.8 オートクレジット Auto Credit 77.7 75.7 72.4 69.6 67.8 67.0 67.7 70.4 その他ショッピングクレジット Other Shopping Credit 156.4 163.8 171.6 178.6 185.0 192.8 202.2 222.4 融資 Total Loans 263.5 273.2 281.8 283.4 278.9 277.1 276.5 276.3 消費者金融 Consumer Loans 247.5 257.7 265.9 268.0 264.3 263.4 262.9 262.4 カードキャッシング Cashing by Credit Card 22.0 21.2 26.3 22.1 20.7 20.7 20.5 20.1 ローンカード Loan Card 14.0 13.0 12.5 12.0 9.9 9.4 8.7 7.9 その他消費者金融 Other Consumer Loans 211.4 223.4 227.0 233.8 233.6 233.2 233.7 234.3 その他融資 Other Loans 16.0 15.5 15.9 15.4 14.5 13.6 13.6 13.9 その他 Others - - - - - - - - 信用保証割賦売掛金 Customers' Liabilities for Acceptances and Guarantees 314.3 329.9 343.9 364.6 388.6 410.9 437.0 451.9 オートクレジット Auto Credit 159.3 165.9 169.6 173.9 181.2 185.9 191.5 192.1 (信用保証業務によるオフバランス残高) (Off-Balance Receivables in Credit Guarantee Business) 70.0 68.6 67.7 66.5 65.8 64.9 64.3 64.0 その他ショッピングクレジット Other Shopping Credit 124.5 133.7 144.4 160.3 175.7 192.3 211.0 223.0 (信用保証業務によるオフバランス残高) (Off-Balance Receivables in Credit Guarantee Business) 188.7 184.3 179.7 175.1 170.5 166.1 162.1 157.7 その他信用保証 Others 30.4 30.2 29.8 30.4 31.6 32.6 34.4 36.7 リース投資資産 Leased Investment Assets 6.4 8.4 10.2 12.3 14.2 16.4 19.1 21.7 営業債権残高合計 Total Account Receivables 923.7 953.9 973.5 1,009.0 1,032.2 1,060.5 1,101.3 1,146.6
顧客数 2018.3 2018.6 2018.9 2018.12 2019.3 2019.6 2019.9 2019.12ショッピングクレジット事業 新規信用供与件数(千件) Number of New Transactions in Shopping Credit Business (Thousands) 69.9 68.1 69.0 69.8 71.5 71.2 75.0 72.6 個別信用購入あっせん Installment Shopping Credit (Kobetsu ) 33.4 33.0 33.4 34.2 33.7 35.2 34.8 40.4 信用保証 Credit Guarantee 36.4 35.1 35.6 35.6 37.7 35.9 40.2 32.2 クレジットカード加盟店数(千店) Number of Merchants (Credit Cards) (Thousands) 420.7 n/a 326.1 n/a 326.1 n/a 327.9 n/a有効カード会員数(千人) Available Cardholders (Thousands) 5,283.0 5,236.7 5,140.2 5,172.8 5,121.9 5,040.2 4,960.0 4,914.8 クレジットカード Credit Card 5,169.8 5,137.4 5,045.5 5,087.3 5,043.4 4,984.6 4,937.2 4,895.4 ローンカード Loan Card 113.2 99.3 94.6 85.5 78.5 55.5 22.7 19.4 カード新規獲得枚数(千枚) 77.7 79.8 67.7 60.0 56.6 52.3 55.8 50.3 クレジットカード Credit Card 77.7 79.8 67.7 60.0 56.6 52.3 55.8 50.3 ローンカード Loan Card - - - - - - - -残高有口座数(千人) Number of Active Accounts (Thousands) 236.4 210.0 207.8 203.9 197.9 190.5 186.3 181.2 カードキャッシング Cashing by Credit Card 170.3 153.2 153.0 150.2 146.8 141.7 139.0 135.3 ローンカード Loan Card 66.1 56.7 54.8 53.6 51.1 48.8 47.3 45.9
店舗・チャネル 2018.3 2018.6 2018.9 2018.12 2019.3 2019.6 2019.9 2019.12店舗数(箇所) Branches 47 47 47 47 47 47 47 47CD台数(千台): Cash Dispensers (CDs) (Own and Tie-up) (Thousands) 155 n/a 156 n/a 153 n/a 151 n/a
平均貸出金利 2018.3 2018.6 2018.9 2018.12 2019.3 2019.6 2019.9 2019.12無担保ローン(カードキャッシング、ローンカード) Unsecured Loans (Cashing by Credit Card and Loan Card) 17.7% 17.7% 17.8% 17.8% 17.8% 17.8% 17.8% 17.9%
Account Receivables
Number of Branches and Channels
Average Lending Rates
Number of Customers (Thousands)
Number of New Card Issuance (Thousands)
25

未監査(単位:10億円) Unaudited (Billions of Yen)融資残高内訳 2018.3 2018.6 2018.9 2018.12 2019.3 2019.6 2019.9 2019.12貸付金利別融資残高 残高(カードキャッシング、ローンカード): Outstanding (Cashing by Credit Card and Loan Card): ~15.0% ~15.0% 10.8 8.5 8.3 8.1 7.8 7.1 6.8 6.4 ~18.0% ~18.0% 39.4 34.6 34.9 34.4 33.6 32.5 31.9 30.9 ~20.0% ~20.0% 0.9 0.9 0.9 0.9 0.9 0.9 0.9 0.9 ~25.0% ~25.0% 2.4 2.4 2.3 2.3 2.2 2.2 2.2 2.2 ~29.2% ~29.2% 0.8 0.8 0.8 0.8 0.7 0.7 0.7 0.7 合計 Total 54.5 47.4 47.5 46.8 45.4 43.5 42.6 41.2 比率(カードキャッシング、ローンカード): Ratios (Cashing by Credit Card and Loan Card): ~15.0% ~15.0% 19.8% 18.0% 17.7% 17.5% 17.2% 16.3% 16.0% 15.6% ~18.0% ~18.0% 72.4% 73.1% 73.5% 73.6% 74.0% 74.6% 74.9% 75.0% ~20.0% ~20.0% 1.8% 2.1% 2.0% 2.1% 2.1% 2.1% 2.1% 2.2% ~25.0% ~25.0% 4.4% 5.1% 5.0% 5.1% 5.1% 5.3% 5.3% 5.5% ~29.2% ~29.2% 1.5% 1.8% 1.7% 1.8% 1.6% 1.7% 1.7% 1.7%合計 Total 100.0% 100.0% 100.0% 100.0% 100.0% 100.0% 100.0% 100.0%カードタイプ別融資残高 カードキャッシング Cashing by Credit Card 29.4 25.7 26.3 26.0 25.7 25.0 24.7 24.1 ローンカード Loan Card 25.1 21.6 21.2 20.7 19.7 18.5 17.8 17.1 合計 Total 54.5 47.4 47.5 46.8 45.4 43.5 42.6 41.2 注記: 旧金利体系で契約し、貸金業法完全施行後においても、新たな貸付が発生していない債権の一部については、金利を旧金利体系のまま据え置いており、金利体系として20%超に分類される債権は存在しております。
Note: Interest rates for receivables whose contracts were made under the previous interest rate system, and for which there has been no new borrowing, are not required to be changed after the full implementation of the revised Money-Lending Business Control and Regulation Law. As a result, some receivables are classified as having interest rates of over 20%.
延滞残高、比率 2018.3 2018.6 2018.9 2018.12 2019.3 2019.6 2019.9 2019.12無担保ローン(カードキャッシング、ローンカード) Unsecured Loans (Cashing by Credit Card and Loan Card)残高 Outstanding 54.5 47.4 47.5 46.8 45.4 43.5 42.6 41.2 91~180日延滞残高 91-180 Days Delinquent Balance 0.2 0.3 0.3 0.3 0.2 0.2 0.2 0.3 91~180日延滞比率 91-180 Days Delinquency Ratio 0.5% 0.7% 0.7% 0.7% 0.6% 0.7% 0.7% 0.8%
加重平均借入金利 2018.3 2018.6 2018.9 2018.12 2019.3 2019.6 2019.9 2019.12期中加重平均 During the Fiscal Year 0.4% 0.4% 0.4% 0.4% 0.4% 0.4% 0.4% 0.4%期末加重平均 As of the Fiscal Year End 0.4% 0.4% 0.4% 0.4% 0.4% 0.4% 0.4% 0.4%
1口座あたり残高(千円) 2018.3 2018.6 2018.9 2018.12 2019.3 2019.6 2019.9 2019.121口座あたり残高 Credit Outstanding Per Account 230.5 225.8 228.7 229.5 229.7 228.6 228.7 227.3 カードキャッシング Cashing by Credit Card 172.7 168.0 171.9 173.4 175.4 176.4 178.0 178.0 ローンカード Loan Card 379.6 381.8 387.0 386.5 385.7 380.1 377.8 372.4
年齢別残高構成比 Balance by Age 2018.3 2018.6 2018.9 2018.12 2019.3 2019.6 2019.9 2019.12無担保ローン(カードキャッシング、ローンカード) Unsecured Loans (Cashing by Credit Card and Loan Card) <30 <30 3.1% 3.3% 3.4% 3.4% 3.5% 3.6% 3.6% 3.5% <40 <40 14.9% 14.9% 14.7% 14.4% 14.2% 14.1% 13.8% 13.4% <50 <50 31.2% 31.1% 30.9% 30.5% 30.1% 30.1% 29.7% 29.5% <60 <60 29.2% 29.6% 29.6% 29.9% 30.1% 30.3% 30.4% 30.7% >/= 60 >/= 60 21.6% 21.1% 21.4% 21.7% 22.0% 21.9% 22.5% 22.9%合計 Total 100.0% 100.0% 100.0% 100.0% 100.0% 100.0% 100.0% 100.0%
性別残高構成比 Balance by Gender 2018.3 2018.6 2018.9 2018.12 2019.3 2019.6 2019.9 2019.12無担保ローン(カードキャッシング、ローンカード) Unsecured Loans (Cashing by Credit Card and Loan Card) 男性 Male 69.3% 69.5% 69.4% 69.3% 69.3% 69.3% 69.2% 69.1% 女性 Female 30.7% 30.5% 30.6% 30.7% 30.7% 30.7% 30.8% 30.9%合計 Total 100.0% 100.0% 100.0% 100.0% 100.0% 100.0% 100.0% 100.0%
実行残高別残高構成比 Balance by Amount of Origination 2018.3 2018.6 2018.9 2018.12 2019.3 2019.6 2019.9 2019.12無担保ローン(カードキャッシング、ローンカード) Unsecured Loans (Cashing by Credit Card and Loan Card) 10万円未満 Less than JPY 100K 8.1% 8.6% 8.3% 8.3% 8.0% 8.2% 8.1% 8.2% 10万円以上、30万円未満 Over JPY 100K and less than JPY 300K 31.3% 31.7% 31.9% 32.2% 32.4% 33.0% 33.2% 33.5% 30万円以上、50万円未満 Over JPY 300K and less than JPY 500K 32.7% 32.3% 32.5% 32.5% 32.5% 32.9% 33.0% 33.1% 50万円以上、100万円未満 Over JPY 500K and less than JPY 1M 19.5% 18.7% 18.8% 18.6% 18.7% 18.1% 17.9% 17.7% 100万円以上 Over JPY 1M 8.4% 8.7% 8.5% 8.5% 8.3% 7.9% 7.7% 7.5%合計 Total 100.0% 100.0% 100.0% 100.0% 100.0% 100.0% 100.0% 100.0%
Loan Receivables Outstanding by Interest Rate ZoneBreakdown of Loan Receivables
Loan Receivables Outstanding by Card Type
Balance and Ratio of Delinquent Unsecured Personal Loans
Weighted Average Funding Rate
Credit Outstanding Per Account (Thousands of Yen)
26

未監査(単位:10億円) Unaudited (Billions of Yen)連結損益計算書 Consolidated Statements of Income 2018.1-3 2018.4-6 2018.7-9 2018.10-12 2019.1-3 2019.4-6 2019.7-9 2019.10-12経常収益 Ordinary Income 26.2 22.7 22.7 21.4 24.7 21.4 28.7 26.8 資金運用収益 Interest Income 0.4 0.5 0.5 0.4 0.7 0.4 0.4 0.4 役務取引等収益 Fees and Commissions Income 0.2 0.4 0.4 0.2 0.6 0.1 0.2 0.1 その他業務収益 Other Business Income 23.5 21.7 21.7 20.6 23.3 20.7 27.9 26.0 その他経常収益 Other Ordinary Income 1.9 0.0 0.0 0.0 0.0 0.1 0.0 0.0 経常費用 Ordinary Expenses 23.6 20.2 21.6 20.9 22.9 20.0 27.7 25.8 資金調達費用 Interest Expenses 0.5 0.5 0.5 0.4 0.4 0.4 0.4 0.4 役務取引等費用 Fees and Commissions Expenses 0.0 0.0 0.0 0.0 0.0 0.0 0.0 0.0 その他業務費用 Other Business Expenses 20.3 18.3 19.1 18.0 20.1 17.9 24.2 22.6 営業経費 General and Administrative Expenses 2.4 2.1 2.1 2.2 2.4 2.1 2.6 2.5 その他経常費用 Other Ordinary Expenses 0.3 -0.6 -0.2 0.1 -0.1 -0.4 0.3 0.0 貸倒引当金繰入額 Provision of Reserve for Credit Losses 0.2 -0.7 -0.2 0.0 -0.1 -0.4 0.2 0.0 その他 Other 0.0 0.0 0.0 0.0 0.0 0.0 0.0 0.0 経常利益 Ordinary Profit 2.6 2.4 1.0 0.4 1.7 1.3 0.9 1.0 特別利益 Extraordinary Gains - - 0.0 0.0 - 0.0 0.0 0.0 特別損失 Extraordinary Losses 0.0 0.0 0.0 0.0 0.0 0.0 -0.0 0.0 税引前四半期純利益 Income before Income Taxes 2.6 2.4 1.0 0.4 1.7 1.3 0.9 1.0 税金 Income Taxes (Benefit) -0.1 0.7 0.3 0.1 0.5 0.4 0.3 0.3 非支配株主に帰属する四半期純利益 Profit Attributable to Noncontrolling Interests -0.0 -0.0 0.0 -0.0 -0.0 -0.0 0.0 0.0 親会社株主に帰属する四半期純利益 Profit Attributable to Owners of the Parent 2.7 1.7 0.6 0.3 1.2 0.9 0.5 0.6
連結貸借対照表 Consolidated Balance Sheets 2018.3 2018.6 2018.9 2018.12 2019.3 2019.6 2019.9 2019.12資産の部: Assets: 現金預け金 Cash and Due from Banks 37.2 9.5 29.6 6.5 37.4 7.4 9.8 7.4 有価証券 Securities 5.4 5.8 6.0 5.3 6.0 5.5 6.5 7.1 貸出金 Loans and Bills Discounted 59.4 56.1 54.5 52.4 54.5 51.2 49.0 50.6 リース債権及びリース投資資産 Lease Receivables and Leased Investment Assets 171.4 164.6 159.2 178.1 176.5 175.2 197.7 193.8 その他資産 Other Assets 249.5 244.0 241.3 247.5 244.4 246.6 297.1 297.4 割賦売掛金 Installment Receivables 218.7 213.3 211.3 214.1 211.1 210.1 256.8 256.2 有形固定資産 Premises and Equipment 22.8 21.3 21.8 21.3 20.7 20.4 44.5 44.6 無形固定資産 Intangible Assets 4.2 4.2 4.2 4.3 4.1 4.0 4.1 4.0 繰延税金資産 Deferred Tax Assets 3.5 3.5 3.2 3.4 3.4 3.5 3.4 3.3 貸倒引当金 Reserve for Credit Losses -5.1 -4.4 -4.0 -4.1 -3.9 -3.3 -3.4 -3.5 資産の部合計 Total Assets 565.5 518.9 530.5 528.6 559.0 525.4 627.8 624.4 負債及び純資産 Liabilities and Equity負債の部: Liabilities: 借用金 Borrowed Money 337.2 299.7 302.4 281.1 317.8 272.7 377.7 354.8 短期社債 Short-Term Corporate Bonds 33.0 32.0 39.0 58.5 41.0 63.5 56.0 69.8 社債 Corporate Bonds 20.0 20.0 20.0 20.0 20.0 20.0 10.0 20.0 その他負債 Other Liabilities 68.3 60.1 61.0 61.3 70.6 63.4 75.5 70.4 繰延税金負債 Deferred Tax Liabilities - - - - - - - -負債の部合計 Total Liabilities 461.4 414.3 425.1 423.3 452.3 421.9 522.0 517.6 純資産の部 Equity: 株主資本合計 Total Shareholders' Equity 102.8 103.0 103.7 104.0 105.2 102.2 102.8 103.4 資本金 Common Stock 29.3 29.3 29.3 29.3 29.3 29.3 29.3 29.3 純資産の部合計 Total Equity 104.1 104.6 105.4 105.2 106.7 103.5 105.8 106.7 負債及び純資産の部合計 Total Liabilities and Equity 565.5 518.9 530.5 528.6 559.0 525.4 627.8 624.4
昭和リース株式会社の、銀行の勘定科目体系に組替後の、連結損益計算書、貸借対照表データ(新生銀行への連結会計処理前)
Showa Leasing Consolidated P/L and B/S Data, after Reclassification to Conformto Bank's Financial Statements, before Consolidating to Shinsei Bank
27

Section 6. 新生銀行 単体財務関連データ Section 6. Shinsei Bank Nonconsolidated P/L and B/S Data 未監査(単位:10億円) Unaudited (Billions of Yen)単体損益の概要 Results of Operations (Nonconsolidated) 2018.1-3 2018.4-6 2018.7-9 2018.10-12 2019.1-3 2019.4-6 2019.7-9 2019.10-12業務粗利益 Total Gross Business Profit 32.0 25.4 26.0 27.4 29.9 31.0 27.1 25.5 資金利益 Net Interest Income 30.6 26.5 25.0 26.0 28.8 28.0 24.2 23.3 役務取引等利益 Net Fees and Commissions -2.3 -3.3 -1.9 -1.9 -1.4 -1.1 -1.2 -0.5 特定取引利益 Net Trading Income 1.5 -0.1 0.4 1.7 2.1 1.5 1.5 0.8 その他業務利益 Net Other Business Income 2.1 2.3 2.4 1.6 0.2 2.5 2.4 1.9 経費 Total Expenses -19.5 -17.4 -17.8 -17.0 -19.1 -18.0 -18.2 -18.0 実質業務純益 Net Business Profit (Jisshitsu Gyomu Jun-eki ) 12.4 8.0 8.2 10.3 10.7 12.9 8.8 7.5 その他損益 Other Gains 0.4 -2.0 1.5 -0.1 1.9 1.4 -0.9 0.4 経常利益 Net Ordinary Income 12.9 5.9 9.8 10.1 12.6 14.3 7.8 8.0 特別損益 Extraordinary Gains -1.6 -1.0 -0.7 -0.5 -0.3 1.9 -0.1 -0.4 税引前四半期純利益 Income before Income Taxes 11.2 4.9 9.1 9.6 12.2 16.3 7.7 7.6 法人税、住民税及び事業税 Income Taxes - Current 2.2 -0.5 1.1 -1.3 -0.9 -1.6 1.4 0.3 法人税等調整額 Income Taxes - Deferred -1.1 - 0.1 - 0.9 - -1.1 -四半期純利益 Net Income 12.3 4.4 10.3 8.3 12.2 14.6 8.0 7.9
単体損益計算書 Nonconsolidated Statements of Income 2018.1-3 2018.4-6 2018.7-9 2018.10-12 2019.1-3 2019.4-6 2019.7-9 2019.10-12経常収益 Ordinary Income 46.4 38.9 39.3 40.9 44.9 44.7 41.9 40.1 資金運用収益 Interest Income 34.8 30.8 29.3 30.9 33.2 32.2 28.4 27.7 貸出金利息 Interest on Loans and Bills Discounted 24.1 25.0 25.3 25.5 25.3 25.0 24.6 24.4 有価証券利息配当金 Interest and Dividends on Securities 10.1 5.3 3.6 4.9 7.4 6.5 3.2 2.7 その他の資金運用収益 Other Interest Income 0.5 0.4 0.4 0.4 0.4 0.6 0.6 0.5 役務取引等収益 Fees and Commissions Income 4.5 3.7 5.3 5.1 5.2 5.2 5.0 5.8 特定取引収益 Trading Income 1.5 0.1 0.6 1.3 2.0 1.5 1.5 0.8 その他業務収益 Other Business Income 3.2 3.3 3.2 2.1 2.3 3.3 3.7 3.7 その他経常収益 Other Ordinary Income 2.2 0.8 0.6 1.4 2.0 2.3 3.0 1.8 貸倒引当金戻入益 Net Reversal of Reserve for Credit Losses - - - - 0.5 1.5 -1.5 - その他 Other 2.2 0.8 0.6 1.4 1.5 0.7 4.6 1.8 経常費用 Ordinary Expenses 33.5 32.9 29.4 30.7 32.3 30.3 34.0 32.0 資金調達費用 Interest Expenses 4.1 4.3 4.3 4.8 4.4 4.2 4.2 4.4 預金利息 Interest on Deposits 2.2 2.1 1.9 2.2 1.4 1.2 1.4 1.6 社債利息 Interest on Corporate Bonds 0.1 0.1 0.0 0.0 0.0 0.0 0.0 0.0 その他の資金調達費用 Other Interest Expenses 1.7 2.1 2.3 2.5 2.9 2.8 2.7 2.8 役務取引等費用 Fees and Commissions Expenses 7.5 7.4 7.5 7.4 7.1 7.0 6.9 6.9 特定取引費用 Trading Losses - 0.2 0.1 -0.3 -0.0 - - 0.0 その他業務費用 Other Business Expenses 1.0 0.9 0.7 0.4 2.0 0.7 1.2 1.8 営業経費 General and Administrative Expenses 19.5 17.5 18.0 17.2 19.6 18.1 18.3 17.9 その他経常費用 Other Ordinary Expenses 1.1 2.3 -1.3 1.0 -0.8 0.2 3.2 0.8 貸倒引当金繰入額 Provision of Reserve for Credit Losses 0.4 2.0 -1.7 0.6 -0.9 - 2.6 0.5 その他 Other 0.7 0.2 0.3 0.3 0.1 0.2 0.5 0.3 経常利益 Ordinary Profit 12.9 5.9 9.8 10.1 12.6 14.3 7.8 8.0 特別利益 Extraordinary Gains 0.0 0.2 0.0 0.0 0.0 2.1 0.0 0.0 特別損失 Extraordinary Losses 1.7 1.2 0.7 0.5 0.3 0.1 0.1 0.4 税引前四半期純利益 Income before Income Taxes 11.2 4.9 9.1 9.6 12.2 16.3 7.7 7.6 税金: Income Taxes (Benefit): 法人税、住民税及び事業税 Income Taxes (Benefits) - Current -2.2 0.5 -1.1 1.3 0.9 1.6 -1.4 -0.3 法人税等調整額 Income Taxes (Benefits) - Deferred 1.1 - -0.1 - -0.9 - 1.1 -四半期純利益 Net Income 12.3 4.4 10.3 8.3 12.2 14.6 8.0 7.9
与信関連費用 (単体) Net Credit Costs (Nonconsolidated) 2018.1-3 2018.4-6 2018.7-9 2018.10-12 2019.1-3 2019.4-6 2019.7-9 2019.10-12 貸出金償却・債権処分損 Losses on Write-Off of Loans / Losses on Sale of Loans -0.0 -0.0 -0.0 -0.0 0.0 -0.0 -0.0 0.0 貸倒引当金繰入 Net Provision of Reserve for Loan Losses -0.4 -2.0 1.7 -0.6 1.4 1.5 -4.1 -0.5 一般貸倒引当金繰入 Net Provision of General Reserve for Loan Losses -0.0 -1.5 2.8 -0.1 1.3 1.1 0.4 -1.3 個別貸倒引当金繰入 Net Provision of Specific Reserve for Loan Losses -0.3 -0.5 -1.1 -0.4 0.1 0.3 -4.6 0.8 特定海外債権引当勘定繰入 Net Provision of Reserve for Loan Losses to Restructuring Countries - - - - - - - - 償却債権取立益 Recoveries of Written-Off Claims 0.4 0.0 0.0 0.1 0.0 0.0 0.0 0.0 与信関連費用 Net Credit Costs -0.0 -2.1 1.7 -0.5 1.5 1.5 -4.1 -0.4 注記: 償却・処分損、繰入および費用は、マイナスで表記し、取立益および戻入益は、プラスで表記しております。
Note: Amounts of losses, net provision and costs are shown in minus. Amounts of recoveries and reversals are shown in plus.
28

未監査(単位:10億円) Unaudited (Billions of Yen)資金運用/調達の状況 Interest-Earning Assets and Interest-Bearing Liabilities 2018.1-3 2018.4-6 2018.7-9 2018.10-12 2019.1-3 2019.4-6 2019.7-9 2019.10-12(平均残高)(単体) (Average Balance) (Nonconsolidated)資金運用勘定: Interest-Earning Assets: 貸出金 Loans and Bills Discounted 4,665.5 4,638.0 4,726.3 4,757.7 4,820.8 4,832.4 4,852.3 4,933.5 有価証券 Securities 1,476.9 1,477.6 1,499.8 1,491.0 1,413.9 1,414.8 1,337.1 1,348.2 その他資金運用勘定 Other Interest-Earning Assets 194.6 175.8 74.3 73.3 70.3 121.6 129.5 124.6 資金運用勘定合計 Total Interest-Earning Assets 6,337.1 6,291.5 6,300.5 6,322.1 6,305.1 6,368.9 6,319.0 6,406.4 資金調達勘定: Interest-Bearing Liabilities: 預金・譲渡性預金 Deposits, including Negotiable Certificates of Deposit 6,142.1 6,146.1 6,160.0 6,165.8 6,053.6 6,020.9 5,969.2 6,141.4 借用金 Borrowed Money 269.7 258.2 219.4 210.6 204.9 192.5 158.6 145.2 劣後借入 Subordinated Debt 12.4 12.3 2.6 - - - - - その他借用金 Other Borrowed Money 257.3 245.9 216.8 210.6 204.9 192.5 158.6 145.2 社債 Corporate Bonds 45.0 42.4 45.1 48.2 42.3 42.3 42.2 67.9 劣後社債 Subordinated Bonds 25.0 22.3 15.0 13.8 - - - - その他社債 Other Corporate Bonds 20.0 20.0 30.1 34.4 42.3 42.3 42.2 67.9 その他資金調達勘定 Other Interest-Bearing Liabilities 597.2 655.0 705.7 710.7 626.6 946.7 1,006.0 959.2 資金調達勘定合計 Total Interest-Bearing Liabilities 7,054.1 7,101.9 7,130.4 7,135.4 6,927.5 7,202.5 7,176.2 7,313.9 資金運用収益-資金調達費用 Net Interest Income/Yield on Interest-Earning Assets 6,337.1 6,291.5 6,300.5 6,322.1 6,305.1 6,368.9 6,319.0 6,406.4
資金運用/調達の状況 Interest-Earning Assets and Interest-Bearing Liabilities 2018.1-3 2018.4-6 2018.7-9 2018.10-12 2019.1-3 2019.4-6 2019.7-9 2019.10-12(利息)(単体) (Interest) (Nonconsolidated)資金運用勘定: Interest-Earning Assets: 貸出金 Loans and Bills Discounted 24.1 25.0 25.3 25.5 25.3 25.0 24.6 24.4 有価証券 Securities 10.1 5.3 3.6 4.9 7.4 6.5 3.2 2.7 その他資金運用勘定 Other Interest-Earning Assets 0.5 0.4 0.4 0.4 0.4 0.6 0.6 0.5 資金運用勘定合計 Total Interest-Earning Assets 34.8 30.8 29.3 30.9 33.2 32.2 28.4 27.7 資金調達勘定: Interest-Bearing Liabilities: 預金・譲渡性預金 Deposits, including Negotiable Certificates of Deposit 2.2 2.1 1.9 2.2 1.4 1.3 1.4 1.6 借用金 Borrowed Money 0.1 0.1 0.1 0.1 0.1 0.0 -0.0 0.0 劣後借入 Subordinated Debt 0.0 0.0 0.0 - - - - - その他借用金 Other Borrowed Money 0.0 0.1 0.1 0.1 0.1 0.0 -0.0 0.0 社債 Corporate Bonds 0.1 0.1 0.0 0.0 0.0 0.0 0.0 0.0 劣後社債 Subordinated Bonds 0.1 0.1 0.0 0.0 - - - - その他社債 Other Corporate Bonds 0.0 0.0 0.0 0.0 0.0 0.0 0.0 0.0 その他資金調達勘定 Other Interest-Bearing Liabilities 1.6 1.9 2.1 2.3 2.8 2.8 2.7 2.6 資金調達勘定合計 Total Interest-Bearing Liabilities 4.1 4.3 4.3 4.8 4.4 4.2 4.2 4.4 資金運用収益-資金調達費用 Net Interest Income/Yield on Interest-Earning Assets 30.6 26.5 25.0 26.0 28.8 28.0 24.2 23.3
資金運用/調達の状況 Interest-Earning Assets and Interest-Bearing Liabilities 2018.1-3 2018.4-6 2018.7-9 2018.10-12 2019.1-3 2019.4-6 2019.7-9 2019.10-12(利回り(%))(単体) (Yield/Rate (%)) (Nonconsolidated)資金運用勘定: Interest-Earning Assets: 貸出金 Loans and Bills Discounted 2.09 2.16 2.12 2.13 2.13 2.08 2.01 1.97 有価証券 Securities 2.79 1.45 0.96 1.30 2.15 1.86 0.95 0.81 その他資金運用勘定 Other Interest-Earning Assets *** *** *** *** *** *** *** ***資金運用勘定合計 Total Interest-Earning Assets 2.23 1.96 1.85 1.94 2.14 2.03 1.79 1.72資金調達勘定: Interest-Bearing Liabilities: 預金・譲渡性預金 Deposits, including Negotiable Certificates of Deposit 0.15 0.13 0.12 0.14 0.09 0.08 0.09 0.10 借用金 Borrowed Money 0.22 0.30 0.27 0.25 0.23 0.00 -0.16 0.27 劣後借入 Subordinated Debt 2.36 2.37 2.33 - - - - - その他借用金 Other Borrowed Money 0.11 0.19 0.25 0.25 0.23 0.00 -0.16 0.27 社債 Corporate Bonds 1.35 1.26 0.72 0.61 0.20 0.20 0.19 0.20 劣後社債 Subordinated Bonds 2.20 2.14 1.68 1.66 - - - - その他社債 Other Corporate Bonds 0.29 0.29 0.24 0.19 0.20 0.20 0.19 0.20 その他資金調達勘定 Other Interest-Bearing Liabilities *** *** *** *** *** *** *** ***資金調達勘定合計 Total Interest-Bearing Liabilities 0.24 0.24 0.24 0.27 0.25 0.23 0.23 0.24資金運用収益-資金調達費用 Net Interest Income/Yield on Interest-Earning Assets 1.96 1.69 1.57 1.63 1.85 1.76 1.52 1.44
29
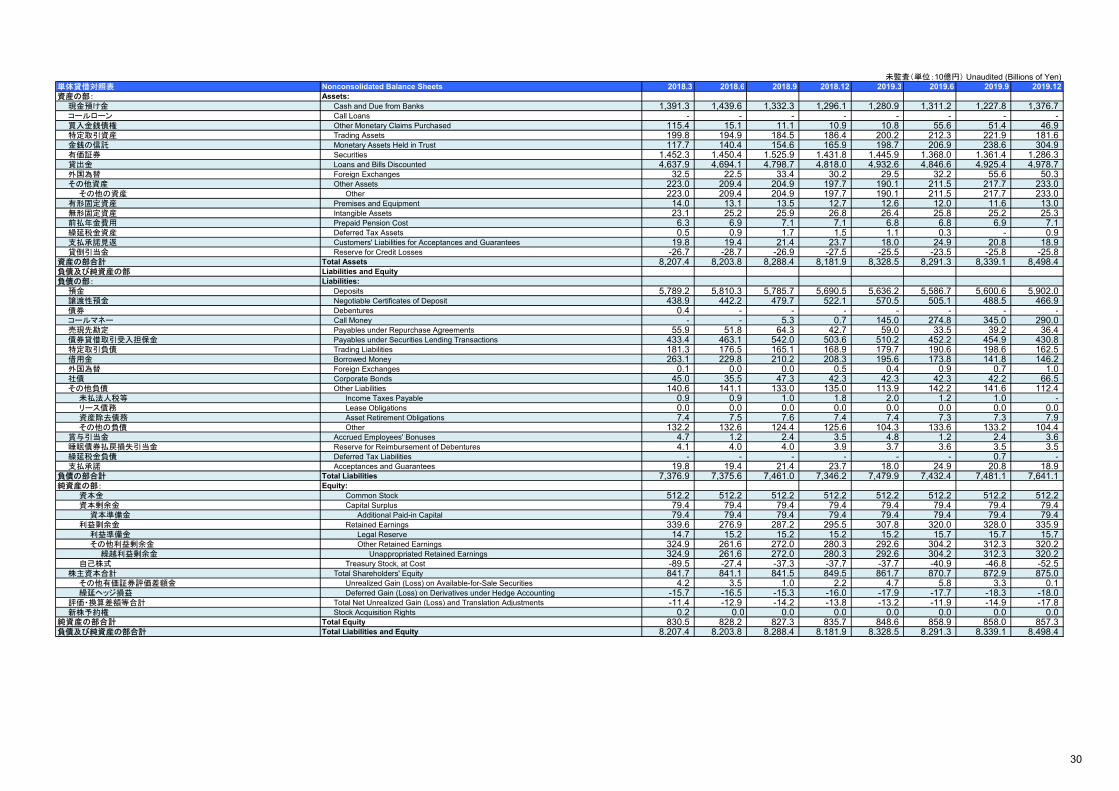
未監査(単位:10億円) Unaudited (Billions of Yen)単体貸借対照表 Nonconsolidated Balance Sheets 2018.3 2018.6 2018.9 2018.12 2019.3 2019.6 2019.9 2019.12資産の部: Assets: 現金預け金 Cash and Due from Banks 1,391.3 1,439.6 1,332.3 1,296.1 1,280.9 1,311.2 1,227.8 1,376.7 コールローン Call Loans - - - - - - - - 買入金銭債権 Other Monetary Claims Purchased 115.4 15.1 11.1 10.9 10.8 55.6 51.4 46.9 特定取引資産 Trading Assets 199.8 194.9 184.5 186.4 200.2 212.3 221.9 181.6 金銭の信託 Monetary Assets Held in Trust 117.7 140.4 154.6 165.9 198.7 206.9 238.6 304.9 有価証券 Securities 1,452.3 1,450.4 1,525.9 1,431.8 1,445.9 1,368.0 1,361.4 1,286.3 貸出金 Loans and Bills Discounted 4,637.9 4,694.1 4,798.7 4,818.0 4,932.6 4,846.6 4,925.4 4,978.7 外国為替 Foreign Exchanges 32.5 22.5 33.4 30.2 29.5 32.2 55.6 50.3 その他資産 Other Assets 223.0 209.4 204.9 197.7 190.1 211.5 217.7 233.0 その他の資産 Other 223.0 209.4 204.9 197.7 190.1 211.5 217.7 233.0 有形固定資産 Premises and Equipment 14.0 13.1 13.5 12.7 12.6 12.0 11.6 13.0 無形固定資産 Intangible Assets 23.1 25.2 25.9 26.8 26.4 25.8 25.2 25.3 前払年金費用 Prepaid Pension Cost 6.3 6.9 7.1 7.1 6.8 6.8 6.9 7.1 繰延税金資産 Deferred Tax Assets 0.5 0.9 1.7 1.5 1.1 0.3 - 0.9 支払承諾見返 Customers' Liabilities for Acceptances and Guarantees 19.8 19.4 21.4 23.7 18.0 24.9 20.8 18.9 貸倒引当金 Reserve for Credit Losses -26.7 -28.7 -26.9 -27.5 -25.5 -23.5 -25.8 -25.8 資産の部合計 Total Assets 8,207.4 8,203.8 8,288.4 8,181.9 8,328.5 8,291.3 8,339.1 8,498.4 負債及び純資産の部 Liabilities and Equity負債の部: Liabilities: 預金 Deposits 5,789.2 5,810.3 5,785.7 5,690.5 5,636.2 5,586.7 5,600.6 5,902.0 譲渡性預金 Negotiable Certificates of Deposit 438.9 442.2 479.7 522.1 570.5 505.1 488.5 466.9 債券 Debentures 0.4 - - - - - - - コールマネー Call Money - - 5.3 0.7 145.0 274.8 345.0 290.0 売現先勘定 Payables under Repurchase Agreements 55.9 51.8 64.3 42.7 59.0 33.5 39.2 36.4 債券貸借取引受入担保金 Payables under Securities Lending Transactions 433.4 463.1 542.0 503.6 510.2 452.2 454.9 430.8 特定取引負債 Trading Liabilities 181.3 176.5 165.1 168.9 179.7 190.6 198.6 162.5 借用金 Borrowed Money 263.1 229.8 210.2 208.3 195.6 173.8 141.8 146.2 外国為替 Foreign Exchanges 0.1 0.0 0.0 0.5 0.4 0.9 0.7 1.0 社債 Corporate Bonds 45.0 35.5 47.3 42.3 42.3 42.3 42.2 66.5 その他負債 Other Liabilities 140.6 141.1 133.0 135.0 113.9 142.2 141.6 112.4 未払法人税等 Income Taxes Payable 0.9 0.9 1.0 1.8 2.0 1.2 1.0 - リース債務 Lease Obligations 0.0 0.0 0.0 0.0 0.0 0.0 0.0 0.0 資産除去債務 Asset Retirement Obligations 7.4 7.5 7.6 7.4 7.4 7.3 7.3 7.9 その他の負債 Other 132.2 132.6 124.4 125.6 104.3 133.6 133.2 104.4 賞与引当金 Accrued Employees' Bonuses 4.7 1.2 2.4 3.5 4.8 1.2 2.4 3.6 睡眠債券払戻損失引当金 Reserve for Reimbursement of Debentures 4.1 4.0 4.0 3.9 3.7 3.6 3.5 3.5 繰延税金負債 Deferred Tax Liabilities - - - - - - 0.7 - 支払承諾 Acceptances and Guarantees 19.8 19.4 21.4 23.7 18.0 24.9 20.8 18.9 負債の部合計 Total Liabilities 7,376.9 7,375.6 7,461.0 7,346.2 7,479.9 7,432.4 7,481.1 7,641.1 純資産の部: Equity: 資本金 Common Stock 512.2 512.2 512.2 512.2 512.2 512.2 512.2 512.2 資本剰余金 Capital Surplus 79.4 79.4 79.4 79.4 79.4 79.4 79.4 79.4 資本準備金 Additional Paid-in Capital 79.4 79.4 79.4 79.4 79.4 79.4 79.4 79.4 利益剰余金 Retained Earnings 339.6 276.9 287.2 295.5 307.8 320.0 328.0 335.9 利益準備金 Legal Reserve 14.7 15.2 15.2 15.2 15.2 15.7 15.7 15.7 その他利益剰余金 Other Retained Earnings 324.9 261.6 272.0 280.3 292.6 304.2 312.3 320.2 繰越利益剰余金 Unappropriated Retained Earnings 324.9 261.6 272.0 280.3 292.6 304.2 312.3 320.2 自己株式 Treasury Stock, at Cost -89.5 -27.4 -37.3 -37.7 -37.7 -40.9 -46.8 -52.5 株主資本合計 Total Shareholders' Equity 841.7 841.1 841.5 849.5 861.7 870.7 872.9 875.0 その他有価証券評価差額金 Unrealized Gain (Loss) on Available-for-Sale Securities 4.2 3.5 1.0 2.2 4.7 5.8 3.3 0.1 繰延ヘッジ損益 Deferred Gain (Loss) on Derivatives under Hedge Accounting -15.7 -16.5 -15.3 -16.0 -17.9 -17.7 -18.3 -18.0 評価・換算差額等合計 Total Net Unrealized Gain (Loss) and Translation Adjustments -11.4 -12.9 -14.2 -13.8 -13.2 -11.9 -14.9 -17.8 新株予約権 Stock Acquisition Rights 0.2 0.0 0.0 0.0 0.0 0.0 0.0 0.0 純資産の部合計 Total Equity 830.5 828.2 827.3 835.7 848.6 858.9 858.0 857.3 負債及び純資産の部合計 Total Liabilities and Equity 8,207.4 8,203.8 8,288.4 8,181.9 8,328.5 8,291.3 8,339.1 8,498.4
30

未監査(単位:10億円) Unaudited (Billions of Yen)リスク管理債権(単体) Risk Monitored Loans (Nonconsolidated) 2018.3 2018.6 2018.9 2018.12 2019.3 2019.6 2019.9 2019.12 破綻先債権額 Loans to Bankrupt Obligors 0.5 0.7 0.6 0.5 0.5 0.5 0.5 0.5 延滞債権額 Nonaccrual Delinquent Loans 4.7 4.6 4.6 5.4 7.6 7.7 16.1 12.1 3ヵ月以上延滞債権額 Loans Past Due Three Months or More 1.1 0.9 0.4 0.4 0.2 0.3 0.2 0.3 貸出条件緩和債権額 Restructured Loans 1.8 1.8 1.9 1.7 1.7 1.5 1.6 1.7 合計 (A) Total (A) 8.3 8.2 7.6 8.2 10.1 10.2 18.6 14.8 貸出金残高 (B) Loans and Bills Discounted (B) 4,637.9 4,694.1 4,798.7 4,818.0 4,932.6 4,846.6 4,925.4 4,978.7 貸出残高比 (A)/(B) (A)/(B) 0.18% 0.18% 0.16% 0.17% 0.21% 0.21% 0.38% 0.30%貸倒引当金 (C) Reserve for Credit Losses (C) 26.7 28.7 26.9 27.5 25.5 23.5 25.8 25.8 引当率 (C)/(A) Reserve Ratios (C)/(A) 319.0% 346.9% 351.8% 334.9% 250.4% 229.1% 138.3% 174.2%
業種別貸出残高(単体) 2018.3 2018.6 2018.9 2018.12 2019.3 2019.6 2019.9 2019.12 国内(除く特別国際金融取引勘定分): Domestic (excluding Japan Offshore Market Accounts): 製造業 Manufacturing 185.3 189.1 189.0 200.3 186.1 193.0 198.8 215.4 農業、林業 Agriculture and Forestry - - - - - - - - 漁業 Fishery - - - 0.1 - 0.1 0.1 0.2 鉱業、砕石業、砂利採取業 Mining, Quarrying and Gravel Extraction 0.4 0.6 0.4 0.7 0.3 0.6 0.6 0.7 建設業 Construction 5.9 5.5 6.2 6.5 7.4 7.3 6.7 10.6 電気・ガス・熱供給・水道業 Electric Power, Gas, Heat Supply and Water Supply 246.1 247.9 265.9 295.5 317.6 313.7 328.2 347.0 情報通信業 Information and Communications 70.3 69.4 64.3 60.6 54.7 53.9 46.9 58.2 運輸業、郵便業 Transportation and Postal Service 174.8 172.4 173.1 176.9 173.5 173.7 178.8 183.8 卸売業、小売業 Wholesale and Retail 110.0 105.0 108.0 108.4 117.3 110.6 109.2 96.4 金融業、保険業 Finance and Insurance 705.5 831.3 941.6 904.1 983.0 993.3 965.6 931.1 不動産業 Real Estate 553.5 542.3 558.4 552.4 565.4 594.8 631.0 648.7 各種サービス業 Services 393.7 368.0 355.0 362.4 375.0 342.9 386.7 388.6 地方公共団体 Local Government 68.4 57.2 58.0 55.1 52.4 52.8 66.0 65.3 個人 Individual 1,564.0 1,537.6 1,511.9 1,485.9 1,461.3 1,435.2 1,419.2 1,404.9 海外円借款、国内店名義現地貸 Overseas Yen Loans and Overseas Loans Booked Domestically 419.9 425.8 415.0 430.4 447.9 385.5 369.8 371.2 国内店計 Total Domestic 4,498.4 4,552.7 4,647.3 4,639.9 4,742.7 4,657.8 4,708.5 4,722.7 海外及び特別国際金融取引勘定分: Overseas (including Japan Offshore Market Accounts): 政府等 Governments 0.3 0.3 0.2 0.2 0.1 0.1 0.0 0.0 金融機関 Financial Institutions 30.8 30.4 29.0 30.7 32.6 29.7 30.3 36.7 その他 Others 108.3 110.5 121.9 147.1 157.1 158.8 186.4 219.1 海外合計 Total Overseas 139.5 141.3 151.3 178.1 189.9 188.7 216.8 256.0 合計 Total 4,637.9 4,694.1 4,798.7 4,818.0 4,932.6 4,846.6 4,925.4 4,978.7
Loans by Borrower Industry (Nonconsolidated)
31

未監査(単位:10億円) Unaudited (Billions of Yen)業種別リスク管理債権残高(単体) 2018.3 2018.6 2018.9 2018.12 2019.3 2019.6 2019.9 2019.12 国内(除く特別国際金融取引勘定分): Domestic (excluding Japan Offshore Market Accounts): 製造業 Manufacturing 2.9 2.9 2.9 2.9 2.9 2.9 3.5 0.1 農業、林業 Agriculture and Forestry - - - - - - - - 漁業 Fishery - - - - - - - - 鉱業、砕石業、砂利採取業 Mining, Quarrying and Gravel Extraction - - - - - - - - 建設業 Construction - - - - - - - - 電気・ガス・熱供給・水道業 Electric Power, Gas, Heat Supply and Water Supply - - - - - - 5.7 5.5 情報通信業 Information and Communications 0.2 0.2 0.1 0.0 0.0 0.0 0.1 0.1 運輸業、郵便業 Transportation and Postal Service 0.0 - - - - - - - 卸売業、小売業 Wholesale and Retail 0.3 0.3 0.1 0.1 0.1 0.0 0.1 0.2 金融業、保険業 Finance and Insurance - - 0.1 0.1 0.1 0.1 0.1 0.1 不動産業 Real Estate - - - 0.0 0.0 0.0 3.6 3.6 各種サービス業 Services 0.5 0.5 0.4 1.1 1.1 1.1 1.3 1.2 地方公共団体 Local Government - - - - - - - - 個人 Individual 2.6 2.6 2.2 2.1 2.3 2.6 2.5 2.3 海外円借款、国内店名義現地貸 Overseas Yen Loans and Overseas Loans Booked Domestically 0.2 0.2 0.2 0.2 2.1 2.0 0.2 0.2 国内店計 Total Domestic 7.0 6.9 6.3 6.9 8.9 9.0 17.4 13.6 海外及び特別国際金融取引勘定分: Overseas (including Japan Offshore Market Accounts): 政府等 Governments - - - - - - - - 金融機関 Financial Institutions - - - - - - - - その他 Others 1.3 1.3 1.3 1.2 1.2 1.1 1.1 1.1 海外合計 Total Overseas 1.3 1.3 1.3 1.2 1.2 1.1 1.1 1.1 合計 Total 8.3 8.2 7.6 8.2 10.1 10.2 18.6 14.8
Coverage Ratio for Nonperforming Claims Classified under the Financial 2018.3 2018.6 2018.9 2018.12 2019.3 2019.6 2019.9 2019.12Revitalization Law (Nonconsolidated)
破産更生債権及びこれらに準ずる債権 Claims Against Bankrupt and Quasi-Bankrupt Obligors 1.8 1.9 1.8 1.7 2.1 2.3 2.3 2.1 保全額 Amount of Coverage 1.8 1.9 1.8 1.7 2.1 2.3 2.3 2.1 保全率 Coverage Ratio 100.0% 100.0% 100.0% 100.0% 100.0% 100.0% 100.0% 100.0% 危険債権 Doubtful Claims 3.6 3.5 3.4 4.3 6.1 6.1 14.5 10.7 保全額 Amounts of Coverage 2.0 2.5 2.1 2.3 4.1 3.5 11.5 10.0 保全率 Coverage Ratio 57.4% 69.8% 60.0% 54.2% 67.7% 57.6% 79.5% 93.6% 要管理債権 Substandard Claims 3.0 2.9 2.4 2.2 2.0 1.9 1.9 2.1 保全額 Amounts of Coverage 1.7 1.5 0.9 0.9 0.7 0.8 0.7 0.7 保全率 Coverage Ratio 55.3% 52.2% 38.8% 41.4% 34.0% 38.9% 34.0% 33.5%金融再生法の開示基準に基づく債権合計 (A) Total Nonperforming Claims Classified under the Financial Revitalization Law (A) 8.4 8.3 7.7 8.3 10.2 10.3 18.7 14.9 保全額 Amounts of Coverage 5.5 5.9 4.8 5.0 6.9 6.5 14.4 12.8 保全率 Coverage Ratio 65.8% 70.5% 62.9% 60.3% 67.8% 63.5% 77.3% 85.9%総与信残高 (B) Total Claims (B) 4,724.1 4,771.9 4,888.9 4,908.7 5,010.6 4,938.0 5,035.9 5,104.1 貸出金 Loans and Bills Discounted 4,637.9 4,694.1 4,798.7 4,818.0 4,932.6 4,846.6 4,925.4 4,978.7 その他 Others 86.1 77.7 90.2 90.6 78.0 91.3 110.5 125.4 総与信残高比 (A)/(B) (A)/(B) 0.17% 0.17% 0.15% 0.16% 0.20% 0.20% 0.37% 0.29%貸倒引当金 (C) Reserve for Credit Losses (C) 26.7 28.7 26.9 27.5 25.5 23.5 25.8 25.8 引当率 (C)/(A) Reserve Ratios (C)/(A) 318.4% 346.2% 351.0% 334.4% 249.9% 228.5% 138.1% 173.9%(参考1)部分直接償却実施額 (Ref.) Amount of Write-Off 5.9 5.9 4.2 2.7 3.0 3.2 5.0 4.8 (参考2)要注意債権以下 (Ref.) Below Need Caution Level 52.0 58.0 91.1 67.2 74.4 75.3 74.3 82.8 注記: 総与信残高比は2015年6月より小数点第3位以下を切り捨てして表示しております。
Note: Nonperforming loan ratio is presented discarding the third decimal point and below from June 30, 2015.
貸倒引当金(単体) Reserve for Credit Losses (Nonconsolidated) 2018.3 2018.6 2018.9 2018.12 2019.3 2019.6 2019.9 2019.12 貸倒引当金(貸出関連) (A) Reserve for Loan Losses (A) 26.7 28.7 26.9 27.5 25.5 23.5 25.8 25.8 一般貸倒引当金 General Reserve for Loan Losses 24.3 25.9 23.0 23.1 21.2 19.7 19.2 20.2 個別貸倒引当金 Specific Reserve for Loan Losses 2.3 2.8 3.9 4.4 4.2 3.7 6.6 5.5 特定海外債権引当勘定 Reserve for Loans to Restructuring Countries - - - - - - - -貸倒引当金合計 (B) Total Reserve for Credit Losses (B) 26.7 28.7 26.9 27.5 25.5 23.5 25.8 25.8
Risk Monitored Loans by Borrower Industry (Nonconsolidated)
金融再生法の開示基準に基づく債権と保全率(単体)
32

未監査(単位:10億円) Unaudited (Billions of Yen)債務者区分別の引当率(単体) Reserve Ratios for Borrowers' Category (Nonconsolidated) 2018.3 2018.6 2018.9 2018.12 2019.3 2019.6 2019.9 2019.12実質破綻・破綻先 (無担保部分) Legally and Virtually Bankrupt (unsecured portion) 100.00% n/a 100.00% n/a 100.00% n/a 100.00% n/a破綻懸念先 (無担保部分) Possibly Bankrupt (unsecured portion) 55.74% n/a 59.62% n/a 64.05% n/a 67.81% n/a要管理先 (無担保部分) Substandard (unsecured portion) 39.66% n/a 23.98% n/a 21.83% n/a 21.50% n/aその他要注意先 (債権額) Need Caution (total claims) 5.39% n/a 4.78% n/a 4.47% n/a 4.12% n/aその他要注意先 (無担保部分) Need Caution (unsecured portion) 11.18% n/a 13.75% n/a 10.43% n/a 10.30% n/a正常先 (債権額) Normal (total claims) 0.44% n/a 0.34% n/a 0.32% n/a 0.31% n/a
(参考) (Reference)換算為替レート Exchange Rate Information 2018.3 2018.6 2018.9 2018.12 2019.3 2019.6 2019.9 2019.12円/ドル JPY/USD 106.20 110.66 113.56 110.70 110.74 107.87 107.84 109.20円/ユーロ JPY/EUR 130.84 128.73 131.98 126.77 124.33 122.59 117.95 122.18円/ポンド JPY/GBP 149.09 144.99 148.38 140.20 144.74 136.67 132.62 143.10
33