cee dp 137 non-native speakers of english in the ... - eric · dustmann, frattini, and...
TRANSCRIPT

CEE DP 137
Non-Native Speakers Of English In The Classroom: What Are The Effects On Pupil Performance?
Charlotte Geay
Sandra McNally
Shqiponja Telhaj
March 2012

Published by
Centre for the Economics of Education
London School of Economics
Houghton Street
London WC2A 2AE
© C. Geay, S. McNally and S. Telhaj submitted February 2012
All rights reserved. No part of this publication may be reproduced, stored in a retrieval
system or transmitted in any form or by any means without the prior permission in writing of
the publisher nor be issued to the public or circulated in any form other than that in which it
is published.
Requests for permission to reproduce any article or part of the Working Paper should be
sent to the editor at the above address.
The Centre for the Economics of Education is an independent multidisciplinary research
centre. All errors and omissions remain the authors.

Non-Native Speakers Of English In The Classroom:
What Are The Effects On Pupil Performance?
Charlotte Geay
Sandra McNally
Shqiponja Telhaj
1. Introduction 1
2. Data Description 4
3. Conceptual Framework 8
4. Regression Results 12
Examining association 12
Heterogeneity 15
Interpretation 17
A shock in the demand for Catholic schooling 19
5. Conclusion 21
References 22
Figures 24
Tables 26
Appendices 37

Acknowledgments
Charlotte Geay is Researcher at Paris Graduate School of Economics, Statistics and Finance
(ENSAE). Sandra McNally is a Research Fellow and Director of the Education & Skills
Programme at the Centre for Economic Performance, London School of Economics and
Deputy Director of the Centre for the Economics of Education. Shqiponja Telhaj is a Lecturer
in Economics at the University of Sussex and a CEP Associate.
The authors would like to thank Emla Fitzsimons, David Figlio, Steve Gibbons, Steve Pischke,
Alan Manning and Marcos Vera Hernandez for very useful comments. They would like to
thank participants at the CESifo Area Conference on Economics of Education (Munich,
September 2011); and seminars at the University of Bologna, University College Dublin and
the Centre for Economic Performance, LSE. Finally they would also like thank to Brian Bell
and Steve Gibbons for help on data availability. This work has been funded by the Nuffield
Foundation, however the views expressed are those of the grant holder and not those of the
Foundation.

Executive Summary
Since 2003, the number of school students who do not speak English as a first language has
increased by one-third. About 12 per cent of primary school children in England do not speak
English as their first language. An important driver has been immigration, although to some
extent this might also be due to higher birth rates among families of ethnic minority origin.
Some media reports suggest that these trends could be detrimental to the educational
attainment of native English speakers (if immigrants need extra help). However, the academic
literature suggests that first and second generation immigrants to the UK have more
favourable (average) characteristics than the native population in terms of education. Recent
immigrants from Eastern Europe are also younger and show greater labour market attachment
than the native population. Such ‘positive selection’ means that non-native speakers may
have characteristics than compensate for any lack of language fluency.
In this paper we look at the association between the percentage of non-native English
speakers in the year group and the educational attainment of native English speakers at the
end of primary school. We analyse how this changes as controls are added. We ask under
what conditions the association might be interpreted as evidence for a causal effect. In a
second approach, we look specifically at the influx of white non-native English speakers that
happened after 2005, on account of Eastern European enlargement. Many immigrants came
from Poland – a largely Catholic country. We show that an increase in demand for (state-
based) Catholic education led to a strong differential trend in the percentage of white non-
native English speakers in these schools compared to other schools. We use this as the basis
of an Instrumental Variable strategy to look at the relationship between the percentage of
white non-native English speakers and the educational attainment of native English speakers
at the end of primary school. We pursue both these strategies using the National Pupil
Database.
The raw association between the percentage of non-native English speakers in the
year group and educational attainment of native speakers in reading, writing and maths at the
end of primary school is negative, although relatively modest. However, this association is at
least halved by including only a few basic demographic characteristics of native English
speakers. The association is close to zero if one further controls for the schools’ attended by
native English speakers. This does not change as increasingly more detailed controls are
added. We also find a very similar pattern if we control for the number of languages spoken
in the school (rather than the percentage of non-native speakers). This means that the
negative association in the raw data reflects sorting of non-native speakers into schools with
less favourable characteristics (e.g. a higher proportion of native speakers who are eligible to
receive free school meals). Once this is taken account of, there is no longer any association
between the percentage of non-native English speakers and the educational attainment of
native English speakers.
We explore various sources of potential heterogeneity, considering the following
groups of native English speakers: economically disadvantaged; those of low ability; those
based in London (where the percentage of non-native speakers of English is much higher than
the national average). In almost all cases, any negative association goes to zero when
controls are added. We also show specifications where we distinguish between non-native
speakers who first appear in the school census in the last two years of primary school and
non-native speakers who were in the census before that time. While the raw association is
more strongly negative for more recent entrants, it also goes to zero as controls are added.
These results could be given a causal interpretation if, after including all controls, any
remaining variation in the percentage of non-native speakers only reflects random fluctuation

in the relative size of the group of non-native speakers within the year group (and school)
from one year to another. We run some tests to investigate the plausibility of this assumption.
We come to the conclusion that this assumption is more plausible in the case of non-white
non-native speakers than white non-native speakers. However, our analysis suggests that the
bias could be negative for the latter group. This suggests that the ‘true effect’ is highly
unlikely to be negative.
When we investigate the shock in the demand for Catholic schooling post-
enlargement, we find that this strongly predicts the percentage of white non-native speakers
in Catholic schools (compared to other schools) whereas it does not predict other key school
characteristics (including the percentage of non-white non-native speakers). We use this as
the basis of an Instrumental Variable strategy where we analyse how this increase in white
non-native speakers influences native English speakers in affected schools. While effects are
imprecisely estimated for reading and writing, the estimated effect for maths is positive and
significant in some specifications. This small, positive effect for Maths is not generalizable to
other schools and contexts. It relates to the group of native speakers for which it is estimated
(i.e. those attending Catholic schools with new entrants arriving on account of Eastern
European enlargement, who have parents with a preference for Catholic schooling). Given
that white non-native speakers are closer to native English speakers in terms of their own
maths attainment at age 11 (compared to reading and writing where they are further behind),
it makes more sense to find a positive peer effect for this subject. One can only speculate as
to the reason. One possibility is that the parents of these children are highly educated and
strongly attached to the labour market (as shown in other studies) and this effects the
educational progress of their children (making them better peers than the average).
Both strategies applied here suggest that negative effects of non-native English
speakers on the educational attainment of native English speakers can be ruled out. There is
no reason to be worried about the increase in the number of non-native speakers of English in
primary schools.

1. Introduction
In England, about 12 per cent of primary school children do not speak English as a first
language. The actual number increased by about one third between 2003 and 2009. A
significant driver of the increase has been immigration, although the trend might also be
driven by higher birth rates among ethnic minority groups. In the media, this trend has been
interpreted as being potentially detrimental to the educational prospects of native English
speakers.3 For example, the chairman of a migration think-tank was quoted recently as saying
‘…it is primary school where the effect is being felt most acutely at present and where the
education of [native] English-speaking children is bound to suffer as immigrant children
require extra help’.4 On the other hand, recent academic papers suggest that first and second
generation immigrants have more favourable characteristics than the native population in
terms of education. For example, Dustmann and Glitz (2011) show that the share of the
foreign-born population with tertiary education exceeds that of the native-born population by
16.1 percentage points. Dustmann, Frattini, and Theodorpoulos (2011) show that second
generation ethnic minority immigrants tend to be better educated than their parents’
generation and better educated than their white native peers. In another recent paper
Dustmann, Frattini and Halls (2010) consider the recent wave of immigration from Eastern
Europe and show that these immigrants are substantially younger and better educated than the
native population (as well as less likely to be on benefits and showing higher labour market
attachment). All this positive selection on education suggests that non-native speakers may
well have characteristics that compensate for any lack of language fluency.
Using a census of all children in English primary schools, we ask the following
questions: What is the association between the percentage of non-native English speakers in
3 ‘Native English speakers’ are defined here as pupils whose first language is English and ‘non-native English
speakers’ as pupils whose first language is not English. This does not necessarily reflect nationality as many
English people from ethnic minority backgrounds will speak another language as their first language. It also
does not reflect fluency in English. 4 Sir Andrew Green, chairman of MigrationWatch UK. The Sunday Times. 28 November 2010.
1

the year group and the educational attainment of native English speakers at the end of
primary school? How does this change as controls are added? In particular, under what
circumstances can we interpret the effect to be causal? We also split the data into white and
non-white non-native speakers. Although the latter is more important numerically, the former
shows a very sharp increase on account of Eastern European enlargement. We consider
whether there is any evidence of heterogeneity in this dimension.
There is a negative raw correlation between the educational attainment of native
English speakers and the proportion of non-native speakers in their year group. We are
interested to consider how this changes as controls are progressively added to the regression.
Such an approach would be misleading if the composition of native English speakers were
changing as a direct response to the increase in non-native speakers. We find that this could
be an issue because the probability of moving school (for native speakers) is correlated with
the percentage of non-native speakers in the year group. To mitigate this concern, we look at
the relationship between the percentage of non-native speakers and test outcomes of native
English speakers (at age 11) using schools attended at age 7 (i.e. regardless of whether they
moved schools after that).5 We find that the raw correlation (which is negative) reduces very
quickly – and dramatically – even if only including a few controls for native English
speakers. This is true in the full sample and subsamples of the data.
Our approach could be considered as identifying a causal impact if all relevant
controls are added, leaving only idiosyncratic variation in the percentage of non-native
English speakers within the same school across cohorts of pupils in the final year of primary
school (Year 6). This is similar to the strategy used by Hoxby (2000) and many other papers
5 Individual level test scores of native English speakers (at age 11) are related to the percentage of non-native
English speakers in their year group. However, ‘the year group’ refers to the school that the native English
speaker attended at age 7. This overcomes the potential problem that native English speakers might move school
between the age of 7 and 11 in response to a sudden increase in the percentage of non-native English speakers in
the year group. However, in the Appendix we show a regression where we use the actual school attended at age
11 (for the same individuals). The results are not very sensitive to this issue.
2

that try to identify peer group effects. We investigate whether this assumption is plausible by
looking at whether the percentage of non-native speakers is correlated with individual
controls when a very detailed set of controls is added. While the assumption looks tenable for
non-white non-native speakers, it is less so for white non-native speakers. The coefficient on
the percentage of white non-native speakers may have some downward bias due to white
non-native speakers having a higher probability of attending schools that are declining in
quality. However, the strategy suggests that there is highly unlikely to be a negative causal
impact of the increase in the percentage of non-native speakers of English on the educational
attainment of native speakers.
We use another approach to look specifically at the percentage of non-native speakers
who are of white ethnic origin. The timing of the change over time reflects the impact of
Eastern European enlargement in 2005. Many of the new immigrants came from Poland – a
largely Catholic country. We show that there was a sharp increase in the percentage of ‘white
non-native speakers’ attending Catholic schools after 2005. We use this fact to form the basis
of an Instrumental Variable strategy where the interaction between year and sector identifies
the ‘white, non-native’ effect in Catholic schools. Although this strategy has a strong first
stage, the reduced form effects are inconclusive for reading and writing. We find a small
positive (and significant) effect for maths. This makes sense in that there are much smaller
differences between native and non-native speakers with regard to maths than for reading and
writing. If there were positive spillover effects in any subject, it would make sense to find it
here. The IV estimate is not directly comparable to the OLS estimate because a ‘Local
Average Treatment Effect’ is estimated (i.e. the effect for native English speakers in Catholic
schools who are exposed to white non-native speakers after 2005). However, a positive
effect (for maths) is consistent with the possibility that OLS estimates are downward biased.
3

Although the question addressed in this paper is not the same as the effect of
immigration on students from the home country, there are clear parallels to this literature.
There is a vast literature on the effects of immigration on native labour market outcomes but
there is relatively little work on whether immigration affects the educational outcomes of
natives. Exceptions include Betts (1998) who examines whether immigration reduces the
contemporaneous high school graduation rate of natives, and papers that look at whether
immigrants crowd-out natives from slots in college and graduate programs (e.g. Borjas, 2004;
Hoxby, 1998). These papers tend to find small effects. A number of recent papers in Europe
have considered the closely related question as to whether the proportion of immigrants
affects the test scores of students from the home country. Brunello and Rocco (2011) use
cross-country data and suggest that effects are small. Ohinata and van Ours (2011) look at
this issue for The Netherlands and find no strong evidence for spillover effects. However
studies for Israel (Gould et al. 2008) and Denmark (Jensen and Rasmussen, 2011) find some
evidence for negative spillovers. One would not expect the effects of immigration to be the
same across countries because this will depend on the institutional context as well as the
characteristics of immigrant communities.
Our paper is structured as follows. In Section 2, we describe the data and
characteristics of pupils according to whether they are native or non-native speakers of
English and ethnic origin. In Section 3, we describe our conceptual framework. In Section 4,
we discuss our regression results and conclude in Section 5.
2. Data Description
We use the National Pupil Database between 2003 and 2009. This contains detailed pupil-
level information for all state schools in England (such as attainment at age 7 and 11; gender;
ethnicity; whether English spoken as a first language; whether pupil eligible to receive Free
4

School Meals). It can be matched with school-level data sets that contain information on the
schools attended (Annual School Census). It can also be matched with school-level data on
expenditure.
The English school system is organised around various ‘key stages’. At the end of
primary school, students get to the end of ‘key stage 2’ on the national curriculum and take
tests in English, maths and science. The tests are undertaken by all pupils. They are set and
marked externally to the school. The tests are fairly high stakes for the school because they
form the basis of ‘School Performance Tables’ which are published and available to parents.
There is no grade repetition in the English system. Thus, all pupils in Year Group 6 are born
within a year of each other.
Among the pupil-level characteristics contained in the National Pupil Database is the
ethnicity of the pupil and whether he/she speaks English as a first language. The ‘first
language’ is defined as ‘the language to which the child was exposed during early
development and continues to use this language in the home or in the community. If a child
acquires English subsequently to early development, then English is not their first language
no matter how proficient in it they become’6. In this paper ‘native English speaker’ is defined
by whether the person speaks English as a first language according to this definition.
The number of pupils who do not speak English as a first language has increased
fairly markedly over the short time in which we can observe this in administrative data
(2003-2009). There is an acceleration from 2005 onwards, reflecting the effect of European
enlargement and the subsequent immigration of people from Eastern European countries to
the UK (at the same time as lower birth rates for English cohorts). The net effect is an
increase in the proportion of pupils who do not speak English as a first language from 8.7%
in 2003 to 12.4% in 2009 (measured for pupils at the end of primary school). In 2003, about
6 National Pupil Database data description.
5

15% of non-native speakers were from a white ethnic origin. This increased to 19% in 2009.
Figures 1 and 2 illustrate the smooth rise in the percentage of pupils from a non-white ethnic
origin and the more step-wise change in the percentage of pupils from a white ethnic origin
(after 2005).
The majority of native English speakers are ‘White British’ (92% in 2003; 90% in
2009). In Table 1, we show the proportion of various ethnic minorities in the ‘native English
speaker’ category and the proportion in the ‘non-white, non-native’ speaker category.
Although the two groups have a very different ethnic composition, the Table shows that
ethnic minorities are well represented among those classified as ‘native English speakers’ and
those who do not speak English as their first language.
In Table 2, we show the average characteristics of pupils in each group and the
schools to which they attend (computed separately for the three different categories of pupil)
for the last year of our data (2009). Non-native English speakers are more likely to be
economically disadvantaged. About 18% of white non-native speakers and 28% of non-white
non-native speakers are eligible to receive free school meals whereas this is the case for 15%
of native speakers. They also perform more poorly at the end of primary school. The
percentile reading, writing and Maths score is close to 50 among the population of native
English speakers. For white and non-white non-native speakers, the percentile score for
reading is about 41 while for Maths the relative score is better (around 47 in both cases).
Non-white non-native speakers do better in writing – 46 percentile points; relative to 42
percentile points for white non-native speakers. All this translates into a lower probability of
meeting a key indicator used at the end of primary school (i.e. whether the pupil has achieved
at least ‘level 4’).7 For native English speakers, over 80% met the target for English and
Maths. For non-native English speakers, about 65% of those from a white ethnic origin met
7 The significance of this indicator is that ‘level 4’ is deemed to be the expected level to be achieved for children
of this age, according to the National Curriculum. It is the indicator used in the School Performance Tables.
6

the target for English where 76% of those from a non-white ethnic origin met this target.
With regard to Maths, the numbers were 73% and 76% for those from a white and non-white
ethnic origin respectively.
In terms of schools attended, white and non-white non-native speakers attend larger
schools than native speakers although there is not a big difference in terms of the average
pupil-teacher ratio. They go to schools with a higher percentage of economically
disadvantaged pupils (about 18% of children eligible to receive free school meals; compared
to about 15%, which is the average in schools attended by native speakers). In terms of
average pupil attainment, schools attended by native speakers are only a little higher
performing than those attended by non-native speakers. Non-native speakers are more likely
to be in a school that is located in London or an urban area. They are more likely to attend
Catholic schools (particularly those of white ethnic origin) but less likely to attend a Church
of England school than native speakers.
In Table 3, we consider whether the probability of moving school for native speakers
(between Year Groups 2 and 6) is related to the future proportion of non-native speakers in
the year group of the original school attended (in Year Group 6). In columns 1-5, we show
how the association changes after including progressively more detailed controls. However,
the coefficient is fairly insensitive to the inclusion of controls. The regressions show that an
increase in the proportion of non-native speakers by 0.10 is associated with an increase in the
probability of moving schools by about 2.8 percentage points for native speakers.8 The
association is not sensitive to whether the non-native speakers are of white or non-white
ethnic origin.
One might interpret these regressions as suggesting that native speakers deliberately
leave the school if there is a rise in non-native speakers in the school (or neighbourhood of
8 The average proportion of native English speakers who move school between Year Groups 2 and 6 is 0.14.
7

the school). However, the association could potentially reflect other unobserved time-varying
features of schools or neighbourhoods that are correlated with compositional change of the
school along this dimension. The important point is that a contemporaneous association
between the proportion of non-native English speakers in the year group and the outcome of
the ‘native speaking’ pupil might be misleading because the composition of native speakers
has been changing on account of (or because of something related to) the proportion of non-
native speakers in the school. To avoid this problem, we consider a pupil’s school to be that
which they attended at age 7 (irrespective of whether or not they moved). We relate his/her
pupil attainment at the end of Year 6 to the percentage of non-native speakers in his/her
original school. In Appendix 1, we replicate our basic table (Table 4) using the actual school
9attended at the end of Year 6.
3. Conceptual Framework
Initially, we are interested in looking at the association between the proportion of non-native
speakers in the year group and the educational attainment of native speakers at the end of
primary school. We are interested in observing how the association changes when
progressively controlling for characteristics of native English speakers and schools attended.
The question is what happens to the negative association (observed in the raw data) after
taking account of non-random sorting of non-native speakers across schools and
neighbourhoods. We initially include simple controls for the demographics of native
speakers: their month of birth; whether they are eligible to receive free school meals (an
indicator of economic disadvantage); their gender and whether they have statement of special
educational needs. In the next specification, we control for school fixed effects. We then add
controls for prior attainment (i.e outcomes of age 7 tests in reading, writing and maths). Then
9 The raw association does not change. However, the coefficient on the percentage of non-native speakers is
somewhat sensitive to the inclusion of other controls (although not so much that it would change our
conclusions if we proceeded using the school actually attended in Year 6 rather than that attended in Year 2).
8
we include time-varying characteristics of schools (the pupil-teacher ratio; the size of the year
group; per pupil expenditure; the percentage of disadvantaged students in the school) – with
the proviso that some of these characteristics could themselves be influenced by the
percentage of non-natives in the school. We then add a control for the number of non-native
speakers at school-level. This follows Gould et al. (2009) and is intended to capture changes
occurring within the school as a whole rather than the peer group of interest (i.e. non-native
speakers in the same year group as native speakers). In the most detailed specification, we
control for school-specific time trends.10
The most detailed estimation can be represented as follows:
Yigst = β0 + β1Non-nativegst + β2Dt + β3Xigst + β4Nsgt + β5Zst + µst + εigst (1)
where the outcome Y (the percentile score in reading, writing or maths) for pupil i in Year
Group 6 of School s is related to the percentage of non-native speakers in Year Group 6 in
School s in a given year (t). Controls are included for year dummies (Dt), a vector of student
characteristics (X); the number of pupils in the year group N; a vector of time-varying school-
level characteristics (Z); school fixed effects (µ) which are allowed to vary with a time trend.
We will see in the empirical section that after controlling for even a few of these
variables, the coefficient of interest (on non-native speakers) generally goes to zero within the
full sample or sub-samples of the data. However, the coefficient is always precisely
determined; standard errors do not explode as more and more detailed controls are added. It is
plausible that only idiosyncratic variation in the percentage of non-native speakers over
successive year groups is allowing for the coefficient to be estimated at all. If this hypothesis
were true, then the coefficient on the percentage of non-native speakers could be given a
causal interpretation. Following Hoxby (2000), there is now a number of studies in the
educational literature using this type of approach (e.g. Ammermuller and Pischke, 2009;
10
School specific time trends are computed by regressing each characteristic against a trend variable (within
school) and then estimating the residual. The newly created variables (i.e. the residuals of these regressions) are
used in the regression analysis instead of the original variables. Further details are available on request.
9

Bifulco et al. 2011; Black et al. 2010; Brunello and Rocco, 2011; Gould et al. 2009; Lavy and
Schlosser, 2011, Ohinata and van Ours, 2011).
To investigate this hypothesis, we look at how key control variables are related to the
percentage of non-native speakers as controls are added. The hypothesis that only
idiosyncratic variation in the data is driving the results is more plausible in the case of non-
white non-native speakers than in the case of white native speakers. Indications are that any
bias is downward – which would rule out negative effects in both cases.
Another approach is to look specifically at the shock to the demand for Catholic
schooling following the enlargement of Eastern Europe. In May 2004, ten Central and
Eastern European countries joined the European Union. The UK, Ireland and Sweden were
the only countries to initially grant full free movement to accession nationals.11
Eastern
European enlargement had a disproportionate effect on the demand for Catholic schools
because many Polish families are of that faith. In Figure 3, one can see that the percentage of
non-native students of white ethnic origin more than doubled between 2005 and 2009 (from
about 2% of nearly 4.5% of all students) where is the rate of increase was lower in other
school types (defined here as ‘Church of England’ and schools that are not affiliated to a
particular religion).12
The empirical strategy is to use the interaction between school type and
the time trend following Eastern European enlargement as an instrument to predict the
percentage of non-native white speakers in a given year group.
Specifically, we estimate a first-stage regression as follows:
Non-native-whitegst = α0+ α1Cs + α2θ1t + α3θ2t + α4[θ1t x Cs] + α5[θ2t x Cs] + νgst (2)
11
In the UK, the impact on the labour market has been analysed by Blanchflower and Shadforth (2009) and
Lemos and Portes (2008). It has been used to analyse the effects on crime by Bell et al. (2010). Of these
countries, Poland has been the most prominent in terms of the number of migrants. 12
In England, ‘faith schools’ represent a high percentage of state schools (about 30% of primary schools). Of
these about two-thirds are affiliated with the Church of England and one-third with the Catholic church. There
are a very small number of other faith schools such as Jewish and Muslim
10

where non-native speakers (of white ethnic origin) in Year Group 6 of school s in time t is
influenced by whether or not the school is Catholic C, a time trend which is made up of a
continuous component θ1t and a component that reflects the effects of Eastern European
enlargement θ2t. This second component is constructed as follows: θ2t = (t – 2005) if t>2005;
t=0 otherwise. It is the interaction term between whether the school is Catholic and this
second component of the time trend that is used as the exclusion restriction for the second
stage regression. The second stage regression is similar to equation (1) except that variables
for school type C, and the time trend are reformulated in accordance with the first stage
regression in (2). As before, we consider different specifications – increasing the controls
used in successive specifications. However, in this case, one would not expect there to be so
much difference between specifications since the variation being used to identify the effect of
‘non-native’ is orthogonal to all other regressors.
We exclude non-native speakers of non-white ethnic origin from these regressions
because we have no instrument in this case. However, we show the robustness of our
approach by showing that while our instrument does influence the percentage of non-native
speakers of white ethnic origin, it does not influence the percentage of non-native speakers of
non-white ethnic origin. Furthermore, it does not influence any of our key control variables
(i.e. the prior attainment of native English speakers; the free school meal status of native
English speakers). The IV approach identifies the causal impact of an increase in the
percentage of non-native speakers provided that the instrument is not correlated with any
other variable. It is not necessarily comparable with the OLS estimate because it identifies the
Local Average Treatment Effect. If the assumptions of the IV hold (i.e the instrument is not
correlated with any other variable), it identifies the causal effect for native English speakers
who attend Catholic schools with the group of people who have been affected by the
instrument – A8 immigrants with parents who have a preference for Catholic education.
11

These parents might be more religious; more aware of the positive reputation of faith schools;
13or find it easier to exploit the system in some way. More generally, immigrants coming
from A8 countries are known to be highly educated and display strong labour market
attachment (Dustmann, Frattini and Halls, 2010). Thus, the group for which the effect is
identified are not necessarily representative.
4. Regression Results
Examining association
Table 4 shows regression results where we progressively include more detailed controls. The
specifications are as follows: (1) controlling for year effects only; (2) also controlling for a
vector of student demographics: gender, month of birth, whether the student is eligible to
receive free school meals, whether the student receive a statement for ‘Special Educational
Needs’; (3) including school fixed effects; (4) controlling for prior student attainment at age
7; (5) including the number of pupils in the year group and other school-level characteristics:
the pupil-teacher ratio; the percentage of students eligible to receive free school meals; and
(log) expenditure per pupil; (6) controlling for the total number of non-native English
speakers in the school; and (7) including school specific time trends.
The raw association (including only year dummies) between the percentage of non-
native speakers in Year Group 6 and educational outcomes of native speakers is relatively
modest. The first column suggests that an increase in non-native speakers of ten percentage
points is associated with a decrease in the score of reading, writing and maths by 1.2, 0.9 and
1.4 percentile points respectively. Results are similar if we take account of the percentage of
13
Faith schools are permitted to prioritise students who are members of the relevant faith in the event of over-
subscription. Catholic schools are ‘voluntary aided’ – an advantage of which is that they control their own
admissions. There is an admissions code, which precludes selection by ability. There are allegations – some
proven - that some schools have broken the admissions code. The scale and extent of such breaches is not clear.
The admissions code has been tightened up in recent years.
12
non-natives in earlier years of each cohort’s schooling.14
Also, if we do run quantile
regressions (not reported), the point estimate is similar at the 25th
, 50th
, and 75th
percentile.
In Table 4, the association is (at least) halved only by including some basic
demographics of native speakers of English (column 2). The association is close to zero if
one includes school fixed effects (column 3) and is little changed by controlling for prior
attainment (column 4). The inclusion of other time-varying school characteristics or school
specific time trends makes no difference to this. This suggests that the raw (negative)
association between the percentage of non-native speakers and the educational attainment of
native speakers is driven by the sorting of non-native speakers into schools with poorer
characteristics. One might wonder if results would be different if we looked at students when
they are younger (at age 7), before they have a chance to catch up. Appendix A2 shows
results when teacher assessment at age 7 is used as the dependent variable. The pattern of
results is very similar (i.e. associations are halved once demographics are added; they fall to
zero when school fixed effects are included).
In Table 5 we repeat the specifications for 11 year olds where we separate non-native
speakers according to ethnic origin. In this case, all specifications for white non-native
speakers either show a zero or positive coefficient. Specifications for non-white non-native
speakers are negative in the early specifications but the association falls notably when
including simple controls for native English speakers. Again, the coefficients (for both white
and non-white) non-native speakers becomes zero as soon as school fixed effects are
included. There is little change in more detailed specifications.
14
We can look at the percentage of non-native speakers when the pupil was in each year of primary school. The
number of observations is reduced because we only have this information for cohorts who were at school from
2002 onwards. When we specify regressions where the coefficient of interest is on the percentage of non-native
speakers in the (native-speaking) person’s school when he/she was in grades 3-6, 4-6 and 2-6, we get very
similar results to those obtained when only looking at the percentage of non-native speakers when he/she is in
grade 6. The correlation in the percentage of non-native speakers (over grades for the same cohort) is very high.
13

In Table 6, we consider whether there might be non-linearities in the effect of the
percentage of non-native speakers on the attainment of native speakers. The raw association
is considerably higher for schools where the percentage of non-native speakers in the year
group is over 8 per cent (i.e. the median for schools with a positive number of non-native
speakers in 2003). However, again this falls away as soon as other controls are added.
Another possibility is that the number of languages spoken might matter more than
the percentage of non-native speakers of English. For example, it might be easier for schools
to employ a language assistant who speaks the language of the majority of non-native
speakers (thus helping their integration). But this might be more difficult if many different
languages are spoken. We know the language spoken in the last three years of the data
(2007-2009) and the number of languages spoken is highly correlated with the percentage of
non-native speakers (ρ=0.75 in 2009). In Table 7, we replicate the first four specifications of
the regression when we include ‘number of languages spoken in the year group’ rather than
the percentage of non-native speakers of English. The pattern of results is very similar to
when the percentage of non-native speakers is included as a control. The initial negative
association in the raw data is greatly reduced by controlling for a few demographics of native
speakers. The association is close to zero when school fixed effects are included. While the
standard errors are larger in this case (we only have three years of data where ‘number of
languages’ is recorded), it is important to note that they do not explode after including school
fixed effects. There is still enough variation in the data for meaningful analysis. While
estimates in the most detailed specifications are not precisely estimated, the confidence
intervals suggest that effects below about -0.05 can be ruled out.15
We have also tried similar
specifications using a measure of ‘language concentration’ (an application of the Herfindahl-
15
For example, the most detailed specification for reading (Table 7, column 4, gives an estimated effect of
0.056 (0.043). The confidence interval is -0.028 to 0.14.
14

Hirschman index). Results are qualitatively similar using this index and are available upon
request.
Heterogeneity
We first consider effects for native speakers who might potentially be more negatively
affected by an increase in the percentage of non-native speakers: economically
disadvantaged16
; those who performed poorly in tests at age 717
; going to school in London
(which has a high percentage of non-native speakers: about 38% in 2009, compared to 12%
nationally). In Table 8, we show regressions for these three sub-groups. We show two
specifications: the simple specification (columns 1, 3 and 5) and the most detailed
specification including school fixed effects, time-varying school characteristics and school
specific time trends18
(columns 2, 4 and 6).
‘Native-speaking’ pupils who are eligible to receive free school meals are even less
affected (even in the simple specification) by the percentage of non-native speakers in their
year group than the population as a whole. In the simple specification, there is a positive
association between the percentage of white non-native speakers and the educational
attainment of native speakers (with regard to reading and writing). All coefficients go to zero
in the most detailed specification. The sub-sample of pupils who achieved poorly at age 7
(i.e. the bottom quintile) show similar results in the simple specification. When all controls
are added, there is a negative and statistically significant association with regard to the
percentage of non-white non-native speakers for reading and writing. The interpretation is
that a 10 percentage point increase in the percentage of non-white non-native speakers is
16
Economically disadvantaged pupils might be more vulnerable if they are competing for teacher attention with
pupils who have special needs because they are less fluent in English. 17
This is defined as pupils who did not achieve the expected level in tests of reading, writing or maths at the age
of 7 (level 2). This is about 20% of the sample. 18
In most cases, regression results are unchanged from the fourth specification onwards (i.e. when school fixed
effects are included). An exception is regressions estimated on the sub-sample of low-achievers.
15

association with a reduction in the percentile score in reading and writing of about half of a
percentile point. This is extremely small. With regard to pupils going to schools in London,
the raw association with percentage of non-native speakers is more strongly negative in the
case of non-white non-native speakers (and close to zero for white non-native speakers) in the
simple specification but this association goes to zero when controls are included.
We next consider a specification where we distinguish between non-native speakers
who first appear in the data in the last two years of primary school (Years 5 and 6) and non-
native speakers who were in the census before that time. One might think that non-native
speakers who appear in the census fairly late (most likely reflecting recent migration) are less
good at English than those who have been longer in the English school system. In addition,
newcomers at this stage might be potentially disruptive for the other students if they make
more demands on the teacher. In Table 9, we distinguish between these categories (as well as
by ethnic background). We can only use years between 2005 and 2009 to run these
regressions. In 2005 about 18% of white non-native speakers were new arrivals in the last
two years of primary school. This number was 30% in 2008 (25% in 2009). A small
proportion of non-white non-native speakers were new arrivals – and the proportion has not
varied so much over time, being about 9.6% in 2005 and 8.2% in 2009.
The results in Table 9 show the pattern we might expect. The association between the
percentage of non-native speakers and the educational attainment of native speakers is more
strongly negative with regard to those entering the census in the last two years. The raw
association is much smaller (though still negative) for the percentage of non-native speakers
from a non-white ethnic origin. It is positive (though small in magnitude) with regard to the
percentage of non-native speakers from a white ethnic origin. The coefficients all reduce
markedly when controls are added and become either zero (or very weakly positive) when
including school fixed effects.
16

Interpretation
These results suggest that even the raw association between the percentage of non-native
speakers in the year group and the educational attainment of native speakers is usually
modest (except where the percentage of non-native speakers is large and also in the case of
students who enter the schools’ census in the last two years). The association becomes close
to zero once a few controls for the characteristics of native speakers are added and then
becomes more definitively zero after including school fixed effects in the regressions. The
regressions also suggest that the negative association in the raw data really reflects the fact
that non-native speakers of English are sorted into schools with less favourable characteristics
(e.g. more native speakers from economically disadvantaged backgrounds).
The coefficient on ‘non-native speakers’ could be given a causal interpretation if it is
estimated only using idiosyncratic variation in this variable. In other words, after controlling
for all observable student and school controls and unobserved school effects (as well as
school specific time trends), any remaining variation in the percentage of non-native speakers
only reflects random fluctuation in the relative size of the group of non-native speakers
within the year group (and school) from one year to another. To consider whether this is
plausible, we regress the percentage of non-native speakers (distinguishing by ethnicity) on
key control variables. The coefficient should go to zero after including all other controls if
variation in the percentage of non-natives is truly random. The pupil-level characteristics are
predetermined and cannot be causally influenced by the percentage of non-native speakers
(bearing in mind that we have dealt with the issue of pupil mobility as a potential reaction to
the increase in non-native speakers – as discussed in Section 2). The school-level
characteristics might potentially be causally influenced by an increase in non-native speakers
(although they could be driven by other things as well).
17

The results from regressing the percentage of non-native speakers on these variables
is shown in Table 10. This shows that while including additional controls does a good job of
removing the association between each specific control and the percentage of non-native
speakers, it is not completely eliminated with regard to white non-native speakers. The results
suggest that even in the most detailed specification (i.e. including school specific time
trends), there is still a significant positive association between the percentage of white non-
native speakers and disadvantage (measured by whether the student is eligible to receive free
school meals) and a significant negative association between the percentage of white non-
native speakers and the prior attainment of native English speakers. Although the coefficients
are extremely small, they are nonetheless suggestive that white non-native speakers might be
attending schools that are declining in quality. This could be, for instance, because of lack of
affordable housing close to good schools or lack of information on how to find out what
schools are good (particularly for new arrivals). If ‘declining school quality’ is the omitted
variable, the sign of the bias on the percentage of white non-native speakers should be
negative (i.e. it is positively correlated with the percentage of white non-native speakers but
negatively related to the educational attainment of native speakers). Thus, if there is really a
positive peer group effect, the bias might lead us to believe the effect is really zero. While
such a problem precludes giving a causal interpretation to the coefficient, the direction of
bias suggests that the ‘true effect’ is highly unlikely to be negative.
These issues do not arise with regard to the coefficient on non-white non-native
speakers. While this is not proof that idiosyncratic variation in the data is the only remaining
variation after including detailed controls (as there could still be an association with a
variable that we do not measure), the hypothesis of causality is more plausible in this case.
18

A shock in the demand for Catholic schooling
We now consider how the percentage of white non-native speakers is affected by the shock in
the demand to Catholic schooling and what consequences (if any) the influx might have had
for native English speakers in these schools. As the instrument is measured at school-level we
aggregate the data to school-level for these regressions.19
In Table 11, we show the results of the first stage regression with regard to the
coefficient of interest (i.e. on the Catholic school dummy interacted with the spline function
discussed above). As Figure 2 would suggest, the estimated coefficient is strong and positive.
The F-statistic (of 26) suggests that the first stage is strong enough to be useful in an IV
context. The first stage is insensitive to the inclusion of controls for school or pupil
characteristics. In Table 12, we show the results of some falsification tests. For the instrument
to be credible, it should not predict the percentage of non-white non-native speakers. Also, it
should not be correlated with the characteristics of native English speakers. In Table 11, we
show the basic specification where the dependent variables in columns 1 to 4 are
respectively, the percentage of non-white non-native speakers in the year group; average
attainment of native English speakers (within the year group) in national tests of reading,
writing and maths at age 7. The instrument is not related to any of these variables. This
suggests that the validity of the instrument is plausible.
Table 13 shows the reduced form regressions where the dependent variable is average
attainment for native speakers in reading, writing and maths respectively. The point estimates
for reading are close to zero, whereas they are negative for writing. However, the effects are
very imprecisely estimated for both reading and writing outcomes. They are not informative
about the size and magnitude of any effect. However, the estimated effect for maths is
positive and significant at the 5 per cent level in the first three columns (at the 10% level in
19
Results are weighted by the number of pupils in the year group. The results are identical using individual-
level data.
19

more detailed specifications). The coefficient is fairly stable across specifications. The
second stage effect is 1.27 (se: 0.69).20
This suggests that a 10 percentage point increase in
the percentage of white non-native speakers would increase the average attainment of native
English speakers by about 1 percentile point (although this effect is only significant at the 10
per cent level). As discussed above, this effect is a Local Average Treatment Effect and not
necessarily generalizable to students outside the complier group (who are students attending
Catholic schools with new entrants that appear to have entered their school on account of the
immigration decision of their parents, combined with a preference for Catholic schooling). If
we restrict the sample only to Catholic and Church of England schools, the effect for maths is
larger 2.22 (se=0.73).
If the positive estimate on maths genuinely reflects a causal impact, we can only
speculate about the mechanism. The instrument is not correlated with observable school
inputs (per pupil expenditure and the pupil-teacher ratio), nor is it correlated with cohort
size.21
It might be because children from these Eastern European families have (unobserved)
characteristics that influence other children or the classroom environment in a positive way.
For example, this could be better behaviour or a stronger work ethos. It is certainly clear from
other studies that the A8 immigrants are very positively selected on education and labour
market attachment. Also, given that white non-natives are closer to native English speakers in
terms of their own maths attainment at age 11 (shown in Table 2), it makes sense to find a
positive peer effect for this subject but not necessarily for reading and writing where they are
a lot weaker than their native English-speaking peers. It is also relevant to note that other
papers investigating peer group effects in English primary schools have found no evidence of
20
This estimate comes from the simple specification (column 1 of Tables 10 and 12). 21
Estimating the basic specification with the dependent variables as the pupil-teacher ratio, per pupil
expenditure and log cohort size gives rise (respectively) to estimates on the coefficient of interest
(Catholic*spline) of -0.076(0.05), 0.000(0.001) and 0.005(0.004).
20

an average effect (Gibbons and Telhaj, 2008) although there does seem to an effect at more
extreme parts of the ability distribution (Lavy, Silva and Weinhardt, 2009).
5. Conclusion
This investigation suggests that the negative association in the raw data between the
percentage of non-native speakers and the educational attainment of native English speakers
is easily removed – even by controlling for very limited characteristics of native English
speakers. The negative correlation can be explained by sorting of non-native speakers into
schools with less desirable characteristics. Under certain assumptions, the strategies used in
this paper can be used to make an inference about causal effects. Both strategies suggest that
negative effects can be ruled out. This is not surprising in the light of positive selection of
first and second immigrants to the UK in terms of their educational attainment, although it
does refute perceptions (in the media) that the increase in students who do not speak English
as a first language is detrimental to the education of native English speakers.
The result also makes sense in the context of other research about ethnic minorities in
England. Dustmann, Machin and Schonberg (2008) show that most ethnic minority groups
progress through primary school at a faster rate than white British students (as measured by
the increase in attainment between age 7 and 11) and that improvements in the proficiency
of the English language is likely to be the most important contributing factor. Thus it seems
likely that most primary-aged students catch up in English proficiency at a rate such that they
do not impede the progress of their native-speaking peers.
21

References
Ammermueller, A., and J-S Pischke, (2009). Peer effects in European primary schools:
evidence from PIRLS. Journal of Labour Economics. 27: 315-348.
Bell, B., S. Machin, and F. Fasani, (2010), Crime and Immigration: Evidence from Large
Immigrant Waves. CReAM Discussion Paper. No. 12/10. 2010.
Betts, J (1998) educational crowding out: Do immigrants affect educational attainment of
American minorities? In D. Hammermesh and Frank D. Bean (eds), Help or
hindrance? The economic implications of immigration for African-Americans, New
York: Russell Sage foundation
Bifulco, R., J.M.Fletcher, and S.L. Ross. (2011), The effect of classmate characteristics on
post-secondary outcomes: evidence from the Add Health. American Economic
Journal: Economic Policy, 3(1): 25-53.
Black, S. E., P. Devereux and K. Salvanes, (2010), Under pressure? The effect of peers on
outcomes of young adults. IZA Discussion Papers. 4946. Institute for the Study of
Labor (IZA).
Blanchflower, D., G., and Shadforth, C. (2009). Fear, unemployment and migration. The
Economic Journal. 119 (535), F136-182.
Borjas (2004), Do foreign students crowd out native students from graduate programs?
NBER working paper 10349
Brunello, G., and L. Rocco, (2011), The effect of immigration on the school performance of
natives: cross-country evidence using PISA test scores. IZA Discussion Papers. 5479.
Institute for the Study of Labor (IZA).
Dustmann, C., T. Frattini and C. Halls, (2010), Assessing the Fiscal Costs and Benefits of A8
Migration to the UK, Fiscal Studies, 31: 1-41
Dustmann, C., T. Frattini, N. Theodorpoulos, (2011), Ethnicity and Second Generation
Immigrants. Chapter 15 in P. Gregg and J. Wadsworth: The Labour Market in Winter:
The State of Working Britain 2010. Oxford University Press.
Dustmann, E., and A. Glitz, (2011), Migration and Education, in E., Hanushek, S. Machin
and L. Woessmann (eds). Handbook of the Economics of Education. Volume 4: 327-
441.
Dustmann, C., S. Machin and U. Schonberg, (2010), Educational Achievement and Ethnicity
in Compulsory Schooling. Economic Journal, 120(546): F272-F297
Gibbons, S. and Telhaj, S., (2008), Peers and achievement in England's secondary schools,
Spatial Economics Research Centre. Discussion Paper No. 1. London School of
Economics.
Gould, E., Lavy, V. and D. Paserman (2009), Does immigration affect the long term
educational outcomes of natives? Quasi experiment evidence, Economic Journal.
119(540): 1243-1269.
Hoxby, C., (1998), Do Immigrants Crowd Disadvantaged American Natives Out of Higher
Education? In D. Hammermesh and Frank D. Bean (eds), Help or hindrance? The
economic implications of immigration for African-Americans, New York: Russell
Sage foundation
Hoxby, C., (2000), Peer Effects in the Classroom: Learning from Gender and Race Variation.
NBER Working Paper. No. 7867.
Jensen, P. and A. Rasmussen, (2011), The Effect of Immigrant Concentration in Schools on
Native and Immigrant Children’s Reading and Math Skills. Economics of Education
Review. 30 (6), pp. 1503-1515
22

Lemos, S., and J. Portes, (2008), New Labour? The Impact of Migration from Central and
Eastern European Countries on the UK Labour Market. Department of Economics,
University of Leicester. Working Paper No. 08/09
Lavy, V., and A. Schlosser, (2011), Mechanisms and Impacts of Gender Peer Effects at
School. American Economic Journal: Applied Economics. 3(2): 1-33
Lavy, V., O. Silva, and F. Weinhardt, (2009), The Good, The Bad and The Average:
Evidence on the Scale and Nature of Ability Peer Effects in Schools, NBER Working
Paper 15600. Forthcoming in the Journal of Labor Economics.
Ohinata, A., and J.C. van Ours, (2011), How Immigrant Children Affect the Academic
Achievement of Native Dutch Children. IZA Discussion Paper. 6212. Institute for the
Study of Labor (IZA).
23

Figure 1: Percentage of Children (Year 6) who speak ‘English as an additional language’ and
are of white ethnic origin
Figure 2: Percentage of Children (Year 6) who speak ‘English as an additional language’ and
are of non-white ethnic origin
0.0
0.5
1.0
1.5
2.0
2.5
2002 2003 2004 2005 2006 2007 2008 2009
5
6
7
8
9
10
11
2002 2003 2004 2005 2006 2007 2008 2009
24

Figure 3. The relative impact of Eastern European Enlargement on Catholic Schools.
Percentage of Children (Year 6) who speak ‘English as an additional language’ and are of
white ethnic origin in the different school sectors.
0
0.5
1
1.5
2
2.5
3
3.5
4
4.5
5
2002 2003 2004 2005 2006 2007 2008 2009
Catholic
Church of England
Non-affiliated
25

Table 1: Minority ethnic origin of ‘Native English speakers’ and non-white speakers of
English as an ‘additional language’. Year 6 students in 2003 and 2009
2003 2009
Number Native
English
speakers
Speak
English ‘as an
additional
language’
Number Native
English
speakers
Speak
English ‘as
an
additional
language’
Bangladeshi 5,919 1.82 98.19 8,372 3.07 96.93
Black
Caribbean
8,684 92.58 7.42 8,010 95.37 4.63
Black (Other) 11,365 37.50 62.50 17,989 34.04 5.96
Chinese 1,770 18.70 81.30 1,900 19.11 80.89
Indian 12,742 14.17 85.83 13,062 19.05 80.95
Pakistani 15,398 5.28 94.72 18,983 8.53 91.47
Other 18,927 85.36 14.64 26,211 79.53 20.47
26

Table 2: Average characteristics of pupils in each group (Year 6 students, 2009)
Native English
speakers
Non-native English
speakers,
white origin
Non-native English
speakers,
non-white origin
Individual-level characteristics
% Free School Meals 14.57 17.87 28.31
% Special Ed. Needs
(with statement)
2.34 1.25 1.68
% Female 49.04 48.70 48.82
Reading score 49.75 (28.44) 40.71 (29.21) 41.47 (27.89)
Writing Score 49.29 (28.87) 41.80 (29.04) 46.44 (28.16)
Maths score 50.12 (28.56) 47.05 (29.19) 47.66 (29.35)
% Level4+ English 82.07 65.15 76.11
% Level4+ Maths 80.27 72.95 76.43
Average characteristics of schools attended by pupils in each category
(computed for all individuals within each category)
Nb. of pupils in the
schools where there
is at least 1 student of
the category
547,454 224,539 302,145
Average School size 323 (149) 370 (151) 371 (148)
Average % Free
School Meals
15.47 (13.24) 17.81 (13.53) 18.15 (13.82)
Average Per pupil
expenditure
£ 3,652 (723) £ 3,731 (738) £ 3,700 (737)
Average Pupil
teacher ratio
21.71 (3.09) 21.76 (2.99) 21.80 (2.95)
% Catholic schools 9.71 12.63 10.01
% Church of England 19.65 14.14 13.99
% Non-faith 69.91 72.52 75.48
Average Reading
score
48.78 (28.53) 47.72 (28.68) 47.63 (28.62)
Average Writing
Score
48.88 (28.83) 48.10 (28.85) 48.24 (28.73)
Average Maths Score 49.84 (28.66) 48.98 (28.93) 49.13 (28.88)
Average % Level4+
English
81.12 (39.13) 79.63 (40.27) 80.03 (39.97)
Average % Level4+
Maths
79.75 (40.19) 78.31 (41.21) 78.63 (41.00)
% Urban schools 81.16 91.15 94.31
% London schools 13.37 28.60 23.02
27

Table 3: Pupil mobility and non-native English speakers
Probability of changing primary school (between Year 2 and Year 6) for children who speak
English as a first language conditional on the proportion of ‘non-native English speakers’ in
future year group (i.e. Year 6) of original school attended
(1) (2) (3) (4) (5)
(a) All non-native English speakers considered together
Proportion non-native English speakers 0.288* 0.259* 0.289* 0.289* 0.284*
(0.005) (0.005) (0.010) (0.010) (0.009)
(b) Non-native speakers considered separately
by whether white or non-white ethnic origin
Proportion non-native English speakers
(white ethnic origin) 0.286* 0.267* 0.305* 0.304* 0.306*
(0.021) (0.020) (0.019) (0.019) (0.018)
Proportion non-native English speakers
(non-white ethnic origin) 0.289* 0.258* 0.283* 0.283* 0.276*
(0.006) (0.006) (0.010) (0.010) (0.010)
Year dummies x x x x x
Demographics x x x x
School fixed effects x x x
Prior attainment age 7 x x
Time-varying school characteristics x
Notes:
Number of observations: 2,192,151.
The average proportion of children who speak English as a first language who move school between Year 2 and
Year 6 is 0.14.
Demographics include gender, month of birth, whether the pupil is eligible to receive free school meals, whether
the child has a statement for ‘Special Educational Needs’ Time-varying school characteristics include log(per
pupil school expenditure); pupil-teacher ratio; % children eligible to receive free school meals; log(number of
pupils in year group).
28

Table 4: The relationship between the percentage of non-native English speakers and age 11 test results of native speakers
Coefficient on percentage of non-native English speakers in the school (regardless of ethnic background)
Dependent variable (1) (2) (3) (4) (5) (6) (7)
Reading percentile
-0.120* -0.051* 0.004 0.004 0.003 0.000 0.002
(0.005) (0.005) (0.007) (0.007) (0.007) (0.007) (0.008)
2,138,746 2,138,746 2,138,746 2,138,746 2,138,746 2,137,808 2,137,808
Writing percentile
-0.094* -0.029* -0.000 -0.000 0.000 -0.000 0.000
(0.005) (0.004) (0.008) (0.008) (0.008) (0.010) (0.010)
2,139,231 2,139,231 2,139,231 2,139,231 2,139,231 2,138,293 2,138,293
Math percentile
-0.138* -0.072* 0.014* 0.012 0.012 0.011 0.013
(0.005) (0.005) (0.007) (0.007) (0.007) (0.007) (0.007)
2,148,771 2,148,771 2,148,771 2,148,771 2,148,771 2,147,829 2,147,829
Year dummies x x x x x x x
Demographics of
native speakers x x x x x x
School fixed effects x x x x x
Prior attainment age 7
of native speakers x x x x
Time-varying school
characteristics x x x
Total number of non-
native English speakers
in the school
x x
School specific time
trends x
Notes: Standard errors adjusted for clustering on 11,879 schools.
Demographics include gender, month of birth, whether the pupil is eligible to receive free school meals, whether the child has a statement for ‘Special Educational Needs’ Time-varying school
characteristics include log(per pupil school expenditure); pupil-teacher ratio; % children eligible to receive free school meals; log(number of pupils in year group). Standard errors clustered at
school-level.
29

Table 5: The relationship between the percentage of non-native English speakers (by ethnic background) and age 11 test results of native speakers
Coefficient on percentage of non-native English speakers in the school (distinguishing by ethnic background)
Dependent variable (1) (2) (3) (4) (5) (6) (7)
Reading
percentile
%white non-native
speaker
0.072* 0.120* -0.001 0.002 0.003 -0.000 -0.002
(0.022) (0.020) (0.012) (0.012) (0.012) (0.013) (0.013)
% non-white non-
native speaker
-0.154* -0.081* 0.006 0.004 0.004 0.001 0.004
(0.006) (0.005) (0.008) (0.008) (0.008) (0.008) (0.009)
Writing
percentile
%white non-native
speaker
0.081* 0.125* -0.010 -0.006 -0.005 -0.005 -0.004
(0.021) (0.018) (0.015) (0.015) (0.015) (0.016) (0.017)
% non-white non-
native speaker
-0.125* -0.057* 0.004 0.002 0.002 0.002 0.002
(0.006) (0.005) (0.010) (0.010) (0.010) (1.001) (0.012)
Math
percentile
%white non-native
speaker
-0.004 0.044* 0.003 0.005 0.005 0.005 0.005
(0.021) (0.019) (0.012) (0.012) (0.012) (0.012) (0.012)
% non-white non-
native speaker
-0.162* -0.093* 0.018* 0.015 0.014 0.014 0.016
(0.006) (0.005) (0.008) (0.008) (0.008) (0.008) (0.008) Year dummies x x x x x x x
Demographics, native speakers x x x x x x
School fixed effects x x x x x
Prior attainment age 7, native speakers x x x x
Time-varying school characteristics x x x
Total number of non-native English
speakers in the school x x
School specific time trends x
Notes: demographics include gender, month of birth, whether the pupil is eligible to receive free school meals, whether the child has a statement for ‘Special Educational Needs’ Time-varying
school characteristics include log(per pupil school expenditure); pupil-teacher ratio; % children eligible to receive free school meals; log(number of pupils in year group). Number of
observations when the dependent variable is reading score, writing score and maths score are 2,138,746; 2,139,231; and 2,148, 771 respectively. Standard errors clustered at school-level.
30

Table 6: The relationship between the percentage of non-native English speakers and age 11 test results of native speakers: non-linearities?
Coefficient on percentage of non-native English speakers in the school (regardless of ethnic background)
Dependent variable (1) (2) (3) (4) (5) (6) (7)
Reading
percentile
<=median :
(<=8%, non-native speakers)
-0.294* -0.130 -0.036 -0.043 -0.018 -0.022 0.026
(0.150) (0.130) (0.081) (0.079) (0.079) (0.079) (0.126)
>median :
(>=8% non-native speakers)
-2.682* -0.879* 0.031 -0.036 -0.033 -0.068 0.117
(0.222) (0.188) (0.138) (0.136) (0.136) (0.139) (0.220)
Writing
percentile
<=median -0.206 -0.055 -0.029 -0.030 0.000 0.001 -0.031
(0.151) (0.134) (0.115) (0.114) (0.114) (0.114) (0.086)
>median -2.141* -0.453* 0.141 0.085 0.089 0.089 -0.204
(0.204) (0.176) (0.191) (0.192) (0.192) (0.196) (0.150)
Math
percentile
<=median -0.513* -0.342* 0.011 0.003 0.055 0.050 0.090
(0.149) (0.131) (0.080) (0.079) (0.079) (0.079) (0.081)
>median -3.537* -1.793* -0.079 -0.183 -0.166 -0.213 -0.167
(0.216) (0.186) (0.139) (0.138) (0.138) (0.140) (0.144)
Year dummies x x x x x x x
Demographics of native speakers x x x x x x
School fixed effects x x x x x
Prior attainment age 7, native speakers x x x x
Time-varying school characteristics x x x
Total number of non-native English
speakers in school x x
School specific time trends x Notes: demographics include gender, month of birth, whether the pupil is eligible to receive free school meals, whether the child has a statement for ‘Special Educational Needs’ Time-varying
school characteristics include log(per pupil school expenditure); pupil-teacher ratio; % children eligible to receive free school meals; log(number of pupils in year group). Standard errors
clustered at school-level. Number of observations when the dependent variable is reading score, writing score and maths score are 2,138,747; 2,139,232; and 2,148, 772 respectively. In 2003,
the proportion of schools with no non-native English speakers, 0-8% non-native speakers and >8% non-native speakers was 63%, 19% and 18% respectively. By 2009, this had changed to
51%, 23% and 27% respectively.
31

Table 7: The relationship between the number of languages spoken in the year group and age 11 test results of native speakers (years 2007-2009)
Coefficient on percentage of non-native English speakers in the school (regardless of ethnic background)
Dependent variable (1) (2) (3) (4)
Reading percentile
-0.412* -0.173* 0.024 0.056
(0.034) (0.029) (0.042) (0.043)
907,362 907,362 907,362 907,362
Writing percentile
-0.326* -0.097* 0.042 0.078
(0.033) (0.029) (0.056) (0.057)
907,666 907,666 907,666 907,666
Math percentile
-0.495* -0.263* 0.036 0.062
(0.033) (0.029) (0.039) (0.039)
911,781 911,781 911,781 911,781
Year dummies x x x x
Demographics, native speakers x x x
School fixed effects x x
Prior attainment age 7, native
speakers x
Notes: Standard errors adjusted for clustering on 11,873 schools.
Demographics include gender, month of birth, whether the pupil is eligible to receive free school meals, whether the child has a statement for ‘Special Educational Needs’. Standard errors
clustered at school-level.
32

Table 8: The relationship between the percentage of non-native English speakers (by ethnic background) and age 11 test results of native speakers: Heterogeneity
Coefficient on percentage of non-native English speakers in the school (distinguishing by ethnic background)
Pupils eligible to receive
free school meals
Pupils who achieved poorly
in tests at age 7.
Pupils in London schools
Dependent variable (1) (2) (3) (4) (5) (6)
Reading
percentile
%white non-native speaker 0.098* 0.001 0.115* -0.003 -0.034 -0.023
(0.019) (0.021) (0.016) (0.020) (0.011) (0.021)
% non-white non-native speaker -0.016* 0.006 -0.020* -0.042* -0.235* 0.003
(0.005) (0.014) (0.004) (0.013) (0.013) (0.014)
291,670 291,588 381,642 381,456 231,807 231,798
Writing
percentile
%white non-native speaker 0.123* -0.002 0.105* -0.002 -0.008 -0.026
(0.020) (0.024) (0.014) (0.022) (0.029) (0.027)
% non-white non-native speaker -0.003 -0.006 -0.015* -0.052* -0.196* 0.004
(0.005) (0.016) (0.004) (0.014) (0.012) (0.019)
291,779 291,679 382,005 381,818 231,881 231,872
Math
percentile
%white non-native speaker 0.025 0.028 0.031 0.020 -0.053* -0.004
(0.019) (0.023) (0.014) (0.020) (0.031) (0.019)
% non-white non-native speaker -0.027* 0.019 -0.036 -0.022 -0.232* -0.007
(0.005) (0.014) (0.004) (0.013) (0.013) (0.014)
295,384 295,302 390,957 390,767 233,102 233,093
Year dummies x x x x x x
Demographics, native speakers x x x
School fixed effects x x x
Prior attainment age 7, native speakers x x x
Time-varying school characteristics x x x
Total number of non-native English speakers
in school x x
x
School specific time trends x x x Notes: demographics include gender, month of birth, whether the pupil is eligible to receive free school meals, whether the child has a statement for ‘Special Educational Needs’ Standard
errors clustered at school-level. Time-varying school characteristics include log(per pupil school expenditure); pupil-teacher ratio; % children eligible to receive free school meals; log(number
of pupils in year group). Standard errors clustered at school-level. Pupils who ‘achieved poorly in tests at age 7’ are those who failed to attain the expected level (level 2) in tests of reading,
writing or maths. This is about 20% of the sample of native speakers
33
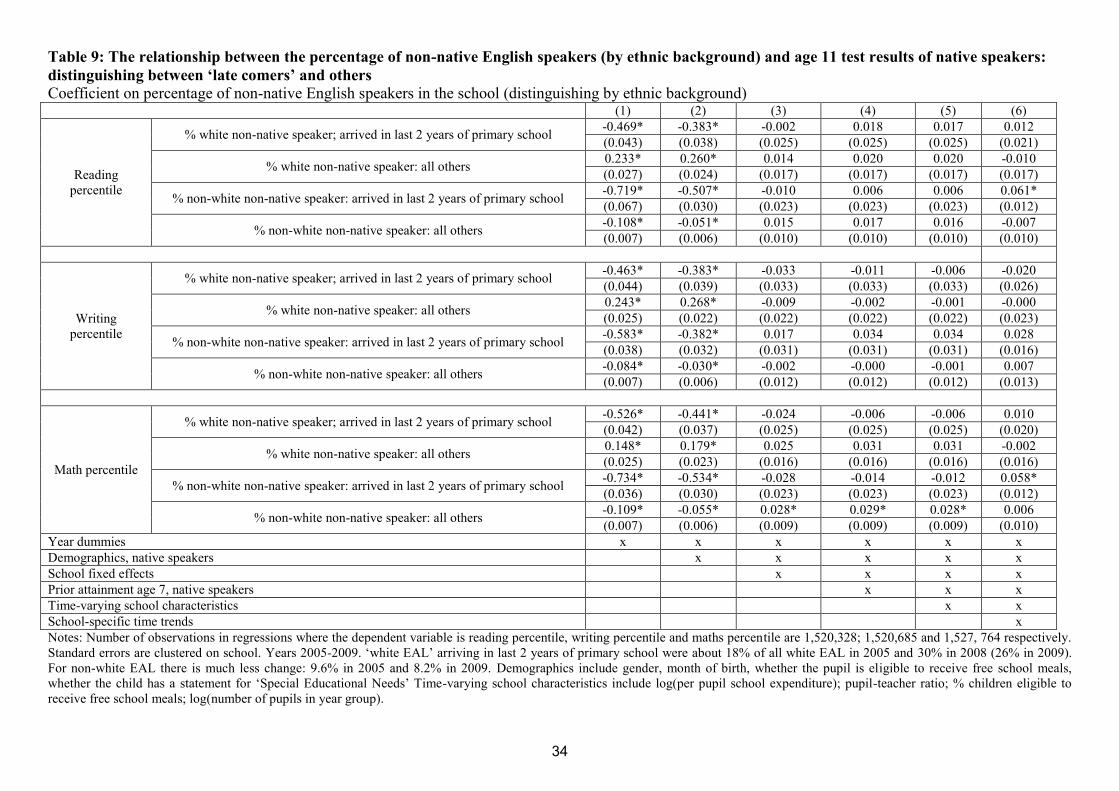
Table 9: The relationship between the percentage of non-native English speakers (by ethnic background) and age 11 test results of native speakers: distinguishing between ‘late comers’ and others Coefficient on percentage of non-native English speakers in the school (distinguishing by ethnic background)
(1) (2) (3) (4) (5) (6)
Reading
percentile
% white non-native speaker; arrived in last 2 years of primary school -0.469* -0.383* -0.002 0.018 0.017 0.012
(0.043) (0.038) (0.025) (0.025) (0.025) (0.021)
% white non-native speaker: all others 0.233* 0.260* 0.014 0.020 0.020 -0.010
(0.027) (0.024) (0.017) (0.017) (0.017) (0.017)
% non-white non-native speaker: arrived in last 2 years of primary school -0.719* -0.507* -0.010 0.006 0.006 0.061*
(0.067) (0.030) (0.023) (0.023) (0.023) (0.012)
% non-white non-native speaker: all others -0.108* -0.051* 0.015 0.017 0.016 -0.007
(0.007) (0.006) (0.010) (0.010) (0.010) (0.010)
Writing
percentile
% white non-native speaker; arrived in last 2 years of primary school -0.463* -0.383* -0.033 -0.011 -0.006 -0.020
(0.044) (0.039) (0.033) (0.033) (0.033) (0.026)
% white non-native speaker: all others 0.243* 0.268* -0.009 -0.002 -0.001 -0.000
(0.025) (0.022) (0.022) (0.022) (0.022) (0.023)
% non-white non-native speaker: arrived in last 2 years of primary school -0.583* -0.382* 0.017 0.034 0.034 0.028
(0.038) (0.032) (0.031) (0.031) (0.031) (0.016)
% non-white non-native speaker: all others -0.084* -0.030* -0.002 -0.000 -0.001 0.007
(0.007) (0.006) (0.012) (0.012) (0.012) (0.013)
Math percentile
% white non-native speaker; arrived in last 2 years of primary school -0.526* -0.441* -0.024 -0.006 -0.006 0.010
(0.042) (0.037) (0.025) (0.025) (0.025) (0.020)
% white non-native speaker: all others 0.148* 0.179* 0.025 0.031 0.031 -0.002
(0.025) (0.023) (0.016) (0.016) (0.016) (0.016)
% non-white non-native speaker: arrived in last 2 years of primary school -0.734* -0.534* -0.028 -0.014 -0.012 0.058*
(0.036) (0.030) (0.023) (0.023) (0.023) (0.012)
% non-white non-native speaker: all others -0.109* -0.055* 0.028* 0.029* 0.028* 0.006
(0.007) (0.006) (0.009) (0.009) (0.009) (0.010)
Year dummies x x x x x x
Demographics, native speakers x x x x x
School fixed effects x x x x
Prior attainment age 7, native speakers x x x
Time-varying school characteristics x x
School-specific time trends x
Notes: Number of observations in regressions where the dependent variable is reading percentile, writing percentile and maths percentile are 1,520,328; 1,520,685 and 1,527, 764 respectively.
Standard errors are clustered on school. Years 2005-2009. ‘white EAL’ arriving in last 2 years of primary school were about 18% of all white EAL in 2005 and 30% in 2008 (26% in 2009).
For non-white EAL there is much less change: 9.6% in 2005 and 8.2% in 2009. Demographics include gender, month of birth, whether the pupil is eligible to receive free school meals,
whether the child has a statement for ‘Special Educational Needs’ Time-varying school characteristics include log(per pupil school expenditure); pupil-teacher ratio; % children eligible to
receive free school meals; log(number of pupils in year group).
34
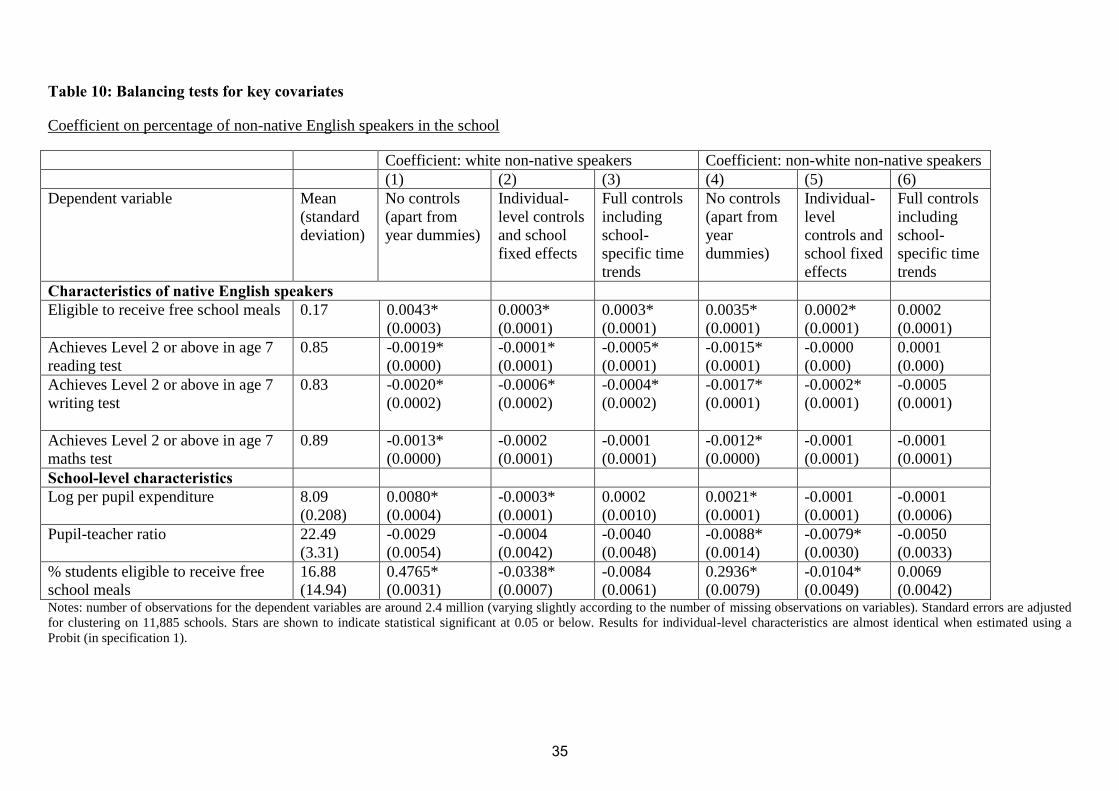
Table 10: Balancing tests for key covariates
Coefficient on percentage of non-native English speakers in the school
Coefficient: white non-native speakers Coefficient: non-white non-native speakers
(1) (2) (3) (4) (5) (6)
Dependent variable Mean
(standard
deviation)
No controls
(apart from
year dummies)
Individual-
level controls
and school
fixed effects
Full controls
including
school-
specific time
trends
No controls
(apart from
year
dummies)
Individual-
level
controls and
school fixed
effects
Full controls
including
school-
specific time
trends
Characteristics of native English speakers
Eligible to receive free school meals 0.17 0.0043*
(0.0003)
0.0003*
(0.0001)
0.0003*
(0.0001)
0.0035*
(0.0001)
0.0002*
(0.0001)
0.0002
(0.0001)
Achieves Level 2 or above in age 7
reading test
0.85 -0.0019*
(0.0000)
-0.0001*
(0.0001)
-0.0005*
(0.0001)
-0.0015*
(0.0001)
-0.0000
(0.000)
0.0001
(0.000)
Achieves Level 2 or above in age 7
writing test
0.83 -0.0020*
(0.0002)
-0.0006*
(0.0002)
-0.0004*
(0.0002)
-0.0017*
(0.0001)
-0.0002*
(0.0001)
-0.0005
(0.0001)
Achieves Level 2 or above in age 7
maths test
0.89 -0.0013*
(0.0000)
-0.0002
(0.0001)
-0.0001
(0.0001)
-0.0012*
(0.0000)
-0.0001
(0.0001)
-0.0001
(0.0001)
School-level characteristics
Log per pupil expenditure 8.09
(0.208)
0.0080*
(0.0004)
-0.0003*
(0.0001)
0.0002
(0.0010)
0.0021*
(0.0001)
-0.0001
(0.0001)
-0.0001
(0.0006)
Pupil-teacher ratio 22.49
(3.31)
-0.0029
(0.0054)
-0.0004
(0.0042)
-0.0040
(0.0048)
-0.0088*
(0.0014)
-0.0079*
(0.0030)
-0.0050
(0.0033)
% students eligible to receive free
school meals
16.88
(14.94)
0.4765*
(0.0031)
-0.0338*
(0.0007)
-0.0084
(0.0061)
0.2936*
(0.0079)
-0.0104*
(0.0049)
0.0069
(0.0042) Notes: number of observations for the dependent variables are around 2.4 million (varying slightly according to the number of missing observations on variables). Standard errors are adjusted
for clustering on 11,885 schools. Stars are shown to indicate statistical significant at 0.05 or below. Results for individual-level characteristics are almost identical when estimated using a
Probit (in specification 1).
35

Table 11: First stage
Dependent variable: percentage of children (Year 6) who speak ‘English as an additional language’ and are
of white ethnic origin
(1) (2) (3) (4) (5)
Catholic*spline 0.263* 0.254* 0.267* 0.268* 0.265*
(0.057) (0.057) (0.063) (0.063) (0.063)
F-stat 21.61 19.88 17.89 17.97 17.58
R-squared 0.020 0.048 0.678 0.678 0.678
IV basic specification x x x x x
Demographics x x x x
School fixed effects x x x
Prior attainment, age 7 x x
Time-varying school
characteristics
x
Notes: Number of observations is 81,715 schools. The standard error is clustered on school. The basic specification includes a
control for whether the school is Catholic; a time trend; spline (zero to 2005); Catholic School * time trend.
Table 12: Falsification test
% non-white,
non-native
speakers
Whether
native
speaker is
eligible to
receive free
school meals
Whether
native speaker
achieves above
Level 2 in age
7 reading test
Whether native
speaker achieves
above Level 2 in
age 7 writing test
Whether native
speaker achieves
above Level 2 in
age 7 maths test
(1) (2) (3) (4) (5)
Catholic*spline 0.048 0.046 0.046 0.057 0.053
(0.078) (0.078) (0.078) (0.079) (0.079)
Notes: Number of observations is 81,715 schools. The standard error is clustered on school. Controls are included as for the basic
IV specification. See notes to Table 10.
Table 13: Reduced form: coefficient on Catholic school * spline Dependent variable (1) (2) (3) (4) (5)
Reading percentile 0.043 0.110 0.038 -0.014 -0.007
(0.162) (0.167) (0.171) (0.168) (0.168)
Writing percentile -0.107 -0.062 -0.116 -0.170 -0.153
(0.234) (0.236) (0.250) (0.249) (0.249)
Math percentile 0.334* 0.427* 0.328* 0.283 0.291
(0.165) (0.165) (0.171) (0.168) (0.167)
IV basic specification x x x x x
Demographics, native
speakers x x x x
School fixed effects x x x
Prior attainment, age
7: native speakers x x
Time-varying school
characteristics x
Notes: See notes for Table. 10. Demographics include gender, month of birth, whether the pupil is eligible to receive free school
meals, whether the child has a statement for ‘Special Educational Needs’ Time-varying school characteristics include log(per
pupil school expenditure); pupil-teacher ratio; % children eligible to receive free school meals; log(number of pupils in year
group). Standard errors clustered at school-level.
36

Appendix 1
Table A1: Basic regressions (estimated for schools actually attended – i.e. not taking account of mobility issues).
Coefficient on proportion of non-native English speakers in the school (regardless of ethnic background)
Dependent variable (1) (2) (3) (4) (5) (6) (7)
Reading percentile -0.121* -0.044* 0.018* 0.016* 0.015* 0.012 0.005
(0.006) (0.005) (0.007) (0.016) (0.007) (0.008) (0.008)
2,138,746 2,138,746 2,138,746 2,138,746 2,138,746 2,071,988 2,138,742
Writing percentile -0.095* -0.022* 0.011 0.010 0.010 0.009 0.006
(0.006) (0.005) (0.010) (0.010) (0.010) (0.011) (0.011)
2,139,231 2,139,231 2,139,231 2,139,231 2,139,231 2,072,451 2,139,227
Math percentile -0.138* -0.064* 0.030* 0.028* 0.027* 0.026* 0.018*
(0.006) (0.005) (0.008) (0.007) (0.007) (0.008) (0.007)
2,148,771 2,148,771 2,148,771 2,148,771 2,148,771 2,081,446 2,148,767
Year dummies x x x x x x x
Demographics x x x x x x
School fixed effects x x x x x
Prior attainment age 7 x x x x
Time-varying school
characteristics x x x
Total number of non native
English speakers in the school x
School specific time trends x
Notes: demographics include gender, month of birth, whether the pupil is eligible to receive free school meals, whether the child has a statement for ‘Special Educational Needs’ Time-varying
school characteristics include log(per pupil school expenditure); pupil-teacher ratio; % children eligible to receive free school meals; log(number of pupils in year group). Standard errors
clustered at school-level.
37

Table A2: The relationship between the percentage of non-native English speakers and age 7 teacher assessment
Coefficient on percentage of non-native English speakers in the school (regardless of ethnic background)
Dependent variable (1) (2) (3) (4)
Reading percentile
-0.154* -0.069* 0.004 0.005
(0.005) (0.004) (0.006) (0.006)
3,348,391 3,348,391 3,348,391 3,348,391
Writing percentile
-0.182* -0.091* -0.006 -0.004
(0.006) (0.005) (0.008) (0.008)
3,348,389 3,348,389 3,348,389 3,348,389
Math percentile
-0.112* -0.053* 0.004 0.005
(0.004) (0.003) (0.006) (0.006)
3,348,388 3,348,388 3,348,388 3,348,388
Year dummies x x x x
Demographics x x x
School fixed effects x x
Time-varying school
characteristics x
Notes: The dependent variable is whether or not the student achieves Level 2 or above for teacher assessment at age 7 (i.e. the end of Key Stage 1). A continuous score is not available.
Demographics include gender, month of birth, whether the pupil is eligible to receive free school meals, whether the child has a statement for ‘Special Educational Needs’ Time-varying school
characteristics include log(per pupil school expenditure); pupil-teacher ratio; % children eligible to receive free school meals; log(number of pupils in year group). Standard errors clustered at
school-level.
38