cedr transnational road research programme call … · cedr transnational road research programme...
TRANSCRIPT

CEDR Call 2012: Safety
CEDR Transnational Road Research Programme Call 2012: SAFETY Funded by: The National Road Administrations of Norway, Sweden, The United Kingdom, Belgium/Flanders, Germany, and Ireland.
Towards a European Guideline for Speed Management Measures in Work
Zones
Deliverable 5.1 March 3rd, 2015
Coordinator: Swedish National Road and Transport Research Institute (VTI)
Partners: Austrian Institute of Technology GmbH (AIT) Belgian Road Research Centre (BRRC) Transport Research Centre (CDV) Università di Firenze (UNIFI)
ASAP
CEDR Call 2012: Safety
CEDR Call2012: Safety
ASAP Appropriate Speed Saves all People
Deliverable 5.1: Final Report
Due date of deliverable: 31.01.2015 Actual submission date 03.03.2015:
Start date of project: 01.02.2013 End date of project: 31.01.2015
Main Authors of this deliverable: G. Sorensen, A. Bolling, A. Vadeby, VTI X. Cocu, BRRC A. Nocentini, UNIFI M. Aleksa, P. Saleh, AIT
Contributions from: P. Tučka, M. Ščerba, CDV F. La Torre, UNIFI
Version: 03.03.2015

CEDR Call 2012: Safety
Table of contents EXECUTIVE SUMMARY ....................................................................................................... 5 1 Introduction .................................................................................................................... 1
1.1 Overview of the Report ............................................................................................ 1 1.2 Accident risk and road worker safety ....................................................................... 2
2 The ASAP project ........................................................................................................... 5 2.1 Structure of the ASAP project .................................................................................. 5 2.2 WP2 – State of the Art on Speed Management Methods ........................................ 6
2.2.1 Conclusions ..................................................................................................... 8 2.3 WP3 – Experience of Speed Management in Practise ............................................ 8
2.3.1 Methodology .................................................................................................... 8 2.3.2 Showcase: Accident analysis in Italian work zones .......................................... 9 2.3.3 General conclusions and recommendations ................................................... 11
2.4 WP4 – Speed Management at Work Zones - Field Showcases and Stakeholder’s Consultation ..................................................................................................................... 12
2.4.1 Field showcases ............................................................................................. 12 2.4.2 Consultation of external experts ..................................................................... 14 2.4.3 Conclusions ................................................................................................... 15
2.5 WP5 – ASAP Recommendations and Final Report ............................................... 16 2.5.1 Structure of the ASAP guidelines ................................................................... 16
2.6 Dissemination........................................................................................................ 24 2.6.1 Portals for dissemination ................................................................................ 24 2.6.2 The ASAP logotype and website .................................................................... 25 2.6.3 ASAP project reports and technical notes ...................................................... 25 2.6.4 Workshops ..................................................................................................... 26 2.6.5 Presentations at conferences ......................................................................... 26
2.7 Implementation ...................................................................................................... 27 2.7.1 National guidelines ......................................................................................... 27 2.7.2 Collaboration with universities ........................................................................ 27 2.7.3 Perspectives for future studies ....................................................................... 27
2.8 Discussion and conclusions .................................................................................. 28 2.8.1 Measures of particular interest ....................................................................... 28 2.8.2 The ASAP guideline ....................................................................................... 29
3 ASAP Guideline ........................................................................................................... 31 4 Measures for appropriate speed in work zones ............................................................ 37
4.1 Temporary speed limit reduction – Static speed limit signs.................................... 39 4.2 Temporary speed limit reduction – Variable speed limit signs ............................... 41 4.3 Advisory speed sign .............................................................................................. 43 4.4 Automated speed enforcement – Spot speed cameras ......................................... 44 4.5 Automated speed enforcement – Section control .................................................. 46 4.6 Driver speed monitoring displays........................................................................... 48 4.7 Speed camera with worker warning ....................................................................... 50 4.8 Speed camera sign ............................................................................................... 52 4.9 Police presence ..................................................................................................... 53 4.10 Police dummy........................................................................................................ 55 4.11 Graduated Fixed Penalties .................................................................................... 57 4.12 Chicanes ............................................................................................................... 58 4.13 Crossover design .................................................................................................. 59 4.14 Narrowed lane width.............................................................................................. 60 4.15 Temporary separation of directions ....................................................................... 62

CEDR Call 2012: Safety
4.16 One-way traffic control – Manual flagger ............................................................... 63 4.17 One-way traffic control – Automated signal devices .............................................. 64 4.18 One-way traffic control – Pilot vehicle .................................................................... 66 4.19 Adhesive rumble strips .......................................................................................... 67 4.20 Portable Rumble Strips ......................................................................................... 69 4.21 Optical speed bars ................................................................................................ 71 4.22 Variable message signs ........................................................................................ 72 4.23 Emotional messages ............................................................................................. 74 4.24 Combination of measures ..................................................................................... 75
4.24.1 Combined measures/treatments proven to be successful .............................. 76 5 Acknowledgement ........................................................................................................ 77 6 References ................................................................................................................... 78
6.1 Literature database ............................................................................................... 78 6.2 Reference list ........................................................................................................ 78

CEDR Call 2012: Safety
EXECUTIVE SUMMARY
The ASAP project - Appropriate Speed saves All People - was designed to address the issues of speed management in work zones, with its specific focus on speed reduction measures and treatments in order to increase road safety both for road users and road workers. It is important that road users are presented with consistent and understandable measures, regardless of where they travel within Europe. In general it is beneficial to have suitable pre-information about the location of the work zone combined with physical measures which are leading the road user to a safer driving behaviour (appropriate speed) and is raising awareness of the on-coming variation in the road section. Important for realizing appropriate speeds is that speed limits are credible and this is achieved thru proper work zone design - so that people are willing to drive within the speed limit (forced: not only physical but as well psychological - the influence of the design and the measures itself). Different evaluated methods and measures to control and adapt speed in a proper way have been investigated. Those evaluated measures/treatments are: Temporary speed limit reduction – Static and variable sign; Advisory speed signs; Automated speed enforcement – Spot speed camera and Section control; Driver speed monitoring display; Speed camera with worker warning; Speed camera sign; Police presence (with or without speed control); Police dummy; Graduated Fixed Penalties; Chicanes; Crossover design; Narrowed lane width; Temporary separation of directions; One-way traffic control – Manual flagger, Automated signal devices, and Pilot vehicle; Adhesive rumble strips; Portable Rumble Strips; Optical speed bars; Variable message signs; and Emotional messages. The final report (D5.1) incorporates the main findings of the five work packages, including the project recommendations for efficient speed management at road work zones, which is packaged as a stand-alone document. This report links existing knowledge (literature), practical experience (projects and stakeholders) and analyses of field trials, and delivers a practical guidance for work zone designers, road operators, engineers and other professionals working in the field of road safety planning. The ASAP project is providing a guide not for setting the speed limit but for choosing the best speed reducing methods that will result in appropriate speed in work zones. The main content of this report includes:
- the organization of the road work speed management procedure in successive steps (flow chart and description of each step)
- a procedure on how to choose the proper speed management measure - the clustering of recommended measures (distinguished between road type, work
type and location of measure) - detailed descriptions (factsheets) of the different measures/treatments, including the
main advantages, recommendations, fields of application, expected impacts, on-site development issues and information on costs.
Beside a comprehensive overview of the whole project evolution (WP2 – State of the Art on Speed Management Methods; WP3 – Experience of Speed Management in Practise; WP4 – Speed Management at Work Zones - Field Showcases and Stakeholder’s Consultation; and WP5 – Recommendation and Final Report) and its specific findings, this report defines a common, harmonised set of speed reduction measures to be implemented for speed management in work zones. The project findings were analysed and summarized in this report and a best practice guide was set up. This type of documentation and advice is feasible to provide the road user with a familiar presentation of solutions to achieve

CEDR Call 2012: Safety
appropriate speed on different road types and work zone layouts, independent of the country they travel through. This information is also crucial for all national and local road administrations and contractors so they can use speed control approaches that have proven effectiveness in several countries. The aim of ensuring an increased safety level within work zones can just be fulfilled, if an appropriate speed is achievable. There are safety limitations and particular dangerous situations to consider both when deciding on speed limits and when securing speed levels in work zones. A chapter on accident risks and road works safety highlights the relationship between speed level and crash severity as an important factor for the safety of both road users and road workers. It also presents the essential elements (e.g. lane width, lane shift, lane deviation, crossing of the central reserve) for a safe road work design. It can be stated that most of the speed management methods reduce speeds - maybe only a few kilometres per hour compared with a work zone without this particular measure - however, even when only very small speed reductions are achieved, these methods may effectively alert drivers to an upcoming road work or a hazard within a road work and achieve a benefit in terms of safety.

CEDR Call 2012: Safety
1
1 Introduction
Speed management of traffic through work zones is crucial for the safety of both the road users and the road workers. It is important that European road users are presented with consistent traffic control techniques, regardless of where they travel within Europe. A transnational resource for best practice guidelines and financial implications of work zone speed control is, however, not available in Europe. A common information source should be made available to ensure European road users and road workers the best level of safety, regardless of the country or region. The ASAP project - Appropriate Speed saves All People - was designed to address the issues of speed management in work zones. Hence, the ASAP project is attended to help achieving the appropriate speed levels in work zones by recommending suitable speed management methods, whereas the decision process to achieve these levels is only marginally dealt with. The ASAP project was funded by the CEDR “TRANSNATIONAL ROAD RESEARCH PROGRAMME Call 2012 - Safety: Safety of road workers and interaction with road users”. The project activities aimed to collect analyse and propose harmonised work zone speed management methods using both European and global work zone safety data available to the project team. In this way the project answered to the three key elements of the development of harmonised documents for European work zones: 1) Review of previous successes, 2) Retrieval of available data to confirm and monitor best practices, and 3) Consultation of stakeholders to identify the format and scope of information needed for
European applications.
1.1 Overview of the Report
The main objective of the ASAP project was to produce guidance documents on how to achieve appropriate speed levels in work zones. This deliverable contains a summary of the work conducted within the frame of ASAP and is the synthesis of the results of the activities conducted in four different work packages. Work carried out includes a review of national guidelines and literature showing positive results from speed management methods in work zones, a collection and analysis of existing speed and accident data from some road work sites, field showcases and driving simulator study of low cost speed management methods. All are elements towards the construction of a European guideline for speed management methods in work zones. In the first chapter a short background to the project is given. The second chapter gives a description of the ASAP project. This chapter describes the ASAP work packages, the basis for the guideline development, gives advices for dissemination and implementation of the ASAP guidelines, discusses the results, draws conclusions and gives suggestions for further research. The third chapter provides the guideline itself and in the fourth chapter the different identified methods to achieve appropriate speed behaviour in work zones are presented along with main advantages and recommendations for each measure. Chapter 3 and chapter 4 form a stand-alone part of this report that can be used as a separate document. In chapter 6, references are listed along with a link to the literature database produced within the ASAP project.
CEDR Call 2012: Safety
2
1.2 Accident risk and road worker safety
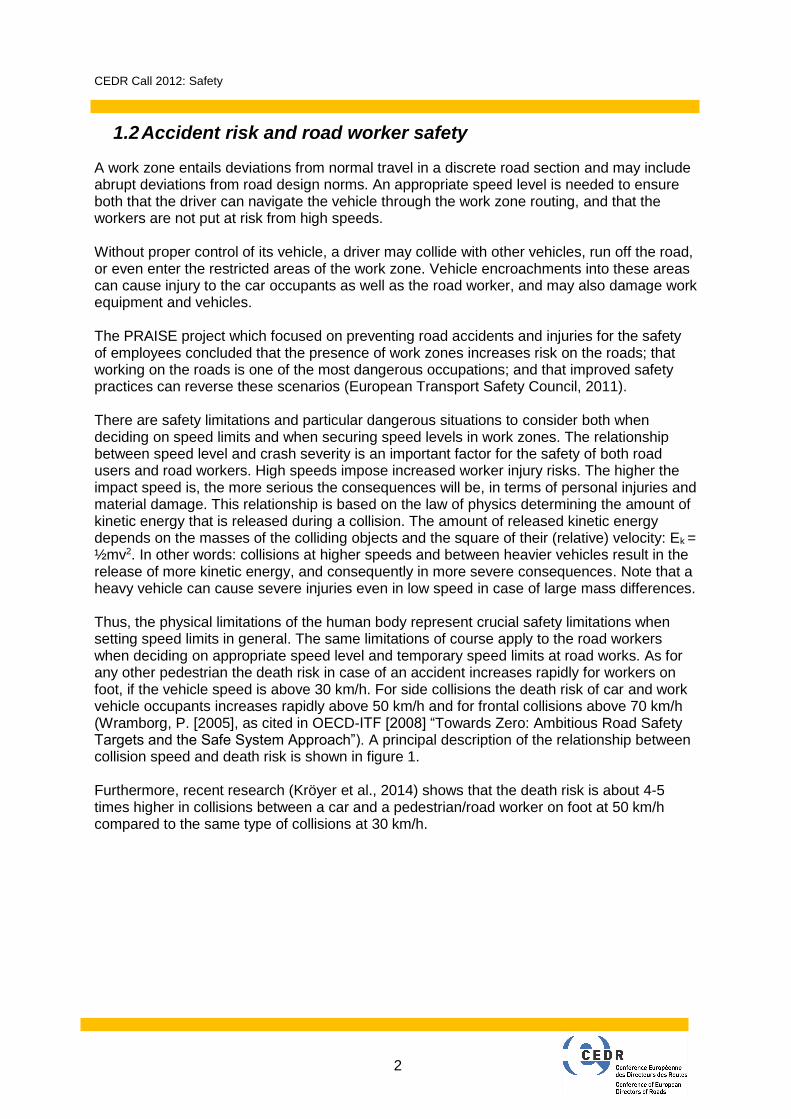
A work zone entails deviations from normal travel in a discrete road section and may include abrupt deviations from road design norms. An appropriate speed level is needed to ensure both that the driver can navigate the vehicle through the work zone routing, and that the workers are not put at risk from high speeds. Without proper control of its vehicle, a driver may collide with other vehicles, run off the road, or even enter the restricted areas of the work zone. Vehicle encroachments into these areas can cause injury to the car occupants as well as the road worker, and may also damage work equipment and vehicles. The PRAISE project which focused on preventing road accidents and injuries for the safety of employees concluded that the presence of work zones increases risk on the roads; that working on the roads is one of the most dangerous occupations; and that improved safety practices can reverse these scenarios (European Transport Safety Council, 2011). There are safety limitations and particular dangerous situations to consider both when deciding on speed limits and when securing speed levels in work zones. The relationship between speed level and crash severity is an important factor for the safety of both road users and road workers. High speeds impose increased worker injury risks. The higher the impact speed is, the more serious the consequences will be, in terms of personal injuries and material damage. This relationship is based on the law of physics determining the amount of kinetic energy that is released during a collision. The amount of released kinetic energy depends on the masses of the colliding objects and the square of their (relative) velocity: Ek = ½mv2. In other words: collisions at higher speeds and between heavier vehicles result in the release of more kinetic energy, and consequently in more severe consequences. Note that a heavy vehicle can cause severe injuries even in low speed in case of large mass differences. Thus, the physical limitations of the human body represent crucial safety limitations when setting speed limits in general. The same limitations of course apply to the road workers when deciding on appropriate speed level and temporary speed limits at road works. As for any other pedestrian the death risk in case of an accident increases rapidly for workers on foot, if the vehicle speed is above 30 km/h. For side collisions the death risk of car and work vehicle occupants increases rapidly above 50 km/h and for frontal collisions above 70 km/h (Wramborg, P. [2005], as cited in OECD-ITF [2008] “Towards Zero: Ambitious Road Safety Targets and the Safe System Approach”). A principal description of the relationship between collision speed and death risk is shown in figure 1. Furthermore, recent research (Kröyer et al., 2014) shows that the death risk is about 4-5 times higher in collisions between a car and a pedestrian/road worker on foot at 50 km/h compared to the same type of collisions at 30 km/h.
CEDR Call 2012: Safety
3
Figure 1. Relationship between collision speed and death risk. (Wramborg, P. [2005], as cited in OECD-ITF [2008] “Towards Zero: Ambitious Road Safety Targets and the Safe System Approach”).
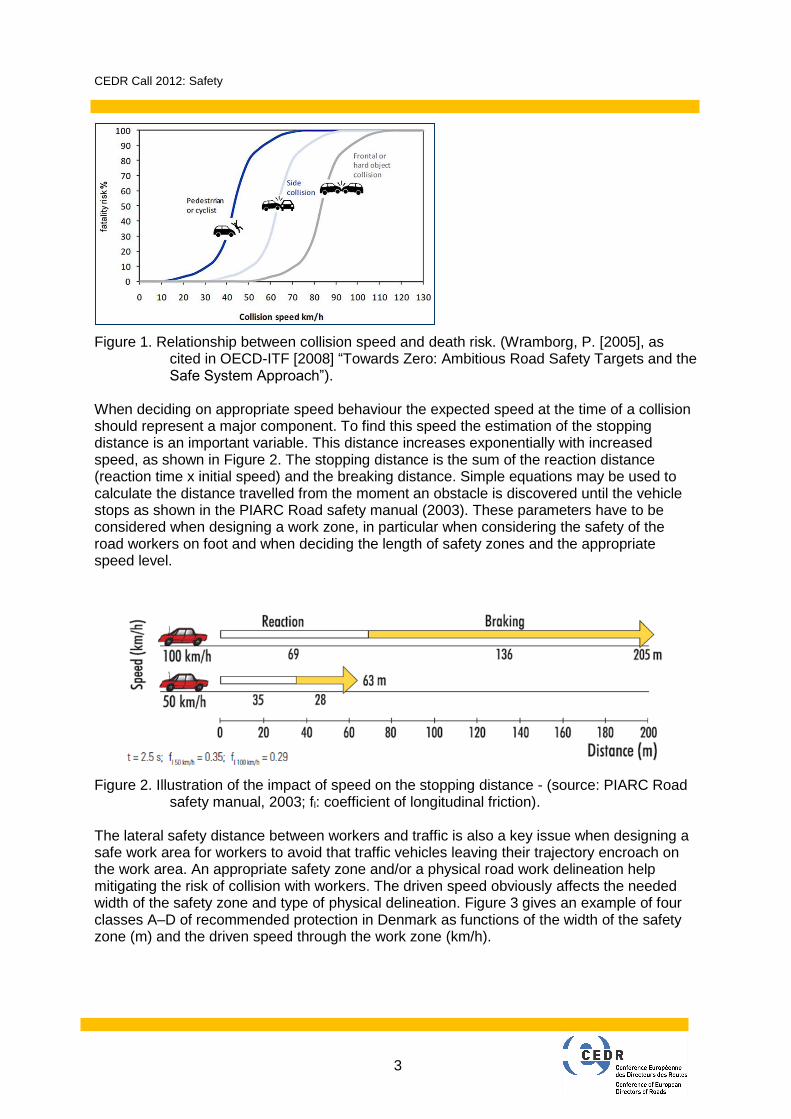
When deciding on appropriate speed behaviour the expected speed at the time of a collision should represent a major component. To find this speed the estimation of the stopping distance is an important variable. This distance increases exponentially with increased speed, as shown in Figure 2. The stopping distance is the sum of the reaction distance (reaction time x initial speed) and the breaking distance. Simple equations may be used to calculate the distance travelled from the moment an obstacle is discovered until the vehicle stops as shown in the PIARC Road safety manual (2003). These parameters have to be considered when designing a work zone, in particular when considering the safety of the road workers on foot and when deciding the length of safety zones and the appropriate speed level.
Figure 2. Illustration of the impact of speed on the stopping distance - (source: PIARC Road safety manual, 2003; fl: coefficient of longitudinal friction).
The lateral safety distance between workers and traffic is also a key issue when designing a safe work area for workers to avoid that traffic vehicles leaving their trajectory encroach on the work area. An appropriate safety zone and/or a physical road work delineation help mitigating the risk of collision with workers. The driven speed obviously affects the needed width of the safety zone and type of physical delineation. Figure 3 gives an example of four classes A–D of recommended protection in Denmark as functions of the width of the safety zone (m) and the driven speed through the work zone (km/h).

CEDR Call 2012: Safety
4
Figure 3. Example from Denmark of suggested longitudinal protection (A: traffic protection; B: barriers per 6 meter; C: edge marking plates or marking cones with light or marker pieces; D: edge marking plates or marking cones) as function of the width of the safety zone (m) and the vehicle speed (Vejdirektoratet, 2012).
Another essential element for safety at road work sites is related to the design of lane shifts and the crossing of the central reserve (if any). At such locations vehicles may be destabilised by the centrifugal force if the driven speed is not adapted to the design of the lane deviation (curve radius) and to the local road and pavement characteristics (lateral slope, transverse friction). All these factors must be considered together when designing these critical spots and deciding on the appropriate speed levels and the temporary speed limit schemes. PIARC Road safety manual (2003) gives the equation on how to calculate curve radius based on speed, friction and lateral slope. An example is given in Table 1 of influence of speed on the minimum curve radius. Increasing the speed by 40%, from 50 km/h to 70 km/h increases the minimum possible curve radius with 100% (local conditions being unchanged). Increasing the transversal friction µ by 33% (0.15 points) allows a 25% smaller
radius.
Table 1: Influence of speed and coefficient of transverse friction (µ) on the minimum curve
radius (example)
Speed 50 km/h 60 km/h 70 km/h 80 km/h 90 km/h
Minimum curve radius 44 m 63 m 86 m 112 m 142 m
With friction coefficient µ 0,45
Speed 50 km/h 60 km/h 70 km/h 80 km/h 90 km/h
Minimum curve radius 33 m 47 m 64 m 84 m 106 m
With friction coefficient µ 0,60
Sp
ee
d o
f W
ork
Zon
e (
km
/h)
Width of Safety Zone (m)

CEDR Call 2012: Safety
5
2 The ASAP project
The ASAP project – Appropriate speed saves all people – ran from February 2013 to January 2015 with funding from the CEDR “TRANSNATIONAL ROAD RESEARCH PROGRAMME Call 2012 - Safety: Safety of road workers and interaction with road users”.
2.1 Structure of the ASAP project
The structure of the ASAP project is described in Figure 4.
Figure 4. Structure of the ASAP project. Initially both theoretical and practical information was gathered within work package 2, Review of Speed Management Methods. About 270 research reports and scientific papers, as well as national guidelines were collected, reviewed and gathered in an unique database where all the documents were classified based on the main topic, the authors, the title, the references, the year of publication and the status (“ongoing” project or “completed”). The database can be downloaded from the ASAP website (http://asap.fehrl.org/). Work package 3, Experience of Speed Management in Practice, aimed at providing knowledge and guidance from previous experience with speed management programs in road work zones, including on-going projects, and identifying the practical usability and effectiveness of some specific speed control systems and measures preferred by the National Road Administrations. WP3 gathered detailed existing data and results from speed management systems in use. To achieve this objective, a data collection related to work zones in Europe and the USA was conducted. This work resulted in selections of low cost speed management methods that were either demonstrated in field showcases or tested in a driving simulator in work package 4. Furthermore, in this work package stakeholders were consulted on the subject of appropriate speed and associated parameters. In work package 5 the project findings were analysed and summarized in this present report and a best practice guide/check list was set up.

CEDR Call 2012: Safety
6
All along the project the management and dissemination activities were handled within work package 1.
2.2 WP2 – State of the Art on Speed Management Methods
The work package 2, reported in Deliverable 2.1, contained a review of the national guidelines on work zone speed limits conducted for several European Countries, Canada, the United States and Australia. The review was the first technical activity in the ASAP project to establish the state-of-the-art of national criteria for speed management in work zones, to identify the effectiveness of different speed management methods reported in literature, and to evaluate enforcement strategies, especially graduated fixed penalties. Over 270 technical documents were collected and reviewed by the project team. The most relevant documents were summarized, grouped under three main themes: “Criteria for Setting the Most Appropriate speed in Work Zones”, “Methods Used to Manage and Control the Speed of Vehicles in Road Work Zones” and a “Review of Graduated Fixed Penalties Programs”. A number of criteria used for assigning a work zone speed limit were identified. The criteria used in different countries to define work zone speed limits according to the guidelines and standards reviewed are provided in Table 2.

CEDR Call 2012: Safety
7
Table 2: Summary of criteria used to set speed limits in work zones
Of the criteria listed above, the most common elements in the reviewed documents were “road type” and “original posted speed”. Although some of the criteria listed above were used by many countries to assign work zone speed limits, there was a great deal of variation in how the criteria were used to define speed limits. Most part of the European countries used multiple levels of 20 km/h (or higher) speed reductions. Some countries however (such as USA and Canada) state that work zone speed limit reductions greater than 10 mph (16 km/h) should be avoided whenever possible, particularly when work activities are located in shoulder or roadside areas and when workers are not present. Speed limit reductions larger than 10 mph are allowed only if particular conditions of hazard are present. Another issue with the existing guidelines is that many speed limits are not automatically assigned but are based on the judgment of the analyst. Many documents refer to subjective interpretation of the conditions and there was, during the literature study, no easily identified monograph, flowchart, or similar procedure that objectively determines the appropriate speed limits. Further analysis with actual speed and safety data was needed to determine if any uniform work zone speed limits can be derived in a generic guideline for Europe. Several methods were found to be used for controlling work zone speeds. These methods can be divided into informational measures (static signs, variable signs, etc.), physical measures (rumble strips, chicanes, lane width restrictions, etc.), and enforcement measures

CEDR Call 2012: Safety
8
(police presence, automated speed camera, etc.). All of these methods have shortcomings in terms of effects. Some of the most promising are those related to “speed monitoring” and “variable message signs” where the driver is provided real time information on their actual speed and implication of speeding. Static traffic signs appear to provide some speed management effects but there were no consistent results in the different documents reviewed. Police presence had some of the largest effects, but only when the police presence was connected to on-going enforcement activities. Graduated Fixed Penalties is a system where speeding penalties (fines, license demerit points, suspensions, etc.) are increased from standard levels for infractions in work zones. This system was only found in North America and a summary of fines and effectiveness are presented in Chapter 5 of ASAP deliverable 2.1. The effectiveness reported varied and was essentially equivalent to the other speed management methods reviewed in Chapter 4. Active, on-site enforcement appears to be the best method to apply this approach. Drivers are not responsive to static information that does not have immediate repercussions or feedback.
2.2.1 Conclusions The main conclusion from the speed management review was that work zone speeds tended to have more uniform speed distributions, but only small reductions in average speeds were found without an element of a dynamic implementation (variable messages, police enforcement). A study by Migletz et al (1993) showed that for work zones, the safest traffic flow occurs when all vehicles are travelling at approximately the same speed, which means that the range of speeds is within a relatively narrow band and the speed variance is small. As speed variance increases, crashes tend to increase. Migletz also state that consideration must be given to the question whether or not a speed limit reduction is adequate enough to provide for the safety of road workers who must work in exposed positions along the travelled way.
The reviewed documents had little detailed safety information that can be used to evaluate the different speed limits, speed management, or enforcement approaches in terms of work zone injuries and fatalities. There is information on general work site casualty rates based on annual statistics but detailed analyses were not identified in any of the reviewed documents.
2.3 WP3 – Experience of Speed Management in Practise
The work package 3, Experience of Speed Management in Practise, reported in Deliverable 3.1, complements work package 2 where speed management methods and national guidelines were reviewed from available literature. The goal of WP3 was to provide knowledge and guidance from previous experience with speed management programs in road work zones, including on-going projects, and to identify the practical usability and effectiveness of some specific speed control systems and measures preferred by the National Road Administrations. To achieve this objective, a data collection on work zones in Europe and the USA was conducted. WP3 gathered existing detailed data and results from speed management systems in use.
2.3.1 Methodology
Data from 6 countries were collected for 25 work zones and resulted in 43 gathered datasets. The data was compiled into a standardised data sheet to facilitate the analysis of different work zone management strategies, speed data, and safety performance. The countries which were able to provide data were Austria, Switzerland, Belgium, Czech Republic, Sweden, the USA and Italy.

CEDR Call 2012: Safety
9
The first step was to create a database to structure the information. An Excel sheet was designed to collect the relevant parameters and factors. All project partners were invited to collect data on past or on-going work zones in their home countries as well as in other countries (to reflect the experience gained from the literature review in WP2). Furthermore it was required to contact the NRAs and road operators as well as other institutions, which could provide relevant data, in order to obtain a data set as large as possible. After the data collection was finished, the data preparation was carried out to perform a statistical analysis. As described below, the statistical analysis did not achieve satisfactory results, due to a lack of available information. Therefore a descriptive analysis was carried out that examines the various aspects of road safety at work zones.
2.3.1.1 Limitations
The exercise was able to collect data elements from each country, but only limited datasets had common data elements that permitted statistical analysis. Essentially only motorways have been documented in detail. A limited statistical analysis and a general descriptive analysis were conducted. To achieve comparable analyses with data from different sources, a common set of basic data was defined. The data collection was structured in four areas:
Work zone layout: general information (length, duration), work zone management, safety measures
Information devices: speed limits and the display of speed limits
Enforcement devices: radar, section control, police enforcement, penalties
Traffic data: details for speeds, traffic volume, accidents and traffic victims
Due to both the high number of parameters that had to be considered and the diversity of the work zones and the accompanying measurements, some difficulties during the compilation of the database occurred. Many details and characteristics could not be determined in the standardized dataset. Especially the type of speed data showed large variations and differences. Therefore it was necessary to include additional remarks and comments to all possible relevant information which did not fit into the tables.
2.3.2 Showcase: Accident analysis in Italian work zones
As mentioned in chapter 1.2 both road users and road workers are put at risk due to road works. To measure the increased risk of work zones (if any), an analysis of Italian motorway accident data was carried out in the framework of the project. This analysis provided information on the change in expected crash frequencies associated with the installation of work zones. The aim of this study was to evaluate the effect of different work zones’ layout configurations on fatal and injury crashes. The analysis was carried out on a sample of 30389 work zones installed along the Italian motorway network managed by Autostrade per l’Italia in the period 2007 - 2012. The safety performance of motorway segments before the introduction of a work zone and during the work zone period was evaluated, in order to investigate the work zone impact on the number of expected crashes. Thus a “pre-work zone” and a “during-work zone” analysis were conducted in this study. The information used were the work zone layouts, start and end dates, location of work zones, length, crashes during the pre-work zone and work zone periods, and other information such as the annual average daily traffic (AADT) in each segment. On the basis of the crashes count in the pre-work zone and work zone periods, crash modification factors (CMFs) have been calculated for each work zone configuration. A

CEDR Call 2012: Safety
10
CMF represents a multiplicative factor used to compute the expected number of crashes after implementing a given countermeasure at a specific site (Gross, Persaud and Lyon, 2010). In the specific case CMFs provide a quantitative evaluation of work zones safety. The most frequent type of Italian accidents in work zones were rear end collisions, followed by single-vehicle accidents and lateral crashes because of lane changes. Increased risk also appeared during night time conditions and bad weather conditions. In Figure 5 the frequency of each type of collision that occurred in work zones of the Italian motorway network during the 6-year period from 2007 to 2012 are shown.
Figure 5. Impact of type of collision on the frequency of fatal and injury crashes. Other main findings of the analysis can be summarized as follows:
the overall crash frequency, during the time when a work zone is installed on a motorway segment, is about 32 % higher than the crash frequency on the same motorway segments in the “pre-work zone” period;
the CMF due to the work zone varies widely among the different layout configurations;
the highest CMF (2.65) is observed for the crossover with partial diversion of the flow, with a single lane available for the traffic flow which is not diverted (Figure 6);
Figure 6. Partial diversion of the flow, with a single lane available for the traffic flow which is not diverted.
This result indicates that all layout configurations that involve a crossover (total or partial) are very critical and have the worst effects in terms of safety.

CEDR Call 2012: Safety
11
These findings confirm similar results of previous studies (Pal et al. 1996, National Research Council 2007) showing that in most cases, work zones with crossovers appear to have higher accident rates than work zones with simple lane closures. When considering these results it should be noted that full crossovers allow a safer management of the work zone area especially for the road workers, if there is no traffic flowing nearby. Full crossovers are necessary for the type of work activities that require the full carriageway. Partial crossovers, on the other hand, are often used to reduce the backup queues that a full crossover generates potentially in highly traffic sections, which can cause a migration of crashes to sections before the work zone itself. Also in situations where an interchange is included in the work zone area partial crossovers are commonly used.
2.3.3 General conclusions and recommendations
The data collection mainly consisted of data from motorways, and a lack of information on past or on-going work zones on other types of roads was revealed. Hence, the following conclusions refer only to speed reducing measures in work zones on motorways. To find the optimal work zone layout for a road section, different parameters must be considered and coordinated. Work zones may lead to increased accident risk and limited capacity. The speed limit must be adjusted to these factors. In addition other types of measures, like structural or educational, can be taken to increase safety. In the following section the experiences of WP 3 are summarised. Speed Limits: There is no common European standard for temporary speed limits in work zones. Speed level: It is critical that the speed reduction prior to the work zone is smooth to produce low speed variations within the work zone. Lane Management: A minimum lane width of 2.75 m for cars and 3.25 m for trucks is recommended and excessively wide lanes (over 5 m) should be avoided. Dangerous Situations: The entrance and exit areas of work zones as well as lane crossovers and the advance warning area have the most accidents, rear end and single vehicle crashes being most common. Night time conditions and inclement weather also contribute to reduced safety. Safety measures: Physical separation (barriers) provides high safety. Low beacons also improve safety but high positioned beacons were not able to promote desirable low speed variations. Enforcement Devices: Driver speed monitoring displays, i.e. variable message signs provided with radar enforcement equipment, were an effective way to reduce speeds in work zones. Results in the USA indicate good results with section control (enforcement on mean speeds above speed limit between two or more speed cameras) prior to the work zone. Spot speed enforcement and visible police enforcement was also an effective approach to reduce speeds. Standardization Process: A European guideline that strictly standardizes work zones is not easily produced due to diversity of work zone types and road use, but a harmonization is desired.

CEDR Call 2012: Safety
12
2.4 WP4 – Speed Management at Work Zones - Field Showcases and Stakeholder’s Consultation
In Work package 4, low cost speed management methods were demonstrated in field showcases and in a driving simulator experiment. Furthermore, stakeholders were consulted on the subject of appropriate speed and associated parameters.
2.4.1 Field showcases
An important step in the development of practical recommendations on speed management at work zones is to identify promising low cost speed management measures and to carry out on-field show cases to demonstrate good practice. A showcase has been carried out in the Czech Republic, along a road work site on the D1 motorway. Several scenarios with various speed management measures have been implemented and monitored. Two additional speed monitoring actions have been carried out along two major road works executed on Belgian motorways. The road work circumstances and the speed management measures deployed on these sites provided the opportunity to complement the scenarios tested on the Czech site. Due to national regulations or road work site constraints some important parameters, such as speed limits, lanes width or geometry of the lane deviation when crossing the central reserve can’t be easily tested in a field showcase. A complementary analysis has been conducted through an experiment in an Italian driving simulator.
Analysis based on 6 hours’ time periods confirmed that the period of the day is an important factor when looking at free flow speed behaviour, and that the corresponding speed amplitudes observed between different periods of the day are usually higher than between periods with and without activation of one specific speed management measure (see Figure 7, more evidence can be found in D4.1).
Figure 7. Average of 5 minutes free flow mean speeds across the 4 monitoring periods (P1 & P3 with speed enforcement; P2 & P4 without enforcement) – Comparison of 24h and 6h time periods at one monitoring site
From the studies it appears that the use of a speed camera sign (during 8 days) in the advance warning area clearly impacts driven speeds among free vehicles (Table 3). It also becomes apparent that mean speeds and standard deviation are positively impacted by the speed activated VMS trailer installed in the work zone area (Figure 8), and by the police car presence in the work zone area.

CEDR Call 2012: Safety
13
Table 3: Impact of the speed camera sign on free flow mean speeds and standard deviations (as measured on site in CZ)
Direction Lane Speed Camera Sign
Number of free vehicles
Mean Mean difference
Std. Deviation
Std difference
Brno Right off 10 272 108,0 7,8
Active 640 105,5 -2,5 6,3 -1,5
Left off 13 255 123,0 9,2
Active 1 033 118,8 -4,2 7,8 -1,4
Figure 8. Impact of speed activated VMS trailer installed in the work zone on free flow speed distributions at right lane
The experiment in the driving simulator demonstrated that the installation of a Variable Message Sign (VMS) may provide some effects on reducing speeds; the impact being maintained within the first part of the advance warning area. However the VMS loses its effectiveness in the following sections. The presence of an Automatic Speed camera also seems to have an impact on the mean speed and on the proportion of drivers exceeding the temporary speed limit. This is particularly visible for daytime traffic. However it is likely that the speed camera has a local impact that decreases when progressing along the work zone. To what extend still needs to be determined.
Alternative geometries of the central reserve crossing and speed limit schemes have been tested in controlled conditions. This part of the study interestingly indicates that even if a wider opening of the central reserve combined with a slightly higher speed limit result in an increase of the mean speed, both the speed variance from upstream to work location and mean deceleration (Figure 9) around the by-pass entrance are much lower than in the reference situation.

CEDR Call 2012: Safety
14
Figure 9. Mean speed profiles upward, at and downwards a crossing of the central reserve as measured in the driving simulator for two configurations (Configuration 0 characterised by a 130/110/90/60/40/80 km/h speed limits sequence & 40m wide opening; Configuration 1 characterised by a 130/110/80/60/80 km/h speed limits sequence & 80m wide opening)
2.4.2 Consultation of external experts
Based on the knowledge gathered and the analyses of data in the first half of the project external experts have been consulted. This was an important step to ensure that the recommendations are in line with the needs and requirements of the NRA´s and considered possible to implement.
During the consultation it was made clear that the ASAP guidelines are not expected, nor requested to replace existing guidelines. The information from ASAP was instead regarded as an important support document for existing guidelines and as useful input to future revisions of the connected relevant guidelines.
The stakeholders identified the two most safety critical criteria for setting temporary speed limits as being “original posted speed” and “proximity of workers to traffic”. However, temporary reduction of the speed limits does not guarantee a low speed in work zones. If the speed level is too high for the road works situation, complementary measures have to be taken that can assure a sufficiently low vehicle speed. Speed cameras and physical reductions give examples on such measures.
From the survey it turned out that many European countries do not have detailed data available for assessing work zone safety and the situation is somewhat the same in the USA according to an interview. In the USA, however, a new project called “Work zone speed data and crash data practices” is about to start.
When it comes to graduated penalties there are difficulties in interpreting the results from different states in the USA and no standardized results are available. In the Netherlands speeding fines are doubled in work zones but no evaluation of this European experience from this measure was found. Experiences are that this measure has to be combined with other measures such as information about the amount of the fine for speeding in work zones, and the risk of being fined has to be perceived as high. Furthermore the collaboration between enforcement agencies and work zone implementers is highly important to enable this specific kind of enforcement.

CEDR Call 2012: Safety
15
2.4.3 Conclusions The ASAP showcases have been a unique opportunity to test and demonstrate interesting speed management measures identified during the first half of the project. Consequent resources have been used and positive effects have been observed with some of the measures. Though a practical approach the showcases contribute to the consolidation of knowledge and experience about speed behaviour, speed management and speed monitoring at road works sites. All details are provided in the ASAP deliverable 4.1. Important conclusions have also been drafted about the deployment of the speed management measures and speed monitoring devices. They demonstrate the absolute need of communication and operational plans drafted at the early stage of the road work planning to identify and commit the various actors, to schedule the deployment of equipment, to efficiently operate the various devices and organize the data collection. The ASAP showcases addressed some important issues, but also emphasized unsolved questions that offer interesting perspectives for further studies; as listed hereafter:
Reproduce speed monitoring campaigns to confirm the global trends observed; i.e. speed behaviour vs time of the day, speed vs traffic volume, speed behaviour in presence of a longer/70km/h crossing of the central reserve in comparison to a short/50km/h one, higher speed variance at locations close to the transition area, indicators for speed congestion and focus on more homogeneous monitoring periods (duration, traffic characteristics, weather conditions RW activity & configuration).
Include additional external parameters in the process to better understand the traffic and speed behaviour (e.g. activity on the work zone, queuing start and end, weather).
Confirm the effect of the installation of a speed camera sign and particularly investigate its spatial and temporal effectiveness, combined (and not) with police patrol presence;
Further study the impact of (repeated) speed activated signs and VMS; ideally in combination with license plate recognition and/or Police presence/controls;
Repeat speed monitoring campaigns with a VMS trailer used in the advance warning area and dedicated to danger driver warnings and potentially about speed control actions;
Continue the evaluation of the effectiveness of the automatic speed camera; i.e. evaluate the spatial & temporal effect by more consistent monitoring periods and successive monitoring locations.
Deploying and maintaining speed monitoring equipment and speed management measures remains a time consuming task. One important element with such speed monitoring campaigns is linked to the location of the speed detectors. As far as possible their location should be fixed by monitoring needs to be able to evaluate the spatial effectiveness of the speed management measure. This is an important deployment issue that must be considered for all further implementation activity. Based on the knowledge gathered and the analyses of data in the first half of the project external experts have been consulted. This was an important step to ensure that the recommendations are in line with the needs and requirements of the NRA´s and considered possible to implement. During the consultation it was made clear that the ASAP guidelines are not expected, nor requested to replace existing guidelines. The information from ASAP was instead regarded as an important support document for existing guidelines and as useful input to future revisions of the connected relevant guidelines.

CEDR Call 2012: Safety
16
2.5 WP5 – ASAP Recommendations and Final Report
The different analysis performed during the project gave a number of implications for the development, layout and dissemination of the ASAP results in general and the ASAP guidelines in particular. The results of the literature review and the data analyses in work packages 2 and 3 respectively, identified a wide variation in the factors used in guidelines to set work zone speed limits. The most common factors were identified and used in a targeted stakeholder survey of NRAs and road operators. This was done in order to understand the interpretation of the existing guideline factors, that could be used in future guidelines and to decide an appropriate form of the ASAP guidelines. To synthesize, the following key elements were considered to structure the ASAP results and guidelines:
The scope of the ASAP results must be taken in the context of work zone design procedures, national laws, and the responsibilities of third parties such as the police and construction companies;
The data analysis in work package 3 suggested that uniform European guidelines to strictly standardise work zones could be wished for but is no easy task given the diversity of rules, roads and traffic conditions between nations and regions. The stakeholder’s consultation confirmed this result but in the same time expressed their interest for elements leading to more homogenous work zone layout between countries;
The stakeholders that were consulted expressed the opinion that the results from ASAP can be useful not only for national road administrations and contractors but also for municipalities;
The ASAP guidelines are not expected, nor requested to replace existing guidelines. The information from ASAP is instead regarded as an important support document for existing guidelines and as useful input to future revisions of the connected relevant guidelines;
The ASAP project should provide a guide not for setting the speed limit but for informing about the important decision on appropriate speed levels, about relevant criteria used across EU for setting the speed limit regime and for choosing the best speed managing methods that will result in appropriate speed behaviour in work zones.
2.5.1 Structure of the ASAP guidelines
2.5.1.1 Initial road work speed management procedure
As already mentioned, the scope of the ASAP project must be taken in the context of work zone design procedures, national laws, and the responsibilities of third parties such as the police and construction companies. A road work speed management procedure is traditionally organized around successive steps that are described below and illustrated in Figure 10.

CEDR Call 2012: Safety
17
Figure 10. Organization of a road work speed management procedure in successive steps
Step 1a Identifying the road basic conditions, road work characteristics and traffic conditions
These first parameters refer to the context, the environment of the planned road work. They are fixed and will constrain all operational issues during the works period. The road type, and more particularly the associated characteristics, i.e. the transversal section, the original speed limit, the supported traffic or economic importance, directly impact on the temporary traffic management. Similar for the local characteristics of the road section, like the number of lanes in each direction, the local curvature, slopes, road width, sight distances. The type of work and more particularly the location of the work zone (i.e. on one or several lanes) and the work stages strongly influences the road work layout and the equipment to be installed on site; e.g. would a crossover be necessary or a deviation of lanes be enough, would it be possible to install safety guardrail all along the work zone or should entrances and exits be organised for work vehicles.
Step 4
Monitoring & Adaptation
Step 1a
Identifying Road basic conditions, road work characteristics & traffic conditions
Step 1 c
Consideration of National guidelines
Step 1b
Consideration of Road workers/users safety
Step 3
Implementation
Step 2d
(Initial) Decision on speed management measures
Step 2c
Decision on Safety equipment, signing
Step 2a
Decision on Temporary lane management
Step 2b
Decision on Appropriate speed regime

CEDR Call 2012: Safety
18
Finally traffic volume and intensity will, in relation to regional capacity requirements, impact on the number of lanes remaining accessible and on speed regime. Traffic composition itself is important to consider designing lanes and transition areas.
Step 1b: Consideration of road workers/users safety
Workers and drivers risk exposure is another key parameter that will influence decisions on temporary lane management, work zone signing and equipment and speed regime along the work and the approach areas. Known risk situations (at local level) are taken into consideration by the local manager considering the regional strategy as well as the local workers and drivers behaviour. Exploitation data (traffic, speed, accidents or incidents, conflicting situations) would ideally be collected to better understand at risk situations and be able to evaluate mitigation measures.
Step 1c: Consideration of National guidelines
National standards, guidelines or other regulations designate a number of parameters in relation to the global structure of the work zone layout, its signing and equipment. These documents also largely influence the choice in term of work zone speed scheme based on a series of criteria as mentioned in Table 2.
A decisional step immediately follows this first information phase and concerns:
Step 2a: Decision on the temporary lane management
Decision on the temporary lane management typically consists of decisions on type of closure, geometry of the advance warning, transition, work and end areas, lane width, etc.
Step 2b: Decision on the appropriate speed scheme
Appropriate speed levels through work zones have to be decided for the sake of the safety of both the road users and the road workers. This implies that the maximum vehicle speeds shall not exceed those levels. Deciding on the appropriate levels of speed through the work zone is therefore a key issue and a delicate task that consists of several steps/components, as illustrated above. This decision is usually based on the rules, standards, guidelines and common practices in each country and region. The ASAP project therefore only marginally dealt with this decisional step. Notwithstanding, the chapter 1.2 Accident risk and road worker safety recalls some basic elements to consider when addressing the speed level issue. Moreover the ASAP Deliverable 2.1 (cf. summary at chapter 2.2) lists the criteria commonly included in national guidelines across the world for assigning a work zone speed limit, which is one of the measures used to reach the appropriate speed level. Additionally common criteria for speed limit decision are further discussed in the following chapter 2.5.1.3.
Step 2c: Decision on the safety and signing equipment
Road work signing is to a great extent described through standards and guidelines; however as for safety equipment the road manager may decide to complement the minimum requirements by additional signs or warning devices.

CEDR Call 2012: Safety
19
Step 2d: Initial decision on speed management dedicated measures
Temporary lane management, speed limits, signing and safety equipment directly impact driven speed and as such may be considered as speed management measures. However for sensitive sites or risky situations, e.g. design below standard, road workers close proximity or high queuing risk, additional speed management measures may be decided at the planning phase. Such measures, as well as their application field are described in the chapter 4 of this report.
Step 3: Implementation
Once all decisions mentioned above have been taken, the temporary traffic management measures are implemented on site and the road works may start.
Step 4: Monitoring and Adaptation
The effectiveness and appropriateness of the speed scheme, the signing and safety equipment, as well as the speed management measures decided at the planning stage and deployed on site need to be monitored on a regular basis and later adapted, if needed. This can be performed in different ways, e.g. Denmark guidelines state that if the mean speed level is higher than the speed limit or if the 85th percentile is 10 km/h higher than the speed limit, a failure to comply exists and speed reducing measures should be introduced, such as speed control, warning sign “people on the road”, speed bump (speed limit ≤ 50 km/h), rumble strips, speed reducing offsets, port, sign “Your speed XX km/h” or alternately one-way traffic (cf. D2.1). The ASAP Deliverable 4.1 (i.e. showcases) provides some interesting guiding considerations about the execution of speed monitoring campaigns that may help a road manager to monitor and evaluate the measures deployed on site. Following the conclusions emerging from this monitoring step will the road manager need to decide to implement or not additional speed management measures, or simply to adapt the measures decided during the second step mentioned above. Guiding him doing the right choice is the primary objective of the ASAP guidelines that are further described in chapters 3 and 4.
2.5.1.2 Appropriate speed along road works
As described in chapter 1.2, crashes are in general less severe at lower speeds. Furthermore, at lower speeds drivers (and workers) have more time to react when emergency situations occur. However, slower speeds may reduce the roadway capacity and cause congestions that increase the potential risk of rear-end collisions. In some work zone situations, typically when workers and hazards are not present, a low speed level is not always needed to maintain the safety of workers and road users. The ASAP project is attended to help achieving the appropriate speed levels in work zones by recommending suitable speed management methods. Indeed, once the appropriate levels have been decided, different methods can be used to achieve these levels such as temporary speed limits, recommended speed limits, physical measures, speed enforcement or informational measures. Often several measures are combined to enhance the effect. The basic conditions to achieve appropriate speeds levels at road work sites may be summarised as follows:
the decided appropriate speed levels are coherent with the local road work design, road and pavement characteristics, and are credible at each area along the road work site;
the risk of exceeding the appropriate speed level is eliminated and the speed variance is low, so that the accident and injury rates are low.

CEDR Call 2012: Safety
20
An assessment of appropriate speed therefore includes the monitoring and assessment of:
the actual design of critical spots and sections of the road works (i.e. lane deviation, crossing of the central reserve) as regards to the driven speeds, the transversal friction and the local lateral slope;
the driven speed (Are the average, P85 and the highest speeds low enough?);
the speed variance (Is this low enough?);
the conflicting situations, incidents or accidents;
the credibility of the speed limits or advisory speed as well as of other speed reducing measures, as regards to the activities on the work zone, the temporary road and lane characteristics, the queuing likeliness and extend ;
the risk associated to “speeding” (i.e. likeliness x injury level)
2.5.1.3 Discussion on common criteria for speed limit decision & implementation
Experience has shown that the level of compliance with speed limits is very much dependent on the credibility of the speed limits (i.e. in line with the drivers’ expectations). When the speed limits are credible a positive effect is expected on average driving speeds and on homogeneity of the traffic flow. Literature from the USA suggests that speed compliance in work zones is generally much higher where the speed limit reduction is rather small (< 20km/h). Literature indicates that the safest traffic flow occurs when all vehicles are travelling at approximately the same speed; hence homogeneity of speed is also important. However, most of the European countries typically use multiple levels of 20 km/h (or higher) speed limit reductions. The ASAP showcases in work package 4 (cf. chapter 2.4) followed this latter strategy and:
confirmed that the larger the speed limit reduction, the larger the actual speed reduction. However, larger speed limit reductions also causes larger gaps between the speed limit and driven speeds as well as larger speed variance (cf. the results from the driving simulator and the Belgian showcases);
indicated that the reinforcement of the road work signing by use of a combination of dynamic signs in the advanced warning area, speed camera sign or speed display close to the transition area is quite beneficial to warn drivers and to increase compliance with speed limits.
These elements confirm that identifying the appropriate speed limit remains a complex task; and that small speed limit reductions do not necessarily imply lower safety levels, provided the road work design is adapted to a higher speed level. Temporary speed limits are typically decided considering the national rules, standards, guidelines and common practices. However, when making this decision a certain degree of freedom sometimes remains. As mentioned in the ASAP Deliverable 2.1 “State of the Art on Speed Management Methods” different criteria are used across Europe to assign work zone speed limit, the two most frequently found in national guidelines being the original posted speed and the road type. The two criteria identified by stakeholders as most safety critical when setting the temporary speed limits were “Original posted speed” and “Proximity of workers to traffic”. There is a delicate task to balance the level of worker safety equipment against the size of the speed reduction. Several criteria for setting the speed limits are common, but are not necessarily exploited in all European countries; they are candidate criteria a road manager may use to derogate from classical speed limit schemes and they also represent a chance for harmonization of practices:

CEDR Call 2012: Safety
21
The original posted speed, or the original speed level (if higher) compared to the appropriate speed level in the work zone (How large reduction is needed?);
The proximity and protection of workers: the level of worker protection sets the framework for the needed speed reduction. Working with a larger lateral safety distance, with additional buffer zones or installing high-performance safety barriers may give opportunities to avoid one step of speed limit reduction; while a lower level of worker protection may cause for an extra step of speed limit reduction;
The design of the lane shift or of the crossover: softer lane deviation (smaller deviation angle, larger curve radius), improved pavement evenness and friction, and slightly larger lane width (e.g. with a neutral zone between adjacent lane to mitigate sideswipe collision risk); provided worker safety is not negatively impacted;
The impact on traffic: in some circumstances the impact on traffic may be reduced by adapting the phasing of works that may impact space necessary for work and circulation of the work vehicles, and/or the cross-section, i.e. lane width coupled with the use of safety barriers.
2.5.1.4 ASAP road work speed management procedure
The intention of the ASAP guideline is to provide a tool for choosing the best measures to achieve appropriate speed behaviour in work zones, without consideration of capacity and construction needs. The ASAP guideline is packaged as a stand-alone reference document and can be found in chapter 3 and chapter 4 of this deliverable. The approach was to develop a “check list” where current national guidelines and practices can be applied in the initial planning phase (c.f. chapter 2.5.1.1) of the road work speed management procedure. Assuming that the initial road work speed management procedure has been carried out, including the important step of deciding the appropriate speed level scheme, the ASAP procedure simply causes for assigning the speed management measure(s) to achieve these speed levels (see Figure 11). The ASAP guideline could preferably be used in the planning phase, before establishing the work zone be used as quality assurance that the work zone speed management measures chosen are appropriate, but could also be an important tool to use if discovering that the current measures in use are not efficient enough in reducing the speed levels. Hence, if the appropriate speed is not achieved or is not likely to be achieved, the ASAP guideline can be used to find other or complementary recommended speed management measures. Depending on type of road and road work this guideline lists recommended measures and provides a description of each measure and their advantages, application fields, expected impact, on-site deployment issues and cost components.

CEDR Call 2012: Safety
22
Appropriate speed level?
Figure 11. ASAP procedure for design of road works and choice of speed management measures.
2.5.1.5 Clustering of the speed management measures
Some of the road and road work characteristics formed the basis for classifying measures that proved to, or were suggested to reduce speed, into different clusters. For each cluster the most appropriate measures are listed as shown in Figure 12.
ASAP Guidelines
Appropriate
speed!
ASAP
Yes
ASAP
Speed management measure(s)
No
Initial road work speed management
procedure

CEDR Call 2012: Safety
23
Figure 12. The ASAP guidelines The clusters and recommended measures are presented in chapter 3 and a summary of the effectiveness of the different countermeasures can be found in chapter 4. These two chapters can also serve as a separate reference document.
Cluster 1
Basic conditions
Road geometry
Traffic
Speed limit
Speed behaviour
Type of road measure
National Guidelines
Cluster 2 Cluster 3
Cluster 4 Cluster 5
Measure 1 Measure 2
Measure 3 Measure 4
Measure 5 Measure 6
Measure 7 Measure 8
ASAP Speed Management Measure(s)
ASAP Guidelines

CEDR Call 2012: Safety
24
2.6 Dissemination
The purpose of dissemination is to raise the awareness and publicity of ASAP, as well as its outcome, in order to make ASAP a successful and sustainable project. The project looked beyond generating publicity, to essentially encourage the wider road research communities and stakeholders to use, further develop and implement the project’s results. In order to achieve this objective, a number of activities were dedicated to endorsing an effective dissemination and exploitation platform, to draw attention to the potential added value of the project, and to spread awareness to other interested parties throughout Europe.
2.6.1 Portals for dissemination The Forum of European National Highway Research Laboratories (FEHRL) supported the dissemination and workshop activities of the project. Each ASAP partner is also a member of FEHRL and this allows information exchanges at the European level during regular FEHRL activities. As a technical reference for infrastructure, FEHRL is a solid platform for hosting the information. The inclusion of FEHRL in ASAP ensured the effective dissemination and exploitation of results, and also ensured the results being directly communicated to other national and European organizations, primarily the national road administrations and CEDR, but also internationally, through the World Road Association (PIARC), the Transport Research Board (TRB) and the Transport Research Arena (TRA). One of the ASAP partner representing the University of Florence, Italy, is a member of the CEDR Task Group on Road Safety. This will allow the dissemination of the results also through the Road Administrations represented in CEDR TG on Road safety. The coordinator is a member of the European Conference of Transport Research Institutes (ECTRI) as well as the moderator of ECTRI´s Thematic Group: Traffic Safety. This will allow the dissemination of the results also through Transport Research Research Institutes in Europe. The coordinator is also a member of the IRTAD-group (International Road Traffic and Accident Database). The IRTAD data base is an international data base, renowned for the high quality of its data and covers 35 countries for each year since 1970. The IRTAD group is a network consisting of researchers and road safety experts from these 35 countries. This group holds regularly meeting twice a year and the results from ASAP will be distributed to the group. In Italy, some results of the ASAP project were taken as an input for the writing of a book, entitled “Safer Road Infrastructure” and containing a chapter dedicated to the work zone management, prepared in collaboration with the Italian Ministry of Infrastructure. The book was presented at the 27th National Meeting AIPCR (World Road Association – Italy). The meeting, attended by nearly 400 participants from all over Italy, has represented a great opportunity for the dissemination of the project results at a national level. A technical seminar entitled "Work Zone safety management", is scheduled for March 26 in Rome. The seminar represents an excellent opportunity for the presentation of the project's main findings. External experts have been consulted and expressed interest in the ASAP results. This consultation of stakeholders was an important step to ensure that the recommendations are in line with the needs and requirements of the NRA´s and considered possible to implement. During the consultation it was made clear that the ASAP guidelines are not expected, nor requested to replace existing guidelines. The information from ASAP was instead regarded as an important support document for existing guidelines and as useful input to future

CEDR Call 2012: Safety
25
revisions of the connected relevant guidelines. The consulted stakeholders and their network of technical contacts represent important actors when implementing the ASAP results within the different countries and organisations. Through these different portals, project-specific dissemination on a national and international level will be achieved for the process and treatment of the ASAP project. Furthermore the partners will spread the results and outcomes of the project widely over Europe to ensure the transnational benefits, especially through the direct connections to the national road agencies.
2.6.2 The ASAP logotype and website In order to immediately emphasise the visibility of the ASAP project; a project logotype was designed at the start of the project, in collaboration with the FEHRL organisation (Figure 13). This coherent visual project identity includes graphics, templates, styles and guidelines that are used by partners when presenting ASAP in electronic and print material.
Figure 13. The ASAP logotype. Through the project website, information concerning the project and its progress is presented. The website’s structure aims to provide both easily accessible basic information for external visitors and special information in more detail for registered users. It also acts as a principal means of publication for news and updates. The ASAP website is placed within a clustered website area for SERRP (Strategic European Road Research Programme) projects; this will provide users with a streamlined portal for access to all related projects in the programme. The website is maintained and updated regularly by FEHRL. There is a range of dissemination material produced within the project, all of which can be found at the ASAP webpage at FEHRL: http://asap.fehrl.org/
2.6.3 ASAP project reports and technical notes A range of dissemination material has been produced within the project. The work of the ASAP project is described in four deliverables:
D2.1 State of the Art on Speed Management Methods (2013);
D3.1 Experience of Speed Management in Practise (2014);
D4.1 Speed management at Work Zone - Field studies and stakeholder’s survey (2014); and
D5.1 Final Report towards a European Guideline for Speed Management Methods in Work Zones (2015).
The final report (D5.1) incorporates the main findings of work package 2, 3, 4, and 5, and the project recommendations for efficient speed management at road work zones, which is packaged as a stand-alone document.
ASAP

CEDR Call 2012: Safety
26
The ASAP project has produced a self-contained document for safe work zones. This document presents recommended measures for speed management in work zones. A leaflet that promotes the ASAP guideline will be produced in order to disseminate the results in such a way that is easily distributed to all stakeholders.
2.6.4 Workshops As part of the dissemination process a series of workshops will be held together with the CEDR project BROWSER (http://browser.zag.si). These workshops focus on road worker safety risk reduction and they will include information on the content and the results of the projects, as well as sessions of practical demonstration in terms of using the resulting output tools and methods. For the ASAP project this will be an opportunity to illustrate and discuss experiences from practical real life show cases in Belgium and the Czech Republic as well as to discuss the important implementation phase of the ASAP project. The workshops will be organised during the autumn 2015 in London (October), Brussels (October) and in Brno (November), and will target both National Road Authority staff and service provider staff.
2.6.5 Presentations at conferences To achieve a wider awareness of the project, ASAP has been and will be presented at a number of relevant national and international conferences and seminars in different parts of Europe as well as in the USA, e.g.
May 2013 - CEDR Road Safety Working Group (Francesca La Torre): oral presentation of project objectives and method;
May 2013 – The European Union Road Federation (ERF) working group on Work Zone Safety in Brussels, Belgium (Xavier Cocu): oral presentation of project objectives and method;
October 2013 - Building Road Safety Capacity conference held in Warsaw, Poland (Xavier Cocu): oral presentation of project objectives and overview of WP2 results;
January 2014 – BRRC training courses in Sterrebeek, Belgium (Xavier Cocu): oral presentation of part of WP2 results;
January, 2014 – TRB Meeting in Washington, USA (Robert Thomson): oral presentation of project objectives and method;
April 2014 –TRA, Paris, France, (Robert Thomson, Gunilla Sörensen) Oral presentation of project objectives, method and WP results, poster session;
November 2014 – Roadside Safety Design Subcommittee on International Research Activities in Brussels, Belgium, (Francesca La Torre): oral presentation of project objectives, method and WP results;
January, 2015 – Transportation research conference "Transportforum” in Linköping , Sweden (Gunilla Sörensen): WP2, WP3 and WP4 results;
The project is also disseminated at FEHRL stands during conferences, exhibitions, and seminars (e.g. TRB Washington). All partners promote the project and disseminate the results through each national and international working group and committees related to road work safety in which they take part. BRRC further promotes the project and disseminates the results through paper publication at national (quarterly Bulletin) level and through its technical committee on road safety.

CEDR Call 2012: Safety
27
2.7 Implementation
2.7.1 National guidelines The main result of the ASAP project – the ASAP guideline – should be regarded as both a supplement to existing guidelines and as a basis for new revisions of national guidelines. Packaged as a stand-alone reference document the ASAP guidelines list recommended measures and provide a description of each measure and their advantages, application fields, expected impact, on-site deployment issues and cost components. They should be regarded by the Road authorities as a complementary document to national existing guidelines and as useful input to future revisions of the connected relevant guidelines. All ASAP partners have important roles as national experts and will use the project results in their ongoing work supporting national guidelines and best practice. The ASAP project results will thus continue to live within each participating country. Many of the ASAP partners are also representatives in different technical committees developing national and international regulations (CEN, ISO, etc.). The ASAP project team has a very wide frame of international cooperation and is actively involved in several road safety panels (e.g. PIARC, EARPA, ERTRAC, EVU, etc.) that will allow trans-national exploitation of the results of the project.
2.7.2 Collaboration with universities The results of the project will be implemented in the teaching activities on-going at the University of Florence (UNIFI). In the Master Course on Road Safety (offered by UNIFI with support of the Italian Ministry of Infrastructures) and in the Training Course for Safety Auditors (according to Directive 2008/96/CE) offered by UNIFI, the results of the project will be included to disseminate the results to the road administrations and professionals attending. The ASAP project also paves the way for student exchange programs between partners. The results of the ASAP project will also be made available for any future FEHRL teaching activities, in particular in the field of road safety auditors and inspectors training (according to Directive 2008/96/CE).
2.7.3 Perspectives for future studies The stakeholder consultation revealed that many countries do not have detailed data available for assessing work zone safety. Hence, ASAPs experience in data collection in the data review (WP3) and field showcases (WP4) are important resources for future evaluation and improvement of work zone safety. The consultation also revealed that there is an ongoing project in the USA about work zone speed data and crash data practices. Activities carried out along the showcases (cf. Deliverable 4.1) have been a great opportunity to test some of the interesting measures identified during the first half of the ASAP project. Positive effects have been observed with some of the measures. However some need to be confirmed and new questions also arise. Therefore ASAP also offers perspectives for future studies in view of a longer-term implementation. These perspectives have been detailed in the project; the main issues being:
Confirm the effect of the speed camera sign and particularly investigate its spatial and temporal effectiveness, combined (or not) with police patrol presence;

CEDR Call 2012: Safety
28
Complete and confirm the evaluation of the effectiveness of the automatic speed camera; i.e. evaluate the spatial & temporal effect by more consistent monitoring periods and successive monitoring locations;
Further study the impact of (repeated) speed activated signs and VMS; ideally in combination with license plate recognition and/or police presence/controls;
Reproduce speed monitoring campaigns to confirm the global trends observed; i.e. speed behaviour vs time of the day, speed vs traffic volume, higher speed variance at locations close to the transition area, speed indicators for congestion and focus on more homogeneous monitoring periods (duration, traffic characteristics, weather conditions, roadwork activity & configuration);
Include additional external parameters (e.g. activity on the work zone, queuing start and end, weather) in the process to better understand the traffic and speed behaviour.
On the basis of the crossover configurations already studied, further investigations could be carried out with the driving simulator, such as the introduction of different channelizing devices for the delineation of lanes. In particular, the usage of higher and bulky devices in place of the flexible delineators or a change in their spacing could result in a different speed behaviour for drivers.
2.8 Discussion and conclusions
The national guidelines are the basis for how to achieve appropriate speeds at road work zones. The different guidelines were reviewed in this project with respect to work zone speed management criteria. Although some of the criteria identified were used by many countries, there was a great deal of variation, and how to create a common European guideline was not obvious. The national guidelines have to consider many aspects of road works and traffic demands. In this project the main concern was to find measures to achieve appropriate speed level in order to ensure the safety of the workers. In this way the ASAP guideline complements the different national guidelines.
2.8.1 Measures of particular interest There was an explicit interest from the CEDR organisation in knowledge about both graduated fixed penalties programs and temporary rumble strips. Graduated penalties The penalties for speeding can be increased in work zones and the effectiveness of this measure has been investigated. The literature gave examples on both increased and decreases speed from this measure, and the stakeholder’s consultation gave only marginal new information about the effectiveness of such graduated fixed penalty programs. The Transportation Association of Canada (TAC) made a survey of 55 provincial, territorial, municipality, and road construction managers. Only 16% of the survey respondents rated the effectiveness of this solution as high, the others indicated graduated fixed penalties as moderate or not effective. In the USA Ullman et al. (1999) evaluated the effect of the “double-fine” law on work zone speed at 10 different work zone construction projects. The results didn’t show appreciable effect on speeds at the sites examined: changes included both increases and decreases in average speed between the before and during conditions, while at some sites, average speeds increased in one direction but decreased in the other. Moreover, Ullman et al. (1997) indicate that states that enacted legislation to increase fines in work zones did not experience significantly lower fatal accident rates compared with states without increased fines. In any case, the effectiveness of increased fines in work zones

CEDR Call 2012: Safety
29
clearly depends on effective enforcement. Without enforcement speeders will not be apprehended. The double fine measure is active in the Netherlands, but no research results have been found about the effectiveness and efficiency of the measure in this country. However, personal contacts have informed that the enforcement team (the National Unit of the police) wants to be sure that traffic measures are correctly implemented (speed limit signs on the right and left side of the road/carriageway, correct distances, etc.) before they enforce. This causes for coordination between the road authority and the police, which have proven to be difficult. To make increased fines a more effective measure expert recommendation is to ensure
that drivers are aware of the amount of the fine
that the amount of the fine is perceived as deterrent
coordination between the road authority and the police
successful administration of the fines.
The increased fines might also be connected to an existing penalty point system, leading to an increased loss of points when speeding in work zones. This should be further studied in the future. Rumble strips Rumble strips consist of a transversal raised surface on the pavement. The purpose is to create an audible, visual, and physical alert when driven over. They should be applied in such a way that traffic is prevented from swerving around the strips. In work zones different types of temporary rumble strips can be used, such as portable or adhesive. Adhesive rumble strips are manufactured with a pre-applied adhesive backing that creates a bond to the road surface. They install easily with no special equipment and may be redressed for several uses. Portable rumble strips consist of a raised surface placed on or nailed to the pavement. Portable rumble strips require even less time to install and remove, compared to adhesive rumble strips, and are reusable. This makes them particularly useful for deployment in short-term work zones. However, they are less effective on high-speed roads and may not even be allowed to be used when speeds are high. Furthermore, since they may not always be efficient in reducing heavy vehicle speed, they are mainly used to reduce the speed of light vehicles Due to wear, rumble strips gradually lose their effectiveness over time. In particular, heavy vehicles may wear out the temporary rumble strips and/or move them out of position. Temporary rumble strips may constitute a potential hazard for motorcyclists and moped riders. Hence, warning signs are recommended.
2.8.2 The ASAP guideline To gather knowledge on successful speed management measures different methods were used in the ASAP work packages. Literature studies, data analyses, show cases, and consulted stakeholders and researchers provided a broad base for the ASAP guideline. In the literature study, documents describing measures that were evaluated regarding their effect on speed were reviewed. Note that the evaluated measures had rarely any information on work zone injuries and fatalities that could be used to evaluate the speed management measures. Whereas some measures were evaluated in several independent studies and shown to be effective, other measures were rarely found to be evaluated and the effects

CEDR Call 2012: Safety
30
were only indicated. Hence, the consultations and the show cases were important elements to further investigate these effects. Through the different ASAP work packages the current knowledge in the field of speed management in work zones has been captured in the ASAP guidelines. The guideline is organised based on road type, duration of the road work and location in the road work. Each measure is described along with specific recommendations and additional speed reduction. Some of the speed management measures reduce speeds by only a few kilometres per hour compared with a work zone without this particular measure. However, even when only small speed reductions are achieved, these reductions may still be crucial when it comes to worker safety, and in addition drivers are alerted to an upcoming work zone or a hazard within a work zone.

CEDR Call 2012: Safety
31
3 ASAP Guideline
The ASAP project is a guide for choosing the best methods to achieve appropriate speed behaviour in work zones, without consideration of capacity and construction needs. Assuming that the initial road work speed management procedure has been carried out, the ASAP procedure simply causes for assigning the speed management method(s). This phase could preferably be carried out in the planning phase, before establishing the work zone, but could also be an important tool to use if discovering that the current measures in use are not efficient enough. Hence, if the appropriate speed is not achieved or is not likely to be achieved, the ASAP checklist can be used to find other recommended speed management measures. The ASAP procedure of road work speed management is presented in Figure 14.
Figure 14. The ASAP procedure of road work speed management
Appropriate speed level?
ASAP Guidelines
Appropriate
speed!
ASAP
Yes
ASAP
Speed management measure(s)
No
Initial road work speed management
procedure

CEDR Call 2012: Safety
32
The measures have been divided into clusters based on their suitability on different road types and due to different road work characteristics. The distinguishing parameters were road type, work type and location in road work. The parameter classification chosen were:
road type: o motorway and dual carriageway o single carriageway;
work type: o long-term road work (> 3 days) o short-term static road work o intermittent or moving road work;
location of measure in road work o advanced warning area o transition area o work zone area
The recommended measures to achieve appropriate speed levels in work zones are shown in Table 4, Table 5, Table 6 and Table 7. The measures are further described in detail in chapter 4.

CEDR Call 2012: Safety
33
Table 4: Recommended measures – Road type Motorway, long-term roadwork
Work Type Location in Road work Recommended measures
Long-Term (>3d)
Advanced warning area
1. Temporary speed limit reduction - Static
2. Temporary speed limit reduction - Variable
8. Speed camera sign
12. Graduated Fixed Penalties
23. Variable message signs
24. Emotional messages
Transition area
1. Temporary speed limit reduction - Static
2. Temporary speed limit reduction - Variable
3. Advisory speed signs
4. Spot speed camera
6. Driver Speed monitoring display
9. Police presence
10. Police dummy
12. Chicanes
13. Crossover design
19. Adhesive rumble strips
22. Variable message signs
Work zone
1. Temporary speed limit reduction - Static
2. Temporary speed limit reduction - Variable
3. Advisory speed signs
4. Spot speed camera
5. Section control
6. Driver Speed monitoring display
7. Speed camera with worker warning
9. Police presence
10. Police dummy
14. Narrowed lane width
15. Temporary separation of directions

CEDR Call 2012: Safety
34
Table 5. Recommended measures – Road type Motorway, short-term roadwork
Work Type Location in Road work Recommended measures
Short-Term - Static
Advanced warning area
1. Temporary speed limit reduction - Static
8. Speed camera sign
11. Graduated Fixed Penalties
22. Variable message signs
23. Emotional messages
Transition area
1. Temporary speed limit reduction - Static
3. Advisory speed signs
6. Driver Speed monitoring display
9. Police presence
10. Police dummy
22. Variable message signs
Work zone
1. Temporary speed limit reduction - Static
3. Advisory speed signs
7. Speed camera with worker warning
9. Police presence
10. Police dummy
Intermittent - Mobile
Advanced warning 22. Variable message signs
Transition area and Work zone
3. Advisory speed signs
6. Driver speed monitoring display
7. Speed camera with worker warning
22. Variable message signs

CEDR Call 2012: Safety
35
Table 6. Recommended measures – Road type Single carriageway, long-term roadwork
Work Type Location in Road work Recommended measures
Long-Term (>3d)
Advanced warning area
1. Temporary speed limit reduction - Static
2. Temporary speed limit reduction - Variable
8. Speed camera sign
11. Graduated Fixed Penalties
21. Optical speed bars
22. Variable message signs
23. Emotional messages
Transition area
1. Temporary speed limit reduction - Static
2. Temporary speed limit reduction - Variable
3. Advisory speed signs
4. Spot speed camera
6. Driver Speed monitoring display
9. Police presence
10. Police dummy
19. Automated flagger
18. Pilot vehicle
19. Adhesive rumble strips
22. Variable message signs
Work zone
1. Temporary speed limit reduction - Static
2. Temporary speed limit reduction - Variable
3. Advisory speed signs
4. Spot speed camera
5. Section control
6. Driver Speed monitoring display
7. Speed camera with worker warning
9. Police presence
10. Police dummy
14. Narrowed lane width
15. Temporary separation of directions

CEDR Call 2012: Safety
36
Table 7. Recommended measures – Road type Single carriageway, short-term roadwork
Work Type Location in Road work Recommended measures
Short-Term - Static
Advanced warning
1. Temporary speed limit reduction - Static
8. Speed camera sign
11. Graduated Fixed Penalties
22. Variable message signs
23. Emotional messages
Transition area
1. Temporary speed limit reduction - Static
3. Advisory speed signs
6. Driver Speed monitoring display
9. Police presence
10. Police dummy
16. Flagger
17. Automated flagger
18. Pilot vehicle
20. Portable rumble strips
22. Variable message signs
23. Emotional messages
Work zone
1. Temporary speed limit reduction - Static
3. Advisory speed signs
7. Speed camera with worker warning
9. Police presence
10. Police dummy
14. Narrowed lane width
22. Variable message signs
Intermittent - Mobile
Advanced warning area
22. Variable message signs
Transition area and Work zone
3. Advisory speed signs
6. Driver Speed monitoring display
7. Speed camera with worker warning
22. Variable message sign

CEDR Call 2012: Safety
37
4 Measures for appropriate speed in work zones
Measures for appropriate speed in work zones have been reviewed in literature (D2.1); from data analyses (D3.1); and with the help of stakeholders, showcases and a simulator study (D4.1). Those measures that were identified as speed reducing in work zones are described in chapter 4.1 - 0. The main advantages and recommendations are given along with examples of application fields, expected impact, on-site deployment/operational issues, and cost components. References can be found in the deliverables D2.1, D3.1 and D4.1. The results from the different studies were collected in order to quantify the potential additional speed reduction of the various measures compared with a situation without this particular measure. However, both the reference situation and the use of the measure vary widely between studies. Hence, there are large differences in the achieved speed reductions. Thus, the additional potential speed reduction from each measure presented in Table 8 is only indicated in terms of low, medium and high. Some of the speed management measures reduce speeds by only a few kilometres per hour compared with a work zone without this particular measure. However, even when only small speed reductions are achieved, these reductions may still be crucial when it comes to worker safety and in addition drivers are alerted to an upcoming work zone or work zone related hazard. Most of the measures used for controlling work zone speeds have shortcomings in terms of effects. Hence, combinations of measure are often used and usually increase the effect. This is further described in chapter 4.24.

CEDR Call 2012: Safety
38
Table 8: Speed management methods – potential additional speed reduction compared to the situation without the measure.
Speed Management method Potential additional speed reduction*
1. Temporary speed limit reduction – Static speed limit sign Low–medium
2. Temporary speed limit reduction – Variable speed limit sign Low–high
3. Advisory speed sign No data
4. Automated speed enforcement – Spot speed cameras Low–medium
5. Automated speed enforcement – Section control No data
6. Driver speed monitoring display Low–medium
7. Speed camera with worker warning No data
8. Speed camera sign Low
9. Police presence Low–high
10. Police dummy Low
11. Graduated fixed penalties Low
12. Chicanes No data
13. Crossover design –
14. Narrowed lane widths Low–high
15. Temporary separation of directions Low
16. One-way traffic control – Manual flagger Medium–high
17. One-way traffic control – Automated signal devices No data
18. One-way traffic control – Pilot vehicle No data
19. Rumble strips–adhesive Low
20. Rumble strips–portable Low–high
21. Optical speed bars Low
22. Variable message sign Low
23. Emotional messages Low
*The sizes of the speed reduction listed above are based on various numbers of studies and the results vary considerably.

CEDR Call 2012: Safety
39
4.1 Temporary speed limit reduction – Static speed limit signs
Measure name
Temporary speed limit reduction – static speed limit signs
Description
In work zones the most common measure to reduce speed is the temporary speed limit reduction. National guidelines give advice on what speed limit to set, depending on type of road work and work zone layout. Most national guidelines also stipulate on which distance to the work zone the speed limit signs should be positioned and what steps should be used (stepwise speed limit reduction).
Different criteria are used across Europe to assign work zone speed limit, the two main (i.e. used in the majority of the countries) being the original posted speed and the road type. Other criteria are common but are not necessarily exploited in all the EU countries; e.g. the proximity of workers to traffic, the use of safety barriers (see ASAP D2.1 for more details). Some of these are candidate criteria a road manager may use to derogate from classical speed limit schemes and also represent a chance for harmonization of EU practices; as discussed under chapter 2.5.1.3.
Figure 15. Static speed limit signing (examples from the showcase on Belgian A15/E42 motorway)
Main advantages
Most common measure for speed reduction and hence well known by the road user.
Provides legal basis for enforcement.
Static signing is a low cost measure.
Can rather easily be removed or covered.
Main recommendations
The speed limit scheme must be credible with regard to the activity in the work zone and the geometry of the temporary lane management.
When setting temporary speed limits, the safety of the road worker should always be considered. Lateral and longitudinal safety distances as well as geometry of the transition area are important parameters to consider during the risk analysis. Provided that road worker's protection is effective enough, the opportunity to use moderate speed reductions can be considered, which have been found to result in

CEDR Call 2012: Safety
40
higher compliance and lower speed variance (usually resulting in lower traffic accident rate).
Larger speed limit reductions can preferably be in steps of 20 km/h to ensure a smooth vehicle speed reduction.
Not recommended as a single measure for longer distances (speeding risk).
Best effect in combination with other measures, such as automated speed enforcement or physical measures that force the drivers to reduce their speed.
Application fields
National guidelines may not allow the use of speed limit signs on moving vehicles.
Temporary speed limit signs are usually posted at regular intervals along the advance warning area, the transition area and the work zone.
Successive steps of 20 or 30 km/h speed limit reductions are used (cf. national guidelines). The lateral distance between two successive speed reductions largely varies across Europe.
Figure 16. Example: standard speed limit scheme for a major road work executed on a 2/3 lanes Belgian motorway.
Expected impact
The potential speed reduction is about 25% of the size of the speed limit reduction if no additional measures are provided.
Effectiveness is directly related to the credibility of the speed limit.
Effectiveness is higher, if the driver can view the reason for the speed reduction.
To increase the credibility the speed limit signs can be removed or covered when needed, depending on the local regulations.
Effectiveness is depending on local drivers’ behaviour and on regional prevention/enforcement strategies.
ASAP D2.1 (chapter 3.1) largely discusses the impact of speed limit reduction on speed compliance, speed variance and accident rates. ASAP D3.1 (chapter 3.1) and D4.1 (chapter 4.1) illustrate that various speed behaviours may be obtained with various speed reduction sequences and how far speeding may occur.
On-site deployment/operational issues
An official permission (from the local road manager) is usually needed.
Coordination with the traffic police/enforcement agencies may be requested.
Temporary speed limit signs are usually part of the road work signing and therefore executed by the road work contractor, under adequate safety protection.
VMS systems (fixed or mobile) may be used to complement fixed signing.
Cost components
Installation and maintenance costs are usually included in the road work contract.
For complex road works (i.e. with several work stages and therefore changing temporary lane management) signing may represent several % of the total road works costs. However speed signs represent a small part of these costs and are therefore considered as a low cost measure.

CEDR Call 2012: Safety
41
4.2 Temporary speed limit reduction – Variable speed limit signs
Measure name
Temporary speed limit reduction – Variable speed limit signs
Description
The variable speed limit sign can be used to inform drivers of a temporary speed limit. Variable speed limits can be used to alter the speed limit considering the on-going conditions in the work zone (e.g. workers present; weather conditions; traffic flow) posting a speed limit based on real-time traffic flow, roadway and speed conditions. Different types are available for permanent, semi-permanent or temporary, e.g. trailer-mounted (Figure 17).
Figure 17. Variable Speed Limits, trailer-mounted on the left (source: BRRC) portable on the right (photo: Sara Nygårdhs, VTI) and permanent on the top (source: Trafikverket.se).
Main advantages
Higher credibility (if managed appropriately).
Higher influence on the speed reduction than traditional static signs.
Provides legal basis for enforcement if managed appropriately.
Main recommendations
Important to log all changes in speed limits and exact time and date for the changes, otherwise enforcement difficulties may occur.
When setting temporary speed limits, the safety of the road worker should always be considered. Lateral and longitudinal safety distances as well as geometry of the transition area are important parameters to consider during the risk analysis. Provided that road worker's protection is effective enough, the opportunity to use moderate speed reductions can be considered, which have been found to result in

CEDR Call 2012: Safety
42
higher compliance and lower speed variance (usually resulting in lower traffic accident rate).
Larger speed limit reductions can preferably be in steps of 20 km/h to ensure a smooth vehicle speed reduction.
Application fields
Use at road works where conditions are expected to alter during the time of operation.
Check national legislation on possibility to use variable speed limits.
National guidelines may not allow the use of speed limit signs on moving vehicles.
Expected impact
The additional speed reduction ranges from 5 to 8 km/h compared with the situation with static signs.
Reduction on speed variance.
Can help to produce more rapid recovery from congestion.
When demand volumes are extremely high and directly impact on driven speed, VSLs offer no appreciable benefit over static speed limits (Fudala and Fontaine, 2010a).
Effective on reducing speed during foggy conditions;
On-site deployment/operational issues
Battery or other source of energy needed.
Can rather easily be removed.
Cost components
High investment costs compared with static signs.

CEDR Call 2012: Safety
43
4.3 Advisory speed sign
Measure name
Advisory speed sign
Description
Advisory speed signs (Figure 18) indicate a recommended safe speed through temporary work zones. Advisory speed signs are generally used as supplementary warnings of an approaching hazard. Can also be posted on VMS.
Figure 18. Static sign showing recommended maximum speed, to the left circled in green (photo: VTI/Hejdlösa bilder), to the right static and variable sign (photo: Magnus Pajnert).
Main advantages
Can be attached to a moving vehicle.
May not need an official permission.
Indicate a recommended safe speed through temporary work zones.
Main recommendations
Not to be used as a stand-alone measure.
Application fields
Suitable for intermittent and mobile road works.
Can be used for short term road works if combined with e.g. physical measures.
Expected impact
Small speed reducing effect.
Alerts drivers to an expected speed reduction.
On-site deployment/operational issues
No official permission from the local road manager is usually needed.
Cost components
Low cost measure if static sign is used.

CEDR Call 2012: Safety
44
4.4 Automated speed enforcement – Spot speed cameras
Measure name
Spot speed cameras
Description
Automated speed enforcement devices utilize a camera and a radar or laser device to detect speeds of oncoming traffic at as specific point. These cameras capture the license plate of passing vehicles exceeding a speed above the legal limit and mail a fine (and penalty points) to the driver of the vehicle. Spot speed cameras can be stationary as well as mobile.
Figure 19. Automated Speed Cameras (Source left: www.securoad.be)
Main advantages
Enforcement without presence of the police.
Large speed reductions
Can be used in locations where police vehicles cannot be safely and effectively deployed.
Main recommendations
For both short- and long-term enforcement.
Deterrent effect by increasing the risk of detection.
Spot speed cameras can be used in locations where police vehicles cannot be safely and effectively deployed.
Application fields
Should be placed close to the area where the speed reduction is needed.
Expected impact
The potential speed reduction ranges from 3 to 15 km/h.
The deployment of speed cameras have shown significant decreases in numbers of injurious crashes (Elvik, Mysen & Vaa, 1997).
Notorious speeders could hide their number plates or face to avoid recognition/identification.
Several studies indicated speed cameras as very effective in reducing the average speed in a construction work zone, increasing compliance with the work zone speed limit (Joerger, 2007).
A more stable spatial speeding distribution through the work zone is usually induced (Franz & Chang, 2011).
Controls only the area around the camera.
On-site deployment/operational issues
May be subject to vandalism.
Battery or other source of energy needed.
Photo: Ulf Nilsson Mimbild AB

CEDR Call 2012: Safety
45
Time for calibration may be needed.
Cost components
High investment cost
Rather low operating costs
Can be rented
Not labour intensive

CEDR Call 2012: Safety
46
4.5 Automated speed enforcement – Section control
Measure name
Section control
Description
Section control uses two or more spot speed devices and identifies (per licence plate) passing vehicles that travel between the devices with a speed that exceeds the legal limit. Fines (and penalty points) are mailed to the owner of the vehicle. With section control the mean speed between speed cameras is measured (space mean speed measurements). Note that this measure is not allowed in all European countries due to legal restrictions.
Figure 20. Section control information signs, to the left from http://www.laleggepertutti.it; to the right a sign from Austria.
Main advantages
Controls a longer section
Enforcement without presence of the police
Reduces speed effectively
Can be used in locations where police vehicles cannot be safely and effectively deployed.
Main recommendations
For long-term enforcement.
For work zones in which high safety risks are present.
Application fields
Usually requires the same speed limit between the cameras.
Expected impact
Accident and injury reduction has been estimated for road works.
Does not affect notorious speeders that hide their number plates to avoid recognition/identification.
Harmonisation of speeds in the work zone (deliverable 3.1).
On-site deployment/operational issues
Risk of vandalism, if not installed overhead using portal.
Battery or other source of energy needed.
Cost components
High investment cost.

CEDR Call 2012: Safety
47
Rather low operating costs.
Can be rented.
Not labour intensive

CEDR Call 2012: Safety
48
4.6 Driver speed monitoring displays
Measure name
Driver speed monitoring displays
Description
Speed monitoring displays (SMD), are usually stand-alone systems that can be installed individually, or in series (Figure 21). Different systems are on the market, e.g. self-contained trailer unit equipped with speed detector and a display. The systems are typically battery powered to last at least one week. The speeds of approaching vehicles are displayed on LED panels, usually along with the posted work zone speed limit, and messages like “Your Speed is …”, “Watch speed”, etc..
Figure 21. Mobile speed monitoring display showing the drivers’ speed and a message. Left: message “ZPOMAL” (Reduce your speed), photo: CDV. Right: “Här gäller 30” (Current limit 30) photo: SNRA.
Main advantages
Effective in lowering speeds
Increases harmonisation of speeds
Increases speed limit compliance
Increases the vigilance considerably
Main recommendations
The effect of a single VMS may be reduced with distance from the sign (low halo effect), but the effect can often be sustained with two or more VMSs.
“Personal” messages (like “Your Speed is …”) seem to be the more effective than impersonal messages (The speed is….).
Higher effectiveness, if supported by periodic police enforcement.
If combined with text, language dependent.

CEDR Call 2012: Safety
49
Application fields
Should be placed close to the area where the speed reduction is needed.
Expected impact
The potential speed reduction ranges from 3 to 12 km/h.
Effective speed reduction only for a short section
On-site deployment/operational issues
Battery or other source of energy needed.
Cost components
High investment cost
Rather low operating costs
Can be rented
Not labour intensive

CEDR Call 2012: Safety
50
4.7 Speed camera with worker warning
Measure name
Speed camera with worker warning
Description
Speed cameras are used at work zones along with worker warnings and a sign informing drivers about the monitoring camera. No enforcement is connected to the monitoring. The speed detection is used to send audible and light warnings to road workers in the work zone in case of speeding vehicles.
Figure 22. Camera monitored work zone with worker warning. Left photo : Fredrik Tillström, right: Thinkstock.
Main advantages
Reduces speed for the whole speed distribution
Major reduction of the number of speeding violations
Drivers and road workers are positive to this measure
Main recommendations
In work zones where workers are exposed and often close to the vehicles
Application fields
Expected impact
Speed data from one study showed a 5 km/h speed reduction for the whole speed distribution.
In the long run the drivers might learn that no enforcement is connected to the camera.
On-site deployment/operational issues
Battery or other source of energy needed

CEDR Call 2012: Safety
51
Cost components
Not labour intensive

CEDR Call 2012: Safety
52
4.8 Speed camera sign
Measure name
Speed camera sign
Description
A speed camera traffic sign (Figure 23) that is not accompanied by any speed camera can be used to deceive drivers that speed enforcement takes place.
Figure 23. Speed camera signs
Main advantages
Low cost measure
Main recommendations
Drivers have to understand the language and the message.
In the long run the drivers might learn that no camera or enforcement is connected to the sign.
Application fields
Expected impact
The potential speed reduction ranges from 0 to 5 km/h.
On-site deployment/operational issues
Easy to install and remove or cover
Cost components
Low cost measure: Low investment costs and low operational costs
Not labour intensive

CEDR Call 2012: Safety
53
4.9 Police presence
Measure name
Police presence
Description
Police patrol presence (locally and temporarily) with or without speed control & enforcement (cf. D4.1 showcase in CZ); Literature (cf. Deliverable 2.1 – Chapter 4.9.1) reports higher level of speed limit compliance along work zones where a police vehicle is parked and visible.
Figure 24. Police precence at work zones. Left photo: Thinkstock, right photo: VTI/Hejdlösa bilder.
Main advantages
High level of speed limit compliance
Speeding can be enforced
Strongly supports other measures
Main recommendations
Enforce speed regulations where and when risk-taking behaviours are most evident and traffic volumes are high.
Position the police vehicles close to the area where the speed reduction is needed, because of its powerful effect in getting vehicle speeds down before entering the work zone.
Since the speed reduction may not remain after passing the police vehicle other complementary measures might be needed.
Beneficial to position the police vehicles visible for the drivers.
Enforcement patterns should be varied in time and location
Application fields
The police presence should be visible.
The visible police patrol should be close to the area where the speed reduction is needed.
Expected impact
The potential speed reduction ranges from 3 to 19 km/h, but no remaining speed reduction when the police is no longer present.

CEDR Call 2012: Safety
54
On-site deployment/operational issues
Can easily be introduced and removed
Labour intensive
Police vehicle chasing speeders through a work zone can impose danger to the road workers and other road users.
The position of the police may not block the view of the road users and the road workers.
All road authorities do not have the possibility to control when and where police can be present.
Cost components
Can be labour intensive and costly with long term use.
Police labour costs

CEDR Call 2012: Safety
55
4.10 Police dummy
Measure name
Police dummy
Description
Police men dummies or police vehicle dummies are sometimes used to reduce speeds in work zones (Figure 23). Another strategy is to park empty patrol vehicles (or vehicles with a dummy inside) at or near work zones, in an effort to deceive drivers that enforcement is active and hence make them reduce their speed, saving police resources.
Figure 25. Police dummies and vehicle dummy.
Main advantages
Not labour intensive
Can be very effective for short periods of time.
Can rather easily be installed and removed.
Vehicle dummies can sometimes be used effectively, saving police resources.
Main recommendations
Drivers may soon realize that there is no real enforcement (mainly on commuter sections).
Real police vehicles could be used from time to time in the same location, keeping drivers in the doubt.
Application fields
Expected impact
The potential speed reduction ranges from 5 to 8 km/h
On-site deployment/operational issues
The false enforcement may be revealed in the long run. The drivers might find out that no enforcement takes place.

CEDR Call 2012: Safety
56
Care must be taken that vehicles are not parked in a position that creates a collision hazard or a sight distance obstruction.
Danger of sudden braking manoeuvres.
Cost components
Low cost

CEDR Call 2012: Safety
57
4.11 Graduated Fixed Penalties
Measure name
Graduated Fixed Penalties
Description
Increasing penalties for speeding in work zones could be an effective deterrent to speeding. Different methods can be applied such as loss of license demerit points, doubled fines or suspensions. The practice of graduated fines has increased in last years but is essentially limited to a few countries such as the U.S. and Canada.
Figure26. Double fines in work zones. Source: http://www.newson6.com and http://www.mto.gov.on.ca/english/engineering/zones/
Main advantages
In some cases increased fines seem to discourage speeding.
Main recommendations
Make sure that drivers are aware of the (levels of the) penalties.
The amount of the graduated penalty has to be deterrent enough.
The information signs should be used.
Application fields
Not for mobile work zones
Expected impact
The potential speed reduction ranges from 0 to 10 km/h.
The studies show mixed results, some show increased speed limit compliance while others don’t.
The effectiveness of increased fines in reducing collisions and fatalities is not always evident.
The effectiveness of this measure clearly depends on effective enforcement. Without enforcement, speeders will not be apprehended.
On-site deployment/operational issues
Cost components
Low cost measure but sometimes difficulties in the administration of the graduated fines.

CEDR Call 2012: Safety
58
4.12 Chicanes
Measure name
Chicanes
Description
A chicane (Figure 27) is a traffic management solution characterised by a change in the alignment of the traffic flow on the carriageway. A motorist passing through a chicane is forced to change directions twice in quick succession, typically reducing the speed to do so.
Figure 27. Example of chicane, Nygårdhs (2007), photo: S. Nygårdhs.
Main advantages
Reduces speed efficiently
Useful in the transition area
Main recommendations
Make sure drivers are informed about necessary speed reduction
Application fields
Expected impact
Reduces speed efficiently
On-site deployment/operational issues
Extensive work to mount and dismount the devices
Cost components
Relatively low cost for long-term projects but rather high installation cost

CEDR Call 2012: Safety
59
4.13 Crossover design
Measure name
Crossover design
Description
In a crossover by which the total traffic flow in one direction is diverted to the opposite carriageway, both the speed limit scheme and the opening width of the central reserve can be adjusted. Provided a suitable speed limit scheme, the opening width can be rather wide enabling drivers to manoeuvre safely even at higher speeds, avoiding sudden decelerations or abrupt manoeuvres.
Main advantages
No traffic in close proximity to the work zone, protects road workers when behind barriers.
Smaller increase in speed variance from upstream to work location, showing a significant homogeneity of the speeds adopted by the drivers.
Higher capacity
Main recommendations
Attention must be paid to the impact of higher speeds on road worker safety.
Wider opening width (e.g. 80 m compared with 40 m) seems to allow the road users to complete the manoeuvre safely even at higher speeds, avoiding sudden decelerations or abrupt manoeuvres.
Speed limit scheme in steps of 20 or 30 km/h
Application fields
This layout can be implemented in motorways and dual carriageway roads.
Expected impact
Wider opening width leads to higher mean speeds
Greater compliance with speed limits (which are increased compared to those of the reference situation).
Smoother variation of the actuated deceleration within the transition area.
Decrease in the upstream-to-work-zone speed variance.
The study also indicate that a larger opening width allows the users to complete the manoeuvre safely even at higher speeds, avoiding sudden decelerations or abrupt manoeuvres.
On-site deployment/operational issues
The change in speed limit scheme should be approved by the road authority.
Cost components
A slight modification of the speed limit scheme doesn’t lead to additional costs. However a longer opening of the central reserve would cause additional work and need more materials: demolition of the central reserve, equipment removal, longer base layer and pavement. The total cost of this measure would be dependent on the initial situation.

CEDR Call 2012: Safety
60
4.14 Narrowed lane width
Measure name
Narrowed lane width
Description
Vehicle speeds can be reduced by narrowing the lane widths through a work zone.
In general, narrow lanes leave less lateral distance between vehicles in adjacent lanes or between vehicles and shoulder obstructions, increasing motorists’ attention and inducing motorists to reduce speeds. This can be accomplished using a variety of channelizing devices, including delineators, traffic cones, drums, and temporary barriers.
Figure 28. Narrowing lane width using yellow line markings. Photo: Fredrik Friberg.
Main advantages
Moderate speed reduction throughout the entire length of the narrowed section.
Main recommendations
Use narrow lanes to reduce speeds in long duration construction work zones where other speed control measures have been ineffective, and where work zone speeds cause significant hazard.
Due to this measure, existing lane markings should be removed, if there is any danger of confusion between them and the narrow lane markings.
Use tubular markers rather than pavement markings for reducing the lane width, and separating the construction area from the open lanes. (Bham & Mohammadi, 2011).
Application fields
Expected impact
The potential speed reduction ranges from 3 to 21 km/h with narrow lanes
Effect could be more collisions and therefore less safety
On-site deployment/operational issues
Broken cars may block the road with narrow lanes.
Narrow lanes may result in high deceleration rates.
Narrow lanes can reduce roadway capacity (no possibility of overtaking trucks).
Narrow lanes increased risk of vehicles striking the channelizing devices especially for trucks.
Cost components

CEDR Call 2012: Safety
61
Relatively low cost for long-term projects

CEDR Call 2012: Safety
62
4.15 Temporary separation of directions
Measure name
Temporary separation of directions
Description
There are different approaches used to separate the opposing traffic flows that can affect the speeds. Channelizing devices include cones, surface mounted delineators, weighted channelizers, orange or yellow lines, barrels, drums and concrete or plastic barriers. In Figure 29 two types used in a simulator study are shown.
Figure 29. Vertical delineators, from a simulator study of the effect of different channelizing devices.
Main advantages
Vertical delineators show better effect in reducing speed than orange lines; studs, or no markings.
Main recommendations
Existing lane markings can be confusing and should be removed.
Application fields
Expected impact
The potential speed reduction ranges from 0 to 5 km/h
On-site deployment/operational issues
Existing lane markings can be confusing and should be removed.
Cost components
Cost dependent on length of road work

CEDR Call 2012: Safety
63
4.16 One-way traffic control – Manual flagger
Measure name
One-way traffic control – Manual flagger
Description
In some countries, flagging is a commonly used technique to control one-way traffic in e.g. single carriageway work zones (Figure 30). Flaggers are typically used to control the flow of traffic through the work zone.
Figure 30. Flagger and flagger warning, photo: Thinkstock.
Main advantages
Can be very effective at reducing traffic speeds.
Main recommendations
A flagger needs to be placed far enough in advance of the work zone to allow motorists to slow down or stop as required.
Personnel should be properly trained and rotated on a regular basis.
Only applicable at lower speed limits, not on highways.
Mainly for short term work zones
Application fields
Expected impact
The potential speed reduction when passing the road work ranges from 15 to 24 km/h.
On-site deployment/operational issues
Worker injury risk may apply when flagger has authority to stop the traffic
Physically tiring and monotonous work
Cost components
Labour intensive
Costly for long-term use

CEDR Call 2012: Safety
64
4.17 One-way traffic control – Automated signal devices
Measure name
One-way traffic control – Automated signal devices
Description
Alternatively right of way can be controlled by different types of automated device. In Europe the most common way is to use (mobile) traffic lights (Figure 31A). Different types are on the market. Some are automatic vehicle controlled and use radio linked signals using more than one frequency. In the USA Automated Flagger Assistance Devices (AFADs) are designed to be remotely operated by a flagger positioned outside of the travel lane, thereby reducing their exposure to vehicular traffic. There are two types of remotely controlled AFADs: one type uses a stop/slow sign to alternately control the right-of-way; another uses red and yellow lenses and a gate arm to alternately control the right-of-way (Figure 31B).
Figure 31. A: Mobile traffic light (source: http:www.ata.se); and B: automated flagger assistance devices.
Main advantages
Only traffic from one direction at the time.
Main recommendations
This measure shall only be used in situations where there is just one lane of approaching traffic that needs to be controlled. Their use is discouraged for long-term activities (USDOT, 2012).
Application fields
AFAD should be placed within the shoulder of the road; however, if the shoulder is not adequate, the AFAD may encroach on the travelled lane if the appropriate sight distance is available.
AFADs shall only be used in situations where there is just one lane of approaching traffic that needs to be controlled.
Expected impact
On-site deployment/operational issues
Battery or other source of energy needed (i.e. 2 weeks on 180Ah battery)
Cost components

CEDR Call 2012: Safety
65
Costs vary by system specifications, Traffic signal system can cost the average cost for a set of AFADs ranged from approximately $25,000 to $30,000 (USDOT, 2012).

CEDR Call 2012: Safety
66
4.18 One-way traffic control – Pilot vehicle
Measure name
One-way traffic control – Pilot vehicle
Description
When one-way traffic needs to be controlled through the work zone a pilot vehicle can be used. A pilot driving a vehicle guides traffic past a road work, thereby setting the speed for the followers. The vehicle carries some type of warning devices (e.g. yellow flashing lights) and instruction to follow (and not overtake) the pilot.
The pilot vehicle is used to coordinate one-way movements of traffic when only one single lane is open to two-way traffic. Pilot vehicle can also be required to guide traffic through the work zone when part of the work zone is out of view of flaggers, when there is close proximity to workers or workers on the road, when works can be damaged due to high speeds, or when the travel path is not obvious to follow (Debnath et al, 2013).
Figure 32. Pilot vehicles. Left photo: Åke Johansson, Right Lots följ mig (Pilot follow me), source: www.trafikverket.se
Main advantages
The pilot decides what speeds other vehicles should have
The pilot have a better understanding of the site's unique conditions including were the road workers are
Main recommendations
Recommended if the flow is lower than 800 vehicles per hour.
This measure should be used if the posted speed limit is low due to the presence of hazards or workers and when the travel path is not easily understandable.
Application fields
Pilot cars can be used in long, one‐way work zones to help traffic get through safely.
Expected impact
Reduces speeding
On-site deployment/operational issues
Requires a vehicle, communications, and signal device or flagger.
Cost components
Labour intensive

CEDR Call 2012: Safety
67
4.19 Adhesive rumble strips
Measure name
Adhesive rumble strips
Description
Adhesive rumble strips create an audible, visual, and physical alert when driven over (Figure 33). Rumbled strips are intended to warn drivers of an approaching work zone where they may be required to stop, merge, or simply slow down.
Adhesive rumble strips are manufactured with a removable adhesive and can be cut to the desired length. Redressing adhesives are also available for up to four uses.
Figure 33. Adhesive rumble strips, source: Vejdirektoratet, 2013 (to the left) and http://pppcatalog.com/store/reflective-rumble-strips (to the right).
Main advantages
Easier to install and remove compared to permanent rumble strips;
Very effective in alerting drivers to the upcoming hazards or critical situations such as lane changes and detours.
Main recommendations
Adhesive rumble strips require relatively long time for installation and removal. Therefore they are recommended rather for long-term work zones (USDOT, 2013).
Warning signs are recommended
Application fields
Mainly for rather long-term work
Adhesive rumble strips are not recommended for mobile or short duration work zones.
May wear out easily on roads with high speeds or high traffic density.
Not always efficient for reducing speed of heavy vehicles.
Rumble strips should be selectively located with respect to the potential hazard.
Expected impact
The potential speed reduction ranges from 5 to 10 km/h
On-site deployment/operational issues
Potential hazards for motorcyclists.
Traffic may swerve around the strips.

CEDR Call 2012: Safety
68
The spacing of rumble strips is dependent on the speed within the work zone; lower speeds require less spacing between strips, whereas higher speeds require more spacing.
Difficulties when snow on the road.
Difficulties for winter maintenance
Cost components
Low cost measure
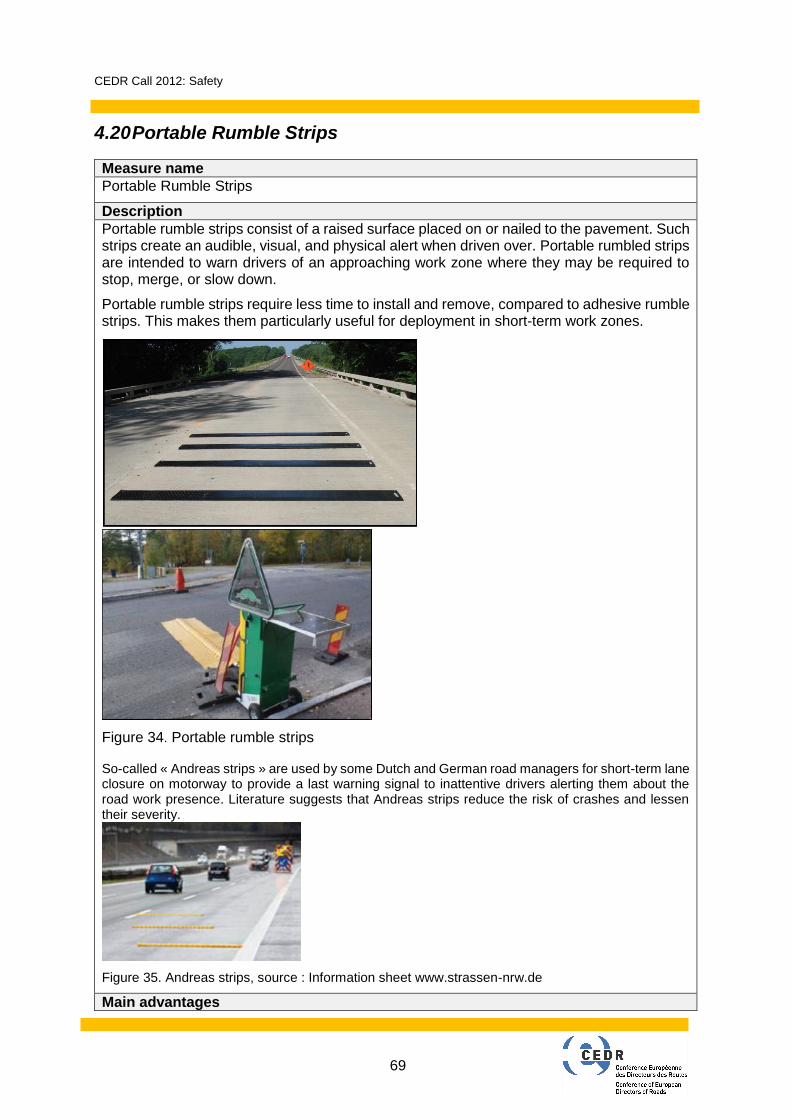
CEDR Call 2012: Safety
69
4.20 Portable Rumble Strips
Measure name
Portable Rumble Strips
Description
Portable rumble strips consist of a raised surface placed on or nailed to the pavement. Such strips create an audible, visual, and physical alert when driven over. Portable rumbled strips are intended to warn drivers of an approaching work zone where they may be required to stop, merge, or slow down.
Portable rumble strips require less time to install and remove, compared to adhesive rumble strips. This makes them particularly useful for deployment in short-term work zones.
Figure 34. Portable rumble strips
So-called « Andreas strips » are used by some Dutch and German road managers for short-term lane closure on motorway to provide a last warning signal to inattentive drivers alerting them about the road work presence. Literature suggests that Andreas strips reduce the risk of crashes and lessen their severity.
Figure 35. Andreas strips, source : Information sheet www.strassen-nrw.de
Main advantages

CEDR Call 2012: Safety
70
Significant speed reduction, particularly for passenger cars.
Easier to install and remove compared to permanent rumble strips.
Faster to install and remove compared to adhesive rumble strips.
Very effective in alerting drivers to the upcoming hazards or critical situations such as lane changes and detours.
Reusable in a variety of scenarios at work zones.
Main recommendations
Only for low-speed conditions. Warning signs are recommended
Application fields
Portable rumble strips require no adhesives. Therefore they could be useful for daily installation and removal.
Not always efficient for reducing speed of heavy vehicles.
Moves easily by (braking of) heavy trucks.
Wear out easily on roads with high speeds or high traffic density.
Expected impact The potential speed reduction ranges from 7 to 18 km/h.
On-site deployment/operational issues
Potential hazards for motorcyclists.
Traffic may swerve around the strips.
May not be allowed for high speed limits.
The spacing of rumble strips is dependent on the speed within the work zone; lower speeds require less spacing between strips, whereas higher speeds require more spacing.
Difficulties when snow on the road
Cost components
Low cost measure

CEDR Call 2012: Safety
71
4.21 Optical speed bars
Measure name
Optical speed bars
Description
Optical speed bars are a non-obstructive manner of reducing driving speeds by manipulating the visual environment to induce a perception of higher driving speeds. This is achieved by transverse and peripheral stimuli that influence speed perception and driver behaviour. Gradually decreasing the distance between transversal strips (Figure 36) creates the illusion of speeding.
Figure 36. Example of optical line markings (source: www.fhwa.dot.gov; blog.oregonlive.com).
Main advantages
Low operational costs
Main recommendations
The implementation of this measure should be considered with respect to design parameters such as length of pattern, number of stripes, and the sequence of spacing between bars
Application fields
The use of transverse pavement markings is recommended upstream of the work zones.
Expected impact
The potential speed reduction ranges from 2 to 7 km/h
On-site deployment/operational issues
Cost components
Only installation cost. Low operational costs.

CEDR Call 2012: Safety
72
4.22 Variable message signs
Measure name
Variable message signs
Description
Variable message signs (VMS) are commonly used to increase driver awareness in work zones. There are both permanent and portable variable message signs. Different types of VMS are shown in Figure 37.
Figure 37. Variable Message Signs (VMS)
In work zones the portable type is more common, providing special instructions, warnings, or other information to motorists.
Main advantages
Can provide drivers with real-time information about conditions.
Effectiveness on reducing speeds is connected to placing a message on the sign only when there is a specific activity or condition that really requires the message.
Main recommendations
Mainly an additional measure
Personal messages seem to be more effective (than impersonal messages)
Language dependent
Application fields
CEDR Call 2012: Safety
73
Use at road works where conditions are expected to alter during the time of operation.
Expected impact
The potential speed reduction ranges from 1 to 8 km/h
On-site deployment/operational issues
Battery or other source of energy needed
Cost components
High investment cost
Can be rented
Rather low operating costs

CEDR Call 2012: Safety
74
4.23 Emotional messages
Measure name
Emotional messages
Description
Emotional messages, addressing the drivers’ conscience, seem to have effects on reducing speeds. Such messages, e.g. “Please Slow Sown My Dad Works Here” (Figure 38), can be given on different types of signs.
Figure 38. Examples of “particular messages” (Source: blogs.star-telegram.com).
Main advantages
Some speed reducing effect.
Can rather easily be removed or covered.
Main recommendations
Can be used in combination with other measures, such as automated speed enforcement or physical measures that force the drivers to reduce their speed.
Application fields
Can also be presented on a VMS
Expected impact
The potential speed reduction ranges from 0 to 3 km/h
On-site deployment/operational issues
Language dependent
Cost components
Low cost measure
Not labour intensive

CEDR Call 2012: Safety
75
4.24 Combination of measures
A combination of measures is commonly used (as described in the chapters above) and usually increases the efficiency in reducing vehicle speeds. In the data analyses performed in work package 3 examples of combined measures were identified as speed reducing. In Table 9, 8 datasets (out of 43) from work zones were confirmed to be successful in reducing speed (P85 of all vehicles is lower than the speed limit).
Table 9. Examples of combined measures proven to be successful in reducing speed (v85 of all vehicles is lower than the speed limit).
On the one hand there are large speed limit reductions in these work zones, on the other hand it can be assumed that a well combined and balanced set of different safety measures are the reason. In general it is positive to have redundant information about the location and especially the beginning of the work zone (specific road signs in the advanced warning area), together with clearly visible optical signals and physical measures/treatments which is leading the driver to a safer driving behaviour and is raising awareness of the on-coming variation in the road trace. E.g. a narrowed lane with haptic measures (rumble strips) is giving a clear hint to the driver – to slow-down must be the logical consequence for each driver. In some countries and especially on safety critical road sections, where the acceptance of speed limitation (and/or the degree of penalty) seems to be low, other more severe measures (different types of enforcement) like speed cameras, radar enforcement, section control or police presence could ensure a better reliability of the overall work zone safety and decrease the number of speeding vehicles. The small sample of the 8 work zones is too low to draw significant conclusions on the best possible (combined) measures, but it shows the trend of their positive effect.
Regular Periphery of WZ (upstream) WZ P85 P85-Regular
Speed limit
reduction
Periphery of WZ
(downstream)
130 100/80/60 80 73,20 -56,80 -50 130
concrete barrier
between directions
orange road
markings
light signals
ahead of wz
130 100/80/60 80 78,70 -51,30 -50 130
concrete barrier
between directions
orange road
markings
light signals
ahead of wz
120 100/80 80 81,00 -39,00 -40 120
light up at night light signals
announcing lane
reduction
high safety
beacons
120 100/80 80 77,00 -43,00 -40 120
light up at night light signals
announcing lane
reduction
high safety
beacons
120 100/80 100 80,67 -39,33 -20 120
light up at night light signals
announcing lane
reduction
high safety
beacons
120 100/80 100 90,67 -29,33 -20 120
light signals ahead
of wz
high safety beacons guard rail Large orange guide signs
announcing diversion on
opposite lane
130 100/80 80 55,00 -75,00 -50 130
concrete barrier
between directions
orange road
markings
Viz.
schemes
110 50 50 44,00 -66,00 -60 monitoring camera
Speed Limits, p85 and differences Safety measures and treatments

CEDR Call 2012: Safety
76
All speed and safety related effects of any measure, if single ones or combined, are strongly dependent on the traffic volumes, the vehicle mixture, the general speed compliance of drivers in this region, the quantity of enforcement and the amount of fines, etc.. Based on the findings within the ASAP project, tendencies of potential positive effects of combined measures are shown. It is common use to have more than one single speed reduction measure in work zones, but a general conclusion cannot be drawn. The specifications of the 8 samples, presented in the following chapter can give a hint to the positive effect of combined measures.
4.24.1 Combined measures/treatments proven to be successful Considerable differences in accident frequency between the individual construction zones suggest that it is fundamentally possible to improve safety by means of suitable design and layout measures in connection with proper speed limitations. Measurements showed that wider lanes produce higher speeds. The speed limits of 80 km/h were exceeded by the majority of the drivers. Lane widths of more than 4m led to a blurring effect on track behaviour. Very wide lanes in the crossover should be avoided to achieve consistent track guidance. In other investigated work zones, the drivers were informed about the speed monitoring on signs at the road side and may have thought that the monitoring was connected with enforcement, but no enforcement was carried out. On some sites the work was always carried out on only one side of the road, secured by concrete barriers. Radar control in combination with the display of the current speed proved to be effective ways to slow down the average speed at the entrance of the work zone. Those aspects cited above are a flashlight on potential combinations. From a road safety engineers’ view a suggestion to work zone designers (road operators) is that proper safety measures should be combined in such a way, that road users can clearly understand the necessity of any treatment on the road. A guide of different measures as a portfolio for safe work zone design and sufficient speed reduction measures is beneficial – a strict specification of combinations to be used obligatory is not creating an added value, because every work zone is as individual as its measures and is strongly depending on national directives and road users’ behaviour.

CEDR Call 2012: Safety
77
5 Acknowledgement
The project consortium is grateful for the funding provided by CEDR in the Transnational Road Research Programme Call 2012: “Safety” under the chairmanship of the National Road Administration of Ireland. The funding for the research was provided by the national road administrations of Norway, Sweden, The United Kingdom, Belgium/Flanders, Germany, and Ireland.

CEDR Call 2012: Safety
78
6 References
6.1 Literature database
About 270 research reports and papers, and national guidelines were collected, reviewed and inserted in an unique database where all the documents have been classified based on the main topic, the authors, the title, the references, the year of publication and the status (“ongoing” project or “completed”). The complete database can be downloaded from the ASAP website (http://asap.fehrl.org/)
6.2 Reference list
References regarding the measures can be found in the deliverables D2.1, D3.1 and D4.1. Debnath, A. K., Blackman, R., and Haworth, N. (2013). Effectiveness of pilot car operations in reducing speeds in a long-term rural highway work zone. TRB 2014 Annual Meeting, Revised submission. Elvik R, Mysen AB, Vaa T, 1997. Trafikksikkerhetshåndbok. Tredje utgave. Handbook of traffic safety. 3rd Ed. Oslo: Transportøkonomisk Institutt. European Transport Safety Council, 2011 “PRAISE”: Preventing Road Accidents and Injuries for the Safety of Employees. ETSC, PRAISE Thematic report 6. http://archive.etsc.eu/documents/Report%206.pdf Gross, F., Persaud, B., and Lyon, C. (2010). A Guide to Developing Quality Crash Modification Factors. Report No. FHWA-SA-10-032. Washington, DC: Federal Highway Administration. Kröyer. H. R. G., Jonsson, T., Varhelyi, A. (2014). Relative fatality risk curve to describe the effect of change in the impact speed on fatality risk of pedestrians struck by a motor vehicle. Accident Analysis and Prevention, 62, 143-152. Migletz, J. , Graham, J.L., Harwood, D. W. (1993) “Procedure for Determining Work Zone Speed Limits,” National Cooperative Highway Research Program, Project 3-41, Transportation Research Board, Washington, D.C., 1993, pp. 214-218. PIARC Road safety manual (2003). U.S. Department of Transportation, Federal Highway Administration (2012). Guidance on the Use of Automated Flagger Assistance Devices Available at http://www.workzonesafety.org/files/documents/training/fhwa_wz_grant/atssa_afad.pdf
Vejdirektoratet (2013). HÅNDBOG. AFMARKNING AF VEJARBEJDER M.M..ANLÆG OG DRIFT. Vejregler, Vejdirektoratet, Copenhagen, Denmark. http://www.bar-ba.dk/media/2259787/Vejdirektoratet-anlaeg-afmaerkning-2013-2.pdf Wramborg, P. (2005), as cited in OECD-ITF (2008) “Towards Zero : Ambitious Road Safety Targets and the Safe System Approach”.