cecília carlos leite duarte - repositorium.sdum.uminho.ptlia... · para tal, o efeito destes...
TRANSCRIPT


Cecília Carlos Leite Duarte
Janeiro de 2012
Universidade do Minho
Escola de Ciências
UM
inho
|201
2C
ecíli
a C
arlo
s Le
ite D
uart
e
Oleanolic acid but not ursolic acid induces cell death in HepG2 cells under starvation-induced autophagy
Ole
an
olic
aci
d b
ut
no
t u
rso
lic a
cid
ind
uce
s ce
ll d
ea
th in
He
pG
2 c
ells
un
de
r st
arv
ati
on
-ind
uce
d a
uto
ph
ag
y

Cecília Carlos Leite Duarte
Janeiro de 2012
Universidade do Minho
Escola de Ciências
Trabalho efetuado sob a orientação doProfessor Doutor Cristóvão Limae co-orientação daProfessora Doutora Cristina Pereira-Wilson
Dissertação de MestradoMestrado em Genética Molecular
Oleanolic acid but not ursolic acid induces cell death in HepG2 cells under starvation-induced autophagy

DECLARAÇÃO
Nome: Cecília Carlos Leite Duarte
Endereço electrónico: [email protected] Telefone: 964290759
Número do Cartão de Cidadão: 13244342 2ZZ6
Título da dissertação:
Oleanolic acid but not ursolic acid induces cell death in HepG2 cells under starvation-induced
autophagy.
Orientadores:
Doutor Cristóvão Lima
Doutora Cristina Pereira-Wilson
Ano de conclusão: 2012
Designação do Mestrado:
Mestrado em Genética Molecular
É AUTORIZADA A REPRODUÇÃO INTEGRAL DESTA TESE APENAS PARA EFEITOS DE INVESTIGAÇÃO, MEDIANTE DECLARAÇÃO ESCRITA DO INTERESSADO, QUE A TAL SE COMPROMETE;
Universidade do Minho, ___/___/______
Assinatura: ________________________________________________

iii
AcknowledgementsAcknowledgementsAcknowledgementsAcknowledgements
“…All our science, measured against reality, is primitive and childlike - and yet, it is the most
precious thing we have.”
Albert Einstein
First of all, I would like to thank Dr. Cristóvão Lima, my main supervisor, for giving me the
opportunity to do my master’s with him. For his availability, dedication, interest and privilege to
share of his scientific knowledge with me, I am sincerely thankful.
I would like to thanks Dr. Cristina Pereira-Wilson, my co-supervisor, for her support, and
constructive suggestions for the accomplishment of the work presented in this thesis.
To Cristina Carvalho, Dalila, Cristina Xavier, Carla, Alice, Ana, Vera and Carolina, for the
conversations and great working environment in lab. Thank you for accepting me so well.
To all my friends and my university colleagues. Thank you for the good moments, for your
sincerity and friendship.
To my family, a very special thanks for their care and support. To my parents for giving me the
chance to get where I am, and for believing in me.
Thank you all!

iv

v
Oleanolic acid but not ursolic acid induces Oleanolic acid but not ursolic acid induces Oleanolic acid but not ursolic acid induces Oleanolic acid but not ursolic acid induces cell death in HepG2 cells under starvationcell death in HepG2 cells under starvationcell death in HepG2 cells under starvationcell death in HepG2 cells under starvation----induced induced induced induced
autophagyautophagyautophagyautophagy
AbstractAbstractAbstractAbstract
Cancer incidence is increasing worldwide mainly due to changes in diet, life style and increased
lifespan. In particular, liver cancer is the fifth most common cancer in the world and the third most
common cause of cancer mortality. Plant phytochemicals are a good and promising source of anticancer
compounds. In a previous study, we reported the potential of ursolic acid (UA) to induce cell death and to
inhibit proliferation in colorectal cancer cells. This natural triterpenoid, UA, was also shown to activate JNK
and to modulate molecular markers of autophagy. In the present study, the ability of two isomer
triterpenoids, UA and oleanolic acid (OA), to induce cell death and modulate autophagy in the human
hepatocellular carcinoma cell line (HepG2 cells) was tested. For that, the effect of these phytochemicals
on cell death was evaluated by MTT assay and propidium iodide staining, in complete and starvation
medium. Autophagy markers were evaluated by western blot and fluorescence microscopy. Contrary to
our previous data with other cell lines, HepG2 cells were less susceptible to UA and, unexpectedly, OA
was a more potent inducer of cell death than UA. Interestingly, starvation-induced autophagy sensitized
HepG2 cells to cell death caused by OA, but not by UA. The IC50 of OA decreased from about 50 µM in
complete medium to 3.5 µM in starvation medium. Although UA and OA increased the levels of
autophagy markers LC3 and p62, as well as the number of acidic vacuoles (as assessed by MDC
staining), the cell death induced by OA was not prevented by inhibitors of autophagy and of lysosome
proteases. Overall, the results seem to indicate that autophagy is not directly involved in cell death
induced by OA. Interestingly, methyl-β-cyclodextrin (a polymer able to decrease membrane cholesterol
content) prevented OA-induced cell death, which indicates that disruption of cholesterol homeostasis, and
in particular in lipid rafts, may be involved in OA effects under starvation conditions. The present results
suggest the application of OA as a specific drug for cancer treatment in particular cell physiological
conditions, such as under metabolic stress.

vi

vii
Potencial efeito anticancerígeno do ácido oleanólico e do ácido ursólico em céluPotencial efeito anticancerígeno do ácido oleanólico e do ácido ursólico em céluPotencial efeito anticancerígeno do ácido oleanólico e do ácido ursólico em céluPotencial efeito anticancerígeno do ácido oleanólico e do ácido ursólico em células HepG2 slas HepG2 slas HepG2 slas HepG2 sob ob ob ob
indução de autofagia indução de autofagia indução de autofagia indução de autofagia por privação de nutrientespor privação de nutrientespor privação de nutrientespor privação de nutrientes
ResumoResumoResumoResumo
A incidência do cancro está a aumentar em todo o mundo principalmente devido a alterações da
alimentação, do estilo de vida e do aumento da esperança média de vida. Em particular, o cancro do
fígado é o quinto cancro mais comum no mundo e a terceira maior causa de morte por cancro. Os
fitoquímicos são uma excelente e promissora fonte de compostos anticancerígenos. Num estudo anterior
o nosso grupo descreveu o potencial do ácido ursólico (AU) na indução de morte e na inibição da
proliferação de células do cancro coloretal. Este triterpenóide de origem natural foi também descrito
como ativador da sinalização JNK e modulador de marcadores moleculares de autofagia. No presente
trabalho foi testada a capacidade de dois isómeros triterpenóides, o AU e o ácido oleanólico (AO), em
induzir morte celular e modular a autofagia numa linha celular do carcinoma hepatocelular humano
(células HepG2). Para tal, o efeito destes fitoquímicos na morte celular foi avaliado pelo ensaio de MTT e
pela marcação com o iodeto de propídio, tanto em meio completo como em meio com privação de
nutrientes. Os marcadores de autofagia foram avaliados por western blot e também por microscopia de
fluorescência. Contrariamente a resultados anteriores com outras linhas celulares, as células HepG2
foram menos suscetíveis ao AU, bem como o AO mostrou ser mais potente na indução de morte celular
do que o AU. Além disso, a autofagia induzida pela privação de nutrientes suscetibilizou marcadamente
as células HepG2 para a morte celular causada pelo AO, e tal já não se verificou com o AU. Nestas
condições o IC50 do AO foi de 3,5 µM, enquanto em meio completo era de cerca de 50 µM. Embora, o
AU e o AO aumentem os níveis dos marcadores autofágicos LC3 e p62, bem como o número de vacúolos
acídicos (avaliado pela marcação com MDC), a morte celular induzida pelo AO não foi prevenida por
inibidores de autofagia e nem por inibidores de proteases lisossomais. Em geral, os resultados parecerem
indicar que a autofagia não está diretamente envolvida na morte celular induzida pelo AO. No entanto, um
polímero capaz de diminuir o conteúdo de colesterol nas membranas celulares, a metil-β-ciclodextrina,
preveniu a morte celular induzida pelo AO. Este resultado indica-nos que o AO pode induzir uma alteração
na homeostasia do colesterol, em particular em domínios lipídicos ricos em colesterol, com efeitos
drásticos sob a viabilidade das células quando estas estão sob privação de nutrientes. Estes resultados
sugerem-nos que o AO pode ser utilizado no tratamento do cancro em condições fisiológicas específicas,
tal como sob stress metabólico.

viii

ix
IndexIndexIndexIndex
Acknowledgements ................................................................................................................................. iii
Abstract.................................................................................................................................................. v
Resumo................................................................................................................................................. vii
Abbreviations .......................................................................................................................................... xi
List of Figures ........................................................................................................................................ xv
Introduction ........................................................................................................................................ 1
1. Cancer ....................................................................................................................................... 3
1.1. Liver cancer ............................................................................................................................ 4
1.1.1. Hepatocellular carcinoma .............................................................................................. 4
1.1.2. Signaling pathways associated with hepatocellular carcinoma ......................................... 5
2. The PI3K/AKT/mTOR pathway................................................................................................... 6
3. Autophagy.................................................................................................................................. 7
3.1. The process of autophagy ....................................................................................................... 8
3.2. Regulation of autophagy ........................................................................................................ 10
3.2.1. Amino acid signaling ........................................................................................................ 11
3.2.2. Insulin/Insulin-like Growth Factor signaling ....................................................................... 12
3.2.2.1. PI3K .......................................................................................................................... 12
3.2.2.2. AKT ........................................................................................................................... 13
3.2.2.3. mTOR ........................................................................................................................ 13
3.2.2.4. Feedback mechanism that regulates autophagy .......................................................... 14
3.2.3. Energy-dependent AMPK signaling ................................................................................... 16
4. Autophagy and lipids ................................................................................................................ 16
5. Cancer therapy and pharmacological autophagy modulation ..................................................... 19
6. Natural compounds and cancer ................................................................................................ 21
6.1. Triterpenoids ......................................................................................................................... 21
6.1.1. Ursolic acid ................................................................................................................. 22
6.1.2. Oleanolic acid .............................................................................................................. 23
7. Triterpenoids and cholesterol ................................................................................................... 24
Objectives of the work ..................................................................................................................... 27
Material and Methods ..................................................................................................................... 29
1. Chemicals and antibodies ........................................................................................................ 31
2. Cell culture .............................................................................................................................. 31

x
3. MTT reduction assay ................................................................................................................ 32
4. Cell death analysis by PI staining.............................................................................................. 32
5. Western blotting ....................................................................................................................... 33
6. Immunofluorescence analysis .................................................................................................. 33
7. Measurement of reactive oxygen species .................................................................................. 34
8. Statistical analysis .................................................................................................................... 34
Results and Discussion .................................................................................................................... 35
1. Effects of UA and OA in molecular markers of autophagy .......................................................... 37
2. Effect of UA and OA in HepG2 cell viability ................................................................................ 38
3. OA and UA induce accumulation of acidic vacuoles .................................................................. 44
4. Autophagy inhibitors do not protect cells from death induced by OA .......................................... 47
5. Methyl-β-cyclodextrin protects against OA-induced cell death ..................................................... 50
Final Remarks and Future Perspectives ....................................................................................... 55
1. Final remarks and conclusions ................................................................................................. 57
2. Future perspectives .................................................................................................................. 58
3. Funding and acknowledgements .............................................................................................. 59
References ........................................................................................................................................ 61
Supplementary Material .................................................................................................................... i

xi
AbbreviationsAbbreviationsAbbreviationsAbbreviations
AKTAKTAKTAKT Protein kinase B (PKB)
AMPAMPAMPAMP Adenosine monophosphate
AMPKAMPKAMPKAMPK AMP-activated kinase
ATFATFATFATF----2 2 2 2 Activating transcription factor 2
ATPATPATPATP Adenosine triphosphate
BCLBCLBCLBCL----2222 B-cell lymphoma protein-2
BECLIN 1BECLIN 1BECLIN 1BECLIN 1 The human ortholog of murine Atg6
Bnip3Bnip3Bnip3Bnip3 BCL-2/adenovirus E1B 19 kDa protein – interacting protein 3
BRAC2BRAC2BRAC2BRAC2 Breast cancer 2
CMACMACMACMA Chaperone-mediated autophagy
CREBCREBCREBCREB----1111 cAMP-response element-binding
DLCDLCDLCDLC----1111 Deleted in liver cancer 1
DNADNADNADNA Deoxyribonucleic acid
EGFREGFREGFREGFR Epidermal growth factor receptor
eIF4EeIF4EeIF4EeIF4E Eukaryotic initiation factor 4E
ERKERKERKERK Extracellular regulated kinase
FIP200FIP200FIP200FIP200 FAK family – interacting protein of 200 kDa
FOXO3FOXO3FOXO3FOXO3 Forkhead box O3
GPCRSGPCRSGPCRSGPCRS G-protein-coupled receptors
GSKGSKGSKGSK----3333 Glycogen synthase kinase 3
HBVHBVHBVHBV Hepatitis B virus
HCCHCCHCCHCC Hepatocellular carcinoma
HCVHCVHCVHCV Hepatitis C virus
hVps34hVps34hVps34hVps34 Human vacuolar protein sorting
ICAMICAMICAMICAM----1111 Intercellular adhesion molecule 1
IGFIGFIGFIGF Insulin – like growth factor
IGFIGFIGFIGF----IRIRIRIR Insulin-like growth factor-1 receptor
ILILILIL----1111β Interleukin-1 beta
ILILILIL----6666 Interleukin-6
IRIRIRIR Insulin receptor
IRSIRSIRSIRS Insulin receptor substrate
JakJakJakJak Janus kinase
JNKJNKJNKJNK c-Jun N-terminal kinase
LAMPLAMPLAMPLAMP----2222 Lysosomal-associated membrane proteins 2
LC3LC3LC3LC3 Microtubule-associated protein light chain 3
LDLDLDLD Lipid droplets
MDCMDCMDCMDC Monodansylcadaverine
MMMMβCDCDCDCD Methyl-β-cyclodextrin
MEKMEKMEKMEK Mitogen-activated protein extracellular kinase
xii
mLST8mLST8mLST8mLST8 Mammalian LST8
MMPMMPMMPMMP matrix metalloproteinase
mTORmTORmTORmTOR Mammalian target of rapamycin
mTORC1mTORC1mTORC1mTORC1 mTOR complex 1
mTORC2mTORC2mTORC2mTORC2 mTOR complex 2
NFNFNFNF----KBKBKBKB Nuclear transcription factor kappa B
OAOAOAOA Oleanolic acid
PDK1PDK1PDK1PDK1 3’ phosphoinositide-depedent kinase 1
PepAPepAPepAPepA Pepstatin A
PHPHPHPH Pleckstrin homology
PIPIPIPI Phosphatidylinositol
PI3KPI3KPI3KPI3K Phosphatidylinositide 3-kinase
PI3PPI3PPI3PPI3P Phosphatidylinositol 3-phosphate
PIK3CAPIK3CAPIK3CAPIK3CA Phosphoinositide-3-kinase catalytic alpha polypeptid
PIPPIPPIPPIP3333 Phosphatidylinositol (3,-4,-5)-triphosphate
PKCPKCPKCPKC Protein kinase C
PPARPPARPPARPPAR----α Peroxisome proliferator-activated receptor
PRAS40PRAS40PRAS40PRAS40 Proline-rich Akt substrate of 40 kDa
PTENPTENPTENPTEN Phosphatase and tensin homolog
RAFRAFRAFRAF Rat sarcoma-activated factor
RAPTORRAPTORRAPTORRAPTOR Regulatory associated protein of mTOR
RASRASRASRAS Rat sarcoma
RbRbRbRb Retinoblastoma protein
RhebRhebRhebRheb Ras homolog enriched in Brain
RICTORRICTORRICTORRICTOR Rapamycin-insensitive companion of mTOR
RNARNARNARNA Ribonucleic acid
ROSROSROSROS Reactive oxygen species
RTKRTKRTKRTK Receptor tyrosine kinases
S6K1S6K1S6K1S6K1 Ribosomal protein S6 kinase 1
Sin1Sin1Sin1Sin1 SAPK-interacting protein 1
SLC1A5SLC1A5SLC1A5SLC1A5 Solute carrier family 1 member 5
SLC7A5SLC7A5SLC7A5SLC7A5 Solute carrier family 7 member 5
SMAD2SMAD2SMAD2SMAD2 SMAD family member 2
SMAD4SMAD4SMAD4SMAD4 SMAD family member 2
SNARESNARESNARESNARE Soluble NSF attachment receptor
SOCSSOCSSOCSSOCS----1111 Suppressor of cytokine signaling 1
StatStatStatStat Signal transducers and activators of transcription
TGTGTGTG Triglycerides
TTTTMRMMRMMRMMRM Tetramethylrhodamine methyl ester
TNFTNFTNFTNF----α Tumor necrosis factor-α
TP53TP53TP53TP53 Tumor protein p53
TP73TP73TP73TP73 Tumor protein p73
TSC2TSC2TSC2TSC2 Tuberous sclerosis complex 2

xiii
UAUAUAUA Ursolic acid
ULKULKULKULK UNC51-like kinase
UVARUVARUVARUVAR Ultraviolet A radiation
XIAPXIAPXIAPXIAP X-linked inhibitor of apoptosis protein
3333----MAMAMAMA 3-methyladenine
4E4E4E4E----BP1BP1BP1BP1 4E binding protein-1
5’ Top5’ Top5’ Top5’ Top 5’ Terminal oligopyrimidine tract

xiv

xv
List of FigureList of FigureList of FigureList of Figuressss
FIGURE 1. Representation of chronological sequence of cellular lesions promoted by hepatitis B virus
(HBV), hepatitis C virus (HCV) and aflatoxin B1 (AFB1), culminating in the development of
hepatocellular carcinoma in humans. ............................................................................................. 5
FIGURE 2. Schematic representation of pathways involved in development of HCC that modulate
apoptosis, cell division, cell survival, and angiogenesis. .................................................................. 6
FIGURE 3. Schematic illustration of the autophagic process. ................................................................. 10
FIGURE 4. Schematic representation of mTOR-dependent main pathways regulating autophagy. . .......... 15
FIGURE 5. Macroautophagy contributes to the delivery of proteins, lipid stores, and glycogen for
breakdown into lysosomes. . ........................................................................................................ 18
FIGURE 6. Schematic representation of PI3K/AKT/mTOR pathway with targets of the pharmacological
inhibitors with modulatory effects in autophagy. ........................................................................... 20
FIGURE 7. Structure of ursolic acid, oleanolic acid and cholesterol. ...................................................... 24
FIGURE 8. Modulation of autophagic markers by triterpenoids and starvation in HepG2 cells. ............... 37
FIGURE 9. Effect of ursolic acid (UA), oleanolic acid (OA) and rapamycin (Rap) in the viability of HepG2
cells. ........................................................................................................................................... 39
FIGURE 10. Effect of Rap (A) and UA (B) in the viability of HepG2 cells, as assessed by MTT reduction
assay. ......................................................................................................................................... 41
FIGURE 11. Effect of oleanolic acid (OA) on the viability of HepG2 cells in complete (A) and starvation (B &
C) medium, as assessed by MTT reduction assay. ....................................................................... 42
FIGURE 12. Effect of oleanolic acid (OA) on cell death in HepG2 cells under starvation, as assessed by the
PI staining assay. ........................................................................................................................ 43
FIGURE 13. Effect of oleanolic acid (OA) and ursolic acid (UA) in the appearance of cellular acidic
vacuoles, as assessed by MDC-staining. ...................................................................................... 45
FIGURE 14. Effect of oleanolic acid (OA) in the accumulation of acidic vacuoles in HepG2 cells under
starvation medium, as assessed by MDC-staining. ....................................................................... 46
FIGURE 15. Effect of autophagy inhibitors in the cell death induced by rapamycin (Rap) and oleanolic acid
(OA) in HepG2 cells, as assessed by MTT assay. ......................................................................... 48
FIGURE 16. Effect of methyl-β-cyclodextrin (MβCD) on oleanolic acid (OA)-induced cell death of HepG2
cells under starvation conditions. ................................................................................................. 51

xvi

IntroductionIntroductionIntroductionIntroduction

2

Introduction
3
1.1.1.1. CancerCancerCancerCancer
Cancer is currently a major health issue due to its high incidence being responsible for
13% of all deaths worldwide annually. Overall, cancer is characterized by alterations in cell
proliferation, differentiation and development due to accumulation of genetic mutations [Knowles
and Selby, 2005]. Carcinogenesis is the process by which these changes occur and can be
divided into three distinct phases: initiation, promotion and progression [Hennings et al., 1993].
During the initiation phase, irreversible mutations occur in DNA that confer cells the ability to
grow faster and to avoid normal cellular growth control mechanisms. During the promotion
phase, there is an increase in the proliferation ability of initiated cells. This stage is associated
with accumulation of further mutations and the consequent formation of a mass of abnormal
cells. The capacity of cancer cells to invade surrounding tissues and to metastasize is acquired
through the progression phase [Abraham, 2003; Thyparambil et al., 2010]. Genes that are
usually expressed inappropriately or mutated, such as oncogenes and tumor suppressor genes
contribute to the development of cancer. Oncogenes act in a dominant way at the cellular level to
drive proliferation or to prevent normal differentiation; in fact, impaired regulation of cell cycle is a
basis for tumor formation [Knowles and Selby, 2005; Kopnin, 2000]. For example, mutational
activation of RAS oncogene can decrease functions of checkpoints at G1 and G2 leading to
genetic instability and consequently tumor progression [Kopnin, 2000]. Cancer development also
occur due to inactivation/dysfunction of tumor suppressors genes, such as TP53 (tumor protein
p53) gene that is typically mutated in most human tumors, resulting in dysfunctions of the cell
cycle checkpoints and simultaneously inhibition of apoptosis [Levine, 1997; Orr-Weaver and
Weinberg, 1998]. In addition to inactivating mutations in genes that provide negative regulation
signals, such as TP53, mutation in genes of DNA repair systems can also lead to the
development of certain tumors, since they are important to avoid mutations in other genes
[Knowles and Selby, 2005].

Introduction
4
1.1. Liver cancer
Cancer of the liver is the sixth most common cancer in the world and can have different
etiologies. Risk factors that are associated directly or indirectly with different diseases of the liver,
include infection with hepatitis B and C virus (HBV and HCV, respectively), contamination of food
with aflatoxins, heavy alcohol consumption, tobacco smoking, obesity, diabetes, iron overload,
infestation with the liver flukes, exposure to vinyl chloride, as also children affected with
Beckwith-Wiedemann syndrome [Boffetta and Hashibe, 2006; Chuang et al., 2009; El-Serag and
Rudolph, 2007]. Less common types of hepatic cancer include: (i) hepatoblastoma that
represents 1% of malignances of children younger than 20 years old; (ii) cholangiocarcinoma that
is relative to the cancer of the intrahepatic biliary ducts; and, (iii) angiosarcoma - a liver
mesenchymal tumor that usually occurs in elderly men [Chuang et al., 2009]. The most common
form of liver cancer is the hepatocellular carcinoma (HCC), which has a high incidence worldwide
and cause a high number of deaths.
1.1.1. Hepatocellular carcinoma
Hepatocellular carcinoma is the most common cause of cancer mortality. The incidence
of HCC varies widely, with high rates in sub-Saharan Africa, eastern and southeastern Asia, and
Melanesia, and with a low incidence in Northern and Western Europe and the Americas [Parkin
et al., 2005]. Approximately 90-95% of HCC are caused by persistent HBV and HCV infections
(chronic hepatitis) and cirrhosis, particularly with dysplastic hepatocytes [Grisham, 2001; Motola-
Kuba et al., 2006; Seki et al., 2000; Takayama et al., 1990]. These tissue lesions are
precancerous histological changes that normally precede HCC and allow identifying the temporal
order with which genomic alterations develop during hepatocarcinogenesis (Figure 1)
[Thorgeirsson and Grisham, 2002]. In western countries the HCC is caused mainly due to
alcoholic cirrhosis [Chiesa et al., 2000].
The hepatocarcinogenesis is the result of a multistep process characterized by the
accumulation of genetic alterations in hepatocytes, the major cell type in the liver [Motola-Kuba et
al., 2006]. When compared with other cancers, such as colon and breast cancers, HCC has not

so predominant genetic mutations
important role in hepatocarcinogenesis,
[Ozturk, 1999]. This gene
overexpression of oncogenes and underexpression
Ng, 2008]. Genetic alteration
protein from degradation and
upregulation of target genes, including the proto
1999; Thyparambil et al., 2010
HCC include mutations in
in liver cancer 1), PTEN (phosphatase and tensin homolog)
SMAD2 (SMAD family member 2)
2) and SOCS-1 (suppressor of cytokine signaling 1)
al., 2006].
1.1.2. Signaling pathways associated with hepatocellular carcinoma
Many signaling pathways are
process, being the most common
result in increased proliferation, invasion, metastasis
Figure 1. Representation of chronological sequence of cellular lesions promoted by hepatitis B virus (HBV), hepatitis C virus
(HCV) and aflatoxin B1 (AFB1), culminating in the development of hepatocellular carcinoma in human
Grisham, 2002]).
genetic mutations [Wong and Ng, 2008]. Mutations in
important role in hepatocarcinogenesis, and are associated with about
gene mutation leads to a reduction of apoptosis and
overexpression of oncogenes and underexpression of other tumor suppressor genes
alterations in β-catenin gene, which is involved in Wnt signaling, protect
protein from degradation and, therefore, increase its nuclear accumulation.
upregulation of target genes, including the proto-oncogene c-myc and cyclin D1
, 2010]. Other genetic alterations associated with the development of
in TP73 (tumor protein p73), Rb (retinoblastoma protein)
PTEN (phosphatase and tensin homolog), IGF-2 (insulin
SMAD2 (SMAD family member 2) and SMAD4 (SMAD family member 4), BRAC2 (breast cancer
suppressor of cytokine signaling 1) genes [Fujimori et al., 1991
Signaling pathways associated with hepatocellular carcinoma
pathways are deregulated in HCC and associated with
being the most common activated through receptor tyrosine kinases, RTK
proliferation, invasion, metastasis and survival of tumor cells
chronological sequence of cellular lesions promoted by hepatitis B virus (HBV), hepatitis C virus
(HCV) and aflatoxin B1 (AFB1), culminating in the development of hepatocellular carcinoma in human
Introduction
5
Mutations in TP53 gene, have an
iated with about 30% of HCC cases
a reduction of apoptosis and coincides with
r suppressor genes [Wong and
gene, which is involved in Wnt signaling, protects the
nuclear accumulation. This leads to the
cyclin D1 [Shtutman et al.,
Other genetic alterations associated with the development of
(retinoblastoma protein), DLC-1 (deleted
insulin-like growth factor 2),
BRAC2 (breast cancer
, 1991; Motola-Kuba et
Signaling pathways associated with hepatocellular carcinoma
associated with the carcinogenesis
inases, RTKs, which will
survival of tumor cells (Figure 2)
chronological sequence of cellular lesions promoted by hepatitis B virus (HBV), hepatitis C virus
(HCV) and aflatoxin B1 (AFB1), culminating in the development of hepatocellular carcinoma in humans (from [Thorgeirsson and

Introduction
6
[Huynh, 2010]. These include the rat sarcoma/rat sarcoma-activated factor/mitogen-activated
protein extracellular kinase/extracellular regulated kinase (RAS/RAF/MEK/ERK) pathway, the
phosphatidylinositide 3-kinase/protein kinase B/mammalian target of rapamycin
(PI3K/AKT/mTOR) pathway, as well as the janus kinase/signal transducers and activators of
transcription (Jak/Stat) and the Wnt/β-catenin signaling pathways (Figure 2) [Avila et al., 2006;
Huynh, 2010]. In this thesis, only the PI3K/AKT/mTOR pathway was object of study.
Figure 2. Schematic representation of pathways involved in development of HCC that modulate apoptosis, cell division, cell
survival, and angiogenesis. Included are the rat sarcoma/rat sarcoma-activated factor/mitogen activated protein
kinase/extracellular regulated kinase (Ras/Raf/MAP/ERK) pathway, the phosphatidylinositide 3-kinase/protein kinase
B/mammalian target of rapamycin (PI3K/AKT/mTOR) pathway and Wnt/β-catenin pathway (modified from [Carr and Kralian,
2010]).
2.2.2.2. The PI3K/AKT/mTOR pathwayThe PI3K/AKT/mTOR pathwayThe PI3K/AKT/mTOR pathwayThe PI3K/AKT/mTOR pathway
The PI3K/AKT/mTOR is one of major signaling pathways associated with and
constitutively activated in many types of cancer including HCC [Llovet and Bruix, 2008]. PI3K is
activated by RTKs, such as insulin-like growth factor-1 receptor (IGF-IR) and epidermal growth

Introduction
7
factor receptor (EGFR), the oncogene RAS, integrins that are molecules of cell adhesion, and G-
protein-coupled receptors (GPCRS); and is negatively regulated by the PTEN tumor suppressor
gene [LoPiccolo et al., 2008; Wang et al., 2011b]. In tumor cells, the mechanisms for this
pathway activation include mutations in the p110 catalytic domain of phosphoinositide-3 kinase
(PIK3CA) gene, amplification or mutation of AKT, and loss of function of PTEN by
underexpression or epigenetic silencing [Hu et al., 2003; LoPiccolo et al., 2008; Wang et al.,
2007; Wang et al., 2011b]. The serine/threonine kinase AKT occurs in three isoforms, AKT1,
AKT2, AKT3, being expressed distinctively depending of the tissues, and in particular to HCC cell
mass there is the expression of AKT2 but not of AKT1 [Xu et al., 2004; Zinda et al., 2001].
mTOR is a major mediator of this signaling pathway and is a downstream substrate of AKT,
which can phosphorylate directly mTOR or indirectly by phosphorilation and inactivation of
tuberous sclerosis complex 2 (TSC2) [LoPiccolo et al., 2008; Wang et al., 2011b]. mTOR is
presented in two forms, mTOR complex 1 (mTORC1) and mTOR complex 2 (mTORC2): the first
is implicated on control protein translation and autophagy, and promotes the expression of c-
myc, cyclin D and other genes involved in cell proliferation, growth and angiogenesis; in turn
mTORC2 is responsible for the activation of AKT by phosphorylation at serine 473, promoting cell
survival (Figure 4) [Carr and Kralian, 2010; Sahin et al., 2004; Sarbassov et al., 2005b]. The
involvement of PI3K/AKT/mTOR pathway in the autophagy process is of special interest in this
work and, therefore, it will be detailed as follow.
3.3.3.3. AutophagyAutophagyAutophagyAutophagy
Autophagy is a cellular dynamic process of “self-eating” that was first described by de
Duve and Wattiaux [De Duve and Wattiaux, 1966]. There are three primary forms of autophagy:
macroautophagy, microautophagy and chaperone-mediated autophagy (CMA), differing from
each other on their physiological functions [Rautou et al., 2010]. Macroautophagy is the most
prevalent and commonly referred to as autophagy (term hereafter used to refer to
macroautophagy), and is characterized as a non-selective vacuolar degradative cellular process
by which intracellular membrane structures sequester proteins and organelles to degrade and
turn over these materials [Meijer and Codogno, 2004]. When cells are exposed to different

Introduction
8
situations of stress, such as nutrient starvation, oxidative stress, and hormonal signaling,
autophagy takes place and can result in adaptation and survival, or cell death [Kondo et al.,
2005; Meijer and Codogno, 2004]. Extracellular pathogens are also eliminated in this pathway as
part of a cellular defense mechanism [Eskelinen and Saftig, 2009; Todde et al., 2009]. The
capacity for degradation is an important autophagic function but if unregulated it can be lethal.
Basal levels of autophagy are important for maintaining normal cellular homeostasis and to
generate energy and building blocks for reuse in order to cells survive under nutrient starvation
[Kroemer et al., 2010]. However, excessive autophagy may lead to autophagic cellular death, the
also called type II programmed cell death [Galluzzi et al., 2009].
In cancer cells, autophagy is suppressed during the early stages of tumorigenesis,
because there is a need of higher level of protein synthesis than protein degradation to promote
tumor growth [Cuervo, 2004]. In addition, with inhibition of autophagy there is less removal of
damaged organelles, which allows accumulation of genotoxic free radicals contributing for cancer
promoting stages [Edinger and Thompson, 2003]. Although autophagy is generally decreased in
cancer cells compared with normal ones, in later stages of tumorigenesis stimulation of
autophagy is observed in cancer cells that are located in the central areas of the tumor, where
there is poor vascularization allowing them to survive under conditions of nutrient starvation and
low oxygen conditions [Cuervo, 2004]. In addition, induction of autophagy was also observed in
response to anticancer drugs, and therefore, autophagy is currently viewed as a good target for
cancer therapy [Bursch et al., 2000; Inbal et al., 2002; Paglin et al., 2001].
3.1. The process of autophagy
Autophagy is an evolutionarily conserved lysosomal degradation pathway that occurs in
all eukaryotic cells, from yeast to mammals [Klionsky and Emr, 2000; Meijer and Codogno,
2004]. The autophagic process begins with the sequestration of cytoplasmatic constituents,
including organelles, by a double-membrane-bound structure known as phagophore or isolation
membrane [Mizushima, 2007; Stromhaug et al., 1998]. The elongation and complete closure of
the phagophore, results in the formation of the autophagosome, which after maturation fuse with
lysosome to form the autolysosome. Then, the sequestered content together with the inner

Introduction
9
autophagosomal membrane are degraded by acidic lysosomal hydrolases for recycling (Figure 3)
[Mizushima, 2007; Shintani and Klionsky, 2004].
Several Atg (autophagy-related) proteins are necessary to the execution of autophagy and
have been first characterized in yeast, and many of these have mammalian orthologs [Yang et
al., 2005]. Together with other autophagy proteins, the class III PI3K, also named human
vacuolar protein sorting (hVps34) is involved in initial formation of the phagophore membrane, as
well as in the sequestration of all contents that will be degraded [Liang et al., 1999; Petiot et al.,
2000; Sun et al., 2008]. The first evidence of implication of this enzyme in the autophagic
process was due to discovery of 3-methyladenine (3-MA) that is able to block the formation of
autophagosomes by inhibition of class III PI3K (Figure 3) [Blommaart et al., 1997b; Furuya et al.,
2005; Petiot et al., 2000; Zeng et al., 2006]. BECLIN 1 was the first tumor suppressor gene
related with autophagy to be reported, and its interaction with class III PI3K is necessary for
autophagy. BECLIN 1, can be inhibited by the interaction with the antiapoptotic protein BCL-2
[Sinha and Levine, 2008; Yang et al., 2005]. In other words, dissociation of BECLIN 1 from BCL-
2 is necessary to occur induction of autophagy and, consequently, there is a relationship between
the induction of autophagy and increased expression of BECLIN 1 [Liang et al., 1999; Nice et al.,
2002]. Microtubule-associated protein light chain 3 (LC3), a mammalian homolog of yeast Atg8,
is a major constituent of the autophagosomes and also important for their formation [Mizushima
et al., 2004]. LC3 is synthesized as a pro-protein that is cleaved at the glycine residue, forming
the cytosolic LC3-I [Farkas et al., 2009]. The C-terminal glycine of LC3-I when coupled to
phosphatidylethanolamine through an ubiquitin-like conjugation reaction result in the formation of
LC3-II [Ichimura et al., 2000; Kabeya et al., 2004]. LC3-II is important for the elongation and
closure of the phagophore and remains associated with the inner and outer membrane of the
autophagosome (Figure 3) [Nakatogawa et al., 2007]. After fusion with the lysosome, the LC3-II
content in the autolysosome decreases either by cleavage (outer) or by degradation by lysosomal
enzymes (inner membrane-associated) [Kabeya et al., 2000; Mizushima et al., 2010].
Consequently, LC3-II is considered as a good autophagy marker [Kouri et al., 2002]. p62
protein/sequestome 1 (p62/SQSTM1) is a ubiquitin-binding protein that binds directly to LC3-II
and is transported into the autophagosome, where it will be degraded on the final phase of the
autophagic process [Ichimura and Komatsu, 2010]. p62 is also used as marker of autophagic
flux, because when occurs a inhibition or induction of autophagy, there is an accumulation or
decline of p62 levels, respectively [Bjorkoy et al., 2009].
Introduction
10
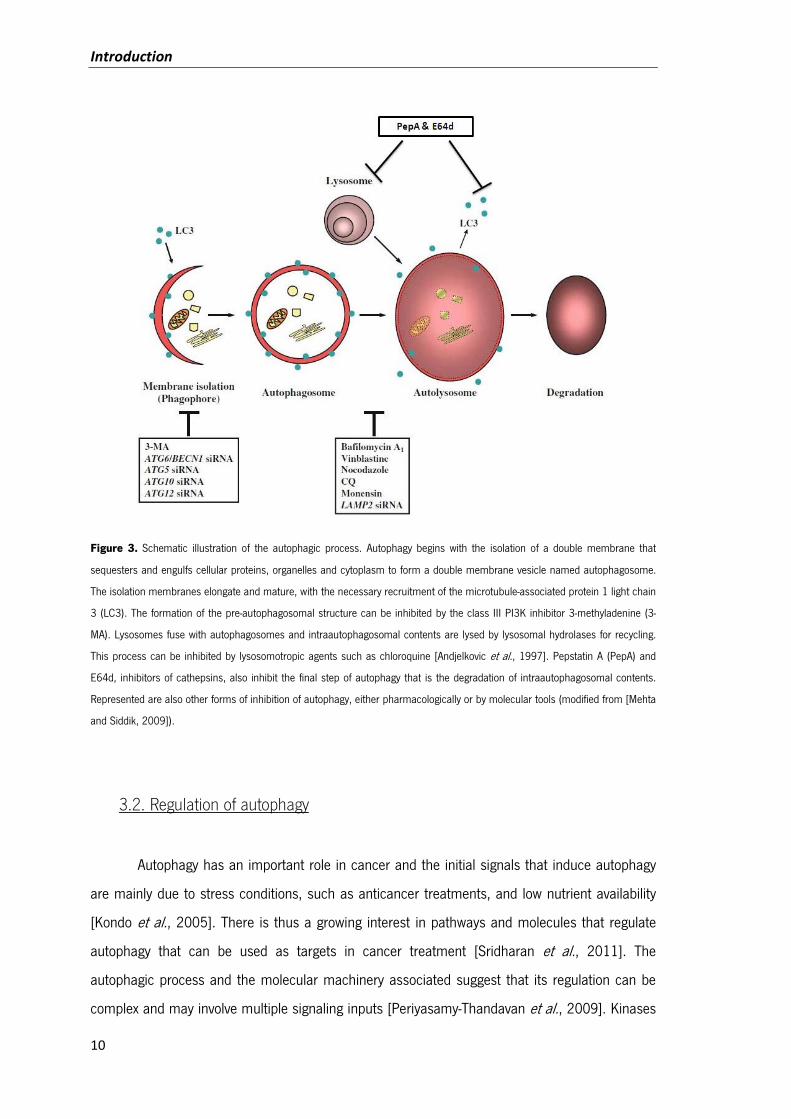
Figure 3. Schematic illustration of the autophagic process. Autophagy begins with the isolation of a double membrane that
sequesters and engulfs cellular proteins, organelles and cytoplasm to form a double membrane vesicle named autophagosome.
The isolation membranes elongate and mature, with the necessary recruitment of the microtubule-associated protein 1 light chain
3 (LC3). The formation of the pre-autophagosomal structure can be inhibited by the class III PI3K inhibitor 3-methyladenine (3-
MA). Lysosomes fuse with autophagosomes and intraautophagosomal contents are lysed by lysosomal hydrolases for recycling.
This process can be inhibited by lysosomotropic agents such as chloroquine [Andjelkovic et al., 1997]. Pepstatin A (PepA) and
E64d, inhibitors of cathepsins, also inhibit the final step of autophagy that is the degradation of intraautophagosomal contents.
Represented are also other forms of inhibition of autophagy, either pharmacologically or by molecular tools (modified from [Mehta
and Siddik, 2009]).
3.2. Regulation of autophagy
Autophagy has an important role in cancer and the initial signals that induce autophagy
are mainly due to stress conditions, such as anticancer treatments, and low nutrient availability
[Kondo et al., 2005]. There is thus a growing interest in pathways and molecules that regulate
autophagy that can be used as targets in cancer treatment [Sridharan et al., 2011]. The
autophagic process and the molecular machinery associated suggest that its regulation can be
complex and may involve multiple signaling inputs [Periyasamy-Thandavan et al., 2009]. Kinases

Introduction
11
such as mTOR, PI3K and AKT play an essential role in induction or inhibition of autophagy
depending on different stimuli, where mTOR occupies an important position because it is the
principal regulator of autophagy [Periyasamy-Thandavan et al., 2009]. Bellow will be described
the most important pathways that regulate autophagy.
3.2.1. Amino acid signaling
The amino acids are the major end products of protein degradation process in autophagy
and promote its regulation by inhibition of this process, maintaining cellular homeostasis [Yang et
al., 2005]. However, not all amino acids are involved in autophagy regulation [Mortimore and
Poso, 1987; Periyasamy-Thandavan et al., 2009; Seglen et al., 1980]. In particular, alanine,
leucine, glutamine and phenylalanine seem to be effective inhibiting autophagy [Bergamini et al.,
1995; Mortimore et al., 1991; Seglen et al., 1980]. These amino acids have their own
recognition sites at the cell surface and promote signal transduction that will act by
phosphorylation of mTORC1 through the Ras-related small GTPases (Rag proteins), suppressing
autophagy [Kadowaki et al., 2006; Kim et al., 2008a; Long et al., 2005]. The stimulation of
autophagy through nutrient starvation (nitrogen starvation) was first demonstrated by Schworer
and Mortimore in 1977 [Chan et al., 2006a]. Recently, it was demonstrated that it is L-glutamine
that is the rate-limiting factor that enables amino acids shortage to inhibit mTORC1 signaling
[Mortimore and Schworer, 1977; Nicklin et al., 2009]. Under conditions of availability of
extracellular amino acids the influx of L-glutamine by its high-affinity transporter SLC1A5 (solute
carrier family 1 member 5) occurs increasing its intracellular concentration (Figure 4) [Ravikumar
et al., 2010]. The heterodimeric SLC7A5 (solute carrier family 7 member 5)/SLC3A2 is a
bidirectional antiporter that uses L-glutamine as an efflux substrate in exchange for the cellular
uptake of essential amino acids that consequently allows activation of mTORC1 through the Rag
GTPases [Nicklin et al., 2009]. The stimulation of autophagy by amino acid starvation reproduces
what happens in advanced stages of cancer, where autophagy may be required to provide
essential nutrients to cells in the inner part of a solid tumor that do not have direct access to the
blood supply [Ogier-Denis and Codogno, 2003].
Introduction
12
3.2.2. Insulin/Insulin-like Growth Factor signaling
The pathways through which hormones regulate autophagy are distinct from those
regulated by nutrients, but both converge in the activation or inhibition of the key regulator of
autophagy - mTOR. The hormone insulin that is secreted by the pancreas in response to high
blood glucose, binds to its receptor (insulin receptor – IR) on the surface of cells and promotes
its autophosphorylation on tyrosine residues. This induces the recruitment and phosphorylation of
IRS1 and IRS2 (insulin receptor substrate 1 and 2) [He and Klionsky, 2009; Neely et al., 1977;
Pfeifer, 1978]. The insulin-like growth factor is mainly secreted in the liver as a result of
stimulation by the growth hormone, and has the same effect on the IR as insulin. High levels of
circulating insulin-like growth factor 1 (IGF1) and certain genetic polymorphisms of IGF1 are
associated with increased risk of several cancers [Tao et al., 2007]. In association with the
phosphorylation of insulin receptors, p85 (a regulatory subunit of class I PI3K) promotes
activation of PI3K (Figure 4) [Yang et al., 2005]. Thereby, activation of PI3K generates
phosphatidylinositol (3,-4,-5)-triphosphate (PIP3) that allows membrane recruitment of AKT and 3’
phosphoinositide-depedent kinase 1 (PDK1) [Alessi et al., 1997; Stokoe et al., 1997]. This last in
turn phosphorylates and activates AKT, leading to activation of mTOR and thus inhibition of
autophagy (Figure 4) [Blommaart et al., 1997a; Klionsky, 2004]. This effect can be reversed by
the tumor suppressor gene PTEN, which reverse PIP3 production and decreases the downstream
AKT signaling, positively regulating autophagy (Figure 4) [Arico et al., 2001].
3.2.2.1. PI3K
The enzymes PI3K catalyze the phosphorylation of the 3’ position hydroxyl group of the
inositol ring in phosphatidylinositol, and have been classified into three classes [Cantley, 2002].
Each class has its own structure, function, substrate specificity and lipid products [Engelman et
al., 2006; Katso et al., 2001]. The classes I PI3K is often activated in response to growth factors
and once activated, the generated PIP3 binds to the pleckstrin homology (PH) domains of PDK-1
and AKT, leading to the translocation of both proteins to the cell membrane where they are
consequently activated (Figure 4) [Adjei and Hidalgo, 2005; LoPiccolo et al., 2008]. About the
class II PI3K little is known of their function but it is thought to play a role in processes such as
cell migration and vascular smooth muscle contraction [Domin et al., 2005; Wang et al., 2006].

Introduction
13
The class III PI3K specifically produces the lipid phosphatidylinositol 3-phosphate (PI3P) and is
involved in the formation of autophagosomes and initiation of autophagy [He and Klionsky, 2009;
Schu et al., 1993; Volinia et al., 1995; Yang et al., 2005]. The sole member of class III PI3K is
hVps34 and was first identified as an important regulator of vesicular trafficking in the
endosomal/lysosomal system [Lindmo and Stenmark, 2006; Odorizzi et al., 2000]. It is
implicated in the recruitment of proteins that have PI3P binding domains to the intracellular
membranes [Backer, 2008; Lindmo and Stenmark, 2006; Odorizzi et al., 2000]. hVps34
interacts with the autophagy-related proteins such as BECLIN 1, UVRAG (UV radiation resistance-
associated gene), Bif-1 (Bax-interacting factor 1) and p150 (Vps15 in yeast), forming a complex
that produces PI3P by phosphorylation of phosphatidylinositol (PI) important for the execution of
autophagy [Furuya et al., 2005; Kihara et al., 2001; Liang et al., 2006; Takahashi et al., 2007].
3.2.2.2. AKT
AKT is a serine/threonine kinase also named protein kinase B (PKB), which is activated
by various signals upstream class I PI3K, resulting in the phosphorylation of multiple downstream
effectors [Nogueira et al., 2008; Vivanco and Sawyers, 2002]. This kinase is present in three
isoforms, AKT1, AKT2 and AKT3, and their activation occur first by phosphorylation at threonine
308 in the catalytic domain by PDK-1 and then requires a subsequent phosphorylation at serine
473, which can be mediated by several kinases such as PDK-1, AKT itself or mTORC2 complex
[Andjelkovic et al., 1997; Balendran et al., 1999; Santos et al., 2001; Toker and Newton, 2000].
Once activated, one of the downstream effectors of AKT is the tumor suppressor proteins
mutated in tuberous sclerosis which form a complex named the tuberous sclerosis complex
(TSC) [Ravikumar et al., 2010]. TSC consists of TSC1 and TSC2, where their phosphorylation is
inhibitory by blocking TSC2 interaction with TSC1. This leads to activation of the GTP-binding
protein Rheb (Ras homolog enriched in Brain), which directly binds and activates the mTORC1
resulting in protein synthesis, cell growth and suppression of autophagy (Figure 4) [Gao et al.,
2002; Mathew et al., 2009; Ravikumar et al., 2010; Teckman and Perlmutter, 2000].
3.2.2.3. mTOR
The serine/threonine kinase mTOR is the master regulator that integrates upstream
pathways that include the response to insulin/growth factor signaling through PI3K/AKT and to
nutrient and energy conditions (see 3.2.1 and 3.2.3), leading to the regulation of autophagy and

Introduction
14
other cellular functions, such as initiation of mRNA translation, cell growth and proliferation, and
transcription [Sarbassov et al., 2005a]. mTOR can exist in two distinct protein complexes, of
which only one is involved directly with autophagy regulation.
Rapamycin-sensitive mTORC1 consists of the mTOR catalytic subunit, RAPTOR
(regulatory associated protein of mTOR) mLST8 (mammalian LST8) and PRAS40 (proline-rich Akt
substrate of 40 kDa) [Guertin and Sabatini, 2009; Yang and Guan, 2007]. When activated,
mTORC1 phosphorylates the ribosomal protein S6 kinase 1 (S6K1 also named p70S6K) to
positively regulate the translation of mRNAs containing 5’ terminal oligopyrimidine tract (5’ Top).
In addition, the eukaryotic initiation factor 4E binding protein-1 (4E-BP1) is also phosphorylated
by mTORC1, which induces its dissociation from the eukaryotic initiation factor 4E (eIF4E),
liberating this factor to bind the 5’ terminal cap structure of RNA promoting the initiation of
translation [Yang et al., 2005]. mTORC1 also phosphorylates and regulates proteins involved in
autophagy (Figure 4). Active mTORC1 interacts with and phosphorylates the UNC51-like kinase
1/2 (ULK1/2) and Atg13, leading to their inhibition, and together with FAK family – interacting
protein of 200 kDa (FIP200) form a ULK1/2-Atg13-FIP200 complex that promote inhibition of
autophagy [Ravikumar et al., 2010]. Under starvation conditions or rapamycin treatment,
mTORC1 is inhibited due to the dissociation of mTOR from the complex. Inactive mTORC1
dissociates from the ULK1/2-Atg13-FIP200 complex resulting in the dephosphorylation of
ULK1/2, activating it, which promotes the ULK1-mediated phosphorylations of Atg13, FIP200,
and ULK1 itself, triggering the autophagy cascade (Figure 4) [Ganley et al., 2009; Hosokawa et
al., 2009; Jung et al., 2009; Ravikumar et al., 2010]. Therefore, the ULK1/2-Atg13-FIP200
complex signals the autophagic machinery downstream of mTORC1.
In contrast, rapamycin-insensitive mTORC2 is composed by mTOR, RICTOR (rapamycin-
insensitive companion of mTOR), mLST8 and Sin1 (SAPK-interacting protein 1), and it is able to
phosphorylate members of the AGC kinase family, such as AKT and protein kinase C (PKC),
promoting cellular survival and actin cytoskeleton organization, respectively [Jacinto et al., 2004;
Sarbassov et al., 2004].
3.2.2.4. Feedback mechanism that regulates autophagy
The role of mTOR in regulation of autophagy can also involve the mTORC2 complex
(Figure 4). Chen et al. have shown that low concentrations of rapamycin induce AKT
phosphorylation by inhibition of mTORC1 but higher concentrations suppress AKT

Introduction
15
phosphorylation through inhibition of mTORC2 [Chen et al., 2010]. The mTORC2 have an
important role in activation of AKT that is implicated in the phosphorylation and inactivation of the
forkhead box O3 (FOXO3) transcriptional factor, which has been reported to stimulate autophagy
by increasing the expression of proteins involved in autophagy, such as LC3 and BCL-
2/adenovirus E1B 19 kDa protein – interacting protein 3 (Bnip3) [Brunet et al., 1999;
Mammucari et al., 2007; Sarbassov et al., 2005b].
Figure 4. Schematic representation of mTOR-dependent main pathways regulating autophagy. The activation of PI3K pathway
trough binding of insulin (or growth factors) to insulin receptor (IR) leads to activation of AKT, and in turn inhibition of TSC-1/2
complex that promotes activation of Rheb and consequently mTORC1. AKT can also be phosphorylated and activated by
mTORC2. Downstream of mTORC1, the ULK1-Atg13-FIP200 complex acts as an integrator of the autophagy signals. Under
nutrient-rich conditions, mTORC1 suppresses autophagy by interacting with this complex and mediating phosphorylation
dependent inhibition of Atg13 and ULK1. Under starvation conditions or rapamycin treatment, mTOR dissociates from the
complex, resulting in dephosphorylation-dependent activation of ULK1 and ULK1-mediated phosphorylations of Atg13, FIP200,
and ULK1 itself, which triggers autophagy. Amino acids activate mTORC1 via Rag GTPases and suppress autophagy, being L-
glutamine the rate limiting factor. The mTORC1 pathway regulates cell growth mainly through 4E-BP1 and p70S6K.
Phosphorylation dependent activation of p70S6K can also inhibit IRS1, thereby exerting a negative feedback loop mechanism
(modified from [Ravikumar et al., 2010]).
Glucose

Introduction
16
Therefore, mTORC2 can negatively regulate autophagy indirectly by AKT through a negative
feedback loop. In addition, autophagy can be also regulated by other feedback loop through
p70S6K [Scott et al., 2004]. Once activated by PI3K/AKT signaling, mTOR/p70S6K
phosphorylates the IRS-1 on serine residues, resulting in its inhibition by targeting it to
degradation. This work as a negative feedback loop that attenuate PI3K/AKT signaling, and
therefore mTOR activity (Figure 4) [Manning and Cantley, 2007; O'Reilly et al., 2006; Ravikumar
et al., 2010].
3.2.3. Energy-dependent AMPK signaling
The autophagic process is ATP-dependent and lower cellular energy levels (for example,
due to glucose starvation or other stress) signals mTORC1 by activating AMPK [Chan et al.,
2006b; Farkas et al., 2011]. AMPK, which senses changes in the intracellular ATP/AMP ratio,
directly phosphorylates TSC2, thereby providing the priming phosphorylation for subsequent
phosphoryalation of TSC2 by glycogen synthase kinase 3 (GSK-3) to inhibit mTOR signaling,
thereby inducing autophagy and inhibiting protein synthesis (Figure 4) [Hoyer-Hansen and
Jaattela, 2007; Inoki et al., 2006].
4.4.4.4. Autophagy and lipidAutophagy and lipidAutophagy and lipidAutophagy and lipidssss
Autophagy is an essential cellular process that mediates the degradation of intracellular
components since they are dysfunctional or to meet cellular energetic demands. Therefore,
during nutrient deprivation not only autophagic degradation of cytosolic proteins and organelles
are in place, but also lipid and glycogen stores are mobilized for energy production (Figure 5)
[Eskelinen and Saftig, 2009; Singh and Cuervo, 2011; Todde et al., 2009]. Lipids are essential to
all organisms as substrates for energy production, as precursors of membrane lipids and as
signaling molecules of several cellular processes. The cells store the lipids as triglycerides in the
form of dynamic organelles called lipid droplets (LD) that, when necessary, are breakdown into
free fatty acids by the process of lipolysis [Martin and Parton, 2006]. Both autophagy and
lipolysis are regulated hormonally by insulin and glucagon and are increased during starvation

Introduction
17
[Mizushima and Klionsky, 2007; Singh et al., 2009a]. Interestingly, it has been established
recently a link between these two catabolic processes, in which part of lipid droplets have been
incorporated into autophagic vesicles of double membrane, that subsequently fuse with
lysosomes, for degradation of their contents (Figure 5) [Singh et al., 2009a]. Genetic or
pharmacology inhibition of autophagy in hepatocytes resulted in increased content of triglycerides
(TG) and LD, supporting the idea that lysosomal degradation of intracellular LD by autophagy is a
constitutive process and that can also contribute to lipid mobilization in vivo [Singh et al., 2009a].
However, other study revealed that autophagy is involved in LD formation, during starvation in
hepatocytes and cardiomyocytes. The lipidated LC3 protein required for autophagosome
formation was shown to be present in isolated LD. In addition, knockout of the essential
autophagy gene Atg7 led to a reduced content of LD during fasting [Shibata et al., 2009]. These
contrasting effects between both studies may be due to the model used: in the first adult mice
were used whereas in the second young mice were used [Rodriguez-Navarro and Cuervo, 2010].
Interestingly, studies in pre-adipocytes in culture also showed that autophagy can regulate
adipogenesis (the differentiation process of pre-adipocytes into mature adipocytes) [Singh et al.,
2009b].
Despite the importance of autophagy to regulate lipid metabolism, many evidences also
support that lipids and lipid modifications modulate autophagy. For example, it has been reported
that exposure of cells to a high lipid load significantly decreases the degradation of proteins
mainly due to reduced autophagy [Koga et al., 2010]. This high lipid load affects the cholesterol
content of membranes reducing it, which can lead to defects in the membrane fusion between
autophagosome and lysosomes, inhibiting therefore autophagy in later steps [Koga et al., 2010].
Conversely, a previous study reports that depletion of cholesterol in fibroblasts induces
autophagy [Cheng et al., 2006]. However, these authors studied autophagy only by measuring
LC3 levels by western blot and immunofluorescence. They observe a significant increase of LC3
that suggest them to be in the presence of increased of autophagic activity. However, it is known
currently that this effect is most probably due to the inhibition of autophagy at later steps
[Mizushima et al., 2010]. Also CMA is known to be affected by cholesterol levels. The receptor of
this autophagic pathway, LAMP-2A, associates in a dynamic manner with lipid microdomains
(enriched in cholesterol and sphingolipids) at the lysosomal membrane. LAMP-2A undergoes
regulated degradation in these regions, and therefore lower cholesterol levels will increase CMA
activity [Rodriguez-Navarro and Cuervo, 2010]. The PI3P lipid molecules are also required and

Introduction
18
essential for autophagy execution, serving as a scaffold for the assembly of autophagosomes,
their trafficking in microtubules, lysosomal fusion and possibly in cargo recognition [Singh and
Cuervo, 2011]. Therefore, modulation of these lipid molecules by the coordination between
kinases and phosphatases are essential for regulating autophagy.
Figure 5. Macroautophagy contributes to the delivery of proteins, lipid stores, and glycogen for breakdown into lysosomes. The
constituent components of these macromolecules exit the lysosome and become available for production of energy. In the case of
protein breakdown, the resulting amino acids may have less energetic value and be preferentially utilized for the synthesis of new
proteins. Levels of amino acids, free fatty acids, and sugars circulating in blood or in the extracellular media have a direct impact
on intracellular marcoautophagy (from [Singh and Cuervo, 2011]).
Introduction
19
5.5.5.5. Cancer therapy and pharmacological autophagy modulationCancer therapy and pharmacological autophagy modulationCancer therapy and pharmacological autophagy modulationCancer therapy and pharmacological autophagy modulation
Autophagy is a process with an important role in cancer development and therapy.
Increased levels of autophagy are commonly observed in tumor cells after cancer therapy, such
as by radiotherapy, with chemotherapeutics (e.g., doxorubicin, temozolomide, camptothecin), by
histone deacetylase inhibitors and with hormonal therapeutics (e.g., tamoxifen) [Roy and
Debnath, 2010]. Considering that increased autophagic activity provide resistance of cancer cells
to anticancer treatment, inhibitors of autophagy have been proposed as good adjuvants for
cancer therapy [Roy and Debnath, 2010]. In established tumors, increased autophagy has been
reported in central parts of the tumor as a strategy for survival in a very stressful and nutrient-
deprived environmental. Autophagy-dependent cell death has also being explored in cancer
treatment, where extensive degradation of cytoplasmic materials beyond a critical point is
believed to drive cell death. Therefore, the signaling pathways that regulate autophagy and also
proliferation and apoptosis, which commonly are altered in cancer, are therefore potential
therapeutic targets (Figure 6) [Kondo et al., 2005].
A range of chemical inhibitors of autophagy, such as 3-MA, chloroquine (CQ), pepstatin A
(PepA) and E64d, LY-294002 and wortmannin, can be used to study the role of autophagy in
tumorigenesis and in response to therapy (Figure 6). However, due to lack of specificity, low
solubility and/or high toxicity of many of these compounds, their clinical application is
compromised of low value. For example, 3-MA inhibits both class I and class III PI3K; the
inhibition of class I PI3K is persistent, whereas its effect on class III PI3K is transient, providing a
temporal different effect and an inhibition of autophagosome formation [Bursch et al., 1996; Wu
et al., 2010]. In addition to 3-MA, other pharmacologic agents such as LY-294002 and
wortmannin target the p110 catalytic subunit of class I PI3K, but also lack specificity like 3-MA,
which compromise also their use in modulating autophagy [LoPiccolo et al., 2008]. Chloroquine,
known as an anti-malarial drug, is an inhibitor of lysosomal acidification, because leads to
disruption the lysosomal pH gradient. Thus, it blocks the terminal stages of autophagic
proteolysis by preventing the fusion of autophagosomes with lysosomes. Currently, CQ is being
tested in clinical trials for cancer treatment through autophagy inhibition [Farkas et al., 2011; Roy
and Debnath, 2010; Yamamoto et al., 1998]. The inhibition of lysosomal function by inhibition of
cathepsins is another form of promoting the blockage of autophagy. To do this experimentally it

Introduction
20
can be used a combination of PepA and E64d, two inhibitors of cathepsins, in which PepA is a
membrane-permeable inhibitor of cathepsins D and E, whereas E64d is a membrane-permeable
inhibitor of cathepsins B, H and L [Kirschke and Wiederanders, 1987; Tamai et al., 1987; Tanida
and Waguri, 2010; Umezawa et al., 1970]. Inhibition of these proteases will promote a blockage
of the final step of autophagy, easing the evaluation of autophagic flux [Kim et al., 2008b].
As discussed above, inhibition of mTOR (and, therefore, induction of autophagy) is also a
strategy to kill cancer cells since they have a higher demand on protein synthesis [Cuervo,
2004]. Frequently, rapamycin is used to inhibit mTOR and exhibits considerable anticancer
activity (Figure 6) [Faivre et al., 2006]. However, therapy mediated by rapamycin shows some
problems, such as the need of a wide dose range to inhibit mTOR under different conditions, as
also the resistance to therapy through mechanism of negative feedback loop [Chen et al., 2010;
Foster and Toschi, 2009].
Figure 6. Schematic representation of PI3K/AKT/mTOR pathway with targets of the pharmacological inhibitors with modulatory
effects in autophagy (from [LoPiccolo et al., 2008]).

Introduction
21
6.6.6.6. Natural compounds and Natural compounds and Natural compounds and Natural compounds and cancercancercancercancer
Throughout of time, natural compounds from plants, marine organisms and
microorganisms have been a rich source of agents that are used in many applications and fields,
including in medicine, due to their structural diversity and bioactive potential [Nobili et al., 2009].
Today, the natural products play a relevant role in cancer therapy and others are in development
with a significant number of compounds in different phases of clinical trial [Cragg et al., 1997;
Gordaliza, 2007]. In fact, a high percentage of pharmaceutical drugs in use are of natural origin
or develop from research in natural compounds, where most of them are used in anticancer
treatment [Cragg et al., 1997; Newman et al., 2000].
Due to the diverse molecular alterations that occur in cancer cells that are associated
with their tumorigenesis, the structural diversity of natural compounds make them good source of
potential anticancer drugs with a specific target of action or multi-targets in key cancer regulators.
In addition, natural compounds are a more attractive option than standard chemotherapy agents,
due to their recognized low-toxicity [West et al., 2002]. Therefore, these chemicals of natural
origin can contribute to decrease resistance of anticancer treatments or to be used as substitutes
of common agents in chemotherapy [Roy and Debnath, 2010].
6.1. Triterpenoids
Plants synthesize a large number of secondary metabolites, including many
phytochemicals, such as phenolic compounds, essential oils, alkaloids and terpenes. Terpenes
are compounds with a cyclic structure and based on the C5 isoprene units [Cowan, 1999].
Triterpenoids are composed from six isoprene units (C30H48), where additional elements,
normally oxygen, are added [Cowan, 1999; Phillips et al., 2006]. Triterpenoids are aglycones,
but when linked to one or more sugar chains are in turn named triterpenoid saponins [Price et
al., 1987].
Throughout of years, triterpenoids were considered to be biologically inactive. But their
low toxicity profile led to their use for medicinal purpose in many countries, primordially in Asia,
and evidences of their pharmacologic activities of triterpenoids have been emerging [Bishayee et

Introduction
22
al., 2011]. The anticancer efficacy of several triterpenoids has been recently reported, where
these compounds exhibit cytotoxicity against a variety of cancer cells without major toxicity in
normal cells [Laszczyk, 2009; Petronelli et al., 2009; Setzer and Setzer, 2003]. In the present
work we used two pentacyclic triterpenoid isomers – ursolic acid (UA) and oleanolic acid (OA).
6.1.1. Ursolic acid
Ursolic acid (3β-hydroxy-urs-12-en-28-oic acid) is a pentacyclic triterpene compound that
exists in plants, medicinal herbs and fruits (Figure 7). UA has shown interesting biological
activities such as anti-inflammatory, anti-hyperlipidemic, antioxidant, anti-angiogenic and
anticancer effects [Banno et al., 2004; De Angel et al., 2010; Ramos et al., 2010; Sohn et al.,
1995]. Thereby, this triterpenoid has been shown to inhibit the growth of tumor cells through cell
cycle arrest and induction of apoptosis in many cancer cell types [Harmand et al., 2003; Tang et
al., 2009]. Related to apoptosis induction, it was reported recently that UA activated caspase -3, -
8, and -9, as well as downregulated the expression of BCL-2 in gastric cancer cells [Wang et al.,
2011a]. It has also been suggested that UA may be involved in modulation of autophagy through
activation of JNK signaling, and in turn exerting anticancer effects in apoptosis-resistant HCT15
colorectal cancer cells [Xavier et al., 2012, submitted]. In HCC, it has been reported that UA
induces apoptosis through activation of caspase 3 and cell cycle arrest via inhibition of DNA
replication and increased p21 expression [Kim et al., 2000]. In other study, it was also observed
that UA decreased the activation of nuclear transcription factor NF-kB and its downstream
effectors BCL-2 and X-linked inhibitor of apoptosis protein (XIAP), the later with ability to inhibit
caspase-3, -7, and -9 [Shyu et al., 2010; Stennicke et al., 2002]. UA was also able decrease the
mitochondrial membrane potential of the HCC cells HuH7 with the consequent release of
cytochrome c from the mitochondria into the cytosol and with activation of caspases [Shyu et al.,
2010; Yan et al., 2010]. In breast cancer cells, UA inhibited migration and invasion of tumor cells
through suppression of AKT/mTOR and NF-kB signaling, with the corresponding decrease of
matrix metalloproteinase (MMP) levels [Yeh et al., 2010]. Anti-angiogenic effects of UA by
decreasing the expression of vascular endothelial growth factor (VEGF), interleukin-8, and
transcription factor HIF-1α was also reported in liver cancer [Lin et al., 2011], while in melanoma
cancer cells UA suppressed VEGF, MMP-2 and MMP-9 [Kanjoormana and Kuttan, 2010].

Introduction
23
6.1.2. Oleanolic acid
Oleanolic acid (3β-hydroxy-olea-12-en-28-oic acid) is a isomer of UA, differing these two
compounds in the position of a methyl residue (Figure 7). In OA a methyl group is together with
other in position 20, while in UA the methyl group is in position 19 of the cyclic ring system [Liu,
1995]. Like UA, it has been shown that OA possess many biological activities such as anti-
inflammatory, anticancer, antiviral, hepatoprotective and anti-hyperlipidemic effects, occurring in
more than 120 plants species [Chen et al., 2011; Wang and Jiang, 1992]. The antitumor activity
of OA has been reported in colon cancer cells due to its inhibitory effect on cell proliferation
through cell cycle arrest [Li et al., 2002]. The apoptotic effects of OA was described in leukemia
cells, in which it activated caspase-9 and caspase-3, accompanied by the cleavage-induced
inactivation of the DNA repair enzyme Poly (ADP-ribose) polymerase [Zhang et al., 2007]. It has
also been shown that OA downregulates the expression of cyclin D1 and upregulates p21 and
p27, that inhibits the activation of the nuclear translocation of transcription factors such as NF-
kB, c-fos, ATF-2 and CREB-1, and that also downregulates the production and expression of TNF-
α, IL-1β and IL-6, in melanoma cells [Pratheeshkumar and Kuttan, 2011]. In HCC cells, OA
induced also apoptotic effects via increasing DNA fragmentation, decreasing mitochondrial
membrane potential, lowering Na+-K+-ATPase activity, and elevating caspase-3 and caspase-8
activities [Yan et al., 2010]. In other HCC cell lines, it was reported the antiproliferative effects of
OA through apoptosis associated with alterations in BCL-2 family proteins and downregulation of
NF-kB and XIAP [Shyu et al., 2010]. OA was also able to suppress cell adhesion and to reduce
the production of VEGF and the intercellular adhesion molecule 1 - ICAM-1 [Yan et al., 2010]. In
osteosarcoma cells, OA inhibited both mTORC1 downstream targets S6K, and 4E-BP1, induced
cell cycle arrest and inhibited mTORC2 and its target AKT, leading to induction of apoptosis
[Zhou et al., 2011].

Introduction
24
Figure 7. Struc
7.7.7.7. Triterpenoids and cholesterolTriterpenoids and cholesterolTriterpenoids and cholesterolTriterpenoids and cholesterol
Cholesterol is a molecule formed by squalene cyclization and
synthesized or absorbed from the diet
cellular membranes and modulates various of their properties such as fluidity, permeability,
stability and contour [Deng et al., 2009
concentration of cholesterol in its
the phospholipids of membranes, integrating regions with a characteristic structural composition
that appear to act as platforms to colocalize proteins, these microdomains
[Calder and Yaqoob, 2007]. Such
include signal transduction, membrane trafficking, cytoskeletal organization and pathogen entry
[Ikonen, 2001]. As mentioned before,
autophagy, in particular in the fusion of autophagosome
Structure of ursolic acid, oleanolic acid and cholesterol.
Triterpenoids and cholesterolTriterpenoids and cholesterolTriterpenoids and cholesterolTriterpenoids and cholesterol
Cholesterol is a molecule formed by squalene cyclization and in humans can be
from the diet [Stryer et al., 2002]. It is an essential component of
cellular membranes and modulates various of their properties such as fluidity, permeability,
, 2009]. Lysosome is one of the organelles that contain a high
membrane [Gallegos et al., 2002]. Cholesterol can interact with
the phospholipids of membranes, integrating regions with a characteristic structural composition
that appear to act as platforms to colocalize proteins, these microdomains are named
. Such lipid rafts play important roles in several cellular process that
include signal transduction, membrane trafficking, cytoskeletal organization and pathogen entry
As mentioned before, cellular cholesterol levels can have dramatic effects in
fusion of autophagosomes with lysosomes [Koga et al.
Cholesterol
in humans can be
. It is an essential component of
cellular membranes and modulates various of their properties such as fluidity, permeability,
organelles that contain a high
. Cholesterol can interact with
the phospholipids of membranes, integrating regions with a characteristic structural composition
named lipid rafts
in several cellular process that
include signal transduction, membrane trafficking, cytoskeletal organization and pathogen entry
can have dramatic effects in
et al., 2010]. The

Introduction
25
proteins involved in fusion of the two compartments, such as SNAREs- mediated vesicular fusion,
are localized in these microdomains and their activity are affected by depletion of cholesterol
[Koga et al., 2010]. Another effect of low cholesterol in lysosomal membrane is the increased
permeability to K+ and H+, destabilizing the lysosomes by affecting pH, leading to loss of the
lysosomal function as well as the fusion ability with autophagosomes [Deng et al., 2009]. On the
contrary, high levels of cholesterol can increase mitochondrial membrane condensation. This can
occur due to deficiency in caveolins, proteins that reside in lipid rafts microdomains and that bind
cholesterol, promoting an increase of influx and accumulation of free cholesterol. Consequently,
it occurs a decreased efficiency of the respiratory chain and intrinsic antioxidant defenses leading
to accumulation of reactive oxygen species (ROS) and eventually cell death [Bosch et al., 2011].
The bioactive triterpenoids have structural similarities to cholesterol (Figure 7) and are
good candidates to interact with biomembranes, potentially modulating their structural properties
and leading to functional changes of proteins associated to membranes. A previous report
described the ability of both UA and OA to perturb membrane domains rich in cholesterol and,
therefore, affecting the lipid membrane physical properties [Prades et al., 2011]. Also recently, it
was shown the potential of OA to strongly decrease the phosphorylation of AKT and lipid rafts-
mediated mTORC1 and mTORC2 signaling, as well as their contents decreased in the lipid raft
fractions. Moreover, addition of exogenous cholesterol restored the signaling events disrupted by
OA in breast cancer cells [Chu et al., 2010]. All these aspects confer a certain capacity of
pentacyclic triterpenoids to interfere with cholesterol homeostasis and associated cellular
functions, which may be explored as a novel approach to disrupt the survival of resistance of
tumor cells.
The triterpenoids UA and OA have also been considered as potential good drugs for the
treatment of hyperlipidemia, which also indicate their potential to control cholesterol levels in
vivo. Azevedo et al. reported the ability of UA to ameliorate the lipid profile in rats [Azevedo et al.,
2010]. It has also been reported that both triterpenoids are able to inhibit acylCoA:cholesterol
acyltransferase (a enzyme that is require for the storage of cholesterol), promoting decreased
levels of cholesterol in vivo [Lin et al., 2009]. Effects on cholesterol biosynthesis has also been
associated with UA, where it was reported its capacity to increase the mRNA expression of
cholesterol 7α-hydroxylase and to accelerate the conversion of cholesterol into bile acid, which
may explain the reduction in cholesterol and low density lipoprotein-cholesterol levels in the
circulation induced by UA [Xue et al., 2006]. Recently, a study by Jia et al. indicates that UA

Introduction
26
regulates hepatic lipid metabolism by acting as a peroxisome proliferator-activated receptor
(PPAR-α) agonist in vitro. UA altered the expression of key genes in lipid metabolism, significantly
reducing intracellular triglyceride and cholesterol concentrations in hepatocytes, but without
being a direct ligand of PPAR-α [Jia et al., 2011].

Introduction
27
Objectives of the workObjectives of the workObjectives of the workObjectives of the work
These works are integrated in the Nutriomics and Pharmacology Group of the
Department of Biology, University of Minho, that studies the cellular and molecular mechanisms
of action of health improving properties of phytochemicals. In this regard, many natural
compounds and plant extracts have been characterized as potential anticancer drugs or
sensitizers of chemotherapeutics. A previous work in our group reported the potential of UA to
induce cell death and to inhibit proliferation in colorectal cancer cells. This natural triterpenoid
UA was also shown to enhance the efficacy of the chemoterapeutic 5-fuorouracil, to activate JNK
signaling and to modulate molecular markers of autophagy.
In the present report, we decided to evaluate the applicability of two isomer triterpenoids,
UA and OA, to induce cell death and modulate autophagy in the HepG2 human hepatocellular
carcinoma cell line. Resistance to chemoterapeutics and survival of cancer cells in poor
vascularised central areas of tumors are mediated by autophagy. Therefore, starvation-induced
autophagy was used in this work to mimic metabolic stress in cancer cells and to study the
potential anticancer effects of UA and OA in HepG2 cells. The mechanisms of cell death induced
by the triterpenoids was investigated using pharmacological inhibitors of several molecular
targets and signalling pathways, and cell viability measured by MTT assay and PI staining.
Considering previous effects of UA in autophagy molecular markers, we also studied whether cell
death induced by these triterpenoids is mediated by autophagic flux inhibition. Triterpenoids are
structurally similar to cholesterol, which is an important component of cell membranes and
involved in central cellular functions. Therefore, the potential of these compounds to disrupt
cholesterol homeostasis was also explored in this work. With this study we intend to give one
more step ahead in the elucidation of the mechanisms of action of triterpenoids as potential
anticancer compounds.

28

Material and Methods Material and Methods Material and Methods Material and Methods

30

Material and Methods
31
1.1.1.1. Chemicals and antibodiesChemicals and antibodiesChemicals and antibodiesChemicals and antibodies
Oleanolic acid (OA), ursolic acid (UA), 3-(4,5-Dimethylthiazolyl-2)-2,5-diphenyltetrazolium
bromide (MTT), methyl-β-cyclodextrin (MβCD), Minimum Essential Medium Eagle (MEM), MEM
without L-glutamine, RPMI-1640, antibiotic/antimycotic solution, bovine serum albumin (BSA),
N-(2-Hydroxyethyl)piperazine-N'-(2-ethanesulfonic acid) (HEPES), Monodansyl-cadaverine (MDC)
and chloroquine (CQ) were purchased from Sigma-Aldrich (St. Louis, MO, USA). Rapamycin (Rap)
was purchase from Santa Cruz Biotechnology (Santa Cruz, CA, USA). Protease inhibitors PepA
and E64D were from PeptaNova GmbH (Germany). 2’,7’-Dichlorodihydrofluorescein diacetate
(DCF) was purchased from Molecular Probes (Eugene, OR, USA). Fetal bovine serum was bought
from Lonza (Verviers, Belgium). The source of primary antibodies were the following: anti-
phospho-mTOR from Cell Signaling (Danvers, MA, USA); ant-rabbit p62 (SQTM1) from Enzo Life
Sciences (Lorrach, Germany); anti-MAPLC3 (clone 5F10) from Santa Cruz Biotechnology, Inc.
(Santa Cruz, CA, USA); and anti-β-actin from Sigma-Aldrich. Secondary antibodies HRP donkey
anti-rabbit and sheep anti-mouse were purchased from Santa Cruz Biotechnology.
2.2.2.2. Cell cultureCell cultureCell cultureCell culture
HepG2 cells (human hepatocellular liver carcinoma cell line), obtained from the
American Type Culture Collection (ATCC), were maintained in culture in 75 cm2 polystyrene
flasks (TPP, Switzerland) with MEM medium, containing 10% FBS, 1% antibiotic–antimycotic
solution, 1 mM sodium pyruvate, 10 mM HEPES and 2.2 g/l sodium bicarbonate under an
atmosphere of 5% CO2 and 95% air at 37°C. HCT116 cells (human colorectal carcinoma cell
line) were kindly provided by Prof. Raquel Seruca from IPATIMUP, Porto. The cell line was
maintained in culture in 25 cm2 polystyrene flasks (TPP, Switzerland) with RPMI 1640 medium,
containing 6% FBS, 1% antibiotic–antimycotic solution, 0,1 mM sodium pyruvate, 10 mM HEPES
and 2 g/l sodium bicarbonate under an atmosphere of 5% CO2 and 95% air at 37°C.

Material and Methods
32
3.3.3.3. MTT MTT MTT MTT reduction assayreduction assayreduction assayreduction assay
A MTT reduction assay was performed to study the potential of test compounds to
decrease the number viable cells, as previously described [Lima et al., 2011]. Briefly, HepG2
cells were plated in 24-multiwell culture plates at 0.1x10⁶ cells per well one or two days before
incubation with test compounds (for pre-incubation and co-incubation procedures, respectively).
In the pre-incubation procedure, HepG2 were incubated with test compounds for 24h followed by
a period of 48h with fresh complete medium or fresh starvation medium (MEM medium without
glutamine and FBS). In the co-incubation procedure, HepG2 were incubated with test compounds
dissolved in complete medium or starvation medium for 48h. One hour before the end of the
incubation period MTT (final concentration 0.5 mg/ml) was added to each well. Then, the
medium was removed, and the formazan crystals formed by the cell’s capacity to reduce MTT
were dissolved with a 50:50 (v/v) DMSO:ethanol solution, and absorbance measured at 570 nm
(with background subtraction at 690 nm). The results were expressed as percentage relative to
the control (cells without any test compound, vehicle only – DMSO 0.5%). The concentration of
test compound that decreases the number of viable cells to 50% (IC50) was calculated using
mathematical modeling with the program GraphPad Prism 5 (GraphPad Software, Inc., La Jolla,
CA, USA).
4.4.4.4. Cell death analysis by PI stainingCell death analysis by PI stainingCell death analysis by PI stainingCell death analysis by PI staining
HepG2 cells were plated in 24-multiwell culture plates at 0.1x10⁶ cells per well. After
treatment with different incubation times and/or different concentrations of OA, cells were
collected (both floating and attached cells) and washed in ice cold PBS containing 6% (v/v) FBS.
Cells were then resuspended in ice cold PBS with propidium iodide (PI) and Hoechst, added to a
final concentration of 25 µg/ml and 5 µg/ml, respectively. Twenty microliters of the stained cell
suspension were placed on microscope slides and overlaid carefully with a coverslip.
Immediately, cells were visualized on a fluorescent microscope and photos taken from different
fields. The percentage of dead cells (PI positive) was calculated from the ratio between PI positive

Material and Methods
33
cells and total number of cells (visualized with Hoechst staining), from a count higher than 500
cells per slide.
5.5.5.5. Western blottingWestern blottingWestern blottingWestern blotting
HepG2 cells were plated in 6-multiwell culture plates at 0.5x10⁶ cells per well. After
treatment with different incubation times or different concentrations of compounds, cells were
washed with PBS and lysed for 15 min at 4ºC with ice cold RIPA buffer (1% NP-40 in 150 mM
NaCl, 50 mM Tris-HCl (pH 8), 2 mM EDTA) containing 1 mM PMSF, phosphatase inhibitors (20
mM NaF, 20 mM Na2V3O4) and protease inhibitor cocktail (Roche, Mannheim, Germany). Protein
concentration was quantified using the Bio-Rad DC protein assay (Bio-Rad Laboratories,
Hercules, CA, USA) and BSA used as protein standard. For Western blot, 20 μg of protein was
resolved in SDS-polyacrylamide gel and then electroblotted to a polyvinylidene difluoride
membrane (Millipore, Billerica, MA, USA). Membranes were blocked in TPBS (PBS with 0.05%
Tween-20) containing 5% (w/v) nonfat dry milk, washed in TPBS and incubated with primary
antibody overnight. Then, after washing, membranes were incubated with secondary antibody
conjugated with horseradish peroxidase and immunoreactive bands were detected using the
Immobilon solutions (Millipore) under a chemiluminescence detection system, the ChemiDoc
XRS (Bio-Rad Laboratories). Band area intensity was quantified using the Quantity One software
from Bio-Rad. β-Actin was used as loading control.
6.6.6.6. Immunofluorescence analysisImmunofluorescence analysisImmunofluorescence analysisImmunofluorescence analysis
HepG2 cells were plated in chamber slides at 0.1x10⁶ cells per well. After treatment cells
were fixed for 30 min with 4% PFA in PBS, washed twice with PBS, followed by permeabilization
with 0.2% Triton-X-100 for 2 min and by blocking with 5% normal goat serum diluted in PBS
containing 1% BSA and 0.3% Triton-X-100 for 20 min. Chamber slides were incubated with
primary antibodies overnight at 4ºC in humidity chambers with anti-mouse LAMP-2 (1:200) from
the Developmental Studies Hybridoma Bank (University of Iowa, IA, USA) and anti-mouse LC3
(1:50) from Santa cruz. The monoclonal antibody LAMP-2 (clone H4B4) developed by August JT

Material and Methods
34
and Hildreth JEK was obtained from the Developmental Studies Hybridoma Bank developed
under the auspices of the NICHD and maintained by The University of Iowa, Department of
Biology, Iowa City, IA 52242. After incubation with primary antibodies, slides were washed in
PBS containing 0.25% BSA and 0.1% Triton X-100, and incubated with secondary antibodies
(goat anti-mouse IgG Alexa Fluor 488 or goat anti-rabbit Alexa Fluor 488, Invitrogen) for 1h at
room temperature. Slides were washed with TPBS and mounted with Vectashield antifading
solution (Vector Laboratories, Inc., Peterborough, UK). Immunofluorescence signal were
visualized under a fluorescent microscope (Olympus IX71) and photos taken from different fields.
7.7.7.7. Measurement of reactive oxygen sMeasurement of reactive oxygen sMeasurement of reactive oxygen sMeasurement of reactive oxygen speciespeciespeciespecies
To determinate the levels of reactive oxygen species (ROS) by flow cytometry, cells were
seeded in petri dishes (60 mm) with 1x10⁶ cells and treated with OA overnight. After that, cells
were washed with PBS and incubated with 2’,7’-Dichlorodihydrofluorescein diacetate (DCF) at a
final concentration of 10 μM for 30 min, 37ºC. After incubation, cells were washed with PBS,
collected and washed with ice cold PBS, centrifuged at 500 xg for 5 min and resuspended in
PBS. Samples were then run on a flow cytometer (Beckman-FC500, Beckman Coulter) and ROS
levels expressed as the ratio between mean fluorescence intensity of each sample and
autofluorescence.
8.8.8.8. Statistical analysisStatistical analysisStatistical analysisStatistical analysis
Data are expressed as the mean ± SEM of at least 3 independent experiments. Statistical
significances among data groups were analyzed by one-way ANOVA followed by the Newman–
Keuls multiple comparison test, or analyzed by the Student’s t-test, as appropriate, using
GraphPad Prism 5.0 software (San Diego, CA, USA). Differences between groups were
considered statistically significant when P≤0.05.

Results and Discussion Results and Discussion Results and Discussion Results and Discussion

36

Results and Discussion
37
1.1.1.1. Effects of UA and OA in Effects of UA and OA in Effects of UA and OA in Effects of UA and OA in molecular markers of autophagymolecular markers of autophagymolecular markers of autophagymolecular markers of autophagy
In a previous work, in our laboratory, UA was tested in colorectal cancer cells and shown
to have anti-proliferative effects and to induce cell death by apoptosis [Xavier et al., 2009]. In the
apoptosis-resistant HCT15 cell line, however, apoptosis did not account for all cell death induced
by UA [Xavier et al., 2012, submitted]. In these cells, UA activated JNK and modulated molecular
markers of autophagy, which suggested that these pathways might be involved in cell death
[Xavier et al., 2012, submitted]. Both in HCT15 and in MCF7 breast cancer cell line, UA induced
the levels of LC3 and p62 that, in addition with other molecular assays, suggested that UA is
inhibiting autophagy at later steps, in particular in the fusion of autophagosomes with lysosomes
[Xavier, 2010]. In the present study, we tested the ability of the two isomeric triterpenoids UA
and OA to induce cell death and to modulate autophagy in the HCC HepG2 cell line. First, we
evaluated by western blot the effects of these triterpenoids in the levels of p62 and LC3 that are
considered good molecular markers of autophagy [Bjorkoy et al., 2009; Kouri et al., 2002]. As
shown in Figure 8A, both UA and OA induced the accumulation of p62 and LC3-II along the time.
Therefore, like the previous results in colon cancer cells, UA also induced the increase of
autophagy markers in HepG2 cells. OA also present similar results, which is not surprising having
in count the very similar structure with UA.
Figure 8. Modulation of autophagic markers by triterpenoids and starvation in HepG2 cells. A) Effect of 25 µM of UA and OA in
the levels of LC3 and p62 in complete medium along the time. B) Effect of starvation medium (complete medium without FBS
and glutamine) in the levels of p-mTOR and LC3 along the time, in the presence or absence of the protease inhibitors PepA
(pepstatin A) and E64d.
Complete mediumComplete mediumComplete mediumComplete medium
DMSODMSODMSODMSO OA 25OA 25OA 25OA 25 µMµMµMµM UA 25 µMUA 25 µMUA 25 µMUA 25 µM
p62p62p62p62
LC3LC3LC3LC3----IIII
LC3LC3LC3LC3----IIIIIIII
β_actin_actin_actin_actin
Time (h)Time (h)Time (h)Time (h) 0 0 0 0 1 1 1 1 6666 24 24 24 24 1 1 1 1 6666 24 24 24 24 1111 6 6 6 6 24242424
Complete mediumComplete mediumComplete mediumComplete medium Starvation mediumStarvation mediumStarvation mediumStarvation medium
PepA + E64dPepA + E64dPepA + E64dPepA + E64d ---- ---- ---- ++++ ++++ ---- ---- ++++ ++++
pppp----mmmmTORTORTORTOR
LC3LC3LC3LC3----IIII
LC3LC3LC3LC3----IIIIIIII
β____actiactiactiactinnnn
Time (h)Time (h)Time (h)Time (h) 0 6 24 6 240 6 24 6 240 6 24 6 240 6 24 6 24 6 24 6 246 24 6 246 24 6 246 24 6 24
AAAA BBBB

Results and Discussion
38
To compare with the effects of both UA and OA, we also induced autophagy by
starvation, in particular with serum and glutamine deprivation as reported before [Yu et al.,
2010]. As shown in Figure 8B, starvation decreased p-mTOR levels but did not increase
considerably the levels of LC3-II after 6h and 24h of incubation. This is in agreement with the
recent literature, because when the autophagic flux is induced there is only a transient increase
in LC3-II levels that then return to normal levels due to its degradation in the autolysosome
[Kabeya et al., 2000; Mizushima et al., 2010]. Therefore, in these conditions increased
autophagic flux can be studied using inhibitors of autophagy in later steps, such as by using the
lysosome protease inhibitors PepA and E64d [Mizushima et al., 2010; Tanida and Waguri,
2010]. Blocking the autophagic flux we observed, in fact, that starvation medium induced a
higher accumulation of LC3-II as compared with complete medium, indicating therefore induction
of autophagy. Thus, in opposition to the starvation-induced autophagic flux, increased levels of
both LC3 and p62 by UA and OA may indicate an inhibition of autophagy at later steps (Figure
8).
2.2.2.2. Effect of UA and OA in HepG2 cell viabilityEffect of UA and OA in HepG2 cell viabilityEffect of UA and OA in HepG2 cell viabilityEffect of UA and OA in HepG2 cell viability
Considering that both UA and OA also remarkably increased autophagy markers in
HepG2 cells, we then evaluated their effects on the viability of HepG2 cells by MTT assay in both
complete and starvation medium. As shown in Figure 9A, OA induced a higher decrease of the
number of viable cells as compared with UA at 20 µM, in both complete and starvation medium.
On the contrary, in previous results in colon and breast cancer cells UA was much more effective
than OA in decreasing cell viability [Xavier, 2010]. Interestingly, OA remarkably decreased the
number of viable cells in starvation medium as compared with UA, suggesting therefore different
modes of action of these isomer triterpenoids. Under the microscope, UA induced remarkable
cell morphological changes with the appearance of floating cellular debris but without floating
cells in the medium (Figure 9B). These debris increased in starvation medium and cells present
bigger and higher number of shining vacuolar structures, but without cell death (floating cells).
On the contrary, although OA also induced some cellular debris in complete medium, when cells

Results and Discussion
39
Figure 9. Effect of ursolic acid (UA), oleanolic acid (OA) and rapamycin (Rap) in the viability of HepG2 cells. A) Cells were
incubated with test compounds (controls received vehicle only – DMSO) for 48h either in complete medium or starvation
medium, and cell viability assessed by MTT reduction assay. Values are mean ± SEM of at least three independent experiments.
*P≤0.05, ** P≤0.01, *** P≤0.001, when compared with respective control, analyzed by the Student’s t-test. +++ P≤0.001, when
compared with same condition between different media, analyzed by the Student’s t-test. B) Representative images of the effect
of test compounds in complete and starvation medium for 48h (bar=100μm).
AAAA
Complete mediumComplete mediumComplete mediumComplete medium Starvation mediumStarvation mediumStarvation mediumStarvation medium
Control
Control
Control
Control
UA 20
UA 20
UA 20
UA 20 µMM MM
BBBB
OA 20
OA 20
OA 20
OA 20 µMM MM

Results and Discussion
40
were incubated in starvation medium for 48h, most of cells were floating with morphological
features of cell death, confirming therefore the MTT results (Figure 9). The effect of Rap in cell
viability was also studied to test the effects of a compound known to induce autophagy and to
have anticancer effects [Faivre et al., 2006; Oshiro et al., 2004]. As shown in Figure 9A, HepG2
cells were not susceptible to cell death induced by Rap, and only in starvation medium there was
a significant but slight decrease in the number of viable cells. Also comparing the control
situation in both media, we observe a decrease in the number of viable cells in starvation
medium (Figure 9). This decrease is probably due to inhibition of cell proliferation during the 48h
of incubation due to serum and glutamine starvation, since no cell death was observed under the
microscope as shown by the absence of floating cells and cells with blebs.
It is not surprising that starvation-induced autophagy increases the susceptibility to cell
death induced by other drugs, such as what happened here with OA. It is known that starvation-
induced autophagy mediates protection from apoptosis [Boya et al., 2005], and that inhibitors of
autophagy inhibits the survival of cells under starvation [Farkas et al., 2011]. Here, although both
UA and OA increase the levels of LC3 and p62 probably due to autophagy inhibition, only OA
sensitized HepG2 cells to death under starvation (Figure 9). To test if OA also sensitize other cells
to cell death under starvation, we did a similar experiment in the colorectal carcinoma cell line
HCT116. Confirming previous results by Xavier (2010), UA was more toxic than OA in the
HCT116 cells line (see Supplementary Fig. 1A). When the compounds were tested in starvation
medium the number of viable cells decrease (see Supplementary Fig. 1B). However, the
decrease was much more significant in cells treated with OA (see Supplementary Fig. 1). For UA
the IC50 decrease from 8 µM in complete medium to 4 µM in starvation medium, after 48h of
incubation, whereas for OA, the IC50 decrease from >>50 µM (viability was 93% at 50 µM –
higher concentration tested) to 12 µM. These results show that OA also remarkably sensitize cells
to death in other cell lines under starvation as compared with UA.
To further test that UA and OA have different effects as compared with Rap, we next
evaluated the effects of pre-incubation with test compounds in complete medium followed by a
period of starvation of 48h without test compounds in cell viability by the MTT assay. Induction of
autophagy by Rap 24h prior to starvation remarkably decreased cell viability induced by 48h of
starvation (Figure 10A). This effect was in part due to cell death since floating cells were
observed (data not shown), contrarily to the effect of Rap incubated in starvation medium (co-
incubation procedure – Figure 10A). Here, the observed decrease in cell viability was probably

Results and Discussion
41
Figure 10. Effect of Rap (A) and UA (B) in the viability of HepG2 cells, as assessed by MTT reduction assay. In the pre-
incubation regime, cells were incubated with Rap (A) or UA (B) at indicated concentrations for 24h in complete medium followed
by a period of 48h with the indicated fresh medium without Rap or UA. In the co-incubation regime, cells were incubated with Rap
(A) or UA (B) at indicated concentrations for 48h either in complete medium or starvation medium. Values are mean ± SEM of at
least three independent experiments. *P≤0.05, ***P≤0.001, when compared with respective control, analyzed by the Student’s t-
test. ++
P≤0.01, when compared with same condition in complete medium, analyzed by the Student’s t-test.
due to the presence of a less number of viable cells due to inhibition of proliferation or due to a
decrease in cell metabolic activity induced by Rap together with starvation as compared with
starvation alone. Therefore, autophagy induction by Rap was detrimental to cells in a following
period of starvation-induced autophagy. This might happen because cells possess less cellular
contents for degradation by autophagy for generation of energy and building blocks in a period of
starvation that immediately follows other. In the case of UA, this pre-incubation procedure did not
result in a decrease of the number of viable cells (Figure 10B). Regarding the effects of OA,
likewise Rap, the pre-incubation procedure resulted in a decrease of cell viability (Figure 11A&B).
However, contrarily to Rap, the effect of OA in cell viability was stronger when incubated along
with starvation than that in the pre-incubation regime (Figure 11B). Therefore, these results
corroborate that the effect of OA in autophagy and cell death is different than that of Rap and UA.
Considering all the results we decided then to focus the following work in the effect of OA
in the induction of cell death under starvation conditions. Thus, we next tested the effect of
different concentrations of OA in cell viability by the MTT test. As shown in Figure 11B, OA
induced a concentration-dependent decrease in the number of viable cells after 48h under
starvation conditions, from 1 µM to 20 µM. Under starvation OA present an IC50 of 3.5 µM
AAAA BBBB

Results and Discussion
42
Figure 11. Effect of oleanolic acid (OA) on the viability of
HepG2 cells in complete (A) and starvation (B & C) medium,
as assessed by MTT reduction assay. (A & B) In the pre-
incubation regime, cells were incubated with OA at indicated
concentrations for 24h in complete medium followed by
period of 48h with the indicated fresh medium without OA. In
the co-incubation regime, cells were incubated with OA at
indicated concentrations for 48h either in complete medium
(A) or starvation medium (B). Values are mean ± SEM of at
least three independent experiments. * P≤0.05, ** P≤0.01, *** P≤0.001 when compared with respective control, analyzed by
one-way ANOVA (Newman-Keuls Multiple Comparison Test). (C) Graphic of the mathematical modelling of data present in Figure
11B in the co-incubation regime following a bell-shaped dose-response curve, using the GraphPad Prism software. Shown in the
graphic are the IC50 of 3.5 µM as well as the EC501 of 2.3 µM and EC502 of 9.8 µM for cell viability.
(Figure 11C) whereas in complete medium is about 50 µM (Figure 11A), representing about a
15x increase of susceptibility.
Usually, the effect of a drug on cell viability follows a sigmoidal curve. However, in this
case we find that the effect of OA followed a bell-shaped dose-response curve (composed of two
sigmoidal curves) showing two EC50 values (Figure 11C). Based on the morphological
observations after OA treatment under starvation and on the PI staining results (Figure 12), we
believed that this effect is due to different effects of the drug in two concentration ranges. In
particular, in the first sigmoidal curve that presents an EC50 (half maximal effective
concentration) of 2.3 µM OA might induces a decrease of the number of viable cells due to the
inhibition of cell proliferation (under starvation this factor will not contribute much) and/or due to
a decrease in cells’ metabolic activity. On the other hand, in the second sigmoidal curve that
AAAA BBBB
CCCC

Results and Discussion
43
presents an EC50 of 9.8 µM, the effect of OA in the decrease of the number of viable cells is most
likely due to induction of cell death in a concentration-dependent manner. This latter assumption
is corroborated by the results of PI staining shown below.
As shown in Figure 12A by the PI staining assay, OA induced cell death in a
concentration-dependent manner from 5 µM to 15 µM after 48h of incubation in starvation
medium. Cell death significantly increased from 10% in control condition to 60% and 95% with 10
µM and 15 µM of OA, respectively. Studying cell death along the time we found that OA 10 µM
increased significantly the number of PI positive cells only after 24 h of incubation (Figure 12B).
These results indicate that cell death induced by OA is not abrupt and may be programmed.
Considering the effect of OA on cell death, we then tested the ability of OA to induce
apoptosis. Incubation of HepG2 cells with OA 15 µM in starvation medium for 48h did not result
in nuclear condensation and cleavage of caspases and PARP1 (data not show). These results are
not consistent with previous reports where it was shown that OA and UA induced apoptosis in
hepatocellular carcinoma cells [Shyu et al., 2010; Yan et al., 2010]. However, those results were
done in complete medium and with higher concentrations of drug and/or fewer cells.
It is considered that starvation-induced autophagy protects cells from cell death by
apoptosis, process that is used by cancer cells for survival [Boya et al., 2005; Roy and Debnath,
2010]. This process can be reverted by small inhibitors of autophagy [Farkas et al., 2011]. Thus,
suppression of autophagy with pharmacological agents under conditions of starvation or
chemotherapy may significantly increase cell apoptosis and retard proliferation of
Figure 12. Effect of oleanolic acid (OA) on cell death in HepG2 cells under starvation, as assessed by the PI staining assay. (A)
Effect of different concentrations of OA for 48h. (B) Effect of OA 10 µM along time. Values are mean ± SEM of at least three
independent experiments. *P≤0.05, *** P≤0.001 when compared with control by the one-way ANOVA (Newman-Keuls Multiple
Comparison Test), # P≤0.05 when compared with each other by the Student’s t-test. NS, not significant (P>0.05) when compared
with each other by the Student’s t-test.
AAAA BBBB

Results and Discussion
44
cancer cells [Chang et al., 2011]. However, in our study, although OA seem to be modulating
autophagy by inhibiting it, the induction of cell death by OA under starvation conditions seems to
not involve apoptosis.
3.3.3.3. OA and UA induce accumulation of acidic vacuolesOA and UA induce accumulation of acidic vacuolesOA and UA induce accumulation of acidic vacuolesOA and UA induce accumulation of acidic vacuoles
Considering the effects of UA and OA in the modulation of autophagy molecular markers
and the differential effects that they present on induction of cell death, we decide to further study
their kinetics in the formation of acidic degradative compartments. Monodansylcadaverine (MDC)
has been reported as a specific marker for autophagic-related vacuoles [Biederbick et al., 1995].
In addition, the accumulation of MDC-labelled vesicles correlates with the induction of autophagy
by starvation conditions for 2h [Munafo and Colombo, 2001]. However, it is currently accepted
that MDC does not stain nascent autophagosomes until prior to their acquisition of acidic
properties, and, therefore, it only stains acidic compartments that include late endosomes,
lysosomes and autolysosomes [Bampton et al., 2005]. As shown Figure 13, cells treated with UA
for 16h showed a remarkable increase of MDC-labelled large acidic vesicles both in complete and
starvation medium. In the case of OA, there was the appearance of few and small acidic vacuoles
in complete medium, which remarkably increased upon treatment of cells under starvation
conditions (Figure 13). In the case of Rap-induced autophagy conditions, accumulation of acidic
vacuoles was only observable after inhibition of autophagy at later steps with chloroquine (Figure
13A and Supplementary Fig. 2). However, the increase of acidic valuoles by Rap was not
significant as compared with control condition (Figure 13A). Therefore, also here both
triterpenoids behaved differentially than rapamycin showing an effect similar of an autophagy
inhibitor at later steps. In addition, comparing the results between the two isomer triterpenoids
also agrees that they act in a different way in HepG2 cells, since UA induced accumulation of
acidic vacuoles in both normal and starvation conditions whereas OA only did that remarkably
under starvation conditions. Importantly, this accumulation of acidic vesicles induced by OA
under starvation might not be involved in cell death, since UA have more capacity to induce that
in HepG2 but without significant cell death.
The kinetics of accumulation of acidic vacuoles induced by OA were also followed in

Results and Discussion
45
Figure 13. Effect of oleanolic acid (OA) and ursolic acid (UA) in the appearance of cellular acidic vacuoles, as assessed by MDC-
staining. HepG2 cells were treated with the indicated compounds for 16h in complete or starvation medium before being stained
with 50 µM monodansylcadaverine (MDC) for 10 minutes. Chloroquine (CQ) at 10 µM was used to observe the effects of
rapamycin (Rap) in complete medium. (A) Quantification of the number of MDC-labelled acidic vacuoles per cell by morfometric
analysis performed in photos taken in different areas of the samples. Values are mean ± SEM of at least three independent
experiments. * P≤0.05, ** P≤0.01 and *** P≤0.001 when compared with control by the Student’s t-test. ++ P≤0.01 when
compared with same treatment but in different medium by the Student’s t-test. ### P≤0.001 when compared with each other by
the Student’s t-test. NS, not significant (P>0.05) when compared with each other by the Student’s t-test. (B) Representative
images of the effect of tested compounds for 16h in the appearance of cellular acidic vacuoles in HepG2 cells cultured in
complete and starvation medium (bar=50μm).
AAAA
BBBB
Complete mediumComplete mediumComplete mediumComplete medium Starvation mediumStarvation mediumStarvation mediumStarvation medium
Control
Control
Control
Control
UA 20
UA 20
UA 20
UA 20 µMM MM
OA 20
OA 20
OA 20
OA 20 µMM MM

Results and Discussion
46
HepG2 cells under starvation conditions. As shown in Figure 14, OA induced a concentration-
and time-dependent accumulation of MDC-labelled vesicles. The effect is significant after the
concentration of 10 µM (Figure 14A) and begins to occur after 4h of incubation, increasing the
number of acidic vacuoles along the time (Figure 14B). These results, in addition to the levels of
autophagy markers shown in Figure 8, indicate that OA (as well as UA) modulates autophagic flux
very early after compound incubation.
To complement these results we also studied the expression of LC3 and LAMP-2-
associated lysosomal marker by immunofluorescence. Under autophagy induction and inhibition
at later steps LC3 positive punctae accumulate in cells due to the increase of autophagosomes. A
portion of these LC3 punctae may or may not be colocalized with LAMP-2 staining, depending on
the interference that we may be inducing to the autophagic flux [Bampton et al., 2005].
Unfortunately, we were not able to get a positive immunostaining of LC3 with the antibody and
conditions that we used. However, as shown before, we observed a remarkably increase of LC3
levels by western blot (Figure 8). Regarding the LAMP-2 we get a positive signal and we observe
that stained vesicles seem to increase in cells treated with UA or OA as compared to the control
condition under starvation (see Supplementary Fig. 3). But interestingly, vesicles stained by
Figure 14. Effect of oleanolic acid (OA) in the accumulation of acidic vacuoles in HepG2 cells under starvation medium, as
assessed by MDC-staining. Cells were incubated with different concentrations of OA for 16h (A) or along the time with 10 µM OA
(B) before being stained with 50 µM of monodansylcadaverine (MDC) for 10 minutes. Represented are the quantification of the
number of MDC-labelled acidic vacuoles per cell by morfometric analysis performed in photos taken in different areas of the
samples. Values are mean ± SEM of at least three independent experiments. ** P≤0.01 and *** P≤0.001 when compared with
control (A) or with 1h-control (B) by the one-way ANOVA (Newman-Keuls Multiple Comparison Test). # P≤0.05 and ##
P≤0.01
when compared with each other by the Student’s t-test. NS, not significant (P>0.05) when compared with each other by the
Student’s t-test.
AAAA BBBB

Results and Discussion
47
LAMP-2 antibody were larger in cells treated with OA being possible to observe the contour of the
structures in the amplification used, whereas in cells treated with UA we only observed bright
LAMP-2-labbeled punctae (see Supplementary Fig. 3). Although these results need to be
confirmed in following experiments, these larger lysosomes induced by OA but not by UA may
reflect or be involved in the cell death induced specifically by OA in starvation conditions.
4.4.4.4. Autophagy inhibitors do not protect cells from death induced by OAAutophagy inhibitors do not protect cells from death induced by OAAutophagy inhibitors do not protect cells from death induced by OAAutophagy inhibitors do not protect cells from death induced by OA
In the present work we have shown that OA induces significant cell death independent of
apoptosis in HepG2 cells under starvation conditions. Concomitant with this, we also found
accumulation of several markers of autophagy, such as LC3, p62 and acidic vesicles. Therefore,
we speculate whether autophagy would be involved in OA-induced cell death under starvation
conditions. If autophagy is induced above a critical threshold it can induce cell death due to
extensive degradation of cytoplasmatic material [Galluzzi et al., 2009]. As a control of this
condition, we used the pre-incubation regime with Rap described above that leads to cell death in
a subsequent period of starvation-induced autophagy. As shown in Figure 15A, Rap pre-treatment
increased the susceptibility of cells to die under a subsequent starvation period, which was
prevented by CQ but not by the PepA + E64d. Both of these autophagy inhibitors, that act at later
steps, were used in non-toxic concentrations (Figure 15A) and in effective concentrations as can
be observed in Figure 8B and Figure 13A for PepA + E64d and CQ, respectively. The fact that
PepA + E64d did not work as CQ protecting cell death induced by Rap could be because they are
degraded faster than CQ and, therefore, they are inappropriate to be used for 48h in the
concentrations tested. On the other hand, the cell death induced by OA under starvation
conditions was not prevented by CQ and PepA + E64d (Figure 15B). On the contrary, co-
incubation of these inhibitors with OA even promoted slightly the decrease of cell viability.
Therefore, this result does not support the idea that OA is inducing cell death by increasing
chronically autophagy, which is in agreement with our previous results.
In turn, as discussed above, the accumulation of LC3, p62 and acidic vesicles by OA is
most likely due to inhibition of autophagy at later steps. To check if inhibition of autophagy was

Results and Discussion
48
Figure 15. Effect of autophagy inhibitors in the cell death induced by rapamycin (Rap) and oleanolic acid (OA) in HepG2 cells, as
assessed by MTT assay. A) Cells were pre-incubated with 50 nM Rap (controls received vehicle only – DMSO) for 24h in complete
medium followed by period of 48h with fresh starvation medium containing 10 µM CQ or PepA/E64d (10µg/ml, each). B) Cells
were incubated with 10 µM OA for 48h in starvation medium in the presence of 10 µM CQ or PepA/E64d (10µg/ml, each).
Values are mean ± SEM of at least three independent experiments. ** P≤0.01, *** P≤0.001, when compared with respective
control, analyzed by the Student’s t-test. +P≤0.05 when compared with the respective test compound alone, analyzed by the
Student’s t-test. ## P≤0.01, ### P≤0.001, when compared with each other by the Student’s t-test. NS, not significant (P>0.05)
when compared with each other by the Student’s t-test.
involved in OA-induced cell death we decreased autophagic flux by using pharmacological
inhibitors of autophagosome formation. For that we used the inhibitors 3-MA, LY-294002 and
wortmannin; but when incubated alone, all of them already decreased cell viability of HepG2 cells
under starvation as measured by the MTT assay (data not show). That is not surprising since it is
known that these inhibitors lack of specificity to class III PI3K, inhibiting also class I PI3K, which
affect cell growth and survival [Farkas et al, 2011]. A possible solution would be to inhibit
autophagosome formation by genetic tools, such as with the use of small interfering RNA
targeting Atg5 or Beclin 1. However, under starvation conditions, inhibition of autophagy by any
mean result in cell death [Boya et al., 2005; Farkas et al., 2011], being therefore difficult to
speculate whether OA is inducing cell death due to inhibition of autophagy at later steps.
Nevertheless, here we have used two isomer triterpenoids, and because UA is more effective
inhibiting autophagy than OA, but only OA is inducing cell death under starvation conditions, it
indicates that the toxic effect of OA is probably independent of inhibition of autophagy at later
steps. Altogether, these data point out that OA is modulating autophagy and doing something
AAAA BBBB

Results and Discussion
49
else to the cells that promotes cell death under starvation conditions.
To explore other possible mechanisms of induction of cell death by OA in HepG2 cells
under starvation conditions, we have further tested other inhibitors of molecular targets and/or
signalling pathways using the MTT assay. In a previous work, it was shown that UA induced
apoptosis and modulation of autophagy proteins through JNK pathway in the colorectal
carcinoma HCT15 cells [Xavier et al., 2012, submitted]. The stress-activated protein kinase JNK
has been implicated in many cellular events including apoptosis signalling and more recently
autophagic cell death [Cheng et al., 2008; Wong et al., 2010]. In line with this, we also tested the
use of the JNK inhibitor SP600125 (SP) in co-incubation with OA. The results showed that SP
does not prevent cell death induced by OA (data not shown), suggesting that it is not dependent
on activation of JNK.
Mitochondrial membrane permeabilization may result from bioenergetic failure, which
may occur due to nutrient depletion combined with the impossibility of recruiting endogenous
nutrients by autophagy-dependent catabolic reactions [Boya et al., 2005; Plas and Thompson,
2002]. On the other hand, autophagy is the process that leads to the removal of damaged
mitochondria and its inhibition has been shown to increase the production of ROS [Tal et al.,
2009; Zhang et al., 2007]. Also in the study of Xavier et al. (2012, submitted), the antioxidant N-
acetylcysteine (NAC) was found to reduce partially the apoptosis-like cell death induced by UA in
HCT15 cells, suggesting an implication of ROS. Therefore, we also test here the possible
involvement of ROS in the OA-induced cell death under starvation conditions by using known
antioxidants such as NAC, α-tocoferol and glutathione ethyl ester (GSH-EE – a cell permeable
form of glutathione). However, none of these antioxidants protected HepG2 cells against death
induced by OA (data not shown). Corroborating these results we have measured the cellular
content of ROS and instead of an increase we observed a decrease of ROS induced by OA. As
shown in Supplementary Fig. 4, ROS levels measured by flow cytometry using the DCF probe
decreased about 35% in the presence of OA as compared with control. This decrease in ROS
levels may indicate a decrease of oxidative phosphorylation activity in the mitochondrial electron
transport chain induced by OA, which can be detrimental in a condition of starvation. To test if
there was also some effect of OA on the mitochondrial membrane potential we also measured it
by flow cytometry with the fluorescent probe tetramethylrhodamine methyl ester (TMRM), but we
were not able to get good stain in preliminary experiments (data not shown). Therefore, we

Results and Discussion
50
should establish better conditions of HepG2 cells’ staining with TMRM and/or JC-1 probes in
future experiments to investigate whether OA affect mitochondria number and activity.
5.5.5.5. MethylMethylMethylMethyl----β----cyclodextrin protects against OAcyclodextrin protects against OAcyclodextrin protects against OAcyclodextrin protects against OA----induced cell deathinduced cell deathinduced cell deathinduced cell death
Cholesterol is an essential component of cellular membranes and controls its physical
properties and important biological functions [Deng et al., 2009]. Considering the structural
similarity of triterpenoids with cholesterol we hypothesized that OA could be promoting cell death
by changing cholesterol homeostasis. To test that we have used methyl-β-cyclodextrin (MβCD) - a
polymer able to decrease membrane cholesterol content [Ohtani et al., 1989]. As shown in
Figure 16, when MβCD was added 3 hours after addition of the triterpenoid, the cell death
induced by OA in HepG2 cells under starvation conditions were significantly prevented. The
protection of cell death was in a concentration-dependent manner, except for the highest
concentration tested in which there was some toxicity of MβCD alone. Since removal of
membrane-associated cholesterol by MβCD prevented OA-induced cell death, it indicates that this
triterpenoid is interfering with cholesterol levels and cellular functions that result in toxic effects
under starvation conditions. However, due to the lipophilic nature of OA and structural similarity
with cholesterol, we cannot exclude that MβCD is protecting cells against death by removing also
OA. In an attempt to avoid this possibility MβCD was added to the culture medium 3 hours after
OA to allow its internalization and induction of cellular effects. In preliminary experiments, MβCD
was also added 6 and 24 hours after OA incubation and protection of cell death was also
observed, but of less extent and decreasing with time (data not shown). This indicates that MβCD
is preventing OA-induced cell death most likely by removing cholesterol from cellular membranes.
We have also tested an inhibitor of cholesterol synthesis to check whether it has the
same effect of OA under starvation conditions or if in combination with OA it would prevent cell
death. For that we used pravastatin, an inhibitor of 3-hydroxy-3-methylglutaryl coenzyme A
[Tsujita et al., 1986], at 1 µM and nor cell death was induced by it alone, nor it prevented cell
death induced by OA (data not shown). The lack of any effect of pravastatin may indicate that the
dose used was not effective decreasing cholesterol levels. That should be confirmed in future
experiments by quantifying cellular cholesterol levels.

Results and Discussion
51
Figure 16. Effect of methyl-β-cyclodextrin (MβCD) on oleanolic acid (OA)-induced cell death of HepG2 cells under starvation
conditions. Cells were incubated with OA 10 µM and, 3h after, MβCD was added at the indicated concentrations. Cell viability was
measured 48h after OA incubation by the MTT assay. Values are mean ± SEM of at least three independent experiments. ***
P≤0.001, when compared with respective control, analyzed by the Student’s t-test. # P≤0.05, ## P≤0.01, when compared with
each other by the Student’s t-test. + P≤0.05, +++ P≤0.001, when compared with the respective compound alone, analyzed by the
Student’s t-test.
Considering that the removal of cholesterol with MβCD protected OA-induced cell death,
that indicates that OA may be increasing cholesterol content of cellular membranes to levels that
have implications in cell viability under starvation conditions. Increased cholesterol content in
membranes generally decreases its fluidity that, in cells, are associated with mitochondrial
membrane condensation that leads to lower efficiency of the respiratory chain and increased
production of ROS [Bosch et al., 2011]. Free cholesterol overload also induced cell death in
smooth muscle cells accompanied with increased ROS levels and autophagy induction [Xu et al.,
2010]. However, here we observed lower levels of ROS in cells incubated with OA as compared
with controls. In addition, treatment of HepG2 cells with OA seems to inhibit autophagy at later
steps by affecting fusion of autophagosome with lysosomes. But previous results have found that
removal of cholesterol from membranes affect autophagosome-lysosome fusion and lysossomal
membrane permeability and pH [Koga et al., 2010; Deng et al., 2009], not corroborating,
therefore, the notion that OA is increasing cholesterol levels. But because UA also inhibited
autophagy without having the same effect in cell viability as OA, it denotes that we are in the
presence of a different effect that is specific of OA.
Interestingly, it was reported recently that OA and UA can integrate in lipid rafts (domains
rich in cholesterol and sphingomyelin) decreasing their cholesterol content [Bayer et al., 2011;

Results and Discussion
52
Chu et al., 2010; Koga et al., 2010; Prades et al., 2011]. This interference with cholesterol
homeostasis and structure of lipid rafts can explain triterpenoid’s distinct biological effects by
alterations of membrane lateral heterogeneity that will affect pivotal cellular functions, such as
membrane-associated proteins related to such domains, signal transduction pathways, fusion of
lysosomes with autophagosomes and endocytic pathways. Removal of cholesterol from lipid rafts
induced by triterpenoids may indirectly increase the cholesterol content in the remaining
membranes fractions (rich in phosphoglycerides) or along the boundaries between both, which
will affect also the function of the fluid phosphoglyceride membrane regions [Brown, 1998].
Therefore, an hypothesis for the protection afforded by the MβCD from OA-induced cell death
would be that MβCD is removing the harmful high cholesterol content present in the fluid
membrane regions that was withdraw from the lipid rafts by OA. But what would explain the
difference between UA and OA? Although these two compounds are isomers they differ in a
position of a methyl group and recently two different works also found differences in activity
between both. OA, but not UA, was able to possess photoprotection against ultraviolet A radiation
(UVAR) in human keratinocytes; both compounds integrate in the lipid rafts but only OA inhibited
UVAR-induced ceramide formation in lipid rafts [Bayer et al., 2011]. On the other hand, Prades et
al. (2011) used synthetic model membranes and found that UA are able to segregate cholesterol
from lipid rafts but maintains their structural order, whereas OA can have a deeper penetration in
membranes reducing the structural organization of lipid rafts by influencing its fluidity and
disturbing the presence of the liquid ordered cholesterol-rich domains. Interestingly, we found
that OA, but nor UA, induced bigger vacuolar LAMP-2-labbeled structures, which may link to
different effects that these compounds have in cholesterol-rich domains of lysosomes. LAMP-2
associates in a dynamic manner with these lipid microdomains at the lysosomal membrane for
regulated degradation in these regions [Rodriguez-Navarro and Cuervo, 2010]. Therefore, bigger
lysosomal structures with high content of LAMP-2 indicate lower cholesterol levels and disruption
of these lipid microdomains by OA, which is in agreement with observations by Prades et al.
(2011).
But a question remains to be answered: why these effects of OA greatly predispose cells
to death under starvation conditions? OA may be compromising the survival of cells under
starvation due to inhibition of autophagy. However, UA also inhibits autophagy but did not induce
extensive cell death. During metabolic stress autophagy inhibition also leads to apoptotic cell
death [Boya et al., 2005], and that was not observed here also. But if HepG2 are apoptotic

Results and Discussion
53
defective cells the outcome of autophagy inhibition would be necrosis or necroptosis [Degenhardt
et al., 2006; Farkas et al., 2011]. In our case, it may be happening a possible energy fall
together with autophagy inhibition and lysosomal dysfunction that will lead to some kind of
lysosomal-related cell death, which needs to be explored in further studies.
In conclusion, we have found that OA, but not its isomer UA, are able to induce cell
death in HCC HepG2 cells under starvation, probably due to the disruption of cholesterol
homeostasis and function in membranes and in cholesterol-rich lipid domains. OA can be viewed
in the future as a specific drug for cancer treatment in particular cell physiological conditions,
such as under metabolic stress that happens in central areas of tumors, or for sensitizing
resistant cancer cells to death during chemotherapy.

54

Final Remarks and Future PFinal Remarks and Future PFinal Remarks and Future PFinal Remarks and Future Perspectiveserspectiveserspectiveserspectives

56

Final Remarks and Future Perspectives
57
1.1.1.1. Final rFinal rFinal rFinal reeeemarksmarksmarksmarks and conclusionsand conclusionsand conclusionsand conclusions
Autophagy is induced in response to both anticancer therapy and in central areas of the
tumor as a survival mechanism during these periods of metabolic stress. Inhibition of cellular
self-digestion under starvation leads to cell death and is considered a novel approach for the
treatment of cancer. In this study, we investigate the effect of two isomers triterpenoids, UA and
OA, as potential chemotherapeutic agents of hepatocellular carcinoma cells. Our findings
demonstrated that HepG2 cells are more susceptible to death induced by OA than by UA both in
normal growth and starvation conditions. In addition, OA sensitized dramatically HepG2 cells to
cell death under starvation conditions, a mechanism that seems to be maintained also in other
cancer cells, such as in colorectal HCT116 cells. Comparing the effects of triterpenoids with that
of Rap in cell death and expression of several autophagic markers indicate that these compounds
have opposing effects in modulation of autophagy. Both OA and UA induce remarkable
accumulation of acidic vacuoles and the cellular levels of LC3 and p62, suggesting, therefore,
that these compounds act as autophagy inhibitors at the later steps of the process. However,
only OA, but not UA, caused significant cell death under starvation conditions, which indicates
that autophagy inhibition is probably not the cause of toxicity of OA under starvation. That was
confirmed by the use of pharmacological inhibitors of autophagosome formation, which also did
not prevent OA-induced cell death. Thus, autophagy seems to be not directly involved in cell
death induced by OA, but together with other cellular processes may contribute to the fate of
death of HepG2 cells under starvation conditions.
In following studies, we also have shown that ROS and JNK signalling seem to not be
involved in OA-induced cell death. Also, cell death induced by OA under starvation conditions
seems to not be apoptotic related. Considering the structural similarity of cholesterol with
triterpenoids and that cholesterol is an essential component of cellular membranes and control
important biological functions, we investigated whether OA could be promoting cell death by
changing cholesterol homeostasis. Removing cholesterol from membranes we observed that OA-
induced cell death was almost entirely reverted. In addition, OA, but not UA, was also able to
induce bigger lysosome structures with increased LAMP-2 immunostaining. Based on these
results and that of recently published in the literature, we suspect that OA is interfering with
cholesterol levels in lipid rafts decreasing their structural organization and fluidity. This needs to

Final Remarks and Future Perspectives
58
be confirmed in further studies, but that would explain the different cellular effects between OA
and UA. The methyl group of UA at C19 in the E-ring of the pentacyclic backbone makes that
structure more rigid as compared with OA, which could influence the location of the pentacyclic
moiety within the lipid bilayer and its effect on the lipid raft membrane domains.
The specific effect of OA on viability of cells under starvation conditions may, therefore,
result from the ability of this triterpenoid to reduce the structural organization of cholesterol-rich
domains that, in cells under metabolic stress, will have profound implications in several
important cellular structures and activities, such as lysosomes, autophagy, cell signaling,
endocytosis and mitochondria activity.
2.2.2.2. Future perspectivesFuture perspectivesFuture perspectivesFuture perspectives
With this study, a novel activity was found for OA that are specific for starvation
conditions and with possible applications in cancer treatment. However, many questions remain
to be answered, in particular the molecular mechanisms of induction of cell death by OA in
HepG2 cells under starvation conditions. Therefore, in following studies experiments should be
conducted in order to depict this interesting effect of OA. These cells, although originally isolated
from an hepatocarcinoma, are metabolically competent and resemble relatively well the biological
activities of normal hepatocytes. UA are usually more toxic than OA, but in these cells the
contrary was found. Thus, which are the particularities of HepG2 cells that make them more
susceptible to OA as compared with other cells? Would it be that because of their high metabolic
activity these cells depend more on functional membrane cholesterol-rich domains, which can be
disrupted by OA? Or due to interferences in the cellular lipid metabolism?
Related with the molecular mechanism of induction of cell death by OA much more
needs to be investigated. Based in our experiments, OA-induced cell death under starvation
conditions seems to not depend on ROS, JNK activity, autophagy inhibition and are not through
apoptosis. We should explore in future experiments the possible involvement of programmed
necrosis (necroptosis) and/or the lysosomal-type of cell death. In addition, disruption of calcium
homeostasis can also be involved and also dependent on pertubation of cholesterol content in
membranes. To this regard, the assessment of cholesterol content in membranes and lipid rafts

Final Remarks and Future Perspectives
59
fractions should be analysed in cells treated or not with OA under starvation conditions.
Expression of proteins that localized in microdomains rich in cholesterol, such as AKT and
SNAREs should be measured in lipid rafts fractions by western blotting. Other lipid rafts-related
proteins, such as caveolin 1 (CAV-1), should also be assessed by immunofluorescence. In
addition, the effect of addition of exogenous cholesterol to cells, instead of the removal as done
here, on the OA-induced cell death should also be evaluated. The experiments done to assess the
mitochondrial membrane potential with TMRM should be repeated, or done with other probe like
JC-1, to understand if mitochondria are entering in an energetic failure, which may contribute to
cell death. The expression of pAMPK by western blotting should also be evaluated to check the
possible energy fall (low ATP values).
The description and understanding of the cellular and molecular mechanisms of action of
OA in these particular conditions of metabolic stress will help in the future to the possible use of
OA as specific drug for cancer treatment in particular cell physiological conditions.
3.3.3.3. Funding and Funding and Funding and Funding and aaaacknowledgementscknowledgementscknowledgementscknowledgements
This work was supported by the Foundation for Science and Technology (FCT), Portugal,
through the research grant PTDC/QUI-BIQ/101392/2008 – NaturAge: Anti-aging properties of
natural compounds, which is co-funded by the program COMPETE (Programa Operacional
Factores de Competitividade) from QREN (Quadro de Referência Estratégico Nacional) with co-
participation from the European Community fund FEDER (Fundo Europeu de Desenvolvimento
Regional).
We thank Dr. Olga Coutinho from the Department of Biology, University of Minho, for a
gift of an aliquot of TMRM stock solution. We also thank Dr. Raquel Seruca, IPATIMUP, University
of Porto, for kindly providing the HCT116 cell line. We also want to acknowledge to Dr. Rui Silva
and to Dr. Manuela Corte-Real for the precious help in the cytometer.

60

ReferencesReferencesReferencesReferences

62

References
63
Abraham, D., Burger’s Medicinal chemistry and drug discovery: A John Wiley and Sons, Inc.,; 2003.
Adjei, A.A.; Hidalgo, M., Intracellular signal transduction pathway proteins as targets for cancer therapy. J Clin Oncol, 2005; 23: 5386-5403.
Alessi, D.R.; James, S.R.; Downes, C.P.; Holmes, A.B.; Gaffney, P.R.J.; Reese, C.B.; Cohen, P., Characterization of a 3-phosphoinositide-dependent protein kinase which phosphorylates and activates protein kinase B. Curr Biol, 1997; 7: 261-269.
Andjelkovic, M.; Alessi, D.R.; Meier, R.; Fernandez, A.; Lamb, N.J.; Frech, M.; Cron, P.; Cohen, P.; Lucocq, J.M.; Hemmings, B.A., Role of translocation in the activation and function of protein kinase B. J Biol Chem, 1997; 272: 31515-31524.
Arico, S.; Petiot, A.; Bauvy, C.; Dubbelhuis, P.F.; Meijer, A.J.; Codogno, P.; Ogier-Denis, E., The tumor suppressor PTEN positively regulates macroautophagy by inhibiting the phosphatidylinositol 3-kinase/protein kinase B pathway. J Biol Chem, 2001; 276: 35243-35246.
Avila, M.A.; Berasain, C.; Sangro, B.; Prieto, J., New therapies for hepatocellular carcinoma. Oncogene, 2006; 25: 3866-3884.
Azevedo, M.F.; Camsari, C.; Sa, C.M.; Lima, C.F.; Fernandes-Ferreira, M.; Pereira-Wilson, C., Ursolic acid and luteolin-7-glucoside improve lipid profiles and increase liver glycogen content through glycogen synthase kinase-3. Phytother Res, 2010; 24 Suppl 2: S220-224.
Backer, J.M., The regulation and function of Class III PI3Ks: novel roles for Vps34. Biochem J, 2008; 410: 1-17.
Balendran, A.; Casamayor, A.; Deak, M.; Paterson, A.; Gaffney, P.; Currie, R.; Downes, C.P.; Alessi, D.R., PDK1 acquires PDK2 activity in the presence of a synthetic peptide derived from the carboxyl terminus of PRK2. Curr Biol, 1999; 9: 393-404.
Bampton, E.T.; Goemans, C.G.; Niranjan, D.; Mizushima, N.; Tolkovsky, A.M., The dynamics of autophagy visualized in live cells: from autophagosome formation to fusion with endo/lysosomes. Autophagy, 2005; 1: 23-36.
Banno, N.; Akihisa, T.; Tokuda, H.; Yasukawa, K.; Higashihara, H.; Ukiya, M.; Watanabe, K.; Kimura, Y.; Hasegawa, J.; Nishino, H., Triterpene acids from the leaves of Perilla frutescens and their anti-inflammatory and antitumor-promoting effects. Biosci Biotechnol Biochem, 2004; 68: 85-90.
Bayer, M.; Proksch, P.; Felsner, I.; Brenden, H.; Kohne, Z.; Walli, R.; Duong, T.N.; Gotz, C.;
Krutmann, J.; Grether-Beck, S., Photoprotection against UVAR: effective triterpenoids require a lipid raft stabilizing chemical structure. Exp Dermatol, 2011; 20: 955-958.
Bergamini, E.; Bombara, M.; Del Roso, A.; Gori, Z.; Masiello, P.; Masini, M.; Pollera, M.; Vittorini, S., The regulation of liver protein degradation by aminoacids in vivo. Effects of glutamine and leucine. Arch Physiol Biochem, 1995; 103: 512-515.
Biederbick, A.; Kern, H.F.; Elsasser, H.P., Monodansylcadaverine (MDC) is a specific in vivo marker for autophagic vacuoles. Eur J Cell Biol, 1995; 66: 3-14.
Bishayee, A.; Ahmed, S.; Brankov, N.; Perloff, M., Triterpenoids as potential agents for the chemoprevention and therapy of breast cancer. Front Biosci, 2011; 16: 980-996.
Bjorkoy, G.; Lamark, T.; Pankiv, S.; Overvatn, A.; Brech, A.; Johansen, T., Monitoring autophagic degradation of p62/SQSTM1. Methods Enzymol, 2009; 452: 181-197.
Blommaart, E.F.; Luiken, J.J.; Meijer, A.J., Autophagic proteolysis: control and specificity. Histochem J, 1997a; 29: 365-385.
Blommaart, E.F.; Krause, U.; Schellens, J.P.; Vreeling-Sindelarova, H.; Meijer, A.J., The phosphatidylinositol 3-kinase inhibitors wortmannin and LY294002 inhibit autophagy in isolated rat hepatocytes. Eur J Biochem, 1997b; 243: 240-246.
Boffetta, P.; Hashibe, M., Alcohol and cancer. Lancet Oncol, 2006; 7: 149-156.
Bosch, M.; Mari, M.; Herms, A.; Fernandez, A.; Fajardo, A.; Kassan, A.; Giralt, A.; Colell, A.; Balgoma, D.; Barbero, E.; Gonzalez-Moreno, E.; Matias, N.; Tebar, F.; Balsinde, J.; Camps, M.; Enrich, C.; Gross, S.P.; Garcia-Ruiz, C.; Perez-Navarro, E.; Fernandez-Checa, J.C.; Pol, A., Caveolin-1 deficiency causes cholesterol-dependent mitochondrial dysfunction and apoptotic susceptibility. Curr Biol, 2011; 21: 681-686.
Boya, P.; Gonzalez-Polo, R.A.; Casares, N.; Perfettini, J.L.; Dessen, P.; Larochette, N.; Metivier, D.; Meley, D.; Souquere, S.; Yoshimori, T.; Pierron, G.; Codogno, P.; Kroemer, G., Inhibition of macroautophagy triggers apoptosis. Mol Cell Biol, 2005; 25: 1025-1040.
Brown, R.E., Sphingolipid organization in biomembranes: what physical studies of model membranes reveal. J Cell Sci, 1998; 111 ( Pt 1): 1-9.

References
64
Brunet, A.; Bonni, A.; Zigmond, M.J.; Lin, M.Z.; Juo, P.; Hu, L.S.; Anderson, M.J.; Arden, K.C.; Blenis, J.; Greenberg, M.E., Akt promotes cell survival by phosphorylating and inhibiting a Forkhead transcription factor. Cell, 1999; 96: 857-868.
Bursch, W.; Hochegger, K.; Torok, L.; Marian, B.; Ellinger, A.; Hermann, R.S., Autophagic and apoptotic types of programmed cell death exhibit different fates of cytoskeletal filaments. J Cell Sci, 2000; 113 ( Pt 7): 1189-1198.
Bursch, W.; Ellinger, A.; Kienzl, H.; Torok, L.; Pandey, S.; Sikorska, M.; Walker, R.; Hermann, R.S., Active cell death induced by the anti-estrogens tamoxifen and ICI 164 384 in human mammary carcinoma cells (MCF-7) in culture: the role of autophagy. Carcinogenesis, 1996; 17: 1595-1607.
Calder, P.C.; Yaqoob, P., Lipid rafts--composition, characterization, and controversies. J Nutr, 2007; 137: 545-547.
Cantley, L.C., The phosphoinositide 3-kinase pathway. Science, 2002; 296: 1655-1657.
Carr, B.I.; Kralian, S. Molecular Targeted Therapies for HCC. In: Carr, B.I., editor. 2nd ed, Hepatocellular carcinoma Diagnosis and Treatment: Humana Press; 2010. p. 590.
Chan, E.; Köchl, R.; Tooze, S.A. Cell Biology and Biochemistry of Autophagy. In: Deretic, V., editor, Autophagy in Immunity and Infection: WILEY-VCH Verlag GmbH & Co. KGaA, Weinheim, Germany; 2006a. p. 28.
Chan, E.Y.W.; Köchl, R.; Tooze, S.A. Cell Biology and Biochemistry of Autophagy. Autophagy in Immunity and Infection: Wiley-VCH Verlag GmbH & Co. KGaA; 2006b. p. 19-53.
Chang, Y.; Chen, L.; Liu, Y.; Hu, L.; Li, L.; Tu, Q.; Wang, R.; Wu, M.; Yang, J.; Wang, H., Inhibition of autophagy may suppress the development of hepatoblastoma. FEBS Journal, 2011; 278: 4811-4823.
Chen, X.G.; Liu, F.; Song, X.F.; Wang, Z.H.; Dong, Z.Q.; Hu, Z.Q.; Lan, R.Z.; Guan, W.; Zhou, T.G.; Xu, X.M.; Lei, H.; Ye, Z.Q.; Peng, E.J.; Du, L.H.; Zhuang, Q.Y., Rapamycin regulates Akt and ERK phosphorylation through mTORC1 and mTORC2 signaling pathways. Mol Carcinog, 2010; 49: 603-610.
Cheng, J.; Ohsaki, Y.; Tauchi-Sato, K.; Fujita, A.; Fujimoto, T., Cholesterol depletion induces autophagy. Biochem Biophys Res Commun, 2006; 351: 246-252.
Cheng, Y.; Qiu, F.; Tashiro, S.; Onodera, S.; Ikejima, T., ERK and JNK mediate TNFalpha-induced p53
activation in apoptotic and autophagic L929 cell death. Biochem Biophys Res Commun, 2008; 376: 483-488.
Chiesa, R.; Donato, F.; Tagger, A.; Favret, M.; Ribero, M.L.; Nardi, G.; Gelatti, U.; Bucella, E.; Tomasi, E.; Portolani, N.; Bonetti, M.; Bettini, L.; Pelizzari, G.; Salmi, A.; Savio, A.; Garatti, M.; Callea, F., Etiology of hepatocellular carcinoma in Italian patients with and without cirrhosis. Cancer Epidemiol Biomarkers Prev, 2000; 9: 213-216.
Chu, R.; Zhao, X.; Griffin, C.; Staub, R.E.; Shoemaker, M.; Climent, J.; Leitman, D.; Cohen, I.; Shtivelman, E.; Fong, S., Selective concomitant inhibition of mTORC1 and mTORC2 activity in estrogen receptor negative breast cancer cells by BN107 and oleanolic acid. Int J Cancer, 2010; 127: 1209-1219.
Chuang, S.C.; La Vecchia, C.; Boffetta, P., Liver cancer: descriptive epidemiology and risk factors other than HBV and HCV infection. Cancer Lett, 2009; 286: 9-14.
Cowan, M.M., Plant products as antimicrobial agents. Clin Microbiol Rev, 1999; 12: 564-582.
Cragg, G.M.; Newman, D.J.; Snader, K.M., Natural products in drug discovery and development. J Nat Prod, 1997; 60: 52-60.
Cuervo, A.M., Autophagy: in sickness and in health. Trends Cell Biol, 2004; 14: 70-77.
De Angel, R.E.; Smith, S.M.; Glickman, R.D.; Perkins, S.N.; Hursting, S.D., Antitumor effects of ursolic acid in a mouse model of postmenopausal breast cancer. Nutr Cancer, 2010; 62: 1074-1086.
De Duve, C.; Wattiaux, R., Functions of lysosomes. Annu Rev Physiol, 1966; 28: 435-492.
Degenhardt, K.; Mathew, R.; Beaudoin, B.; Bray, K.; Anderson, D.; Chen, G.; Mukherjee, C.; Shi, Y.; Gelinas, C.; Fan, Y.; Nelson, D.A.; Jin, S.; White, E., Autophagy promotes tumor cell survival and restricts necrosis, inflammation, and tumorigenesis. Cancer Cell, 2006; 10: 51-64.
Deng, D.; Jiang, N.; Hao, S.J.; Sun, H.; Zhang, G.J., Loss of membrane cholesterol influences lysosomal permeability to potassium ions and protons. Biochim Biophys Acta, 2009; 1788: 470-476.
Domin, J.; Harper, L.; Aubyn, D.; Wheeler, M.; Florey, O.; Haskard, D.; Yuan, M.; Zicha, D., The class II phosphoinositide 3-kinase PI3K-C2beta regulates cell migration by a PtdIns3P dependent mechanism. J Cell Physiol, 2005; 205: 452-462.
Edinger, A.L.; Thompson, C.B., Defective autophagy leads to cancer. Cancer Cell, 2003; 4: 422-424.
References
65
El-Serag, H.B.; Rudolph, K.L., Hepatocellular carcinoma: epidemiology and molecular carcinogenesis. Gastroenterology, 2007; 132: 2557-2576.
Engelman, J.A.; Luo, J.; Cantley, L.C., The evolution of phosphatidylinositol 3-kinases as regulators of growth and metabolism. Nat Rev Genet, 2006; 7: 606-619.
Eskelinen, E.L.; Saftig, P., Autophagy: a lysosomal degradation pathway with a central role in health and disease. Biochim Biophys Acta, 2009; 1793: 664-673.
Faivre, S.; Kroemer, G.; Raymond, E., Current development of mTOR inhibitors as anticancer agents. Nat Rev Drug Discov, 2006; 5: 671-688.
Farkas, T.; Hoyer-Hansen, M.; Jaattela, M., Identification of novel autophagy regulators by a luciferase-based assay for the kinetics of autophagic flux. Autophagy, 2009; 5: 1018-1025.
Farkas, T.; Daugaard, M.; Jaattela, M., Identification of small molecule inhibitors of phosphatidylinositol 3-kinase and autophagy. J Biol Chem, 2011; 286: 38904-38912.
Foster, D.A.; Toschi, A., Targeting mTOR with rapamycin: one dose does not fit all. Cell Cycle, 2009; 8: 1026-1029.
Fujimori, M.; Tokino, T.; Hino, O.; Kitagawa, T.; Imamura, T.; Okamoto, E.; Mitsunobu, M.; Ishikawa, T.; Nakagama, H.; Harada, H.; et al., Allelotype study of primary hepatocellular carcinoma. Cancer Res, 1991; 51: 89-93.
Furuya, N.; Yu, J.; Byfield, M.; Pattingre, S.; Levine, B., The evolutionarily conserved domain of Beclin 1 is required for Vps34 binding, autophagy and tumor suppressor function. Autophagy, 2005; 1: 46-52.
Gallegos, A.M.; Atshaves, B.P.; Storey, S.; Schoer, J.; Kier, A.B.; Schroeder, F., Molecular and fluorescent sterol approaches to probing lysosomal membrane lipid dynamics. Chem Phys Lipids, 2002; 116: 19-38.
Galluzzi, L.; Aaronson, S.A.; Abrams, J.; Alnemri, E.S.; Andrews, D.W.; Baehrecke, E.H.; Bazan, N.G.; Blagosklonny, M.V.; Blomgren, K.; Borner, C.; Bredesen, D.E.; Brenner, C.; Castedo, M.; Cidlowski, J.A.; Ciechanover, A.; Cohen, G.M.; De Laurenzi, V.; De Maria, R.; Deshmukh, M.; Dynlacht, B.D.; El-Deiry, W.S.; Flavell, R.A.; Fulda, S.; Garrido, C.; Golstein, P.; Gougeon, M.L.; Green, D.R.; Gronemeyer, H.; Hajnoczky, G.; Hardwick, J.M.; Hengartner, M.O.; Ichijo, H.; Jaattela, M.; Kepp, O.; Kimchi, A.; Klionsky, D.J.; Knight, R.A.; Kornbluth, S.; Kumar, S.; Levine, B.; Lipton, S.A.; Lugli, E.; Madeo, F.; Malomi, W.; Marine, J.C.; Martin, S.J.;
Medema, J.P.; Mehlen, P.; Melino, G.; Moll, U.M.; Morselli, E.; Nagata, S.; Nicholson, D.W.; Nicotera, P.; Nunez, G.; Oren, M.; Penninger, J.; Pervaiz, S.; Peter, M.E.; Piacentini, M.; Prehn, J.H.; Puthalakath, H.; Rabinovich, G.A.; Rizzuto, R.; Rodrigues, C.M.; Rubinsztein, D.C.; Rudel, T.; Scorrano, L.; Simon, H.U.; Steller, H.; Tschopp, J.; Tsujimoto, Y.; Vandenabeele, P.; Vitale, I.; Vousden, K.H.; Youle, R.J.; Yuan, J.; Zhivotovsky, B.; Kroemer, G., Guidelines for the use and interpretation of assays for monitoring cell death in higher eukaryotes. Cell Death Differ, 2009; 16: 1093-1107.
Ganley, I.G.; Lam du, H.; Wang, J.; Ding, X.; Chen, S.; Jiang, X., ULK1.ATG13.FIP200 complex mediates mTOR signaling and is essential for autophagy. J Biol Chem, 2009; 284: 12297-12305.
Gao, X.; Zhang, Y.; Arrazola, P.; Hino, O.; Kobayashi, T.; Yeung, R.S.; Ru, B.; Pan, D., Tsc tumour suppressor proteins antagonize amino-acid-TOR signalling. Nat Cell Biol, 2002; 4: 699-704.
Gordaliza, M., Natural products as leads to anticancer drugs. Clin Transl Oncol, 2007; 9: 767-776.
Grisham, J.W. Molecular genetic alterations in primary hepatocellular neoplasms:hepatocellular adenoma, hepatocellular carcinoma, and hepatoblastoma: Humana Press; 2001.
Guertin, D.A.; Sabatini, D.M., The pharmacology of mTOR inhibition. Sci Signal, 2009; 2: pe24.
Harmand, P.O.; Duval, R.; Liagre, B.; Jayat-Vignoles, C.; Beneytout, J.L.; Delage, C.; Simon, A., Ursolic acid induces apoptosis through caspase-3 activation and cell cycle arrest in HaCat cells. Int J Oncol, 2003; 23: 105-112.
He, C.; Klionsky, D.J., Regulation mechanisms and signaling pathways of autophagy. Annu Rev Genet, 2009; 43: 67-93.
Hennings, H.; Glick, A.B.; Greenhalgh, D.A.; Morgan, D.L.; Strickland, J.E.; Tennenbaum, T.; Yuspa, S.H., Critical aspects of initiation, promotion, and progression in multistage epidermal carcinogenesis. Proc Soc Exp Biol Med, 1993; 202: 1-8.
Hosokawa, N.; Hara, T.; Kaizuka, T.; Kishi, C.; Takamura, A.; Miura, Y.; Iemura, S.; Natsume, T.; Takehana, K.; Yamada, N.; Guan, J.L.; Oshiro, N.; Mizushima, N., Nutrient-dependent mTORC1 association with the ULK1-Atg13-FIP200 complex required for autophagy. Mol Biol Cell, 2009; 20: 1981-1991.
Hoyer-Hansen, M.; Jaattela, M., AMP-activated protein kinase: a universal regulator of autophagy? Autophagy, 2007; 3: 381-383.

References
66
Hu, T.H.; Huang, C.C.; Lin, P.R.; Chang, H.W.; Ger, L.P.; Lin, Y.W.; Changchien, C.S.; Lee, C.M.; Tai, M.H., Expression and prognostic role of tumor suppressor gene PTEN/MMAC1/TEP1 in hepatocellular carcinoma. Cancer, 2003; 97: 1929-1940.
Huynh, H., Molecularly targeted therapy in hepatocellular carcinoma. Biochem Pharmacol, 2010; 80: 550-560.
Ichimura, Y.; Komatsu, M., Selective degradation of p62 by autophagy. Semin Immunopathol, 2010; 32: 431-436.
Ichimura, Y.; Kirisako, T.; Takao, T.; Satomi, Y.; Shimonishi, Y.; Ishihara, N.; Mizushima, N.; Tanida, I.; Kominami, E.; Ohsumi, M.; Noda, T.; Ohsumi, Y., A ubiquitin-like system mediates protein lipidation. Nature, 2000; 408: 488-492.
Ikonen, E., Roles of lipid rafts in membrane transport. Curr Opin Cell Biol, 2001; 13: 470-477.
Inbal, B.; Bialik, S.; Sabanay, I.; Shani, G.; Kimchi, A., DAP kinase and DRP-1 mediate membrane blebbing and the formation of autophagic vesicles during programmed cell death. J Cell Biol, 2002; 157: 455-468.
Inoki, K.; Ouyang, H.; Zhu, T.; Lindvall, C.; Wang, Y.; Zhang, X.; Yang, Q.; Bennett, C.; Harada, Y.; Stankunas, K.; Wang, C.Y.; He, X.; MacDougald, O.A.; You, M.; Williams, B.O.; Guan, K.L., TSC2 integrates Wnt and energy signals via a coordinated phosphorylation by AMPK and GSK3 to regulate cell growth. Cell, 2006; 126: 955-968.
Jacinto, E.; Loewith, R.; Schmidt, A.; Lin, S.; Ruegg, M.A.; Hall, A.; Hall, M.N., Mammalian TOR complex 2 controls the actin cytoskeleton and is rapamycin insensitive. Nat Cell Biol, 2004; 6: 1122-1128.
Jia, Y.; Bhuiyan, M.J.H.; Jun, H.-j.; Lee, J.H.; Hoang, M.H.; Lee, H.-J.; Kim, N.; Lee, D.; Hwang, K.Y.; Hwang, B.Y.; Choi, D.-W.; Lee, S.-J., Ursolic acid is a PPAR-α agonist that regulates hepatic lipid
metabolism. Bioorganic & Medicinal Chemistry Letters, 2011; 21: 5876-5880.
Jung, C.H.; Jun, C.B.; Ro, S.H.; Kim, Y.M.; Otto, N.M.; Cao, J.; Kundu, M.; Kim, D.H., ULK-Atg13-FIP200 complexes mediate mTOR signaling to the autophagy machinery. Mol Biol Cell, 2009; 20: 1992-2003.
Kabeya, Y.; Mizushima, N.; Yamamoto, A.; Oshitani-Okamoto, S.; Ohsumi, Y.; Yoshimori, T., LC3, GABARAP and GATE16 localize to autophagosomal membrane depending on form-II formation. J Cell Sci, 2004; 117: 2805-2812.
Kabeya, Y.; Mizushima, N.; Ueno, T.; Yamamoto, A.; Kirisako, T.; Noda, T.; Kominami, E.; Ohsumi, Y.; Yoshimori, T., LC3, a mammalian homologue of yeast Apg8p, is localized in autophagosome membranes after processing. EMBO J, 2000; 19: 5720-5728.
Kadowaki, M.; Karim, M.R.; Carpi, A.; Miotto, G., Nutrient control of macroautophagy in mammalian cells. Mol Aspects Med, 2006; 27: 426-443.
Kanjoormana, M.; Kuttan, G., Antiangiogenic activity of ursolic acid. Integr Cancer Ther, 2010; 9: 224-235.
Katso, R.; Okkenhaug, K.; Ahmadi, K.; White, S.; Timms, J.; Waterfield, M.D., Cellular function of phosphoinositide 3-kinases: implications for development, homeostasis, and cancer. Annu Rev Cell Dev Biol, 2001; 17: 615-675.
Kihara, A.; Noda, T.; Ishihara, N.; Ohsumi, Y., Two distinct Vps34 phosphatidylinositol 3-kinase complexes function in autophagy and carboxypeptidase Y sorting in Saccharomyces cerevisiae. J Cell Biol, 2001; 152: 519-530.
Kim, D.K.; Baek, J.H.; Kang, C.M.; Yoo, M.A.; Sung, J.W.; Chung, H.Y.; Kim, N.D.; Choi, Y.H.; Lee, S.H.; Kim, K.W., Apoptotic activity of ursolic acid may correlate with the inhibition of initiation of DNA replication. Int J Cancer, 2000; 87: 629-636.
Kim, E.; Goraksha-Hicks, P.; Li, L.; Neufeld, T.P.; Guan, K.L., Regulation of TORC1 by Rag GTPases in nutrient response. Nat Cell Biol, 2008a; 10: 935-945.
Kim, K.W.; Hwang, M.; Moretti, L.; Jaboin, J.J.; Cha, Y.I.; Lu, B., Autophagy upregulation by inhibitors of caspase-3 and mTOR enhances radiotherapy in a mouse model of lung cancer. Autophagy, 2008b; 4: 659-668.
Kirschke, H.; Wiederanders, B., Lysosomal proteinases. Acta Histochem, 1987; 82: 2-4.
Klionsky, D.J., Cell biology: regulated self-cannibalism. Nature, 2004; 431: 31-32.
Klionsky, D.J.; Emr, S.D., Autophagy as a regulated pathway of cellular degradation. Science, 2000; 290: 1717-1721.
Knowles, M.; Selby, P.J. Introduction to the Cellular and Molecular Biology of Cancer. Fourth Edition ed: Oxford University Press 2005.
Koga, H.; Kaushik, S.; Cuervo, A.M., Altered lipid content inhibits autophagic vesicular fusion. FASEB J, 2010; 24: 3052-3065.
Kondo, Y.; Kanzawa, T.; Sawaya, R.; Kondo, S., The role of autophagy in cancer development and

References
67
response to therapy. Nat Rev Cancer, 2005; 5: 726-734.
Kopnin, B.P., Targets of oncogenes and tumor suppressors: key for understanding basic mechanisms of carcinogenesis. Biochemistry (Mosc), 2000; 65: 2-27.
Kouri, J.B.; Rojas, L.; Perez, E.; Abbud-Lozoya, K.A., Modifications of Golgi complex in chondrocytes from osteoarthrotic (OA) rat cartilage. J Histochem Cytochem, 2002; 50: 1333-1340.
Kroemer, G.; Marino, G.; Levine, B., Autophagy and the integrated stress response. Mol Cell, 2010; 40: 280-293.
Laszczyk, M.N., Pentacyclic triterpenes of the lupane, oleanane and ursane group as tools in cancer therapy. Planta Med, 2009; 75: 1549-1560.
Levine, A.J., p53, the cellular gatekeeper for growth and division. Cell, 1997; 88: 323-331.
Liang, C.; Feng, P.; Ku, B.; Dotan, I.; Canaani, D.; Oh, B.H.; Jung, J.U., Autophagic and tumour suppressor activity of a novel Beclin1-binding protein UVRAG. Nat Cell Biol, 2006; 8: 688-699.
Liang, X.H.; Jackson, S.; Seaman, M.; Brown, K.; Kempkes, B.; Hibshoosh, H.; Levine, B., Induction of autophagy and inhibition of tumorigenesis by beclin 1. Nature, 1999; 402: 672-676.
Lima, C.F.; Pereira-Wilson, C.; Rattan, S.I., Curcumin induces heme oxygenase-1 in normal human skin fibroblasts through redox signaling: relevance for anti-aging intervention. Mol Nutr Food Res, 2011; 55: 430-442.
Lin, C.C.; Huang, C.Y.; Mong, M.C.; Chan, C.Y.; Yin, M.C., Antiangiogenic potential of three triterpenic acids in human liver cancer cells. J Agric Food Chem, 2011; 59: 755-762.
Lin, Y.; Vermeer, M.A.; E, A.T., Triterpenic Acids Present in Hawthorn Lower Plasma Cholesterol by Inhibiting Intestinal ACAT Activity in Hamsters. Evid Based Complement Alternat Med, 2009.
Lindmo, K.; Stenmark, H., Regulation of membrane traffic by phosphoinositide 3-kinases. J Cell Sci, 2006; 119: 605-614.
Liu, J., Pharmacology of oleanolic acid and ursolic acid. J Ethnopharmacol, 1995; 49: 57-68.
Llovet, J.M.; Bruix, J., Molecular targeted therapies in hepatocellular carcinoma. Hepatology, 2008; 48: 1312-1327.
Long, X.; Ortiz-Vega, S.; Lin, Y.; Avruch, J., Rheb binding to mammalian target of rapamycin (mTOR) is regulated by amino acid sufficiency. J Biol Chem, 2005; 280: 23433-23436.
LoPiccolo, J.; Blumenthal, G.M.; Bernstein, W.B.; Dennis, P.A., Targeting the PI3K/Akt/mTOR pathway: effective combinations and clinical considerations. Drug Resist Updat, 2008; 11: 32-50.
Mammucari, C.; Milan, G.; Romanello, V.; Masiero, E.; Rudolf, R.; Del Piccolo, P.; Burden, S.J.; Di Lisi, R.; Sandri, C.; Zhao, J.; Goldberg, A.L.; Schiaffino, S.; Sandri, M., FoxO3 controls autophagy in skeletal muscle in vivo. Cell Metab, 2007; 6: 458-471.
Manning, B.D.; Cantley, L.C., AKT/PKB signaling: navigating downstream. Cell, 2007; 129: 1261-1274.
Martin, S.; Parton, R.G., Lipid droplets: a unified view of a dynamic organelle. Nat Rev Mol Cell Biol, 2006; 7: 373-378.
Mathew, R.; Karp, C.M.; Beaudoin, B.; Vuong, N.; Chen, G.; Chen, H.Y.; Bray, K.; Reddy, A.; Bhanot, G.; Gelinas, C.; Dipaola, R.S.; Karantza-Wadsworth, V.; White, E., Autophagy suppresses tumorigenesis through elimination of p62. Cell, 2009; 137: 1062-1075.
Mehta, K.; Siddik, Z.H. Drug Resistance in Cancer Cells: Springer; 2009.
Meijer, A.J.; Codogno, P., Regulation and role of autophagy in mammalian cells. Int J Biochem Cell Biol, 2004; 36: 2445-2462.
Mizushima, N., Autophagy: process and function. Genes Dev, 2007; 21: 2861-2873.
Mizushima, N.; Klionsky, D.J., Protein turnover via autophagy: implications for metabolism. Annu Rev Nutr, 2007; 27: 19-40.
Mizushima, N.; Yoshimori, T.; Levine, B., Methods in mammalian autophagy research. Cell, 2010; 140: 313-326.
Mizushima, N.; Yamamoto, A.; Matsui, M.; Yoshimori, T.; Ohsumi, Y., In vivo analysis of autophagy in response to nutrient starvation using transgenic mice expressing a fluorescent autophagosome marker. Mol Biol Cell, 2004; 15: 1101-1111.
Mortimore, G.E.; Schworer, C.M., Induction of autophagy by amino-acid deprivation in perfused rat liver. Nature, 1977; 270: 174-176.
Mortimore, G.E.; Poso, A.R., Intracellular protein catabolism and its control during nutrient deprivation and supply. Annu Rev Nutr, 1987; 7: 539-564.
Mortimore, G.E.; Khurana, K.K.; Miotto, G., Amino acid control of proteolysis in perfused livers of synchronously fed rats. Mechanism and specificity

References
68
of alanine co-regulation. J Biol Chem, 1991; 266: 1021-1028.
Motola-Kuba, D.; Zamora-Valdés, D.; Uribe, M.; Méndez-Sánchez, N., Hepatocellular carcinoma. An overview. Annals of Hepatology 2006; 5: 16-24.
Munafo, D.B.; Colombo, M.I., A novel assay to study autophagy: regulation of autophagosome vacuole size by amino acid deprivation. J Cell Sci, 2001; 114: 3619-3629.
Nakatogawa, H.; Ichimura, Y.; Ohsumi, Y., Atg8, a ubiquitin-like protein required for autophagosome formation, mediates membrane tethering and hemifusion. Cell, 2007; 130: 165-178.
Neely, A.N.; Cox, J.R.; Fortney, J.A.; Schworer, C.M.; Mortimore, G.E., Alterations of lysosomal size and density during rat liver perfusion. Suppression by insulin and amino acids. J Biol Chem, 1977; 252: 6948-6954.
Newman, D.J.; Cragg, G.M.; Snader, K.M., The influence of natural products upon drug discovery. Nat Prod Rep, 2000; 17: 215-234.
Nice, D.C.; Sato, T.K.; Stromhaug, P.E.; Emr, S.D.; Klionsky, D.J., Cooperative binding of the cytoplasm to vacuole targeting pathway proteins, Cvt13 and Cvt20, to phosphatidylinositol 3-phosphate at the pre-autophagosomal structure is required for selective autophagy. J Biol Chem, 2002; 277: 30198-30207.
Nicklin, P.; Bergman, P.; Zhang, B.; Triantafellow, E.; Wang, H.; Nyfeler, B.; Yang, H.; Hild, M.; Kung, C.; Wilson, C.; Myer, V.E.; MacKeigan, J.P.; Porter, J.A.; Wang, Y.K.; Cantley, L.C.; Finan, P.M.; Murphy, L.O., Bidirectional transport of amino acids regulates mTOR and autophagy. Cell, 2009; 136: 521-534.
Nobili, S.; Lippi, D.; Witort, E.; Donnini, M.; Bausi, L.; Mini, E.; Capaccioli, S., Natural compounds for cancer treatment and prevention. Pharmacol Res, 2009; 59: 365-378.
Nogueira, V.; Park, Y.; Chen, C.C.; Xu, P.Z.; Chen, M.L.; Tonic, I.; Unterman, T.; Hay, N., Akt determines replicative senescence and oxidative or oncogenic premature senescence and sensitizes cells to oxidative apoptosis. Cancer Cell, 2008; 14: 458-470.
O'Reilly, K.E.; Rojo, F.; She, Q.B.; Solit, D.; Mills, G.B.; Smith, D.; Lane, H.; Hofmann, F.; Hicklin, D.J.; Ludwig, D.L.; Baselga, J.; Rosen, N., mTOR inhibition induces upstream receptor tyrosine kinase signaling and activates Akt. Cancer Res, 2006; 66: 1500-1508.
Odorizzi, G.; Babst, M.; Emr, S.D., Phosphoinositide signaling and the regulation of membrane trafficking in yeast. Trends Biochem Sci, 2000; 25: 229-235.
Ogier-Denis, E.; Codogno, P., Autophagy: a barrier or an adaptive response to cancer. Biochim Biophys Acta, 2003; 1603: 113-128.
Ohtani, Y.; Irie, T.; Uekama, K.; Fukunaga, K.; Pitha, J., Differential effects of alpha-, beta- and gamma-cyclodextrins on human erythrocytes. Eur J Biochem, 1989; 186: 17-22.
Orr-Weaver, T.L.; Weinberg, R.A., A checkpoint on the road to cancer. Nature, 1998; 392: 223-224.
Oshiro, N.; Yoshino, K.; Hidayat, S.; Tokunaga, C.; Hara, K.; Eguchi, S.; Avruch, J.; Yonezawa, K., Dissociation of raptor from mTOR is a mechanism of rapamycin-induced inhibition of mTOR function. Genes Cells, 2004; 9: 359-366.
Ozturk, M., Genetic aspects of hepatocellular carcinogenesis. Semin Liver Dis, 1999; 19: 235-242.
Paglin, S.; Hollister, T.; Delohery, T.; Hackett, N.; McMahill, M.; Sphicas, E.; Domingo, D.; Yahalom, J., A novel response of cancer cells to radiation involves autophagy and formation of acidic vesicles. Cancer Res, 2001; 61: 439-444.
Parkin, D.M.; Bray, F.; Ferlay, J.; Pisani, P., Global cancer statistics, 2002. CA Cancer J Clin, 2005; 55: 74-108.
Periyasamy-Thandavan, S.; Jiang, M.; Schoenlein, P.; Dong, Z., Autophagy: molecular machinery, regulation, and implications for renal pathophysiology. Am J Physiol Renal Physiol, 2009; 297: F244-256.
Petiot, A.; Ogier-Denis, E.; Blommaart, E.F.; Meijer, A.J.; Codogno, P., Distinct classes of phosphatidylinositol 3'-kinases are involved in signaling pathways that control macroautophagy in HT-29 cells. J Biol Chem, 2000; 275: 992-998.
Petronelli, A.; Pannitteri, G.; Testa, U., Triterpenoids as new promising anticancer drugs. Anticancer Drugs, 2009; 20: 880-892.
Pfeifer, U., Inhibition by insulin of the formation of autophagic vacuoles in rat liver. A morphometric approach to the kinetics of intracellular degradation by autophagy. J Cell Biol, 1978; 78: 152-167.
Phillips, D.R.; Rasbery, J.M.; Bartel, B.; Matsuda, S.P., Biosynthetic diversity in plant triterpene cyclization. Curr Opin Plant Biol, 2006; 9: 305-314.
Plas, D.R.; Thompson, C.B., Cell metabolism in the regulation of programmed cell death. Trends Endocrinol Metab, 2002; 13: 75-78.

References
69
Polesel, J.; Talamini, R.; Montella, M.; Parpinel, M.; Dal Maso, L.; Crispo, A.; Crovatto, M.; Spina, M.; La Vecchia, C.; Franceschi, S., Linoleic acid, vitamin D and other nutrient intakes in the risk of non-Hodgkin lymphoma: an Italian case-control study. Ann Oncol, 2006; 17: 713-718.
Prades, J.; Vogler, O.; Alemany, R.; Gomez-Florit, M.; Funari, S.S.; Ruiz-Gutierrez, V.; Barcelo, F., Plant pentacyclic triterpenic acids as modulators of lipid membrane physical properties. Biochim Biophys Acta, 2011; 1808: 752-760.
Price, K.R.; Johnson, I.T.; Fenwick, G.R., The chemistry and biological significance of saponins in foods and feedingstuffs. Crit Rev Food Sci Nutr, 1987; 26: 27-135.
Ramos, A.A.; Pereira-Wilson, C.; Collins, A.R., Protective effects of ursolic acid and luteolin against oxidative DNA damage include enhancement of DNA repair in Caco-2 cells. Mutat Res, 2010; 692: 6-11.
Rautou, P.E.; Mansouri, A.; Lebrec, D.; Durand, F.; Valla, D.; Moreau, R., Autophagy in liver diseases. J Hepatol, 2010; 53: 1123-1134.
Ravikumar, B.; Sarkar, S.; Davies, J.E.; Futter, M.; Garcia-Arencibia, M.; Green-Thompson, Z.W.; Jimenez-Sanchez, M.; Korolchuk, V.I.; Lichtenberg, M.; Luo, S.; Massey, D.C.; Menzies, F.M.; Moreau, K.; Narayanan, U.; Renna, M.; Siddiqi, F.H.; Underwood, B.R.; Winslow, A.R.; Rubinsztein, D.C., Regulation of mammalian autophagy in physiology and pathophysiology. Physiol Rev, 2010; 90: 1383-1435.
Rodriguez-Navarro, J.A.; Cuervo, A.M., Autophagy and lipids: tightening the knot. Semin Immunopathol, 2010; 32: 343-353.
Roy, S.; Debnath, J., Autophagy and tumorigenesis. Semin Immunopathol, 2010; 32: 383-396.
Sahin, F.; Kannangai, R.; Adegbola, O.; Wang, J.; Su, G.; Torbenson, M., mTOR and P70 S6 kinase expression in primary liver neoplasms. Clin Cancer Res, 2004; 10: 8421-8425.
Santos, S.C.; Lacronique, V.; Bouchaert, I.; Monni, R.; Bernard, O.; Gisselbrecht, S.; Gouilleux, F., Constitutively active STAT5 variants induce growth and survival of hematopoietic cells through a PI 3-kinase/Akt dependent pathway. Oncogene, 2001; 20: 2080-2090.
Sarbassov, D.D.; Ali, S.M.; Sabatini, D.M., Growing roles for the mTOR pathway. Curr Opin Cell Biol, 2005a; 17: 596-603.
Sarbassov, D.D.; Guertin, D.A.; Ali, S.M.; Sabatini, D.M., Phosphorylation and regulation of Akt/PKB by
the rictor-mTOR complex. Science, 2005b; 307: 1098-1101.
Sarbassov, D.D.; Ali, S.M.; Kim, D.H.; Guertin, D.A.; Latek, R.R.; Erdjument-Bromage, H.; Tempst, P.; Sabatini, D.M., Rictor, a novel binding partner of mTOR, defines a rapamycin-insensitive and raptor-independent pathway that regulates the cytoskeleton. Curr Biol, 2004; 14: 1296-1302.
Schu, P.V.; Takegawa, K.; Fry, M.J.; Stack, J.H.; Waterfield, M.D.; Emr, S.D., Phosphatidylinositol 3-kinase encoded by yeast VPS34 gene essential for protein sorting. Science, 1993; 260: 88-91.
Scott, R.C.; Schuldiner, O.; Neufeld, T.P., Role and regulation of starvation-induced autophagy in the Drosophila fat body. Dev Cell, 2004; 7: 167-178.
Seglen, P.O.; Gordon, P.B.; Poli, A., Amino acid inhibition of the autophagic/lysosomal pathway of protein degradation in isolated rat hepatocytes. Biochim Biophys Acta, 1980; 630: 103-118.
Seki, S.; Sakaguchi, H.; Kitada, T.; Tamori, A.; Takeda, T.; Kawada, N.; Habu, D.; Nakatani, K.; Nishiguchi, S.; Shiomi, S., Outcomes of dysplastic nodules in human cirrhotic liver: a clinicopathological study. Clin Cancer Res, 2000; 6: 3469-3473.
Setzer, W.N.; Setzer, M.C., Plant-derived triterpenoids as potential antineoplastic agents. Mini Rev Med Chem, 2003; 3: 540-556.
Shibata, M.; Yoshimura, K.; Furuya, N.; Koike, M.; Ueno, T.; Komatsu, M.; Arai, H.; Tanaka, K.; Kominami, E.; Uchiyama, Y., The MAP1-LC3 conjugation system is involved in lipid droplet formation. Biochem Biophys Res Commun, 2009; 382: 419-423.
Shintani, T.; Klionsky, D.J., Autophagy in health and disease: a double-edged sword. Science, 2004; 306: 990-995.
Shtutman, M.; Zhurinsky, J.; Simcha, I.; Albanese, C.; D'Amico, M.; Pestell, R.; Ben-Ze'ev, A., The cyclin D1 gene is a target of the beta-catenin/LEF-1 pathway. Proc Natl Acad Sci U S A, 1999; 96: 5522-5527.
Shyu, M.H.; Kao, T.C.; Yen, G.C., Oleanolic acid and ursolic acid induce apoptosis in HuH7 human hepatocellular carcinoma cells through a mitochondrial-dependent pathway and downregulation of XIAP. J Agric Food Chem, 2010; 58: 6110-6118.
Singh, R.; Cuervo, A.M., Autophagy in the cellular energetic balance. Cell Metab, 2011; 13: 495-504.
Singh, R.; Kaushik, S.; Wang, Y.; Xiang, Y.; Novak, I.; Komatsu, M.; Tanaka, K.; Cuervo, A.M.; Czaja, M.J.,

References
70
Autophagy regulates lipid metabolism. Nature, 2009a; 458: 1131-1135.
Singh, R.; Xiang, Y.; Wang, Y.; Baikati, K.; Cuervo, A.M.; Luu, Y.K.; Tang, Y.; Pessin, J.E.; Schwartz, G.J.; Czaja, M.J., Autophagy regulates adipose mass and differentiation in mice. J Clin Invest, 2009b; 119: 3329-3339.
Sinha, S.; Levine, B., The autophagy effector Beclin 1: a novel BH3-only protein. Oncogene, 2008; 27 Suppl 1: S137-148.
Sohn, K.H.; Lee, H.Y.; Chung, H.Y.; Young, H.S.; Yi, S.Y.; Kim, K.W., Anti-angiogenic activity of triterpene acids. Cancer Lett, 1995; 94: 213-218.
Sridharan, S.; Jain, K.; Basu, A., Regulation of Autophagy by Kinases. Cancers, 2011; 3: 2630-2654.
Stennicke, H.R.; Ryan, C.A.; Salvesen, G.S., Reprieval from execution: the molecular basis of caspase inhibition. Trends Biochem Sci, 2002; 27: 94-101.
Stokoe, D.; Stephens, L.R.; Copeland, T.; Gaffney, P.R.J.; Reese, C.B.; Painter, G.F.; Holmes, A.B.; McCormick, F.; Hawkins, P.T., Dual Role of Phosphatidylinositol-3,4,5-trisphosphate in the Activation of Protein Kinase B. Science, 1997; 277: 567-570.
Stromhaug, P.E.; Berg, T.O.; Fengsrud, M.; Seglen, P.O., Purification and characterization of autophagosomes from rat hepatocytes. Biochem J, 1998; 335 ( Pt 2): 217-224.
Stryer, L.; Berg, J.M.; Tymoczko, J.L. Biochemistry. 5th edition ed: W. H. Freeman and Company; 2002.
Sun, Q.; Fan, W.; Chen, K.; Ding, X.; Chen, S.; Zhong, Q., Identification of Barkor as a mammalian autophagy-specific factor for Beclin 1 and class III phosphatidylinositol 3-kinase. Proc Natl Acad Sci U S A, 2008; 105: 19211-19216.
Takahashi, Y.; Coppola, D.; Matsushita, N.; Cualing, H.D.; Sun, M.; Sato, Y.; Liang, C.; Jung, J.U.; Cheng, J.Q.; Mule, J.J.; Pledger, W.J.; Wang, H.G., Bif-1 interacts with Beclin 1 through UVRAG and regulates autophagy and tumorigenesis. Nat Cell Biol, 2007; 9: 1142-1151.
Takayama, T.; Makuuchi, M.; Hirohashi, S.; Sakamoto, M.; Okazaki, N.; Takayasu, K.; Kosuge, T.; Motoo, Y.; Yamazaki, S.; Hasegawa, H., Malignant transformation of adenomatous hyperplasia to hepatocellular carcinoma. Lancet, 1990; 336: 1150-1153.
Tal, M.C.; Sasai, M.; Lee, H.K.; Yordy, B.; Shadel, G.S.; Iwasaki, A., Absence of autophagy results in reactive oxygen species-dependent amplification of
RLR signaling. Proc Natl Acad Sci U S A, 2009; 106: 2770-2775.
Tamai, M.; Yokoo, C.; Murata, M.; Oguma, K.; Sota, K.; Sato, E.; Kanaoka, Y., Efficient synthetic method for ethyl (+)-(2S,3S)-3-[(S)-3-methyl- 1-(3-methylbutylcarbamoyl)butylcarbamoyl]-2-oxiranecarb oxylate (EST), a new inhibitor of cysteine proteinases. Chem Pharm Bull (Tokyo), 1987; 35: 1098-1104.
Tang, C.; Lu, Y.H.; Xie, J.H.; Wang, F.; Zou, J.N.; Yang, J.S.; Xing, Y.Y.; Xi, T., Downregulation of survivin and activation of caspase-3 through the PI3K/Akt pathway in ursolic acid-induced HepG2 cell apoptosis. Anticancer Drugs, 2009; 20: 249-258.
Tanida, I.; Waguri, S., Measurement of autophagy in cells and tissues. Methods Mol Biol, 2010; 648: 193-214.
Tao, Y.; Pinzi, V.; Bourhis, J.; Deutsch, E., Mechanisms of disease: signaling of the insulin-like growth factor 1 receptor pathway--therapeutic perspectives in cancer. Nat Clin Pract Oncol, 2007; 4: 591-602.
Teckman, J.H.; Perlmutter, D.H., Retention of mutant alpha(1)-antitrypsin Z in endoplasmic reticulum is associated with an autophagic response. Am J Physiol Gastrointest Liver Physiol, 2000; 279: G961-974.
Thorgeirsson, S.S.; Grisham, J.W., Molecular pathogenesis of human hepatocellular carcinoma. Nat Genet, 2002; 31: 339-346.
Thyparambil, S.P.; Edmondson, R.D.; Dragan, Y.P. Primary Liver Cancer: Chemical Carcinogenesis. In: Carr, B.I., editor. 2nd ed, Hepatocellular carcinoma Diagnosis and Treatment: Humana Press; 2010. p. 76-77.
Todde, V.; Veenhuis, M.; van der Klei, I.J., Autophagy: principles and significance in health and disease. Biochim Biophys Acta, 2009; 1792: 3-13.
Toker, A.; Newton, A.C., Akt/protein kinase B is regulated by autophosphorylation at the hypothetical PDK-2 site. J Biol Chem, 2000; 275: 8271-8274.
Tsujita, Y.; Kuroda, M.; Shimada, Y.; Tanzawa, K.; Arai, M.; Kaneko, I.; Tanaka, M.; Masuda, H.; Tarumi, C.; Watanabe, Y.; et al., CS-514, a competitive inhibitor of 3-hydroxy-3-methylglutaryl coenzyme A reductase: tissue-selective inhibition of sterol synthesis and hypolipidemic effect on various animal species. Biochim Biophys Acta, 1986; 877: 50-60.
Umezawa, H.; Aoyagi, T.; Morishima, H.; Matsuzaki, M.; Hamada, M., Pepstatin, a new pepsin inhibitor
References
71
produced by Actinomycetes. J Antibiot (Tokyo), 1970; 23: 259-262.
Vivanco, I.; Sawyers, C.L., The phosphatidylinositol 3-Kinase AKT pathway in human cancer. Nat Rev Cancer, 2002; 2: 489-501.
Volinia, S.; Dhand, R.; Vanhaesebroeck, B.; MacDougall, L.K.; Stein, R.; Zvelebil, M.J.; Domin, J.; Panaretou, C.; Waterfield, M.D., A human phosphatidylinositol 3-kinase complex related to the yeast Vps34p-Vps15p protein sorting system. EMBO J, 1995; 14: 3339-3348.
Wang, L.; Wang, W.L.; Zhang, Y.; Guo, S.P.; Zhang, J.; Li, Q.L., Epigenetic and genetic alterations of PTEN in hepatocellular carcinoma. Hepatol Res, 2007; 37: 389-396.
Wang, X.; Zhang, F.; Yang, L.; Mei, Y.; Long, H.; Zhang, X.; Zhang, J.; Qimuge, S.; Su, X., Ursolic acid inhibits proliferation and induces apoptosis of cancer cells in vitro and in vivo. J Biomed Biotechnol, 2011a; 2011: 419343.
Wang, X.W.; Grisham, J.W.; Thorgeirsson, S.S. Molecular Genetics of Liver Neoplasia: Springer; 2011b.
Wang, Y.; Yoshioka, K.; Azam, M.A.; Takuwa, N.; Sakurada, S.; Kayaba, Y.; Sugimoto, N.; Inoki, I.; Kimura, T.; Kuwaki, T.; Takuwa, Y., Class II phosphoinositide 3-kinase alpha-isoform regulates Rho, myosin phosphatase and contraction in vascular smooth muscle. Biochem J, 2006; 394: 581-592.
West, K.A.; Castillo, S.S.; Dennis, P.A., Activation of the PI3K/Akt pathway and chemotherapeutic resistance. Drug Resist Updat, 2002; 5: 234-248.
Wong, C.H.; Iskandar, K.B.; Yadav, S.K.; Hirpara, J.L.; Loh, T.; Pervaiz, S., Simultaneous induction of non-canonical autophagy and apoptosis in cancer cells by ROS-dependent ERK and JNK activation. PLoS One, 2010; 5: e9996.
Wong, C.M.; Ng, I.O., Molecular pathogenesis of hepatocellular carcinoma. Liver Int, 2008; 28: 160-174.
Wu, Y.-T.; Tan, H.-L.; Shui, G.; Bauvy, C.; Huang, Q.; Wenk, M.R.; Ong, C.-N.; Codogno, P.; Shen, H.-M., Dual Role of 3-Methyladenine in Modulation of Autophagy via Different Temporal Patterns of Inhibition on Class I and III Phosphoinositide 3-Kinase. Journal of Biological Chemistry, 2010; 285: 10850-10861.
Xavier, C.; Lima, C.F.; Pedro, D.; Wilson, J.M.; Kristiansen, K., Ursolic acid induces cell death and modulates autophagy through JNK pathway in
apoptosis-resistant colorectal cancer cells. The J Nutr Biochem, 2012.
Xavier, C.P. The anticarcinogenic potential of dietary natural compounds on colorectal carcinoma: Effects on signalling pathways related to proliferation and cell death [PhD Thesis]: University of Minho; 2010.
Xavier, C.P.R.; Lima, C.F.; Preto, A.; Seruca, R.; Fernandes-Ferreira, M.; Pereira-Wilson, C., Luteolin, quercetin and ursolic acid are potent inhibitors of proliferation and inducers of apoptosis in both KRAS and BRAF mutated human colorectal cancer cells. Cancer lett, 2009; 281: 162-170.
Xu, K.; Yang, Y.; Yan, M.; Zhan, J.; Fu, X.; Zheng, X., Autophagy plays a protective role in free cholesterol overload-induced death of smooth muscle cells. J Lipid Res, 2010; 51: 2581-2590.
Xu, X.; Sakon, M.; Nagano, H.; Hiraoka, N.; Yamamoto, H.; Hayashi, N.; Dono, K.; Nakamori, S.; Umeshita, K.; Ito, Y.; Matsuura, N.; Monden, M., Akt2 expression correlates with prognosis of human hepatocellular carcinoma. Oncol Rep, 2004; 11: 25-32.
Xue, J.; Xie, M.; Gu, Z., Mechanisms for regulating cholesterol metabolism by protocatechualdehyde, ursolic acid and quercetin. Asian Journal of Traditional Medicines, 2006; 2: 60-63.
Yamamoto, A.; Tagawa, Y.; Yoshimori, T.; Moriyama, Y.; Masaki, R.; Tashiro, Y., Bafilomycin A1 prevents maturation of autophagic vacuoles by inhibiting fusion between autophagosomes and lysosomes in rat hepatoma cell line, H-4-II-E cells. Cell Struct Funct, 1998; 23: 33-42.
Yan, S.L.; Huang, C.Y.; Wu, S.T.; Yin, M.C., Oleanolic acid and ursolic acid induce apoptosis in four human liver cancer cell lines. Toxicol In Vitro, 2010; 24: 842-848.
Yang, Q.; Guan, K.L., Expanding mTOR signaling. Cell Res, 2007; 17: 666-681.
Yang, Y.P.; Liang, Z.Q.; Gu, Z.L.; Qin, Z.H., Molecular mechanism and regulation of autophagy. Acta Pharmacol Sin, 2005; 26: 1421-1434.
Yeh, C.T.; Wu, C.H.; Yen, G.C., Ursolic acid, a naturally occurring triterpenoid, suppresses migration and invasion of human breast cancer cells by modulating c-Jun N-terminal kinase, Akt and mammalian target of rapamycin signaling. Mol Nutr Food Res, 2010; 54: 1285-1295.
Yu, L.; McPhee, C.K.; Zheng, L.; Mardones, G.A.; Rong, Y.; Peng, J.; Mi, N.; Zhao, Y.; Liu, Z.; Wan, F.; Hailey, D.W.; Oorschot, V.; Klumperman, J.; Baehrecke, E.H.; Lenardo, M.J., Termination of

References
72
autophagy and reformation of lysosomes regulated by mTOR. Nature, 2010; 465: 942-946.
Zeng, X.; Overmeyer, J.H.; Maltese, W.A., Functional specificity of the mammalian Beclin-Vps34 PI 3-kinase complex in macroautophagy versus endocytosis and lysosomal enzyme trafficking. J Cell Sci, 2006; 119: 259-270.
Zhang, Y.; Qi, H.; Taylor, R.; Xu, W.; Liu, L.F.; Jin, S., The role of autophagy in mitochondria maintenance: characterization of mitochondrial functions in autophagy-deficient S. cerevisiae strains. Autophagy, 2007; 3: 337-346.
Zhou, R.; Zhang, Z.; Zhao, L.; Jia, C.; Xu, S.; Mai, Q.; Lu, M.; Huang, M.; Wang, L.; Wang, X.; Jin, D.; Bai, X., Inhibition of mTOR signaling by oleanolic acid contributes to its anti-tumor activity in osteosarcoma cells. J Orthop Res, 2011; 29: 846-852.
Zinda, M.J.; Johnson, M.A.; Paul, J.D.; Horn, C.; Konicek, B.W.; Lu, Z.H.; Sandusky, G.; Thomas, J.E.; Neubauer, B.L.; Lai, M.T.; Graff, J.R., AKT-1, -2, and -3 are expressed in both normal and tumor tissues of the lung, breast, prostate, and colon. Clin Cancer Res, 2001; 7: 2475-2479.

Supplementary MaterialSupplementary MaterialSupplementary MaterialSupplementary Material

ii

Supplementary Material
iii
Supplementary Fig. 1. Effect of ursolic acid (UA) and oleanolic acid (OA) in the viability of HCT116 cells, as assessed by MTT
reduction assay. Cells were incubated with UA or OA at indicated concentrations for 48 h in complete (A) or starvation (B)
medium. Values are mean ± SEM of at least three independent experiments. * p≤0.05 and *** p≤0.001 when compared with
control by the one-way ANOVA (Newman-Keuls Multiple Comparison Test).
Supplementary Fig. 2. . Effect of rapamycin (Rap) and chloroquine (CQ) in the appearance of cellular acidic vacuoles, as
assessed by MDC-staining. HepG2 cells were treated with the indicated compounds for 16 h in complete medium before being
stained with 50 µM monodansylcadaverine (MDC) for 10 minutes. Shown are representative images of three independent
experiments (bar=50μm).
AAAA BBBB
RAP
RAP
RAP
RAP 200 n
200 n
200 n
200 nMM MM
ControlControlControlControl CQ 10 µMCQ 10 µMCQ 10 µMCQ 10 µM

Supplementary Material
iv
Supplementary Fig. 3. Effect of ursolic acid (UA) and oleanolic acid (OA) on LAMP-2A levels, as assessed by imunofluorescence.
Compounds were incubated 16 h in starvation medium before imunostaining with anti-mouse LAMP-2 antibody (1:200). Images
are representative of two independent experiments (bar=50μm).
Supplementary Fig. 4. Effect of oleanolic acid (OA) in the levels of reactive oxygen species (ROS). HepG2 cells were incubated
with OA 10 µM (control received vehicle only – DMSO) for 16 h in starvation medium and stained in the end with 10 μM DCF for
30 min, at 37ºC, and ROS levels mesuared by flow cytometry. ROS levels expressed as the ratio between fluorescence intensity of
each sample and autofluorescence are: control – 86.6; OA – 56.1. Shown are representative distributions of cells labelled with
DCF from two independent experiments.
ControlControlControlControl
UA 20 µMUA 20 µMUA 20 µMUA 20 µM OA 15 µMOA 15 µMOA 15 µMOA 15 µM
DCFDCFDCFDCF DCFDCFDCFDCF DCFDCFDCFDCF