cea (central electricity authority), aranca research ... 2015.pdf · cea (central electricity...
TRANSCRIPT
Source: Make in India website, Ministry of New and Renewable Energy, IEA,
CEA (Central Electricity Authority), Aranca Research, Assorted articles
Notes: TWh - Terawatt Hours, GW – Gigawatt, * Target of 88.5 GW
Fourth largest producer
and fourth largest
consumer globally
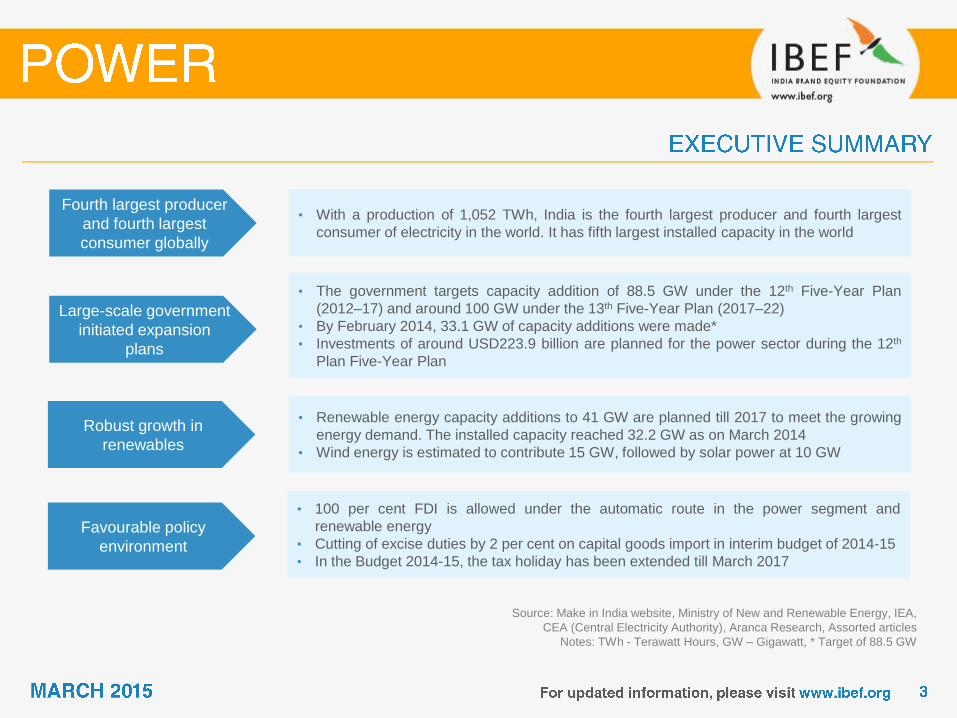
• With a production of 1,052 TWh, India is the fourth largest producer and fourth largest
consumer of electricity in the world. It has fifth largest installed capacity in the world
Large-scale government
initiated expansion
plans
• The government targets capacity addition of 88.5 GW under the 12th Five-Year Plan
(2012–17) and around 100 GW under the 13th Five-Year Plan (2017–22)
• By February 2014, 33.1 GW of capacity additions were made*
• Investments of around USD223.9 billion are planned for the power sector during the 12th
Plan Five-Year Plan
Robust growth in
renewables
• Renewable energy capacity additions to 41 GW are planned till 2017 to meet the growing
energy demand. The installed capacity reached 32.2 GW as on March 2014
• Wind energy is estimated to contribute 15 GW, followed by solar power at 10 GW
Favourable policy
environment
• 100 per cent FDI is allowed under the automatic route in the power segment and
renewable energy
• Cutting of excise duties by 2 per cent on capital goods import in interim budget of 2014-15
• In the Budget 2014-15, the tax holiday has been extended till March 2017

Growing demand
Source: CEA, DIPP (Department of Industrial Policy and Promotion), Aranca Research, KPMG
Notes: FY - Indian Financial Year (April – March), FDI - Foreign Direct Investment, E - Estimates,
CAGR - Compound Annual Growth Rate, TWh - Terawatt-Hour, GW - Gigawatt, FY22 estimates as per IEA forecasts
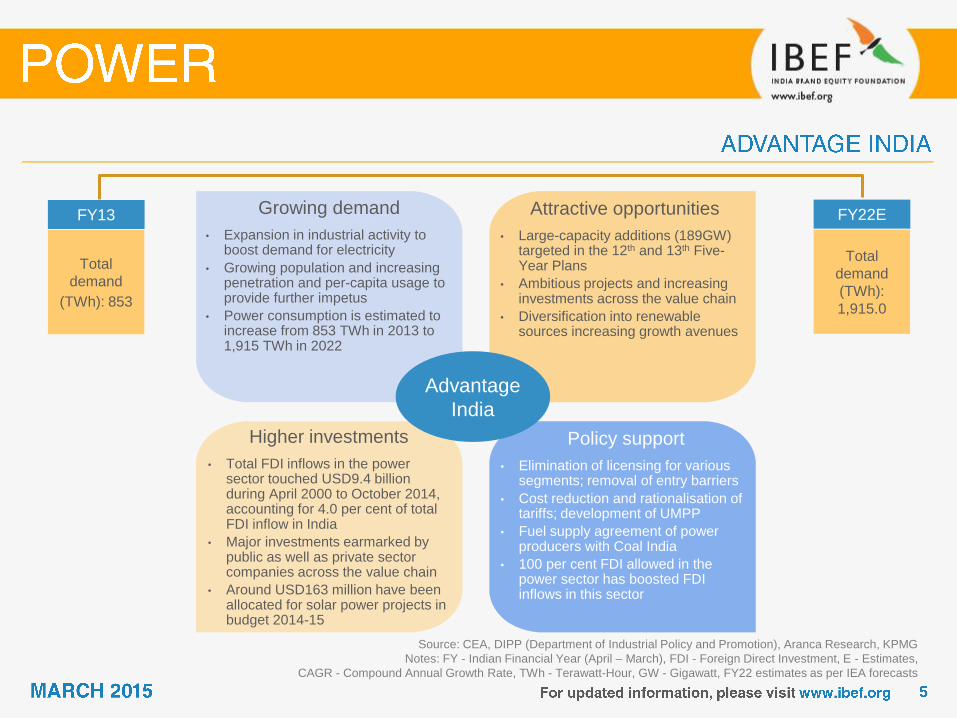
Growing demand
• Expansion in industrial activity to boost demand for electricity
• Growing population and increasing penetration and per-capita usage to provide further impetus
• Power consumption is estimated to increase from 853 TWh in 2013 to 1,915 TWh in 2022
Attractive opportunities
• Large-capacity additions (189GW) targeted in the 12th and 13th Five-Year Plans
• Ambitious projects and increasing investments across the value chain
• Diversification into renewable sources increasing growth avenues
Policy support
• Elimination of licensing for various segments; removal of entry barriers
• Cost reduction and rationalisation of tariffs; development of UMPP
• Fuel supply agreement of power producers with Coal India
• 100 per cent FDI allowed in the power sector has boosted FDI inflows in this sector
Higher investments
• Total FDI inflows in the power sector touched USD9.4 billion during April 2000 to October 2014, accounting for 4.0 per cent of total FDI inflow in India
• Major investments earmarked by public as well as private sector companies across the value chain
• Around USD163 million have been allocated for solar power projects in budget 2014-15
FY13
Total
demand
(TWh): 853
FY22E
Total
demand
(TWh):
1,915.0
Advantage
India

Source: KPMG, Corporate Catalyst India, IFLR, Aranca Research
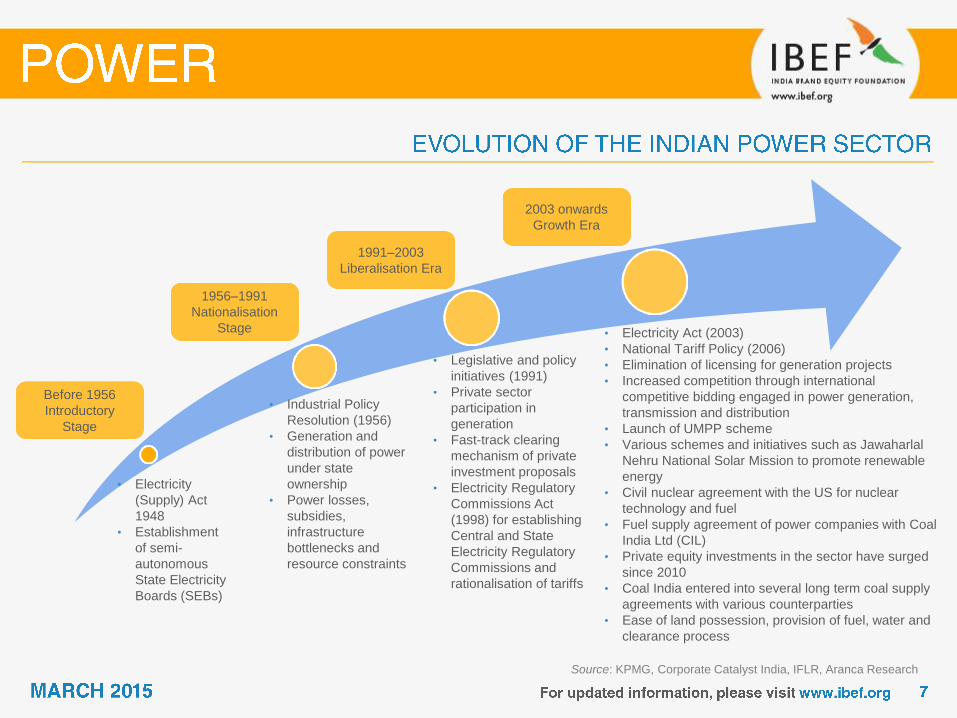
• Electricity
(Supply) Act
1948
• Establishment
of semi-
autonomous
State Electricity
Boards (SEBs)
• Industrial Policy
Resolution (1956)
• Generation and
distribution of power
under state
ownership
• Power losses,
subsidies,
infrastructure
bottlenecks and
resource constraints
• Legislative and policy
initiatives (1991)
• Private sector
participation in
generation
• Fast-track clearing
mechanism of private
investment proposals
• Electricity Regulatory
Commissions Act
(1998) for establishing
Central and State
Electricity Regulatory
Commissions and
rationalisation of tariffs
Before 1956
Introductory
Stage
1956–1991
Nationalisation
Stage
1991–2003
Liberalisation Era
2003 onwards
Growth Era
• Electricity Act (2003)
• National Tariff Policy (2006)
• Elimination of licensing for generation projects
• Increased competition through international
competitive bidding engaged in power generation,
transmission and distribution
• Launch of UMPP scheme
• Various schemes and initiatives such as Jawaharlal
Nehru National Solar Mission to promote renewable
energy
• Civil nuclear agreement with the US for nuclear
technology and fuel
• Fuel supply agreement of power companies with Coal
India Ltd (CIL)
• Private equity investments in the sector have surged
since 2010
• Coal India entered into several long term coal supply
agreements with various counterparties
• Ease of land possession, provision of fuel, water and
clearance process
Source: Enerdata, Aranca Research,
Note: TWh - Terawatt Hours
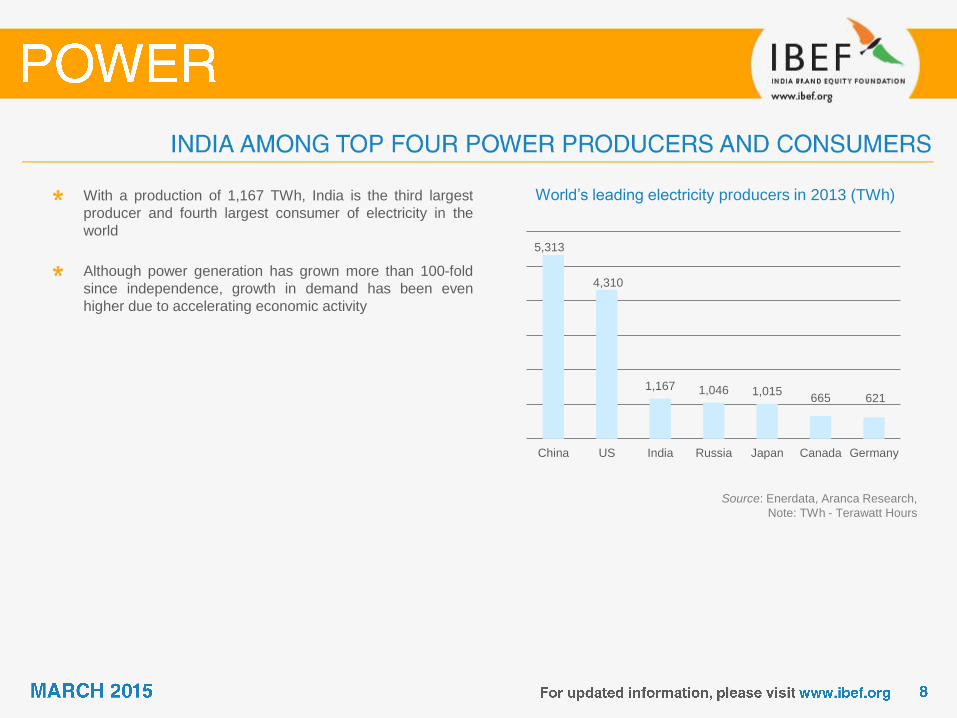
World’s leading electricity producers in 2013 (TWh) With a production of 1,167 TWh, India is the third largest
producer and fourth largest consumer of electricity in the
world
Although power generation has grown more than 100-fold
since independence, growth in demand has been even
higher due to accelerating economic activity
621 665 1,015 1,046 1,167
4,310
5,313
GermanyCanadaJapanRussiaIndiaUSChina
Source: CEA (Central Electricity Authority), Aranca Research;
Notes: FY - Indian Financial Year (April-March),
TWh - Terra Watt Hour, *Provisional
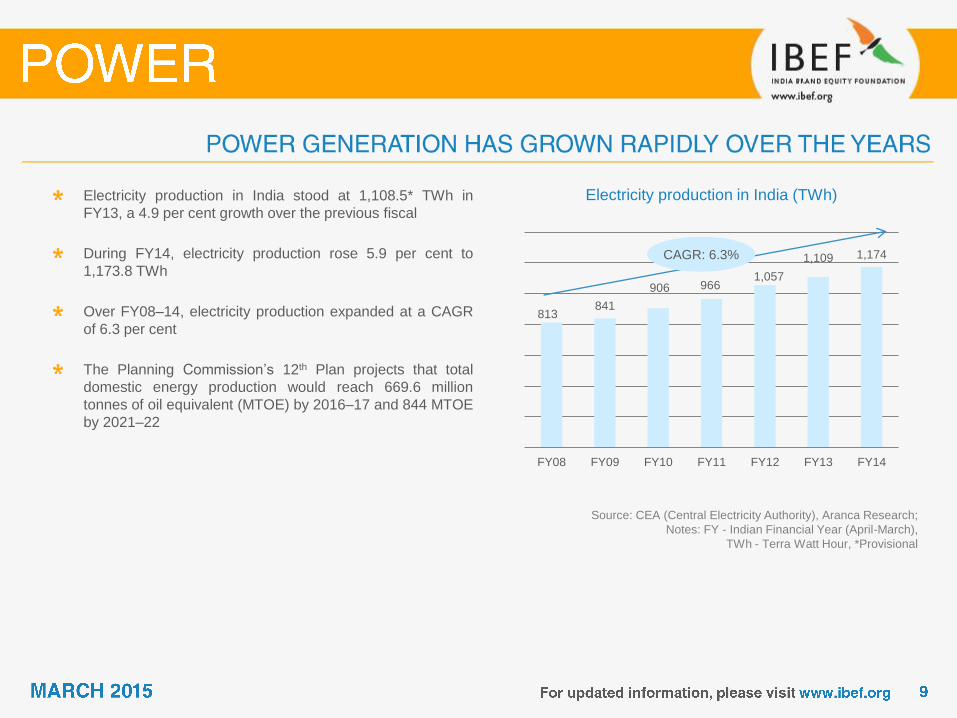
Electricity production in India (TWh) Electricity production in India stood at 1,108.5* TWh in
FY13, a 4.9 per cent growth over the previous fiscal
During FY14, electricity production rose 5.9 per cent to
1,173.8 TWh
Over FY08–14, electricity production expanded at a CAGR
of 6.3 per cent
The Planning Commission’s 12th Plan projects that total
domestic energy production would reach 669.6 million
tonnes of oil equivalent (MTOE) by 2016–17 and 844 MTOE
by 2021–22
813 841
906 966 1,057
1,109 1,174
FY08 FY09 FY10 FY11 FY12 FY13 FY14
CAGR: 6.3%
Source: Ministry of Coal, NHPC, CEA, BP Statistical Review 2014, The Hindu, Corporate Catalyst India, Indian Power Sector, Aranca Research
Notes: Share in the total installed capacity as of October 2014, MW - Megawatt, GW - Gigawatt
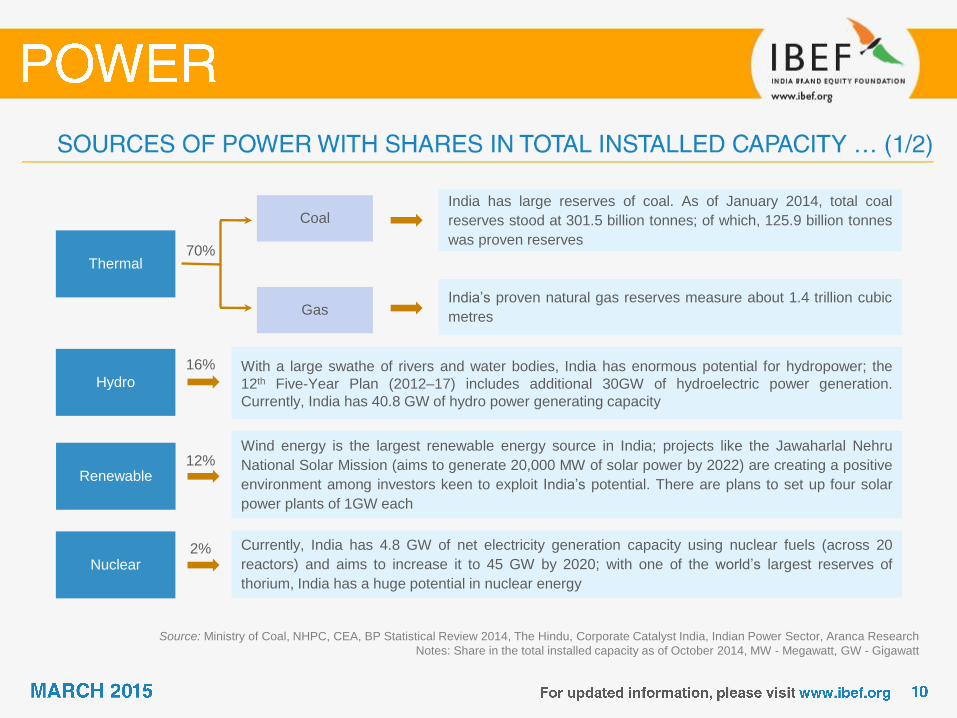
Hydro
Renewable
Nuclear
Thermal
India has large reserves of coal. As of January 2014, total coal
reserves stood at 301.5 billion tonnes; of which, 125.9 billion tonnes
was proven reserves
India’s proven natural gas reserves measure about 1.4 trillion cubic
metres
With a large swathe of rivers and water bodies, India has enormous potential for hydropower; the
12th Five-Year Plan (2012–17) includes additional 30GW of hydroelectric power generation.
Currently, India has 40.8 GW of hydro power generating capacity
Wind energy is the largest renewable energy source in India; projects like the Jawaharlal Nehru
National Solar Mission (aims to generate 20,000 MW of solar power by 2022) are creating a positive
environment among investors keen to exploit India’s potential. There are plans to set up four solar
power plants of 1GW each
Currently, India has 4.8 GW of net electricity generation capacity using nuclear fuels (across 20
reactors) and aims to increase it to 45 GW by 2020; with one of the world’s largest reserves of
thorium, India has a huge potential in nuclear energy
Gas
Coal
70%
16%
12%
2%
Source: Ministry of Coal, NHPC,
Central Electricity Authority (CEA), The Hindu,
Corporate Catalyst India, Aranca Research
Notes: MW - Megawatt, GW - Gigawatt
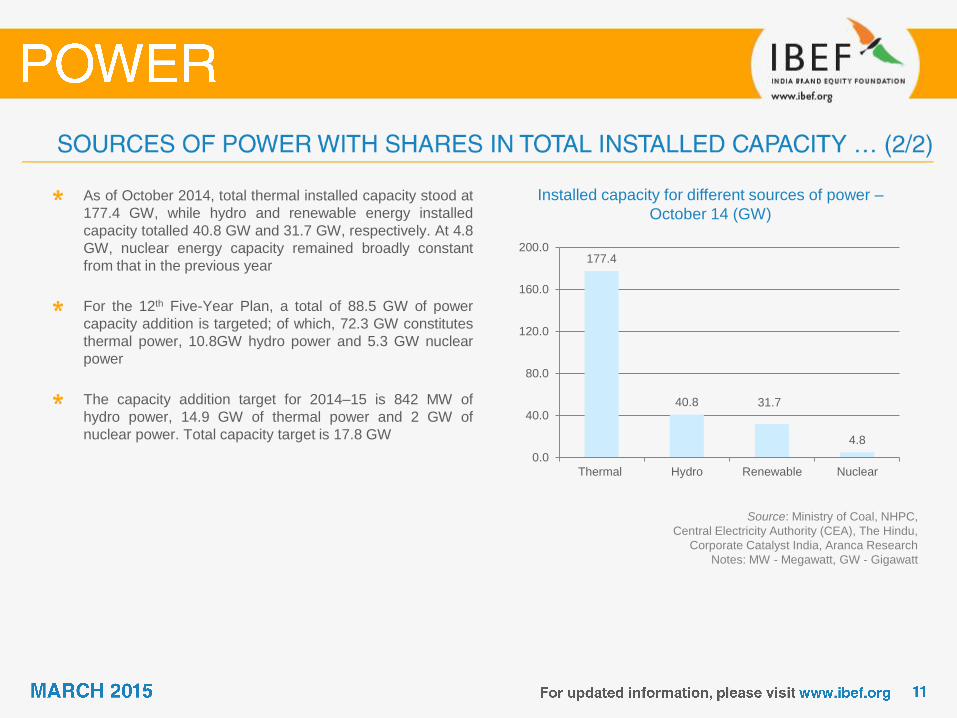
Installed capacity for different sources of power –
October 14 (GW)
As of October 2014, total thermal installed capacity stood at
177.4 GW, while hydro and renewable energy installed
capacity totalled 40.8 GW and 31.7 GW, respectively. At 4.8
GW, nuclear energy capacity remained broadly constant
from that in the previous year
For the 12th Five-Year Plan, a total of 88.5 GW of power
capacity addition is targeted; of which, 72.3 GW constitutes
thermal power, 10.8GW hydro power and 5.3 GW nuclear
power
The capacity addition target for 2014–15 is 842 MW of
hydro power, 14.9 GW of thermal power and 2 GW of
nuclear power. Total capacity target is 17.8 GW
177.4
40.8 31.7
4.8
0.0
40.0
80.0
120.0
160.0
200.0
Thermal Hydro Renewable Nuclear
Source: CEA (Central Electricity Authority), Aranca Research
Notes: GW – Gigawatt, CAGR - Compound Annual Growth Rate
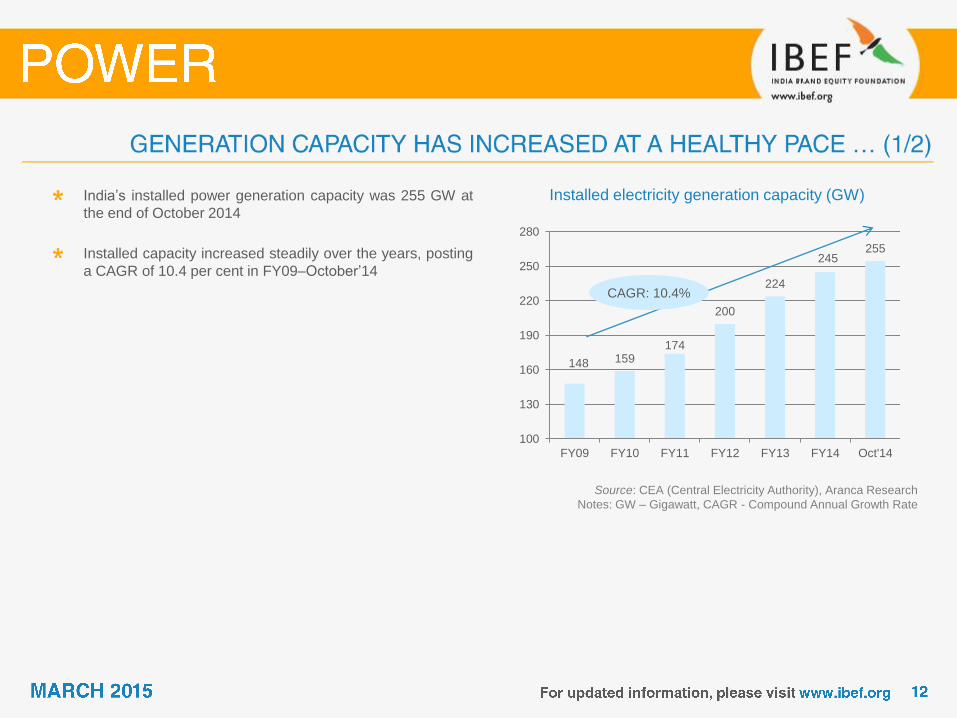
Installed electricity generation capacity (GW) India’s installed power generation capacity was 255 GW at
the end of October 2014
Installed capacity increased steadily over the years, posting
a CAGR of 10.4 per cent in FY09–October’14
148 159 174
200
224
245 255
100
130
160
190
220
250
280
FY09 FY10 FY11 FY12 FY13 FY14 Oct'14
CAGR: 10.4%
Source: CEA, Aranca Research,
Note: CAGR - Compound Annual Growth Rate
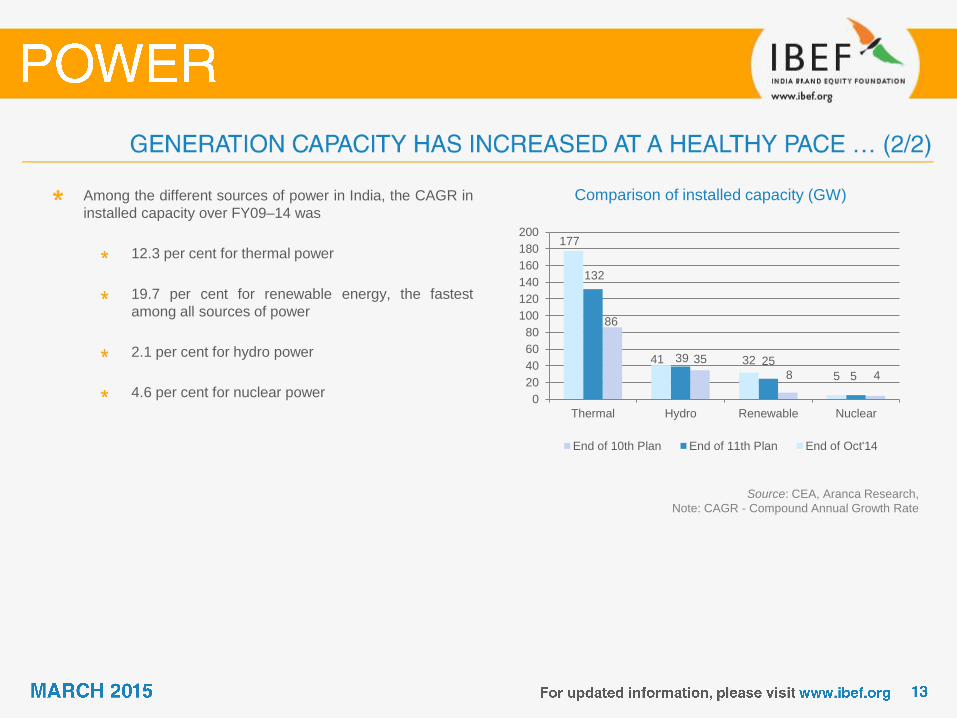
Comparison of installed capacity (GW) Among the different sources of power in India, the CAGR in
installed capacity over FY09–14 was
12.3 per cent for thermal power
19.7 per cent for renewable energy, the fastest
among all sources of power
2.1 per cent for hydro power
4.6 per cent for nuclear power
4 8
35
86
5
25 39
132
5
32 41
177
0
20
40
60
80
100
120
140
160
180
200
NuclearRenewableHydroThermal
End of 10th Plan End of 11th Plan End of Oct'14
Source: Company websites, News articles, Industry sources, Aranca Research
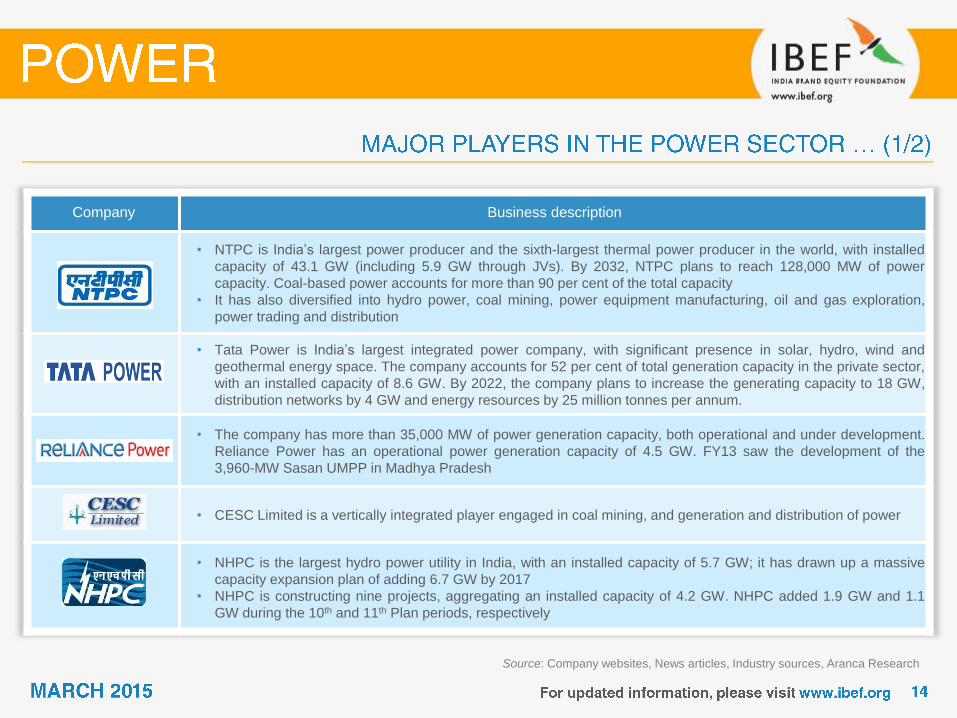
Company Business description
• NTPC is India’s largest power producer and the sixth-largest thermal power producer in the world, with installed
capacity of 43.1 GW (including 5.9 GW through JVs). By 2032, NTPC plans to reach 128,000 MW of power
capacity. Coal-based power accounts for more than 90 per cent of the total capacity
• It has also diversified into hydro power, coal mining, power equipment manufacturing, oil and gas exploration,
power trading and distribution
• Tata Power is India’s largest integrated power company, with significant presence in solar, hydro, wind and
geothermal energy space. The company accounts for 52 per cent of total generation capacity in the private sector,
with an installed capacity of 8.6 GW. By 2022, the company plans to increase the generating capacity to 18 GW,
distribution networks by 4 GW and energy resources by 25 million tonnes per annum.
• The company has more than 35,000 MW of power generation capacity, both operational and under development.
Reliance Power has an operational power generation capacity of 4.5 GW. FY13 saw the development of the
3,960-MW Sasan UMPP in Madhya Pradesh
• CESC Limited is a vertically integrated player engaged in coal mining, and generation and distribution of power
• NHPC is the largest hydro power utility in India, with an installed capacity of 5.7 GW; it has drawn up a massive
capacity expansion plan of adding 6.7 GW by 2017
• NHPC is constructing nine projects, aggregating an installed capacity of 4.2 GW. NHPC added 1.9 GW and 1.1
GW during the 10th and 11th Plan periods, respectively
Source: Company websites, News articles, Aranca Research
Note: NBFC - Non-Banking Financial Company
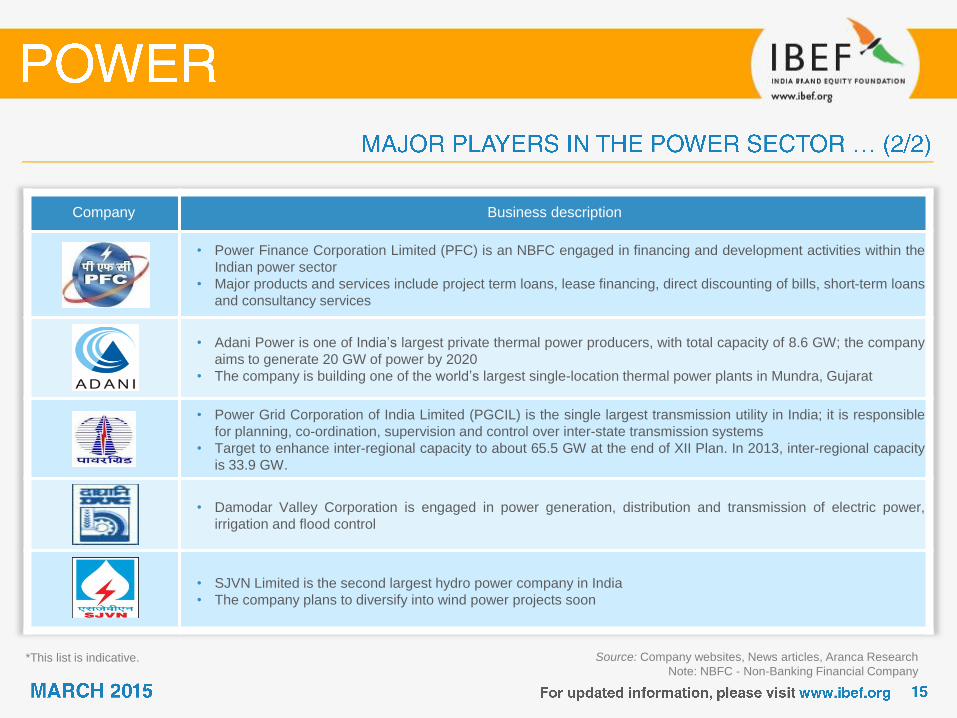
Company Business description
• Power Finance Corporation Limited (PFC) is an NBFC engaged in financing and development activities within the
Indian power sector
• Major products and services include project term loans, lease financing, direct discounting of bills, short-term loans
and consultancy services
• Adani Power is one of India’s largest private thermal power producers, with total capacity of 8.6 GW; the company
aims to generate 20 GW of power by 2020
• The company is building one of the world’s largest single-location thermal power plants in Mundra, Gujarat
• Power Grid Corporation of India Limited (PGCIL) is the single largest transmission utility in India; it is responsible
for planning, co-ordination, supervision and control over inter-state transmission systems
• Target to enhance inter-regional capacity to about 65.5 GW at the end of XII Plan. In 2013, inter-regional capacity
is 33.9 GW.
• Damodar Valley Corporation is engaged in power generation, distribution and transmission of electric power,
irrigation and flood control
• SJVN Limited is the second largest hydro power company in India
• The company plans to diversify into wind power projects soon
*This list is indicative.
Source: Aranca Research
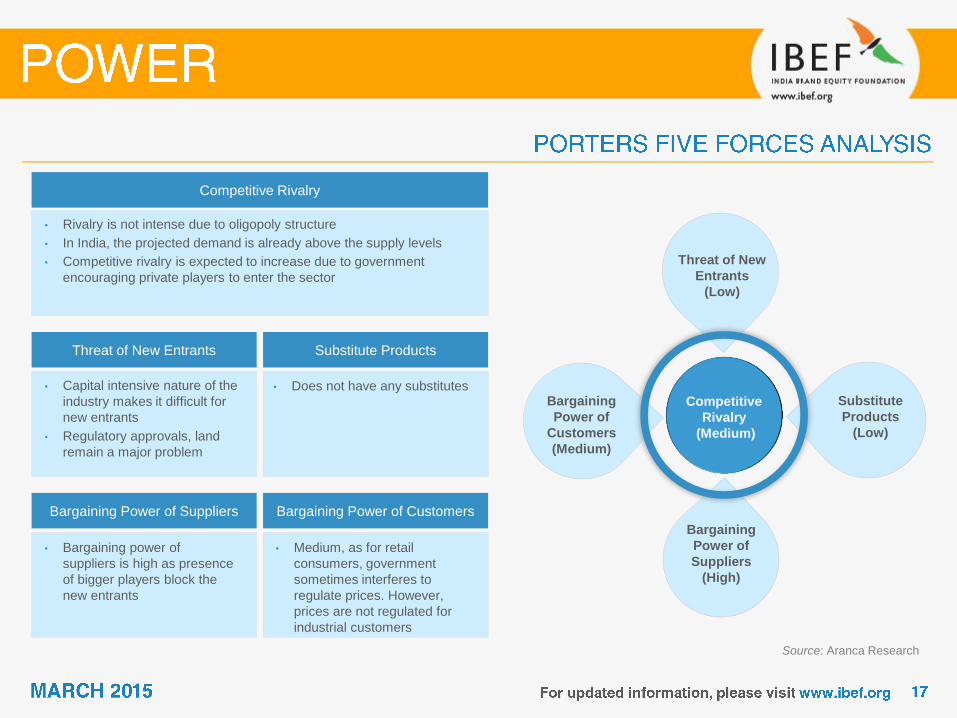
Competitive Rivalry
• Rivalry is not intense due to oligopoly structure
• In India, the projected demand is already above the supply levels
• Competitive rivalry is expected to increase due to government
encouraging private players to enter the sector
Threat of New Entrants Substitute Products
Bargaining Power of Suppliers Bargaining Power of Customers
• Capital intensive nature of the
industry makes it difficult for
new entrants
• Regulatory approvals, land
remain a major problem
• Bargaining power of
suppliers is high as presence
of bigger players block the
new entrants
• Medium, as for retail
consumers, government
sometimes interferes to
regulate prices. However,
prices are not regulated for
industrial customers
• Does not have any substitutes Competitive
Rivalry
(Medium)
Threat of New
Entrants
(Low)
Substitute
Products
(Low)
Bargaining
Power of
Customers
(Medium)
Bargaining
Power of
Suppliers
(High)
Source: Aranca Research
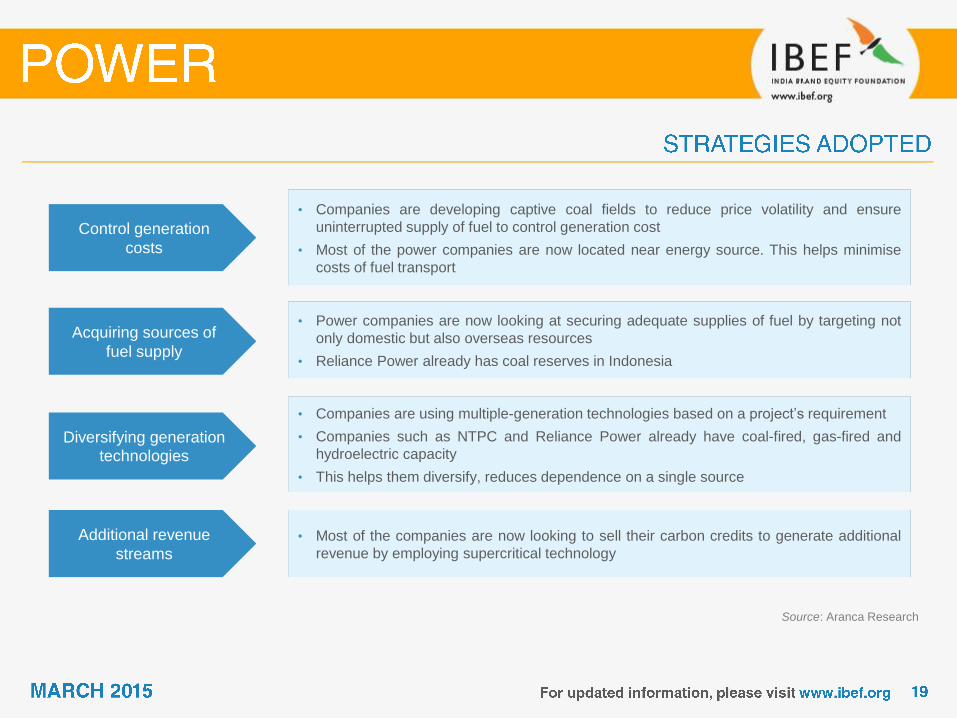
• Companies are developing captive coal fields to reduce price volatility and ensure
uninterrupted supply of fuel to control generation cost
• Most of the power companies are now located near energy source. This helps minimise
costs of fuel transport
• Power companies are now looking at securing adequate supplies of fuel by targeting not
only domestic but also overseas resources
• Reliance Power already has coal reserves in Indonesia
• Companies are using multiple-generation technologies based on a project’s requirement
• Companies such as NTPC and Reliance Power already have coal-fired, gas-fired and
hydroelectric capacity
• This helps them diversify, reduces dependence on a single source
• Most of the companies are now looking to sell their carbon credits to generate additional
revenue by employing supercritical technology
Control generation
costs
Acquiring sources of
fuel supply
Diversifying generation technologies
Additional revenue
streams

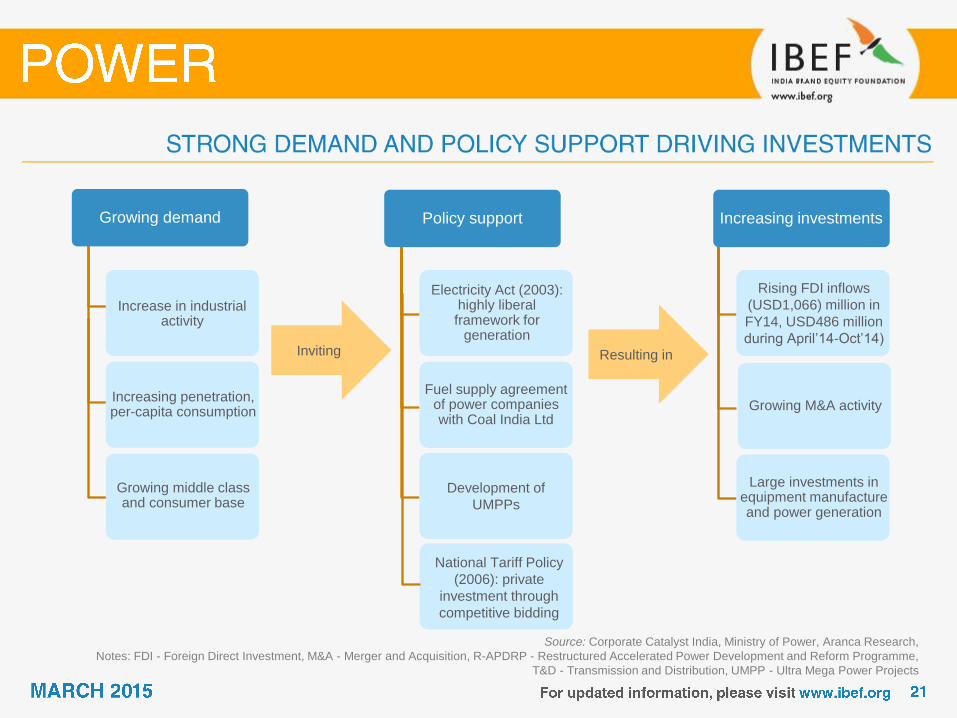
Policy support
Electricity Act (2003): highly liberal framework for
generation
Fuel supply agreement of power companies with Coal India Ltd
Development of
UMPPs
Increase in industrial activity
Increasing investments
Rising FDI inflows
(USD1,066) million in
FY14, USD486 million
during April’14-Oct’14)
Growing M&A activity
Large investments in equipment manufacture and power generation
Inviting Resulting in
Increasing penetration, per-capita consumption
Growing middle class and consumer base
Growing demand
National Tariff Policy
(2006): private
investment through
competitive bidding
Source: Corporate Catalyst India, Ministry of Power, Aranca Research,
Notes: FDI - Foreign Direct Investment, M&A - Merger and Acquisition, R-APDRP - Restructured Accelerated Power Development and Reform Programme,
T&D - Transmission and Distribution, UMPP - Ultra Mega Power Projects
Source: Estimates as per BMI India Power Report Q3 2011, Aranca Research,
Ministry of Statistics and Program Implementation
Notes: TWh - Terawatt Hours,
RGGVY - Rajiv Gandhi Grameen Vidyutikaran Yojana, CEA
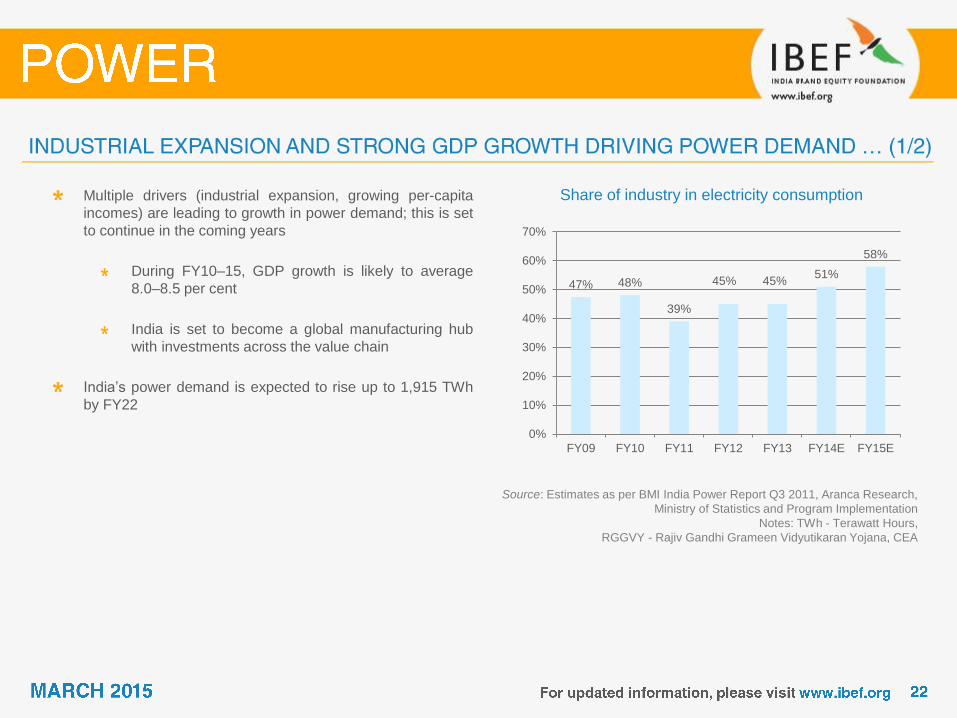
Share of industry in electricity consumption Multiple drivers (industrial expansion, growing per-capita
incomes) are leading to growth in power demand; this is set
to continue in the coming years
During FY10–15, GDP growth is likely to average
8.0–8.5 per cent
India is set to become a global manufacturing hub
with investments across the value chain
India’s power demand is expected to rise up to 1,915 TWh
by FY22
47% 48%
39%
45% 45% 51%
58%
0%
10%
20%
30%
40%
50%
60%
70%
FY09 FY10 FY11 FY12 FY13 FY14E FY15E
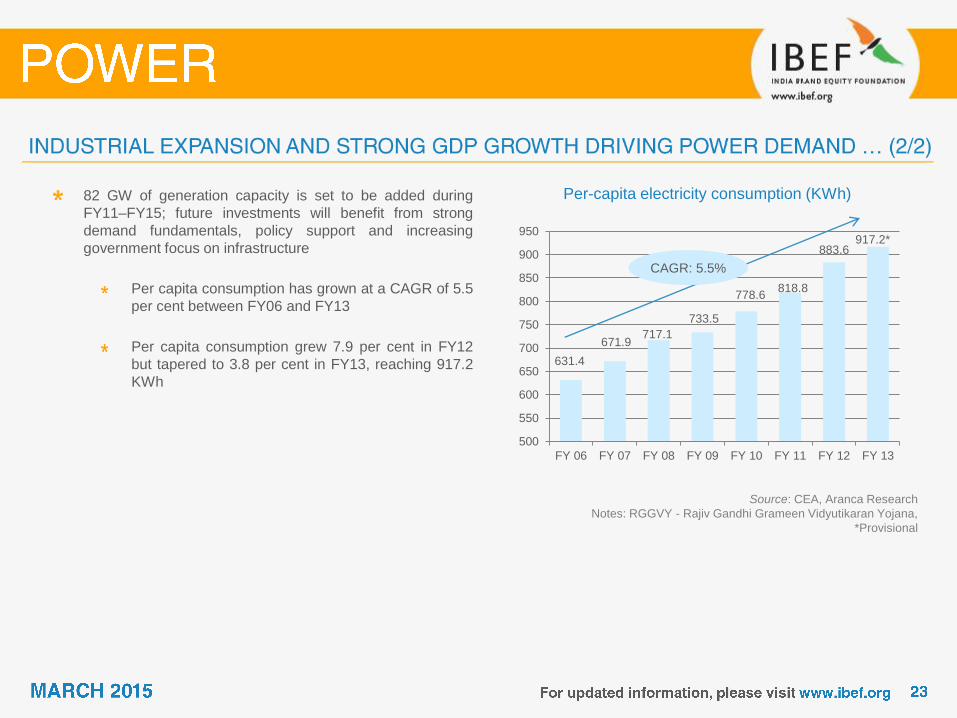
631.4
671.9 717.1
733.5
778.6 818.8
883.6 917.2*
500
550
600
650
700
750
800
850
900
950
FY 06 FY 07 FY 08 FY 09 FY 10 FY 11 FY 12 FY 13
Source: CEA, Aranca Research
Notes: RGGVY - Rajiv Gandhi Grameen Vidyutikaran Yojana,
*Provisional
Per-capita electricity consumption (KWh) 82 GW of generation capacity is set to be added during
FY11–FY15; future investments will benefit from strong
demand fundamentals, policy support and increasing
government focus on infrastructure
Per capita consumption has grown at a CAGR of 5.5
per cent between FY06 and FY13
Per capita consumption grew 7.9 per cent in FY12
but tapered to 3.8 per cent in FY13, reaching 917.2
KWh
CAGR: 5.5%
Source: KPMG, CRISIL, Ministry of Power, Aranca Research
Notes: R-APDRP - Restructured Accelerated Power Development and Reform Programme,
SERC - State Electricity Regulatory Commission, AT&T - American Telephone & Telegraph Systems
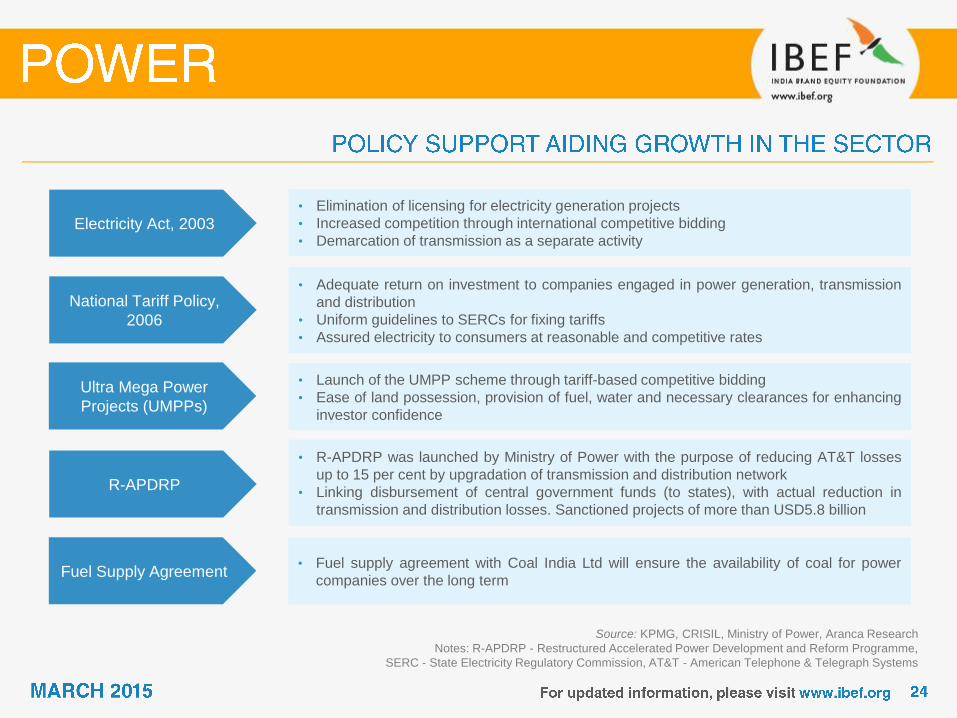
Electricity Act, 2003 • Elimination of licensing for electricity generation projects
• Increased competition through international competitive bidding
• Demarcation of transmission as a separate activity
National Tariff Policy,
2006
• Adequate return on investment to companies engaged in power generation, transmission
and distribution
• Uniform guidelines to SERCs for fixing tariffs
• Assured electricity to consumers at reasonable and competitive rates
Ultra Mega Power
Projects (UMPPs)
• Launch of the UMPP scheme through tariff-based competitive bidding
• Ease of land possession, provision of fuel, water and necessary clearances for enhancing
investor confidence
R-APDRP
• R-APDRP was launched by Ministry of Power with the purpose of reducing AT&T losses
up to 15 per cent by upgradation of transmission and distribution network
• Linking disbursement of central government funds (to states), with actual reduction in
transmission and distribution losses. Sanctioned projects of more than USD5.8 billion
Fuel Supply Agreement • Fuel supply agreement with Coal India Ltd will ensure the availability of coal for power
companies over the long term
Source: Union Budget FY13, Various News articles, Aranca Research,
Notes: PSUs - Public Sector Units, CERC: Central Electricity Regulatory Commission
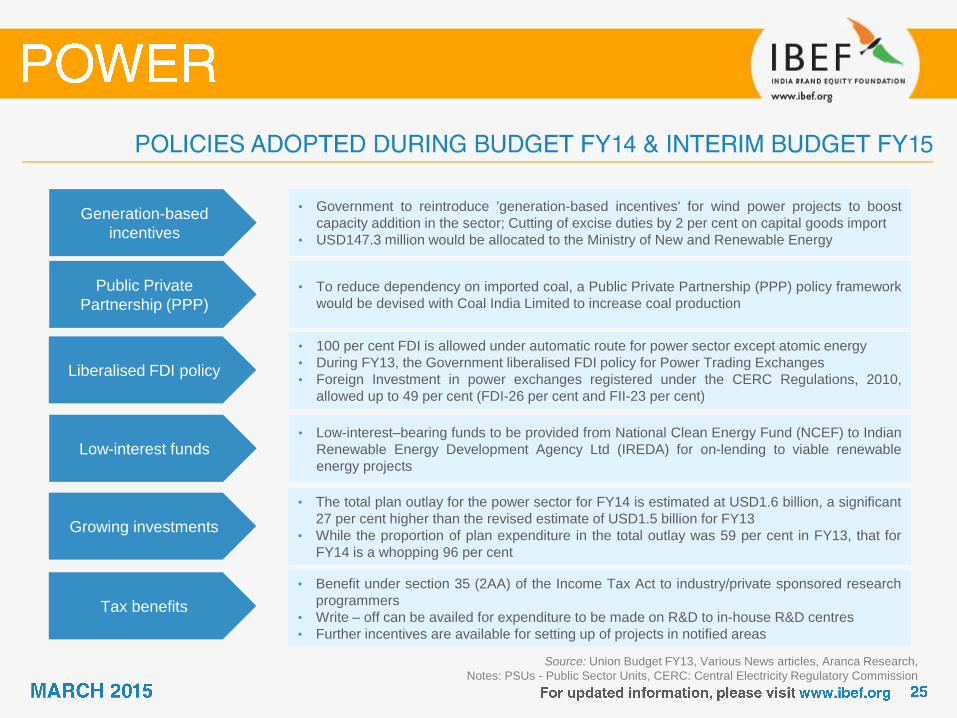
Generation-based
incentives
• Government to reintroduce 'generation-based incentives' for wind power projects to boost
capacity addition in the sector; Cutting of excise duties by 2 per cent on capital goods import
• USD147.3 million would be allocated to the Ministry of New and Renewable Energy
Public Private
Partnership (PPP) • To reduce dependency on imported coal, a Public Private Partnership (PPP) policy framework
would be devised with Coal India Limited to increase coal production
Liberalised FDI policy
• 100 per cent FDI is allowed under automatic route for power sector except atomic energy
• During FY13, the Government liberalised FDI policy for Power Trading Exchanges
• Foreign Investment in power exchanges registered under the CERC Regulations, 2010,
allowed up to 49 per cent (FDI-26 per cent and FII-23 per cent)
Low-interest funds • Low-interest–bearing funds to be provided from National Clean Energy Fund (NCEF) to Indian
Renewable Energy Development Agency Ltd (IREDA) for on-lending to viable renewable
energy projects
Growing investments
• The total plan outlay for the power sector for FY14 is estimated at USD1.6 billion, a significant
27 per cent higher than the revised estimate of USD1.5 billion for FY13
• While the proportion of plan expenditure in the total outlay was 59 per cent in FY13, that for
FY14 is a whopping 96 per cent
Tax benefits
• Benefit under section 35 (2AA) of the Income Tax Act to industry/private sponsored research
programmers
• Write – off can be availed for expenditure to be made on R&D to in-house R&D centres
• Further incentives are available for setting up of projects in notified areas
Source: Union Budget FY13, Various News articles, Aranca Research
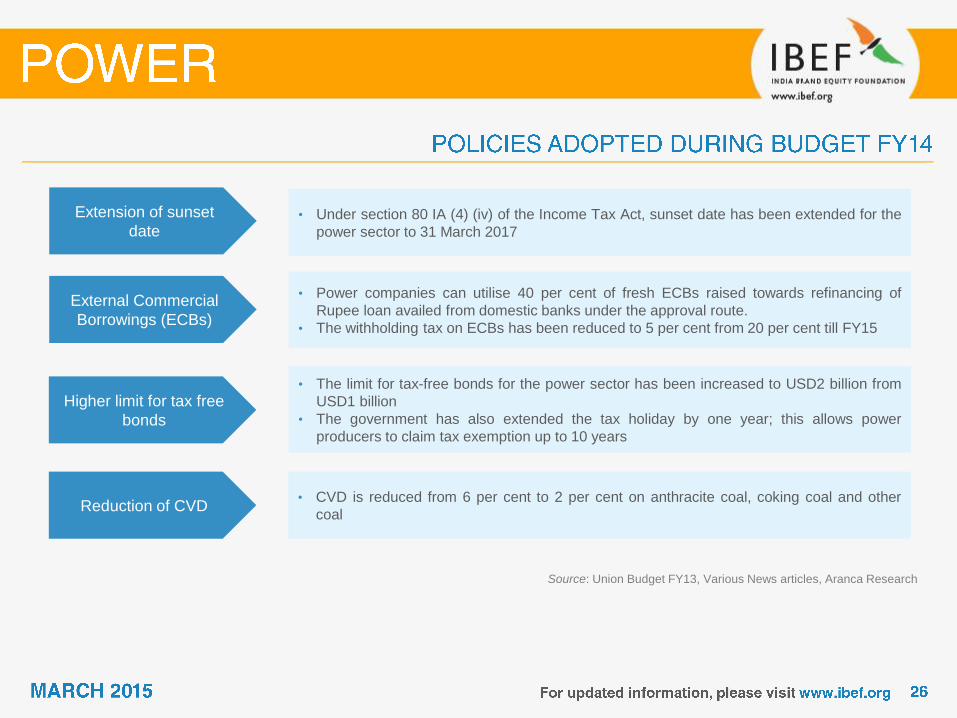
Extension of sunset
date • Under section 80 IA (4) (iv) of the Income Tax Act, sunset date has been extended for the
power sector to 31 March 2017
External Commercial
Borrowings (ECBs)
• Power companies can utilise 40 per cent of fresh ECBs raised towards refinancing of
Rupee loan availed from domestic banks under the approval route.
• The withholding tax on ECBs has been reduced to 5 per cent from 20 per cent till FY15
Higher limit for tax free
bonds
• The limit for tax-free bonds for the power sector has been increased to USD2 billion from
USD1 billion
• The government has also extended the tax holiday by one year; this allows power
producers to claim tax exemption up to 10 years
• CVD is reduced from 6 per cent to 2 per cent on anthracite coal, coking coal and other
coal Reduction of CVD
Source: DIPP, Public Information Bureau, Aranca Research
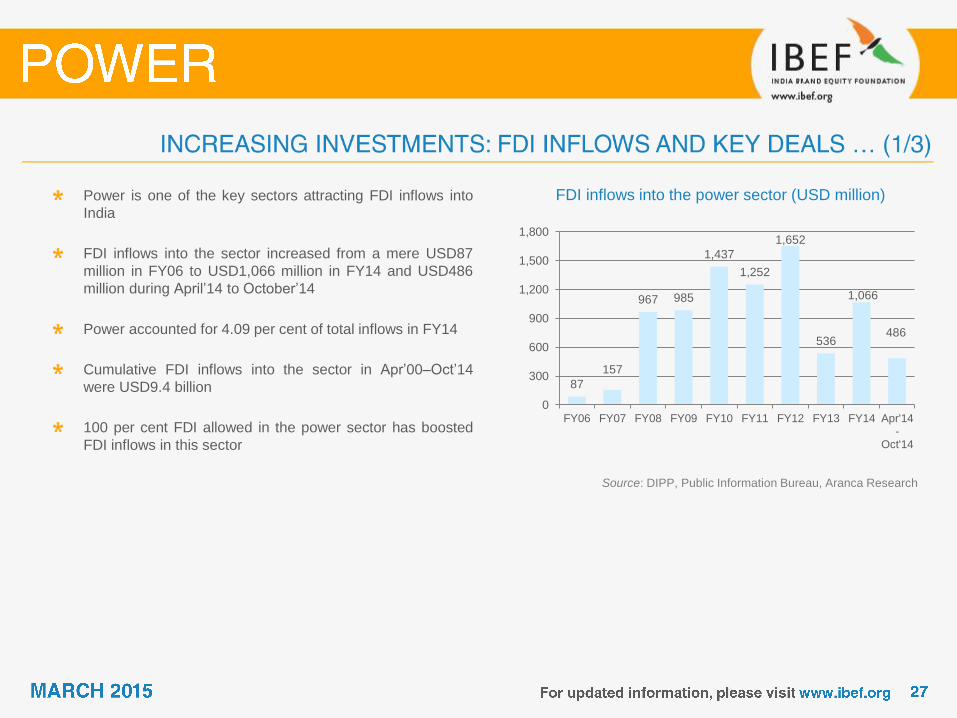
FDI inflows into the power sector (USD million) Power is one of the key sectors attracting FDI inflows into
India
FDI inflows into the sector increased from a mere USD87
million in FY06 to USD1,066 million in FY14 and USD486
million during April’14 to October’14
Power accounted for 4.09 per cent of total inflows in FY14
Cumulative FDI inflows into the sector in Apr’00–Oct’14
were USD9.4 billion
100 per cent FDI allowed in the power sector has boosted
FDI inflows in this sector
87
157
967 985
1,437
1,252
1,652
536
1,066
486
0
300
600
900
1,200
1,500
1,800
FY06 FY07 FY08 FY09 FY10 FY11 FY12 FY13 FY14 Apr'14-
Oct'14
Source: Thomson One Banker, Industry News,
VC Circle, Aranca Research
Notes: FDI - Foreign Direct Investment,
PE - Private Equity, Thomson One Banker
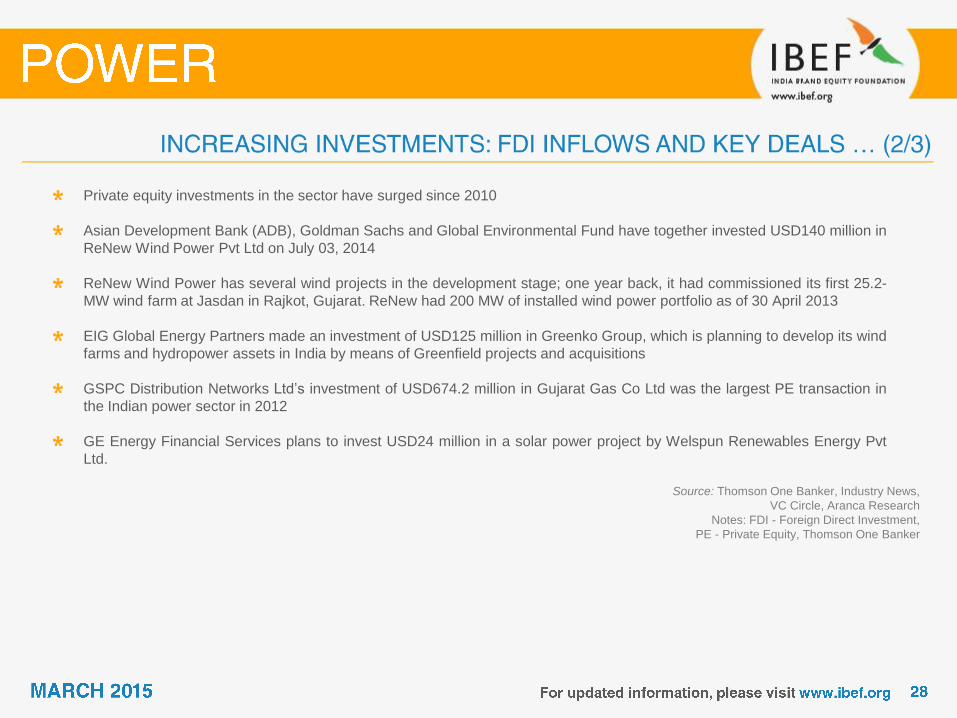
Private equity investments in the sector have surged since 2010
Asian Development Bank (ADB), Goldman Sachs and Global Environmental Fund have together invested USD140 million in
ReNew Wind Power Pvt Ltd on July 03, 2014
ReNew Wind Power has several wind projects in the development stage; one year back, it had commissioned its first 25.2-
MW wind farm at Jasdan in Rajkot, Gujarat. ReNew had 200 MW of installed wind power portfolio as of 30 April 2013
EIG Global Energy Partners made an investment of USD125 million in Greenko Group, which is planning to develop its wind
farms and hydropower assets in India by means of Greenfield projects and acquisitions
GSPC Distribution Networks Ltd’s investment of USD674.2 million in Gujarat Gas Co Ltd was the largest PE transaction in
the Indian power sector in 2012
GE Energy Financial Services plans to invest USD24 million in a solar power project by Welspun Renewables Energy Pvt
Ltd.
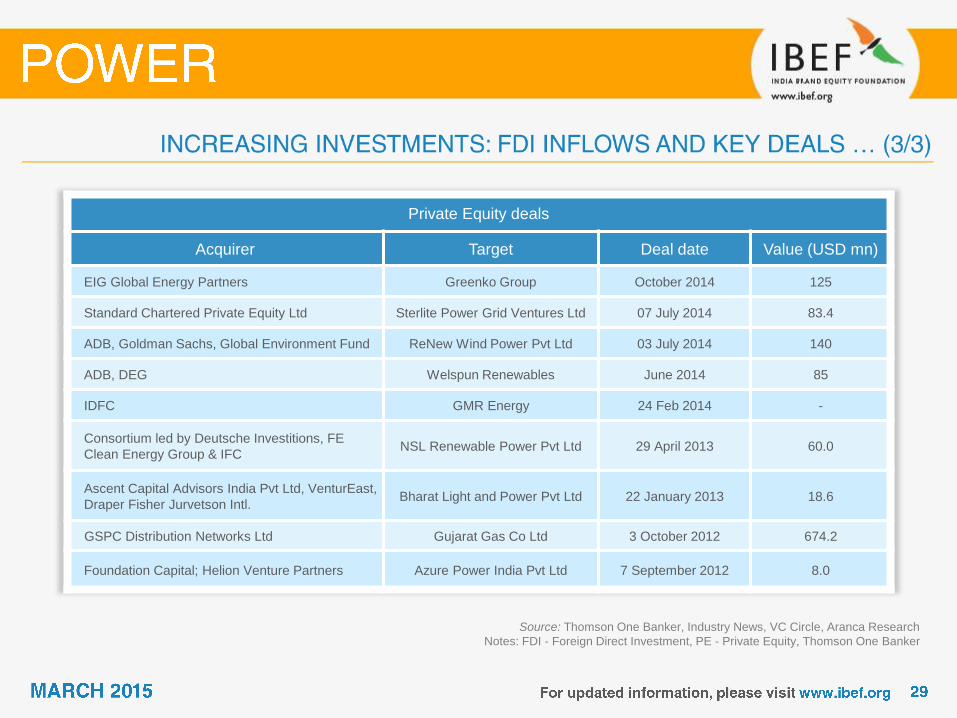
Private Equity deals
Acquirer Target Deal date Value (USD mn)
EIG Global Energy Partners Greenko Group October 2014 125
Standard Chartered Private Equity Ltd Sterlite Power Grid Ventures Ltd 07 July 2014 83.4
ADB, Goldman Sachs, Global Environment Fund ReNew Wind Power Pvt Ltd 03 July 2014 140
ADB, DEG Welspun Renewables June 2014 85
IDFC GMR Energy 24 Feb 2014 -
Consortium led by Deutsche Investitions, FE
Clean Energy Group & IFC NSL Renewable Power Pvt Ltd 29 April 2013 60.0
Ascent Capital Advisors India Pvt Ltd, VenturEast,
Draper Fisher Jurvetson Intl. Bharat Light and Power Pvt Ltd 22 January 2013 18.6
GSPC Distribution Networks Ltd Gujarat Gas Co Ltd 3 October 2012 674.2
Foundation Capital; Helion Venture Partners Azure Power India Pvt Ltd 7 September 2012 8.0
Source: Thomson One Banker, Industry News, VC Circle, Aranca Research
Notes: FDI - Foreign Direct Investment, PE - Private Equity, Thomson One Banker
Source: International Energy Agency (IEA), CEA, Demand
estimates based on IEA forecasts, Aranca Research
Notes: TWh - Terawatt Hour,
CAGR - Compounded Annual Growth Rate
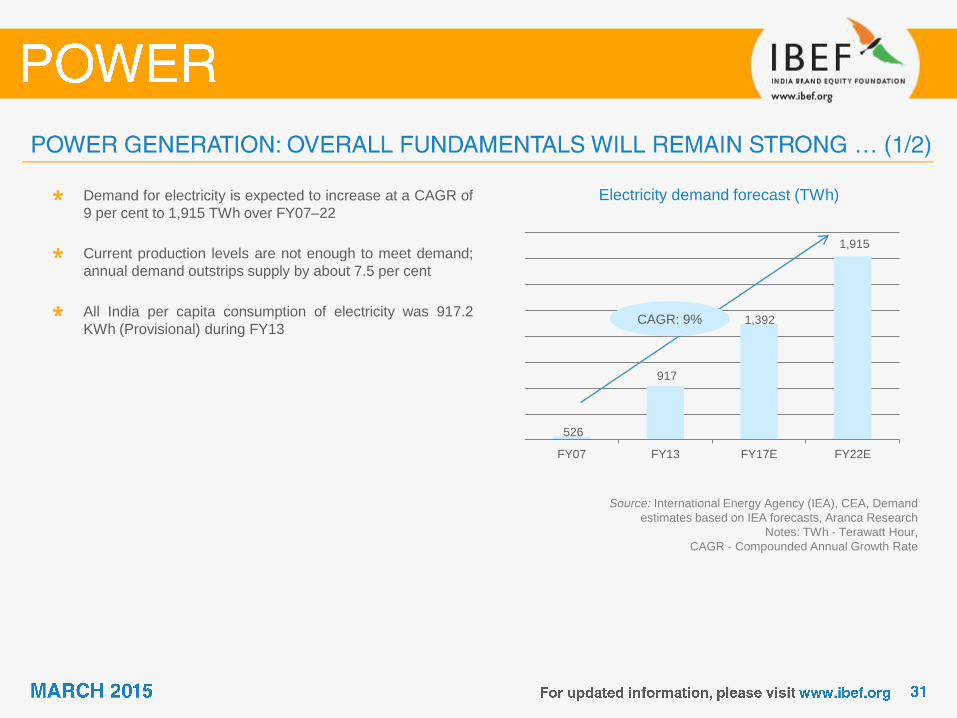
Electricity demand forecast (TWh) Demand for electricity is expected to increase at a CAGR of
9 per cent to 1,915 TWh over FY07–22
Current production levels are not enough to meet demand;
annual demand outstrips supply by about 7.5 per cent
All India per capita consumption of electricity was 917.2
KWh (Provisional) during FY13
526
917
1,392
1,915
FY07 FY13 FY17E FY22E
CAGR: 9%
Source: Business Standard,
Capacity addition estimates by CEA, Aranca Research
Notes: TWh - Terawatt-hour, E - Estimates
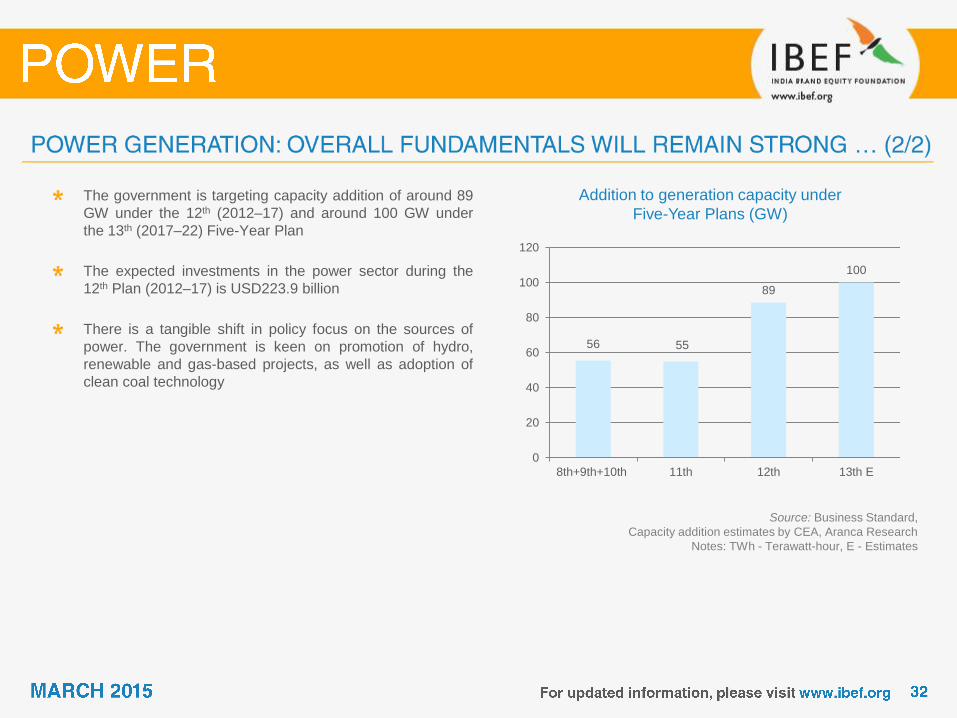
Addition to generation capacity under
Five-Year Plans (GW)
The government is targeting capacity addition of around 89
GW under the 12th (2012–17) and around 100 GW under
the 13th (2017–22) Five-Year Plan
The expected investments in the power sector during the
12th Plan (2012–17) is USD223.9 billion
There is a tangible shift in policy focus on the sources of
power. The government is keen on promotion of hydro,
renewable and gas-based projects, as well as adoption of
clean coal technology
56 55
89
100
0
20
40
60
80
100
120
8th+9th+10th 11th 12th 13th E
Source: NTPC presentation, CEA, Aranca Research
Notes: GW - Gigawatt Hour, *Provisional
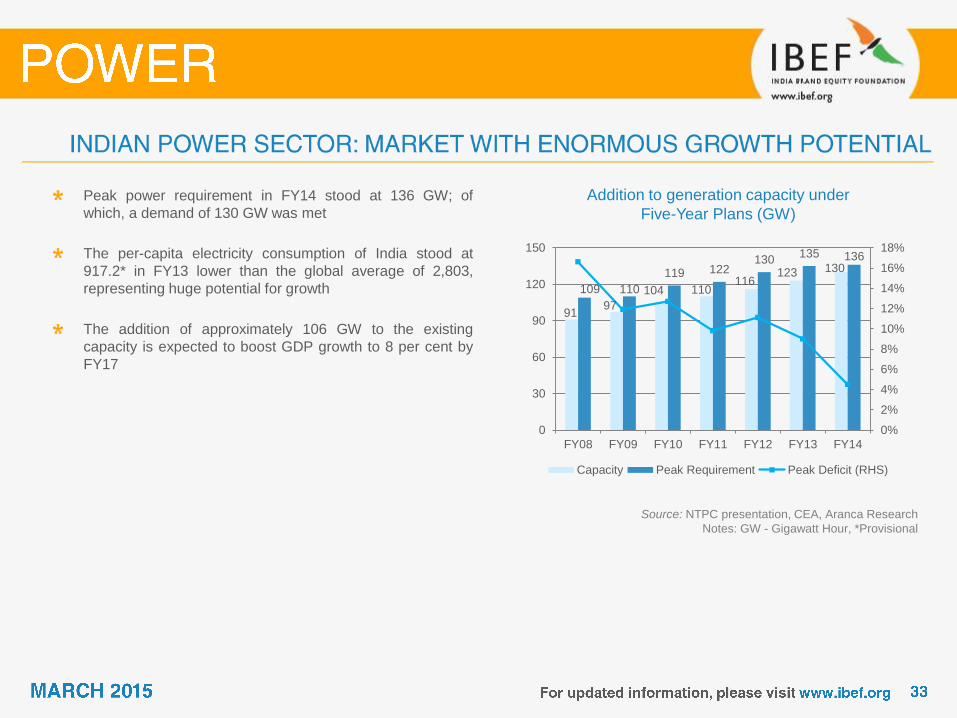
Addition to generation capacity under
Five-Year Plans (GW)
Peak power requirement in FY14 stood at 136 GW; of
which, a demand of 130 GW was met
The per-capita electricity consumption of India stood at
917.2* in FY13 lower than the global average of 2,803,
representing huge potential for growth
The addition of approximately 106 GW to the existing
capacity is expected to boost GDP growth to 8 per cent by
FY17
91 97
104 110 116
123 130
109 110
119 122 130
135 136
0%
2%
4%
6%
8%
10%
12%
14%
16%
18%
0
30
60
90
120
150
FY08 FY09 FY10 FY11 FY12 FY13 FY14
Capacity Peak Requirement Peak Deficit (RHS)
Source: BMI India Power Report Q32011, Aranca Research
Notes: EHV: Extra High Voltage (Substation), JV - Joint Venture, T&D - Transmission and Distribution, GW - Gigawatt
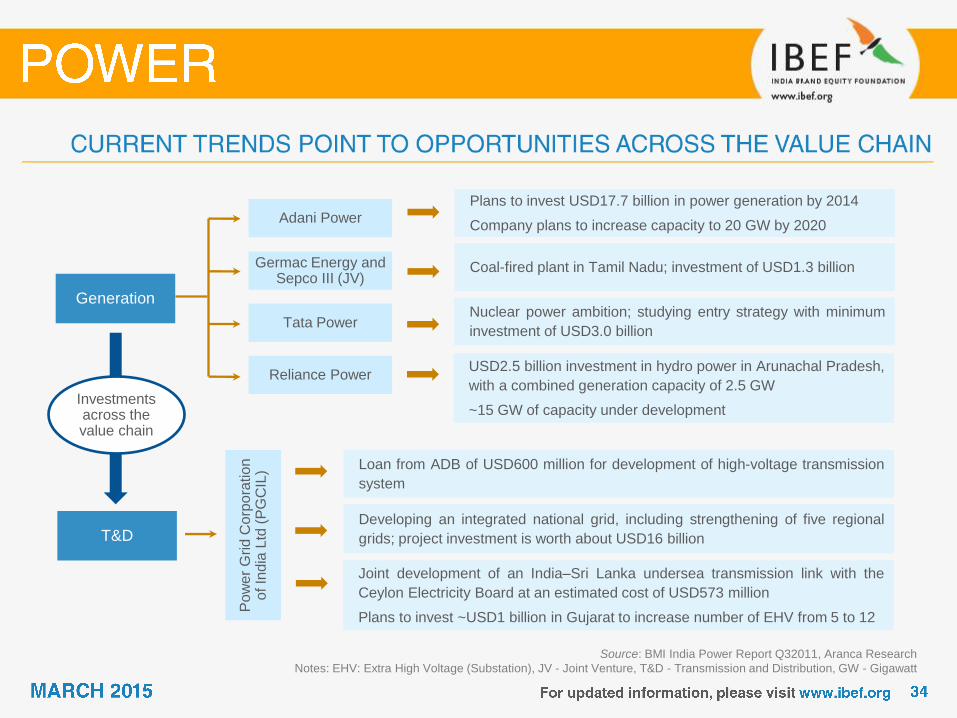
Generation
Plans to invest USD17.7 billion in power generation by 2014
Company plans to increase capacity to 20 GW by 2020
Coal-fired plant in Tamil Nadu; investment of USD1.3 billion Germac Energy and Sepco III (JV)
Adani Power
Nuclear power ambition; studying entry strategy with minimum
investment of USD3.0 billion Tata Power
USD2.5 billion investment in hydro power in Arunachal Pradesh,
with a combined generation capacity of 2.5 GW
~15 GW of capacity under development
Reliance Power
T&D
Loan from ADB of USD600 million for development of high-voltage transmission
system
Developing an integrated national grid, including strengthening of five regional
grids; project investment is worth about USD16 billion
Po
we
r G
rid
Co
rpo
ratio
n
of In
dia
Ltd
(P
GC
IL)
Joint development of an India–Sri Lanka undersea transmission link with the
Ceylon Electricity Board at an estimated cost of USD573 million
Plans to invest ~USD1 billion in Gujarat to increase number of EHV from 5 to 12
Investments across the value chain
Source: Renewables 2014 Global Status Report (REN21),
Business Monitor International (BMI),
Aranca Research, CEA,
Notes: TWh - Tera Watt Hour; GW - Gigawatt
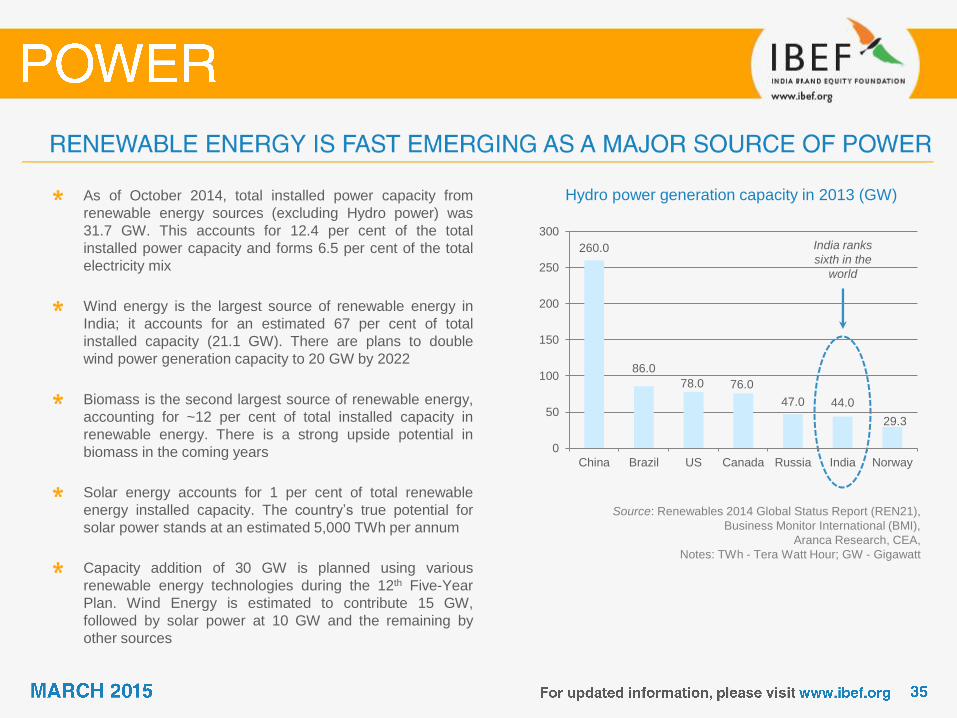
Hydro power generation capacity in 2013 (GW) As of October 2014, total installed power capacity from
renewable energy sources (excluding Hydro power) was
31.7 GW. This accounts for 12.4 per cent of the total
installed power capacity and forms 6.5 per cent of the total
electricity mix
Wind energy is the largest source of renewable energy in
India; it accounts for an estimated 67 per cent of total
installed capacity (21.1 GW). There are plans to double
wind power generation capacity to 20 GW by 2022
Biomass is the second largest source of renewable energy,
accounting for ~12 per cent of total installed capacity in
renewable energy. There is a strong upside potential in
biomass in the coming years
Solar energy accounts for 1 per cent of total renewable
energy installed capacity. The country’s true potential for
solar power stands at an estimated 5,000 TWh per annum
Capacity addition of 30 GW is planned using various
renewable energy technologies during the 12th Five-Year
Plan. Wind Energy is estimated to contribute 15 GW,
followed by solar power at 10 GW and the remaining by
other sources
260.0
86.0
78.0 76.0
47.0 44.0
29.3
0
50
100
150
200
250
300
China Brazil US Canada Russia India Norway
India ranks
sixth in the
world
4.8
20.0
0
5
10
15
20
25
2014 2020E
Source: Ministry of New and Renewable Energy, Business
Monitor International, CEA, Aranca Research
Notes: GW – Gigawatt, Mwe - Megawatt Electric,
PHWR - Pressurised Heavy Water Reactors,
BWR - Boling Water Reactors,
E - Estimates
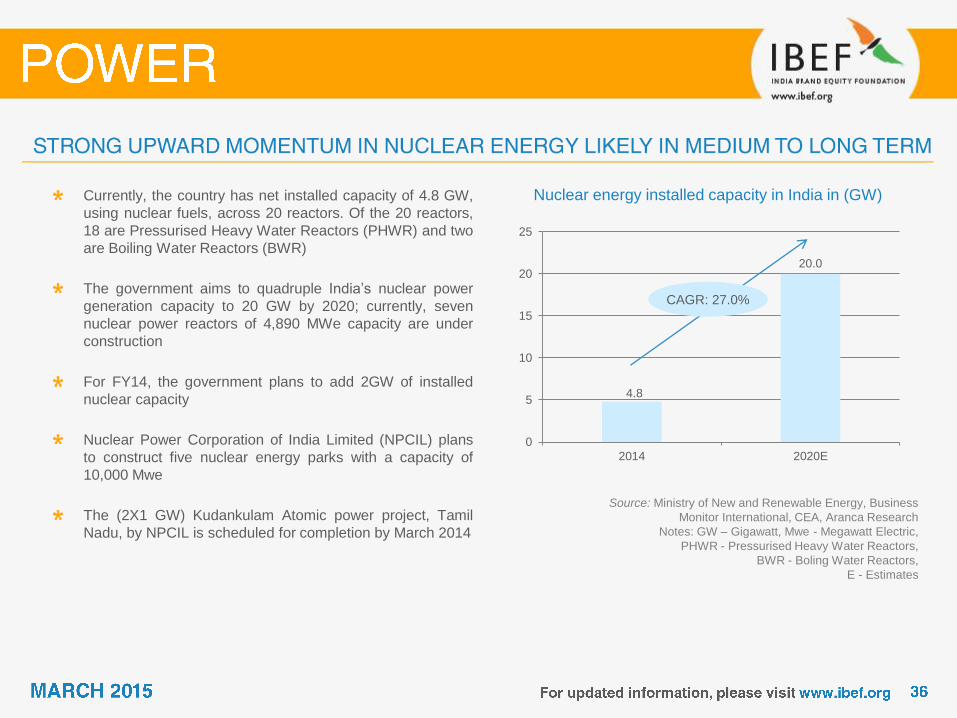
Nuclear energy installed capacity in India in (GW) Currently, the country has net installed capacity of 4.8 GW,
using nuclear fuels, across 20 reactors. Of the 20 reactors,
18 are Pressurised Heavy Water Reactors (PHWR) and two
are Boiling Water Reactors (BWR)
The government aims to quadruple India’s nuclear power
generation capacity to 20 GW by 2020; currently, seven
nuclear power reactors of 4,890 MWe capacity are under
construction
For FY14, the government plans to add 2GW of installed
nuclear capacity
Nuclear Power Corporation of India Limited (NPCIL) plans
to construct five nuclear energy parks with a capacity of
10,000 Mwe
The (2X1 GW) Kudankulam Atomic power project, Tamil
Nadu, by NPCIL is scheduled for completion by March 2014
CAGR: 27.0%

Source: NTPC website, Annual Reports,
Economic Times, Aranca Research
Notes: CAGR - Compound Annual Growth Rate,
MW – Megawatt, *Decline due to negative translation effect
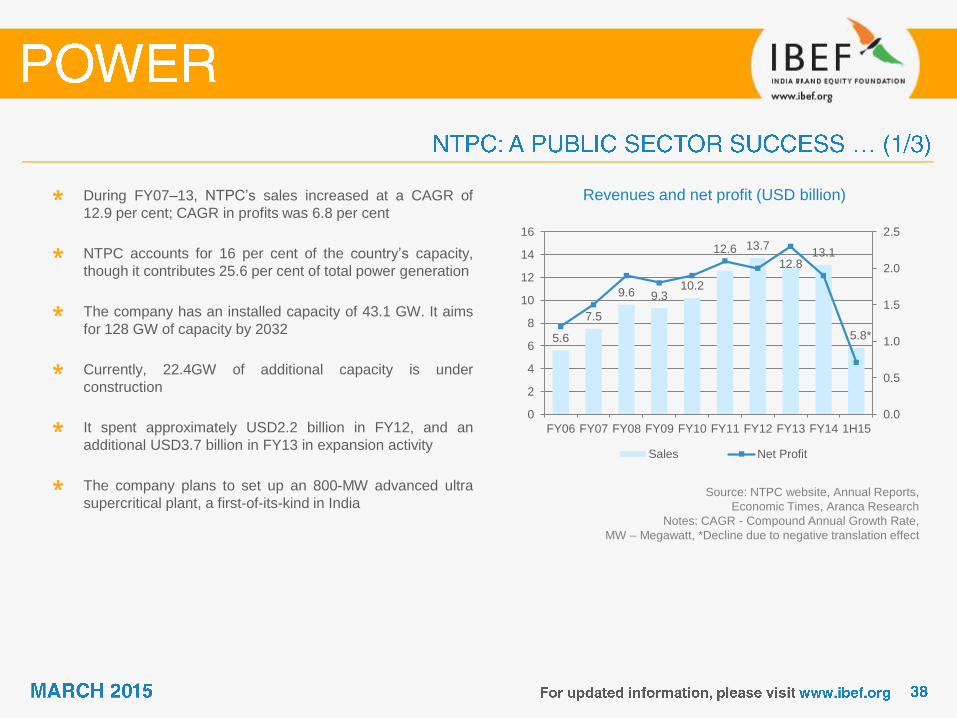
Revenues and net profit (USD billion) During FY07–13, NTPC’s sales increased at a CAGR of
12.9 per cent; CAGR in profits was 6.8 per cent
NTPC accounts for 16 per cent of the country’s capacity,
though it contributes 25.6 per cent of total power generation
The company has an installed capacity of 43.1 GW. It aims
for 128 GW of capacity by 2032
Currently, 22.4GW of additional capacity is under
construction
It spent approximately USD2.2 billion in FY12, and an
additional USD3.7 billion in FY13 in expansion activity
The company plans to set up an 800-MW advanced ultra
supercritical plant, a first-of-its-kind in India
5.6
7.5
9.6 9.3 10.2
12.6 13.7
12.8 13.1
5.8*
0.0
0.5
1.0
1.5
2.0
2.5
0
2
4
6
8
10
12
14
16
FY06 FY07 FY08 FY09 FY10 FY11 FY12 FY13 FY14 1H15
Sales Net Profit
Source: NTPC website, Annual Reports,
Economic Times, Aranca Research
Notes: PLF - Plant Load Factor,
After Takeover - Figures for FY08, MW - Megawatt
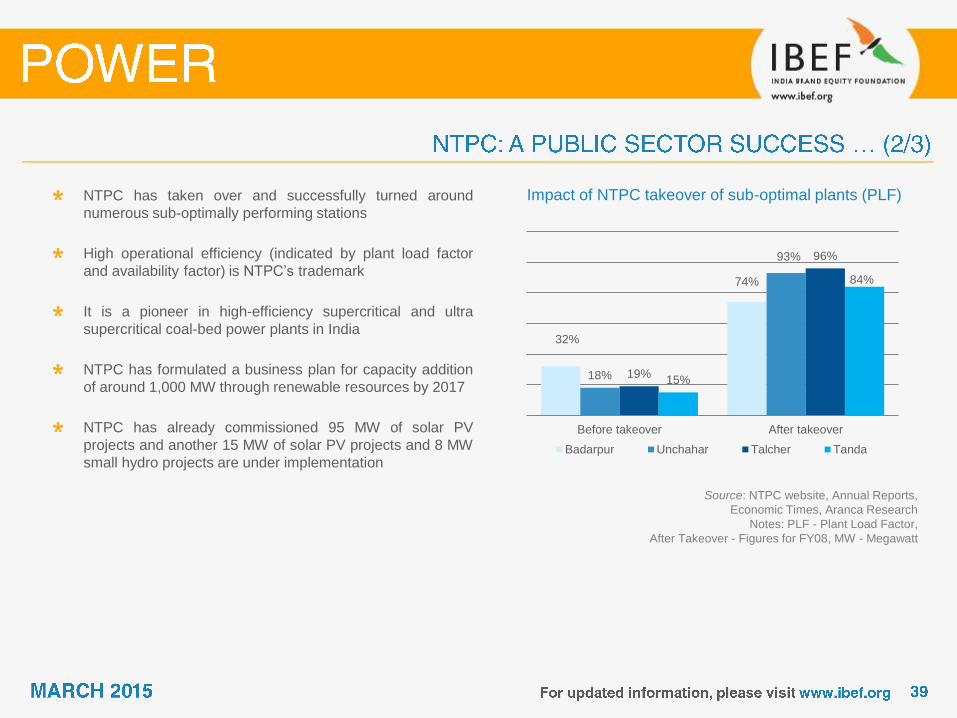
Impact of NTPC takeover of sub-optimal plants (PLF) NTPC has taken over and successfully turned around
numerous sub-optimally performing stations
High operational efficiency (indicated by plant load factor
and availability factor) is NTPC’s trademark
It is a pioneer in high-efficiency supercritical and ultra
supercritical coal-bed power plants in India
NTPC has formulated a business plan for capacity addition
of around 1,000 MW through renewable resources by 2017
NTPC has already commissioned 95 MW of solar PV
projects and another 15 MW of solar PV projects and 8 MW
small hydro projects are under implementation
32%
74%
18%
93%
19%
96%
15%
84%
Before takeover After takeover
Badarpur Unchahar Talcher Tanda
Source: NTPC website, Annual Reports,
Economic Times, Aranca Research
Notes: PLF - Plant Load Factor,
After Takeover - Figures for FY08, GW – Gigawatt,
* Till October 2014
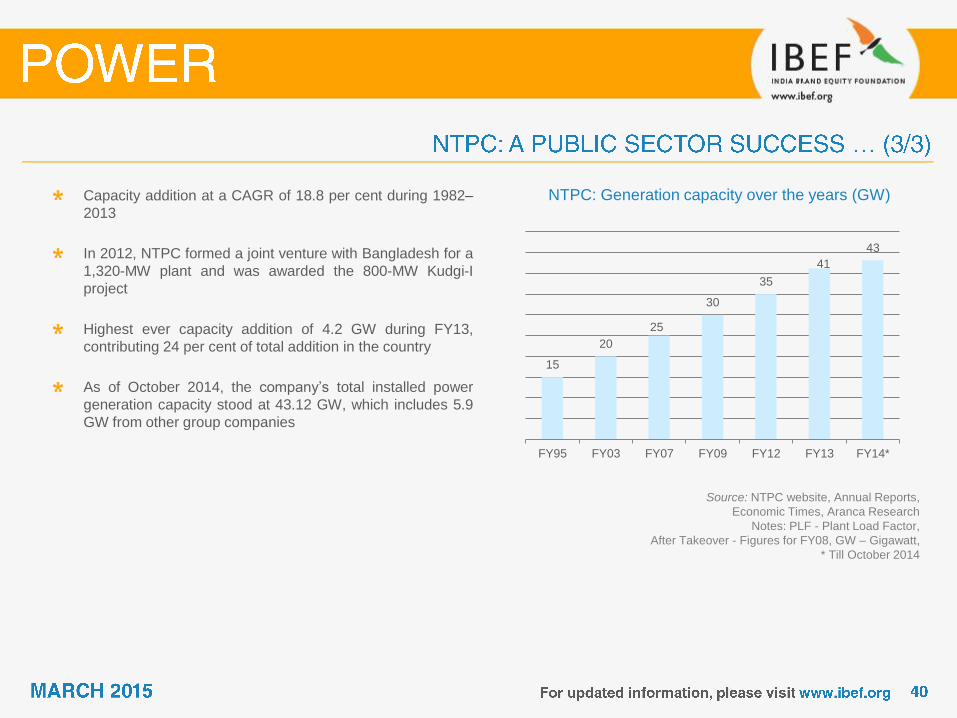
NTPC: Generation capacity over the years (GW) Capacity addition at a CAGR of 18.8 per cent during 1982–
2013
In 2012, NTPC formed a joint venture with Bangladesh for a
1,320-MW plant and was awarded the 800-MW Kudgi-I
project
Highest ever capacity addition of 4.2 GW during FY13,
contributing 24 per cent of total addition in the country
As of October 2014, the company’s total installed power
generation capacity stood at 43.12 GW, which includes 5.9
GW from other group companies
15
20
25
30
35
41
43
FY95 FY03 FY07 FY09 FY12 FY13 FY14*
1.4
2.7
3.8 3.9 4.3
5.5
6.1 5.9*
0
1
2
3
4
5
6
7
FY07 FY08 FY09 FY10 FY11 FY12 FY13 FY14
Source: Company website, Annual Reports,
Economic Times, Aranca Research
Notes: *- Decline due to negative translation effect, MW - Megawatt
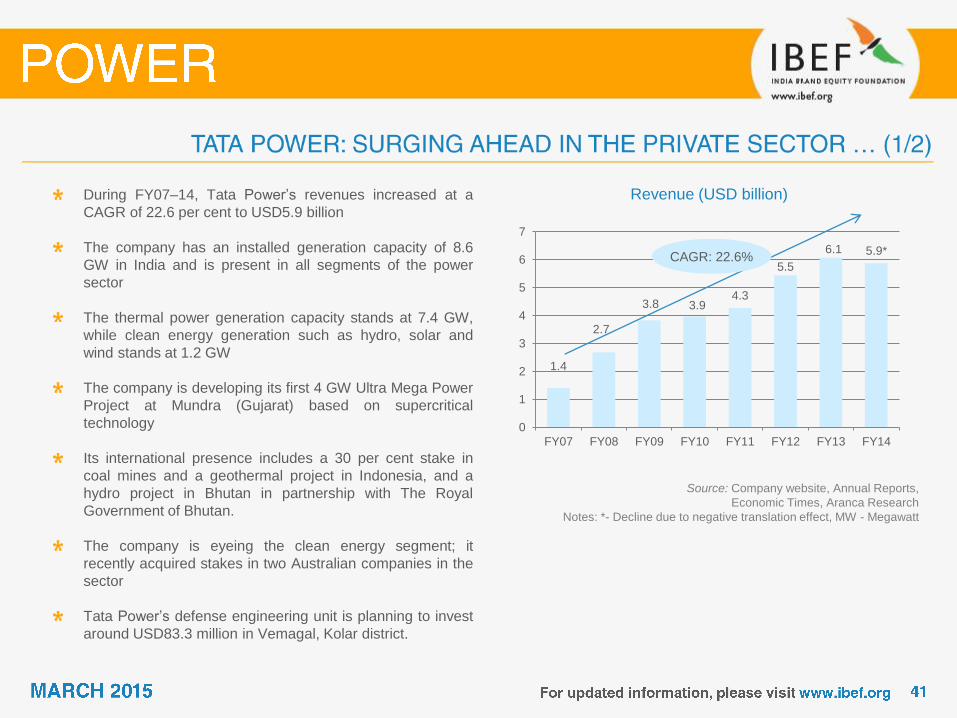
Revenue (USD billion) During FY07–14, Tata Power’s revenues increased at a
CAGR of 22.6 per cent to USD5.9 billion
The company has an installed generation capacity of 8.6
GW in India and is present in all segments of the power
sector
The thermal power generation capacity stands at 7.4 GW,
while clean energy generation such as hydro, solar and
wind stands at 1.2 GW
The company is developing its first 4 GW Ultra Mega Power
Project at Mundra (Gujarat) based on supercritical
technology
Its international presence includes a 30 per cent stake in
coal mines and a geothermal project in Indonesia, and a
hydro project in Bhutan in partnership with The Royal
Government of Bhutan.
The company is eyeing the clean energy segment; it
recently acquired stakes in two Australian companies in the
sector
Tata Power’s defense engineering unit is planning to invest
around USD83.3 million in Vemagal, Kolar district.
CAGR: 22.6%
Source: Company website, Company Presentation,
FY17 estimate as per press release, 15th July 2011
Notes: MW - Megawatt, CAGR - Compounded Annual Growth Rate
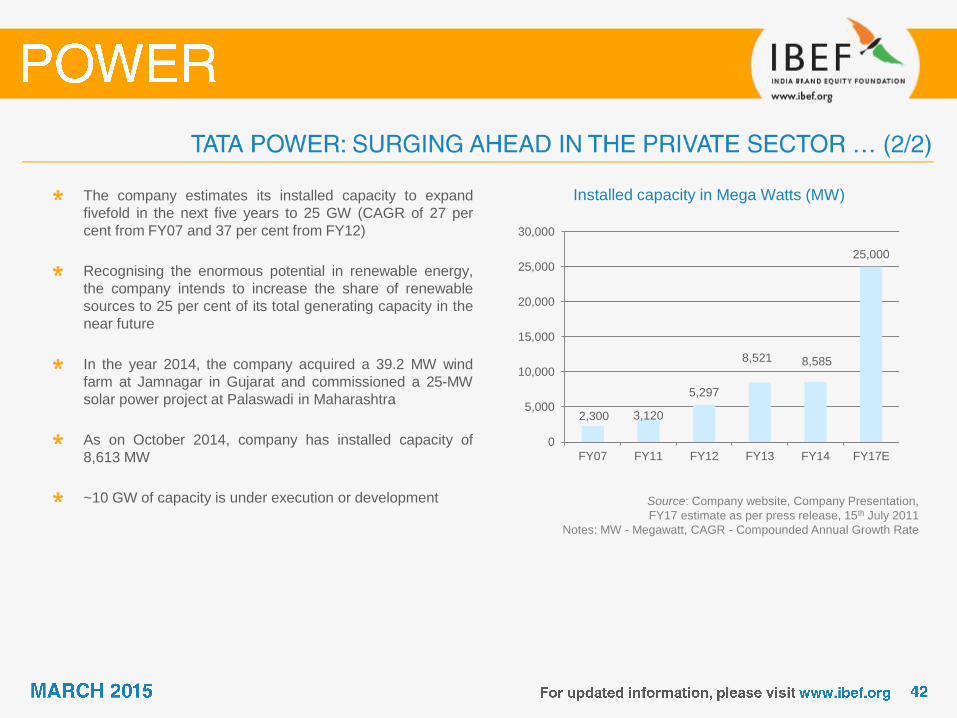
Installed capacity in Mega Watts (MW) The company estimates its installed capacity to expand
fivefold in the next five years to 25 GW (CAGR of 27 per
cent from FY07 and 37 per cent from FY12)
Recognising the enormous potential in renewable energy,
the company intends to increase the share of renewable
sources to 25 per cent of its total generating capacity in the
near future
In the year 2014, the company acquired a 39.2 MW wind
farm at Jamnagar in Gujarat and commissioned a 25-MW
solar power project at Palaswadi in Maharashtra
As on October 2014, company has installed capacity of
8,613 MW
~10 GW of capacity is under execution or development
2,300 3,120
5,297
8,521 8,585
25,000
0
5,000
10,000
15,000
20,000
25,000
30,000
FY07 FY11 FY12 FY13 FY14 FY17E
Source: Reliance Power website, Annual Reports,
Industry News, Aranca Research
Notes: -Decline due to negative translation effect,
MW – Megawatt, MTPA - Million Tonnes Per Annum
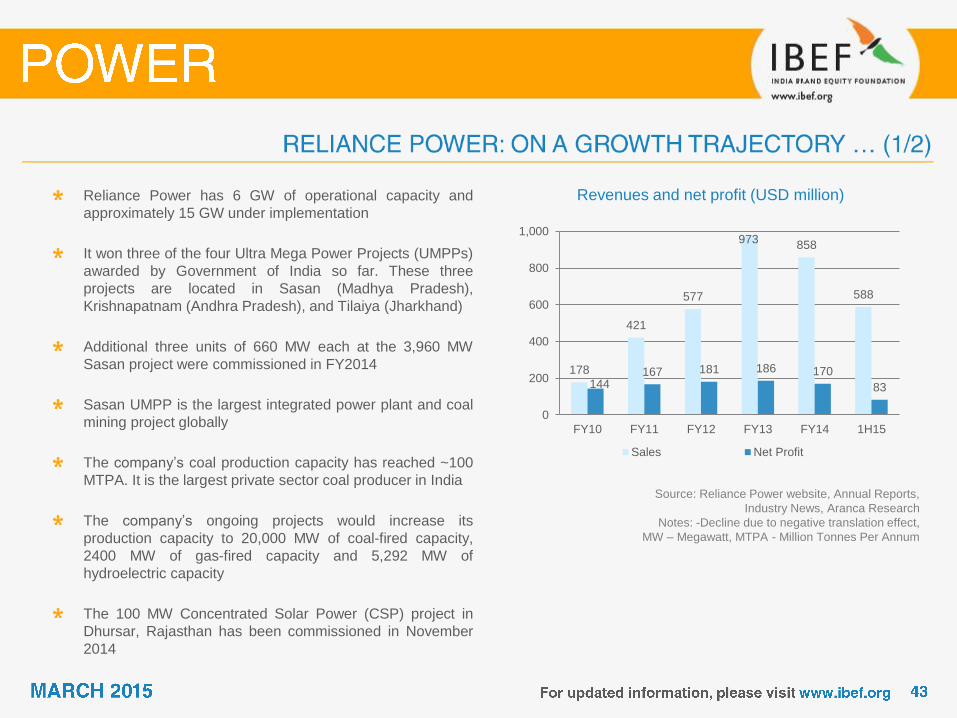
Revenues and net profit (USD million) Reliance Power has 6 GW of operational capacity and
approximately 15 GW under implementation
It won three of the four Ultra Mega Power Projects (UMPPs)
awarded by Government of India so far. These three
projects are located in Sasan (Madhya Pradesh),
Krishnapatnam (Andhra Pradesh), and Tilaiya (Jharkhand)
Additional three units of 660 MW each at the 3,960 MW
Sasan project were commissioned in FY2014
Sasan UMPP is the largest integrated power plant and coal
mining project globally
The company’s coal production capacity has reached ~100
MTPA. It is the largest private sector coal producer in India
The company’s ongoing projects would increase its
production capacity to 20,000 MW of coal-fired capacity,
2400 MW of gas-fired capacity and 5,292 MW of
hydroelectric capacity
The 100 MW Concentrated Solar Power (CSP) project in
Dhursar, Rajasthan has been commissioned in November
2014
178
421
577
973 858
588
144 167 181 186 170
83
0
200
400
600
800
1,000
FY10 FY11 FY12 FY13 FY14 1H15
Sales Net Profit
Source: Reliance Power website,
Corporate Presentation, Annual Reports, Economic
Times, Industry News, Aranca Research
Notes: MW - Megawatt, E - Estimate
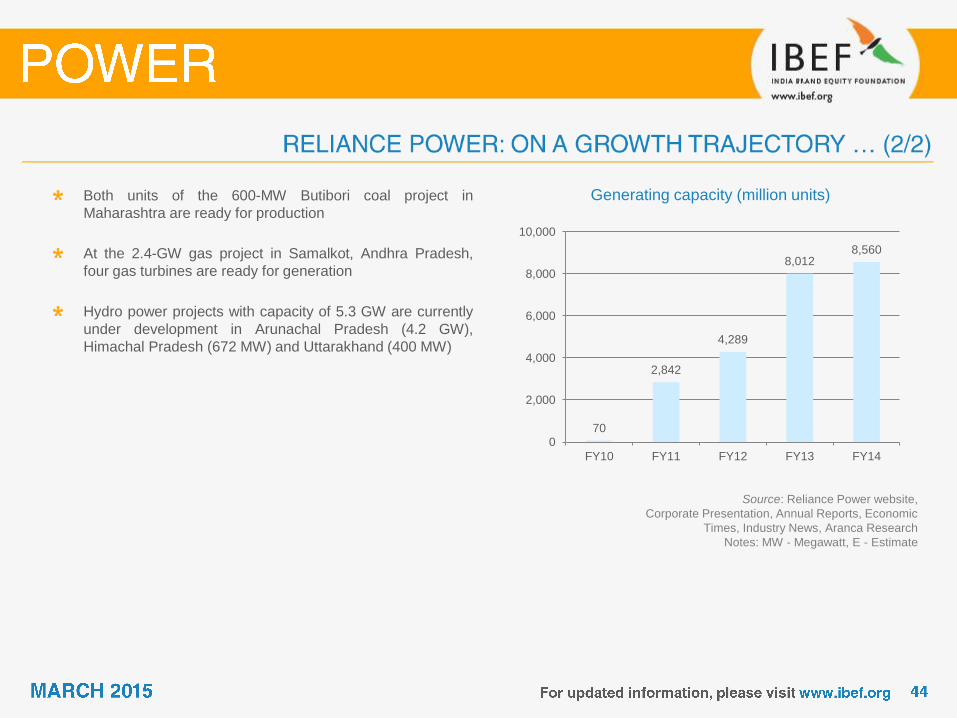
Generating capacity (million units) Both units of the 600-MW Butibori coal project in
Maharashtra are ready for production
At the 2.4-GW gas project in Samalkot, Andhra Pradesh,
four gas turbines are ready for generation
Hydro power projects with capacity of 5.3 GW are currently
under development in Arunachal Pradesh (4.2 GW),
Himachal Pradesh (672 MW) and Uttarakhand (400 MW)
70
2,842
4,289
8,012 8,560
0
2,000
4,000
6,000
8,000
10,000
FY10 FY11 FY12 FY13 FY14
Council of Power Utilities A-2/158, Janakpuri, New Delhi-110058, India
Tel: 91 11 25618472, 45652708
Fax: 25611622
E-mail: [email protected], [email protected]
Web site: www.indiapower.org
Hydro Power Association (India) Flat no 6, Green Park Apartment, Shriram Society, Warje,
Pune - 411058, Maharashtra, India
Tel: 91 20 25233338
E-mail: [email protected], [email protected],
Website: http://hpaindia.org/
Bureau of Energy Efficiency (BEE) Ministry of Power, 4th Floor, SEWA Bhawan, R. K. Puram,
New Delhi – 110066, India
Tel: 91 11 26179699
Fax: 91 11 26178352
E-mail: [email protected]
Website: http://www.beeindia.in/
Indian Wind Energy Association (INWEA) PHD House, 3rd Floor, Opp. Asian Games Village, August
Kranti Marg, New Delhi-110016, India
Tel: 91 11 26523042
E-mail: [email protected]
Web site: http://www.inwea.org/
CAGR: Compound Annual Growth Rate
FDI: Foreign Direct Investment
FY: Indian Financial Year (April to March)
So FY10 implies April 2009 to March 2010
GW: Gigawatt
M&A: Merger and Acquisition
MW: Megawatt
NBFC: Non-Banking Financial Company
PE: Private Equity
PLF: Plant Load Factor
R&D: Research and Development
R-APDRP: Restructured Accelerated Power Development and Reform Programme
T&D: Transmission and Distribution
TWh: Terawatt-Hour
RGGVY: Rajiv Gandhi Grameen Vidyutikaran Yojana
USD: US Dollar
Wherever applicable, numbers have been rounded off to the nearest whole number
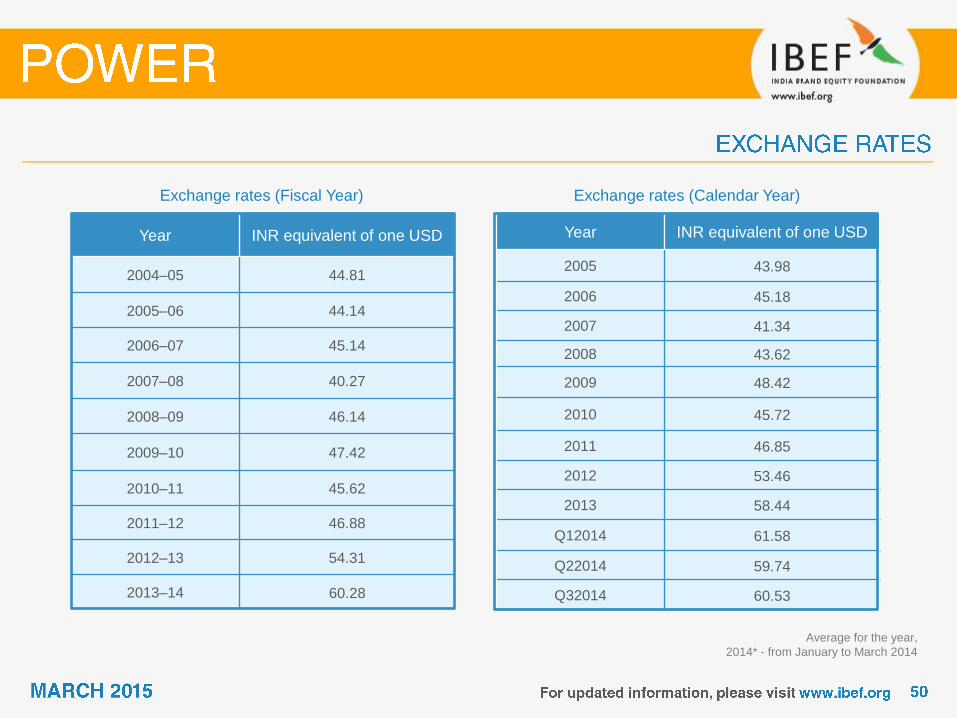
Year INR equivalent of one USD
2004–05 44.81
2005–06 44.14
2006–07 45.14
2007–08 40.27
2008–09 46.14
2009–10 47.42
2010–11 45.62
2011–12 46.88
2012–13 54.31
2013–14 60.28
Exchange rates (Fiscal Year)
Year INR equivalent of one USD
2005 43.98
2006 45.18
2007 41.34
2008 43.62
2009 48.42
2010 45.72
2011 46.85
2012 53.46
2013 58.44
Q12014 61.58
Q22014 59.74
Q32014 60.53
Exchange rates (Calendar Year)
Average for the year,
2014* - from January to March 2014
India Brand Equity Foundation (IBEF) engaged Aranca to prepare this presentation and the same has been prepared
by Aranca in consultation with IBEF.
All rights reserved. All copyright in this presentation and related works is solely and exclusively owned by IBEF. The
same may not be reproduced, wholly or in part in any material form (including photocopying or storing it in any
medium by electronic means and whether or not transiently or incidentally to some other use of this presentation),
modified or in any manner communicated to any third party except with the written approval of IBEF.
This presentation is for information purposes only. While due care has been taken during the compilation of this
presentation to ensure that the information is accurate to the best of Aranca and IBEF’s knowledge and belief, the
content is not to be construed in any manner whatsoever as a substitute for professional advice.
Aranca and IBEF neither recommend nor endorse any specific products or services that may have been mentioned in
this presentation and nor do they assume any liability or responsibility for the outcome of decisions taken as a result of
any reliance placed on this presentation.
Neither Aranca nor IBEF shall be liable for any direct or indirect damages that may arise due to any act or omission on
the part of the user due to any reliance placed or guidance taken from any portion of this presentation.