cdp 2017 climate change 2017 information request - nokia · pdf filecdp 2017 climate change...
TRANSCRIPT

CDP CDP 2017 Climate Change 2017 Information Request
Nokia Group
Module: Introduction
Page: Introduction
CC0.1
Introduction
Please give a general description and introduction to your organization. At Nokia, we create the technology to connect the world. Powered by the research and innovation of Nokia Bell Labs, we serve communications service providers, governments, large enterprises and consumers, with the industry’s most complete, end-to-end portfolio of products, services and licensing. From the enabling infrastructure for 5G and the Internet of Things, to emerging applications in virtual reality and digital health, we are shaping the future of technology to transform the human experience. A truly global company, we are 160 nationalities working in more than 100 countries. At the end of 2015, our shareholders voted overwhelmingly to approve the Alcatel-Lucent acquisition, and in early January 2016 we announced that we had gained control of Alcatel- Lucent through the successful public exchange offer for all outstanding Alcatel-Lucent securities by holding nearly 80% of outstanding Alcatel- Lucent securities. On November 2, 2016, we achieved 100% ownership of Alcatel-Lucent. Former Alcatel-Lucent operations are fully included in our 2016 Nokia Group reporting. We use the term “Comparable combined company” when we refer to information including combined Nokia Group and former Alcatel-Lucent data prior to acquisition of Alcatel-Lucent in January 2016. Nokia Group data excludes Discontinued operations, which refer to the sale of the Devices and Services Business in 2014 and the sale of HERE Business in 2015.
In the 2017 CDP response, where we do comparisons to 2015, they are done against “Comparable combined company”, i.e. the 2015 values are different from the numbers provided in Nokia's 2016 CDP Climate response.
CC0.2
Reporting Year
Please state the start and end date of the year for which you are reporting data. The current reporting year is the latest/most recent 12-month period for which data is reported. Enter the dates of this year first. We request data for more than one reporting period for some emission accounting questions. Please provide data for the three years prior to the current reporting year if you have not provided this information before, or if this is the first time you have answered a CDP information request. (This does not apply if you have been offered and selected the option of answering the shorter questionnaire). If you are going to provide additional years of data, please give the dates of those reporting periods here. Work backwards from the most recent reporting year. Please enter dates in following format: day(DD)/month(MM)/year(YYYY) (i.e. 31/01/2001).
Enter Periods that will be disclosed
Fri 01 Jan 2016 - Sat 31 Dec 2016
CC0.3
Country list configuration
Please select the countries for which you will be supplying data. If you are responding to the Electric Utilities module, this selection will be carried forward to assist you in completing your response.
Select country
CC0.4
Currency selection
Please select the currency in which you would like to submit your response. All financial information contained in the response should be in this currency. EUR(€)
CC0.6
Modules
As part of the request for information on behalf of investors, companies in the electric utility sector, companies in the automobile and auto component manufacturing sector, companies in the oil and gas sector, companies in the information and communications technology sector (ICT) and companies in the food, beverage and tobacco sector (FBT) should complete supplementary questions in addition to the core questionnaire. If you are in these sector groupings, the corresponding sector modules will not appear among the options of question CC0.6 but will automatically appear in the ORS navigation bar when you save this page. If you want to query your classification, please email [email protected]. If you have not been presented with a sector module that you consider would be appropriate for your company to answer, please select the module below in CC0.6.
Further Information
Module: Management
Page: CC1. Governance
CC1.1
Where is the highest level of direct responsibility for climate change within your organization?
Board or individual/sub-set of the Board or other committee appointed by the Board
CC1.1a
Please identify the position of the individual or name of the committee with this responsibility
Corporate Responsibility - including climate change and our environmental impact related - issues are reviewed recurrently by management & experts functions across the company, including the highest decision-making bodies of the company: the highest decision-making body at Nokia after the General Meeting of shareholders is the Board of Directors. The Nokia Board has only a few dedicated committees and not, for example, a dedicated committee for sustainability. However, the full Board of Directors reviews our overall sustainability activities annually, and in addition, specific topics when needed. In 2016-1H2017 the Board reviewed the Nokia sustainability focus areas, priorities, their alignment with the UN SDGs, targets (for example Science-based climate targets) and performance, new materiality analysis with key sustainability topics and their impact on business success & sustainable development. The Board's Audit committee reviews annually e.g. the sustainability content of Nokia's Annual Report. The Nokia Group Leadership Team, chaired by the President and CEO, is responsible for managing our operations. This includes reviewing and approving our policies and main responsibility initiatives. They also approve Nokia’s sustainability strategy, long term and annual targets, the annual sustainability report, as well as how we link sustainability performance into our rewarding system. They review and give feedback at least twice a year. At Executive level, Mr. Barry French, Chief Marketing Officer and member of the Group Leadership Team, is responsible for corporate responsibility at the executive management level. The Marketing & Corporate Affairs (MCA) function, under his leadership, is responsible for all marketing, communications and corporate affairs activities across Nokia. In 2016, at Executive level, Mr. Marc Rouanne, Chief Innovation & Operating Officer (CIOO) and member of the Group Leadership Team had responsibility for the company's entire research, R&D, CTO and he was also responsible for Environmental activity under the newly created function Health, Safety, Security & Environment (HSSE). HSSE is in charge of setting Nokia’s HSSE strategy, model and external reporting. Key environmental programs include Contractor Management, Energy/ CO2 reduction, Waste management, and Design for Environment. The HSSE function owns Nokia’s Health & Safety and Environmental management systems, including certification against international standards such as OHSAS 18001 and ISO 14001. It sets policies and standards, and defines procedures for high-risk activities, including certification and training requirements. Our Corporate Responsibility Council, which consists of senior representatives – typically leadership team members from our business units and support functions – meets quarterly and ensures alignment across the business on responsibility strategy, priorities, and the implementation of responsibility activities. Council is lead by Sandra Cornet-Vernet Lehongre, Head of Corporate Sustainability. With regards to Climate change more specifically, three complementary organizational bodies are primarily responsible for executing environmental initiatives and operational activities across the company, leading and carrying forward the company environmental public commitments, within business units and toward all employees working for Nokia. • Environmental teams, headed by Pia Tanskanen - Head of Environment - develop compliance assurance programs & policies to meet legal, customer and company requirements. They ensure the implementation of environmental programs, and use the Environmental Management System to ensure compliance, continual improvement and performance in line with industry best practices. • Workplace Resources headed by Jerry Dunne, head of Workplace Resources. A network of experts across the world identify and drive environmental and climate change improvements impacting our global operations. They ensure carbon footprint information is reported reliably and on time and local action plans are implemented properly • CTO and Bell Labs – headed by Marc Benowitz - head of Reliability and Eco- Environmental Engineering Services - address environmental initiatives and goals linked to products, services and solutions. In collaboration with business lines teams, they look for ways to minimize the environmental impact of Nokia

products throughout their life cycle by developing and deploying eco conscious design processes, practices and tools. More about our governance can be read on our People & Planet 2016 Report, pages 36-37 http://www.nokia.com/sites/default/files/nokia_people_and_planet_report_2016.pdf
CC1.2
Do you provide incentives for the management of climate change issues, including the attainment of targets?
Yes
CC1.2a
Please provide further details on the incentives provided for the management of climate change issues
Who is entitled to benefit from these incentives?
The type of incentives
Incentivized performance indicator
Comment
Environment/Sustainability managers
Monetary reward
Emissions reduction target Efficiency target Other: Establishment of new sustainability strategy and long-term targets; ISO14001 certification
Monetary rewards based on annual target / performance review is the standard practise. Also monetary awards and other forms of recognition are used for the work well done. In 2016 Sustainability head had an incentive on establishing a new strategy and bold related long term targets for 2017 and beyond, aligned with the UN Sustainable Development Goals. Climate & environment is one of our top 4 priorities, based on the results of our 2016 materiality assessment (see pages 32-34 of our 2016 People & Planet report). We identified 20 key issues related to sustainability, 8 of them being environmental or climate related. 10 dedicated green targets were established. Nokia Head of Environment had and has incentives for climate change. Several environmental managers in product development had targets in 2016 and continue to have targets for product energy efficiency. In 2016, many people in the organisation also had and continue to have targets to support Nokia level ISO 14001 certificate, which forms the backbone of systematic overall climate change management.
Facility managers Monetary reward
Energy reduction target
In 2016 the facility organisation (including the Head of Real Estate) and their suppliers had energy saving target (2% reduction) embedded in the facility
Who is entitled to benefit from these incentives?
The type of incentives
Incentivized performance indicator
Comment
scorecard, having direct effect on Nokia's own facility employees' and contractors' incentives.
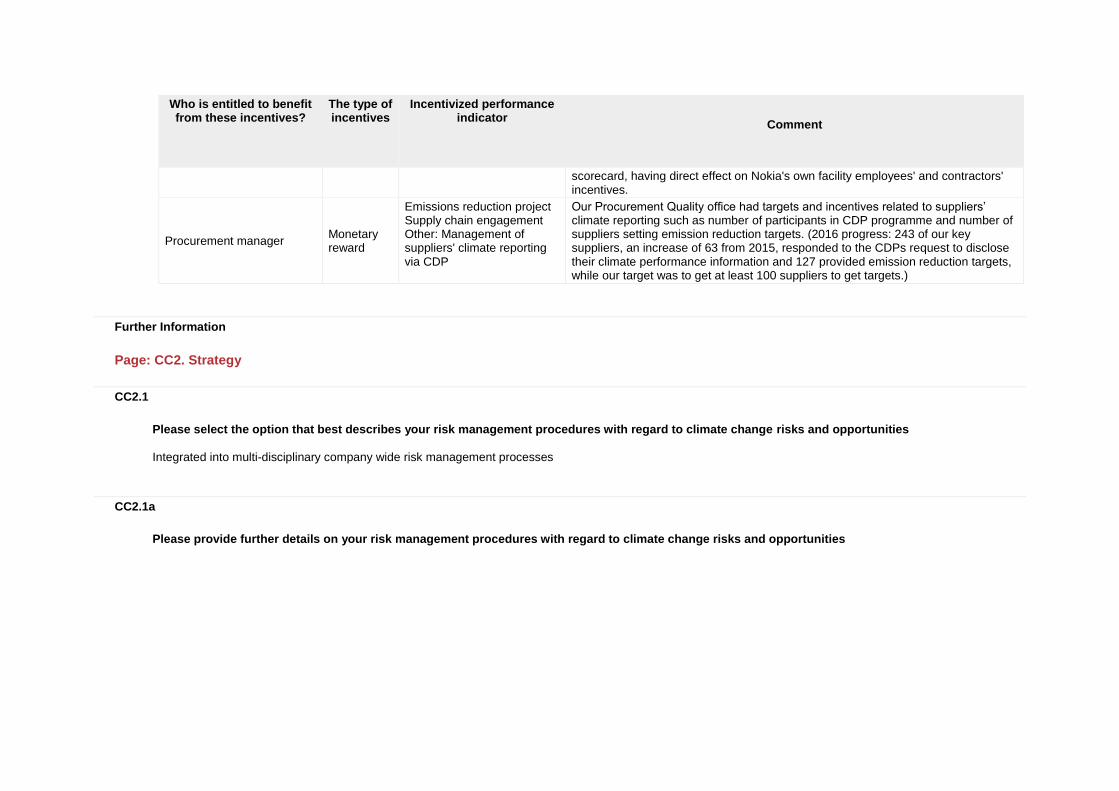
Procurement manager Monetary reward
Emissions reduction project Supply chain engagement Other: Management of suppliers' climate reporting via CDP
Our Procurement Quality office had targets and incentives related to suppliers’ climate reporting such as number of participants in CDP programme and number of suppliers setting emission reduction targets. (2016 progress: 243 of our key suppliers, an increase of 63 from 2015, responded to the CDPs request to disclose their climate performance information and 127 provided emission reduction targets, while our target was to get at least 100 suppliers to get targets.)
Further Information
Page: CC2. Strategy
CC2.1
Please select the option that best describes your risk management procedures with regard to climate change risks and opportunities
Integrated into multi-disciplinary company wide risk management processes
CC2.1a
Please provide further details on your risk management procedures with regard to climate change risks and opportunities

Frequency of monitoring
To whom are results reported?
Geographical areas
considered
How far into the future are risks
considered?
Comment
Six-monthly or more frequently
Board or individual/sub-set of the Board or committee appointed by the Board
Global > 6 years
CC2.1b
Please describe how your risk and opportunity identification processes are applied at both company and asset level
In addition to the company level, we identify risks and opportunities through reviews that focus on the individual Nokia Businesses and key functions or areas ("asset level"). We have a company level Enterprise Risk Management function within the CFO organization (Group ERM), as well as asset level dedicated risk management roles. The appropriate identification processes are applied at the company as well as assets level in processes established by Group ERM. Group ERM has visibility of both company and asset level reviews in order to ensure that we capture appropriately both levels and handle the risks and opportunities at the appropriate level. The risk management covers strategic, operational, financial and hazard risks. Also sustainability related e.g. climate change risks and opportunities are analysed. Key risks and opportunities are reviewed by the Group Leadership Team and the Board of Directors (BoD) in order to create visibility on business risks as well as to enable prioritization. In addition to the principles defined in the Nokia Risk Management Policy (NRMP), specific risk management implementation is reflected in other key policies. Nokia has a systematic and structured approach to risk and opportunity management across business operations and processes. Key risks and opportunities are primarily identified against business targets either in business operations or as an integral part of long and short-term planning. Key risks and opportunities are analyzed, managed, monitored and identified at asset and company level as part of business performance management. The principles documented in the NRMP, which is approved by the Audit Committee of the BoD, require risk management and its elements to be integrated into key processes. One of the main principles is that the business or function head is also the risk owner, although all employees are responsible for identifying, analyzing and managing risks as appropriate to their roles and duties
CC2.1c
How do you prioritize the risks and opportunities identified?
Prioritizing is made for instance using Nokia risk and opportunity mapping and analysis processes and also utilizing tools where identified risks and opportunities are ranked based on the possible impact (€), probability and time frame. Key risks and opportunities are reviewed by the Group Leadership Team and the Board of Directors in order to create visibility on business risks as well as to enable prioritization of risk management activities. Risk management covers strategic, operational, financial and hazard risks. Also sustainability related e.g. climate change risks and opportunities are analysed. In addition to the principles defined in the Nokia Risk Management Policy, specific risk management implementation is reflected in other key policies. Nokia has a systematic and structured approach to risk and opportunity management across business operations and processes. Key risks and opportunities are
primarily identified against business targets either in business operations or as an integral part of long and short-term planning. Key risks and opportunities are analyzed, managed, monitored and identified as part of business performance management with the support of risk management personnel. Nokia’s overall risk management concept is based on managing the key risks that would prevent Nokia from meeting its objectives, rather than solely focusing on eliminating risks. The principles documented in the Nokia Risk Management Policy, which is approved by the Audit Committee of the Board of Directors, require risk management and its elements to be integrated into key processes. One of the main principles is that the business or function head is also the risk owner, although all employees are responsible for identifying, analyzing and managing risks as appropriate to their roles and duties.
CC2.1d
Please explain why you do not have a process in place for assessing and managing risks and opportunities from climate change, and whether you plan to introduce such a process in future
Main reason for not having a process
Do you plan to introduce a process?
Comment
CC2.2
Is climate change integrated into your business strategy?
Yes
CC2.2a
Please describe the process of how climate change is integrated into your business strategy and any outcomes of this process
i) How the business strategy has been influenced (the internal process): We take a systematic approach to identifying the opportunities and risks sustainability presents, and we aim to minimize the negative impact of our operations and to find new opportunities for revenue increase and cost savings. We revise our sustainability - including Climate Change - materiality and risk & opportunity analysis

annually and collect regularly information starting from long term macro forecasts to sustainability related market studies and our internal performance data. Sustainability and climate change with targets, activities and follow-up process is included in various business activities and related strategies. One of the key topics in our materiality analysis is “the Product energy efficiency and GHG emissions” and some of the related solutions we have developed are described below. ii) Example of how the business strategy has been influenced: Some examples of how the business strategy has been influenced in 2016 were the decision to further develop and launch the Zero Emission 2.0 product offering with 20 new innovations, and AirScale base station which can reduce operator CO2 emissions by up to 60%. We were the first telco equipment vendor to sign the commitment to Science-Based Targets initiative and submitted our related emission reduction targets. In April 2016, Nokia launched its Passive Optical LAN solution. POL requires less capital costs than traditional copper-based LANs while offering a lower operating expense, and consuming less energy. In 2016 we acquired EtaDevices and Gainspeed both companies supporting our goals of improved product energy efficiency. iii) What aspects of climate change have influenced the strategy: The most important aspect that has influenced the strategy is finding new business and cost savings opportunities - examples especially related to energy efficiency of our networks are given below. Issues like regulatory changes or need for adaptation are also taken into account however their influence in the strategy has been more limited. iv) How the short term strategy that have been influenced by climate change: Our 2016 (short term) targets included to “Continue to expand the Zero CO2 Emission offering with new innovations” and to “improve the energy efficiency of our products in each main release by 15%”. In 2016, we launched the Zero Emission 2.0 product offering with 20 new innovations, and AirScale base station which can reduce operator CO2 emissions by up to 60%. This helps our operator customers to reduce energy consumption and costs in their networks. In 2016 we modernized 27% more base stations than in 2015, average energy savings of 43% for our customers. Another energy efficiency related innovation is the iSON Manager Energy Efficiency module. The module enables energy savings by adapting available network capacity according to the network usage. Extra capacity can be turned off and re-activated according to the network traffic load requirements. In a pre-launch trial on a live network with Korean operator KT Corporation, the solution helped reduce the LTE radio network energy consumption by approximately 40%. We also worked with CenturyLink to reduce their network power consumption by approximately 22 000 megawatt-hours a year through network optimization, by applying our PSTN Smart Transform solution. v) How the long term strategy that have been influenced by climate change: Nokia believes that over the next 10 years billions of connected devices will converge into intelligent and programmable systems that will have the potential to improve lives in a vast number of areas: time and availability, transportation and resource consumption, safer energy, clean water, reducing greenhouse gas emissions, learning and work, health and wellness, and many more. We see clear long term opportunities for Nokia in this increasingly connected world. According to the Global e-Sustainability Initiative’s (GeSI) Smarter 2030 Report, ICT has the potential to enable a 20% reduction of global CO2e emissions by 2030, thus holding emissions at 2015 levels, and to effectively decouple economic growth from emissions growth. In 2016 we were the first telco equipment vendor to sign the commitment to Science-Based Targets initiative and submitted our long term emission reduction targets. By 2030 we aim to reduce GHG emission compared to 2014 level: 41% reduction in our own operations (Scopes 1+2) and 75% reduction in the energy use of sold

products (Scope 3). vi) How this is gaining you strategic advantage over the competitors: Many of the solutions described above like Zero emissions product offering, AirScale base stations”, “iSON Manager Energy Eff iciency module, Liquid cooling, Passive Optical LAN solution etc. are unique and we believe they can help us in gaining competitive advantage by helping our customers to save energy and related costs. vii) Example of substantial business decision made: In 2016, we launched the Zero Emission 2.0 product offering with 20 new innovations, and AirScale base station which can reduce operator CO2 emissions by up to 60%. This helps our operator customers to reduce energy consumption and costs in their networks. In 2016 we modernized 27% more base stations than in 2015, average energy savings of 43% for our customers. We demonstrated also our liquid cooling innovation for base station sites at shows in Barcelona and Florida. In 2016 we were the first telco equipment vendor to sign the commitment to Science-Based Targets initiative and submitted our long term emission reduction targets. By 2030 we aim to reduce GHG emission compared to 2014 level: 41% reduction in our own operations (Scopes 1+2) and 75% reduction in the energy use of sold products (Scope 3). This decision has strategic importance as it helps our operator customers to reduce energy consumption and costs in their networks. In 2016 we acquired EtaDevices and Gainspeed both companies supporting our goals of improved product energy efficiency. viii) Impact of Paris agreement & ix) forward looking scenario analysis AND Emission reduction target linked to business strategy: In 2016 we were the first telco equipment vendor to sign the commitment to Science-Based Targets initiative and submitted our long term emission reduction targets. By 2030 we aim to reduce GHG emission compared to 2014 level: 41% reduction in our own operations (Scopes 1+2) and 75% reduction in the energy use of sold products (Scope 3). This has strategic importance as it helps our operator customers to reduce energy consumption and costs in their networks. These science based targets are in line with the Paris agreement objectives and the 2°C scenario has been the basis of the Science-Based Targets setting.
CC2.2b
Please explain why climate change is not integrated into your business strategy

CC2.2c
Does your company use an internal price on carbon?
No, and we currently don't anticipate doing so in the next 2 years
CC2.2d
Please provide details and examples of how your company uses an internal price on carbon
CC2.3
Do you engage in activities that could either directly or indirectly influence public policy on climate change through any of the following? (tick all that apply)
Direct engagement with policy makers Trade associations
CC2.3a
On what issues have you been engaging directly with policy makers?
Focus of legislation
Corporate Position
Details of engagement
Proposed legislative solution
Energy efficiency
Support
Nokia has been driving network energy consumption reduction proactively in R&D and development of energy efficiency standards. Nokia has participated at European Commission EMAS workshop and provided written contribution describing the related Nokia strategy and achievements related to energy efficiency
Competition based on energy consumption and energy cost have more effect than legislation could have in the rapidly changing Telecom business
CC2.3b

Are you on the Board of any trade associations or provide funding beyond membership?
Yes
CC2.3c
Please enter the details of those trade associations that are likely to take a position on climate change legislation
Trade association
Is your position
on climate change
consistent with
theirs?
Please explain the trade association's position
How have you, or are you attempting to, influence the position?
Digital Europe Consistent
In issues that are relevant for Nokia e.g. global harmonization of product energy efficiency requirements such as the US DOE requirements as well as the EU code of conduct and eco-design requirements for energy efficiency of external power supplies we are consistent with DE position.
Actively contributing to DE position papers, meetings, board membership
Climate Leadership Council
Consistent
The purpose of the Climate Leadership Council is to affect the Finnish businesses’ and research organisations’ competitiveness and ability to respond to the threats posed by climate change and the scarcity of natural resources, as well as to improve their ability to utilise the business opportunities related to these. The members of the Council are systematically developing their operations / actions, thereby encouraging other organisations, communities and decision-makers to join. The Council is also collecting best practices and sharing information. Each year, the Council selects a few significant common projects to develop and promote. Climate Leadership Council (CLC) has for example joined World Bank Carbon Price initiative which has expressed support for a price on carbon, demonstrating the leadership by taking action, and encouraging others to join this global carbon price agenda.
Nokia participates actively in different CLC working groups and for example supported CLC in joining World Bank Carbon Price initiative which has expressed support for a price on carbon, demonstrating the leadership by taking action, and encouraging others to join this global carbon price agenda.
GeSi Consistent
GeSI takes a holistic view of sustainability. They support efforts to ensure environmental and social sustainability because they are inextricably linked in how they impact society and communities around the globe. Nokia is working with Climate change agenda through Global e-Sustainability Initiative GeSi with dedicated projects. E.g. :
Participation to Gesi working groups, such as Climate Change working group.

Trade association
Is your position
on climate change
consistent with
theirs?
Please explain the trade association's position
How have you, or are you attempting to, influence the position?
SMARTer2030 - ICT Solutions for 21st Century Challenges (including climate change) . The report has aim to extend our horizon to 2030 and to look at ICT-enabled sustainability from a holistic point of view.
CC2.3d
Do you publicly disclose a list of all the research organizations that you fund?
CC2.3e
Please provide details of the other engagement activities that you undertake
CC2.3f
What processes do you have in place to ensure that all of your direct and indirect activities that influence policy are consistent with your overall climate change strategy?
We have an active global network of people with global positions, the messages are agreed and documented jointly in regular meetings between all relevant colleagues. Issues are discussed also at management team level (including people who are in charge of both implementing and developing strategy and policy activities) to ensure consistency of messages with the strategy. All our policy engagement is consistent with the company’s overall climate change strategy
CC2.3g
Please explain why you do not engage with policy makers

Further Information
Page: CC3. Targets and Initiatives
CC3.1
Did you have an emissions reduction or renewable energy consumption or production target that was active (ongoing or reached completion) in the reporting year?
Absolute target Intensity target Renewable energy consumption and/or production target
CC3.1a
Please provide details of your absolute target
ID
Scope
% of emissions in
scope
% reduction from base
year
Base year
Base year emissions covered by
target (metric tonnes CO2e)
Target year
Is this a science-based
target?
Comment
Abs1 Scope 1+2 (market-based)
100% 41% 2014 723800 2030
Yes, and this target has been approved as science-based by the Science Based Targets initiative
SBTi approval was received on 29.6.2017
Abs2 Scope 3: Use of sold products
80% 75% 2014 33060000 2030
Yes, and this target has been approved as science-based by the Science Based Targets initiative
SBTi approval was received on 29.6.2017
ID
Scope
% of emissions in
scope
% reduction from base
year
Base year
Base year emissions covered by
target (metric tonnes CO2e)
Target year
Is this a science-based
target?
Comment
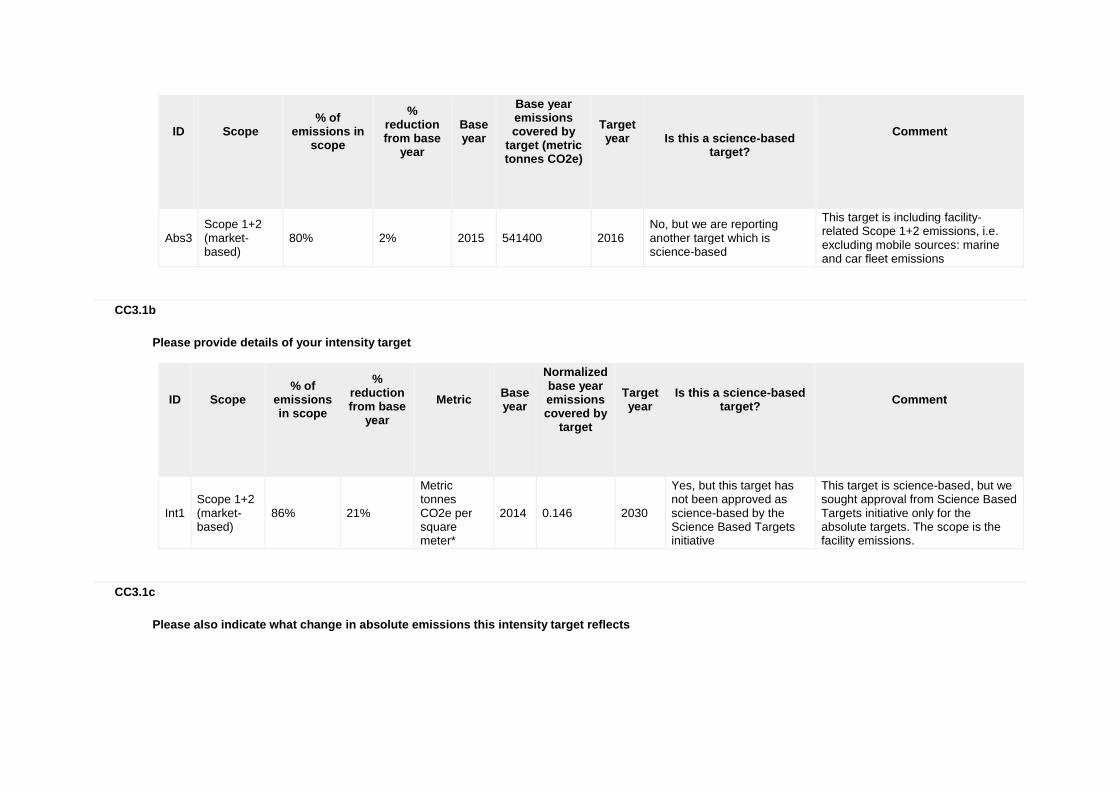
Abs3 Scope 1+2 (market-based)
80% 2% 2015 541400 2016 No, but we are reporting another target which is science-based
This target is including facility-related Scope 1+2 emissions, i.e. excluding mobile sources: marine and car fleet emissions
CC3.1b
Please provide details of your intensity target
ID
Scope
% of emissions in scope
% reduction from base
year
Metric
Base year
Normalized base year emissions covered by
target
Target year
Is this a science-based target?
Comment
Int1 Scope 1+2 (market-based)
86% 21%
Metric tonnes CO2e per square meter*
2014 0.146 2030
Yes, but this target has not been approved as science-based by the Science Based Targets initiative
This target is science-based, but we sought approval from Science Based Targets initiative only for the absolute targets. The scope is the facility emissions.
CC3.1c
Please also indicate what change in absolute emissions this intensity target reflects

ID
Direction of change
anticipated in absolute Scope
1+2 emissions at target
completion?
% change anticipated in
absolute Scope 1+2 emissions
Direction of change
anticipated in absolute Scope 3 emissions at
target completion?
% change anticipated in
absolute Scope 3 emissions
Comment
Int1 Decrease 44 No change 0 The intensity target is anticipated to reduce Facility related Scope 1+2 targets by 46% and overall Scope1+2 emission by around 44%.
CC3.1d
Please provide details of your renewable energy consumption and/or production target
ID
Energy types covered by
target
Base year
Base year energy for
energy type covered (MWh)
%
renewable energy in base year
Target year
%
renewable energy in
target year
Comment
RE1 Electricity consumption
2015 1138000 20% 2016 15%
We had a modest target for the combined company's renewable electricity in 2016 as Alcatel-Lucent, which Nokia acquired in 2016, did not have any targets for the purchase of renewable electricity. For 2017 the target is to have minimum 20% of electricity from renewables.
CC3.1e

For all of your targets, please provide details on the progress made in the reporting year
ID
% complete (time)
% complete (emissions or renewable energy)
Comment
Abs1 13% 15% As of 2016, Nokia has achieved a 15% absolute Scope 1 and 2 emission reduction from the 2014 baseline.
Abs2 13% 0% For our Scope 3 Science-based target, in 2016 there was not yet progress but instead a 4% increase because of larger sales in Mobile and Fixed Networks.
Abs3 100% 100% 14% reduction achieved versus 2% annual goal
Int1 13% 21% We achieved 21% reduction by end of 2016. Facility area is recorded monthly due to frequent additions/deletions of building area
RE1 100% 100% Achieved a 21% renewable energy consumption rate in 2016 versus 15% goal
CC3.1f
Please explain (i) why you do not have a target; and (ii) forecast how your emissions will change over the next five years
CC3.2
Do you classify any of your existing goods and/or services as low carbon products or do they enable a third party to avoid GHG emissions?
Yes
CC3.2a
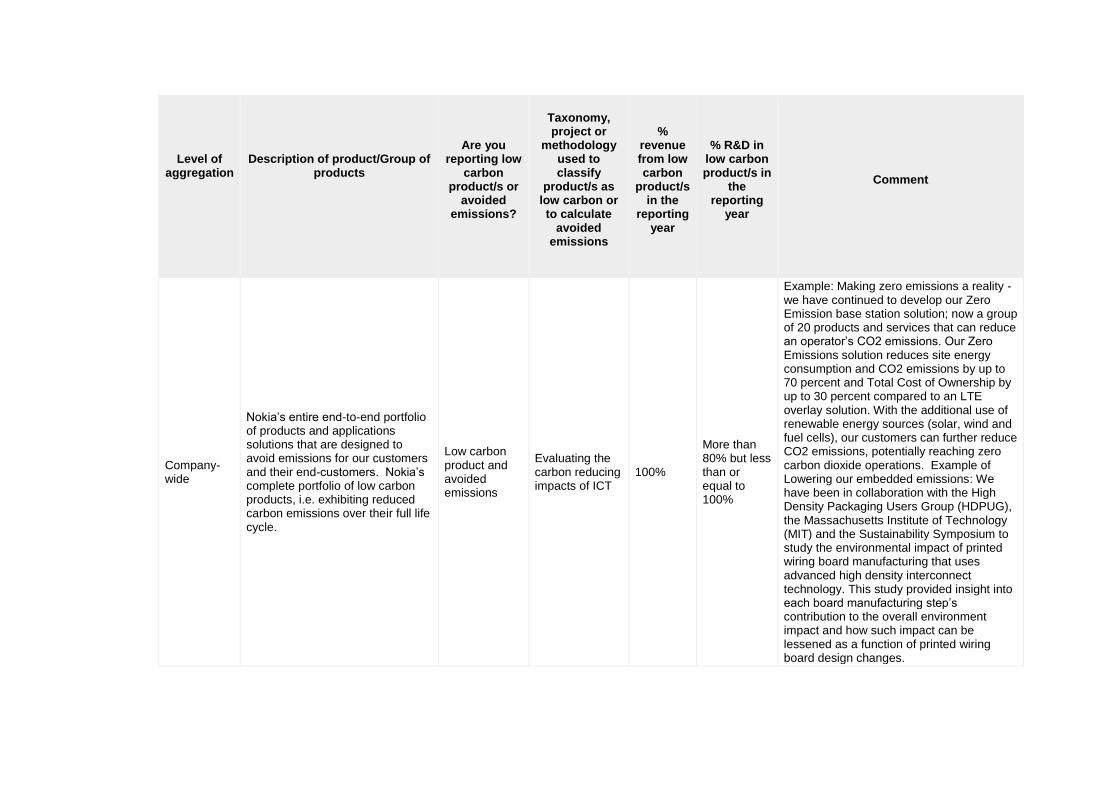
Please provide details of your products and/or services that you classify as low carbon products or that enable a third party to avoid GHG emissions
Level of
aggregation
Description of product/Group of
products
Are you
reporting low carbon
product/s or avoided
emissions?
Taxonomy, project or
methodology used to classify
product/s as low carbon or to calculate
avoided emissions
%
revenue from low carbon
product/s in the
reporting year
% R&D in
low carbon product/s in
the reporting
year
Comment
Company-wide
Nokia’s entire end-to-end portfolio of products and applications solutions that are designed to avoid emissions for our customers and their end-customers. Nokia’s complete portfolio of low carbon products, i.e. exhibiting reduced carbon emissions over their full life cycle.
Low carbon product and avoided emissions
Evaluating the carbon reducing impacts of ICT
100%
More than 80% but less than or equal to 100%
Example: Making zero emissions a reality - we have continued to develop our Zero Emission base station solution; now a group of 20 products and services that can reduce an operator’s CO2 emissions. Our Zero Emissions solution reduces site energy consumption and CO2 emissions by up to 70 percent and Total Cost of Ownership by up to 30 percent compared to an LTE overlay solution. With the additional use of renewable energy sources (solar, wind and fuel cells), our customers can further reduce CO2 emissions, potentially reaching zero carbon dioxide operations. Example of Lowering our embedded emissions: We have been in collaboration with the High Density Packaging Users Group (HDPUG), the Massachusetts Institute of Technology (MIT) and the Sustainability Symposium to study the environmental impact of printed wiring board manufacturing that uses advanced high density interconnect technology. This study provided insight into each board manufacturing step’s contribution to the overall environment impact and how such impact can be lessened as a function of printed wiring board design changes.

CC3.3
Did you have emissions reduction initiatives that were active within the reporting year (this can include those in the planning and/or implementation phases)
Yes
CC3.3a
Please identify the total number of projects at each stage of development, and for those in the implementation stages, the estimated CO2e savings
Stage of development
Number of projects
Total estimated annual CO2e savings in metric tonnes CO2e (only for rows marked *)
Under investigation
To be implemented* 0 0
Implementation commenced* 0 0
Implemented* 16 1220
Not to be implemented
CC3.3b
For those initiatives implemented in the reporting year, please provide details in the table below

Activity type
Description of activity
Estimated annual CO2e
savings (metric tonnes CO2e)
Scope
Voluntary/ Mandatory
Annual monetary savings
(unit currency
- as specified in CC0.4)
Investment required
(unit currency -
as specified in CC0.4)
Payback period
Estimated lifetime of
the initiative
Comment
Energy efficiency: Building services
During 2016 we had several energy efficiency projects in our facilities technical systems across our building portfolio. As an example, we installed VFDs on CRAC Units, adjusted HVAC Set Points, added LED relighting, installed Heating pumps, Had new cooling system for labs and installed 4 CRAC Units with pumped refigerant economizer
1220
Scope 2 (market-based)
Voluntary
351788 614986 1-3 years
Ongoing
Nokia has invested in various "Green Projects" in 2016 that accounted for a 1,220 tCO2e reduction. However, those projects only represent a small percentage of actual energy usage reductions within our facilities. The major reason for that observed energy usage reduction is the direct result of facility management personnel enacting various energy efficiency best practices at facilities focused both at the general "office population", and more importantly within our laboratories. As such, facility managers have been working with laboratory representatives to reduce energy usage from laboratory equipment, as well as manage airflow and temperature controls within laboratory areas. Nokia is presently

Activity type
Description of activity
Estimated annual CO2e
savings (metric tonnes CO2e)
Scope
Voluntary/ Mandatory
Annual monetary savings
(unit currency
- as specified in CC0.4)
Investment required
(unit currency -
as specified in CC0.4)
Payback period
Estimated lifetime of
the initiative
Comment
installing sub-meters within laboratories to be able to better quantify those specific energy reductions. In addition, we are calculating the "power usage effectiveness (PUE) of individual laboratories, and establishing PUE targets for the various types of laboratories contained within our facilities.
Behavioral change
In 2016 we undertook a number of environmental awareness initiatives including a Switch off Campaign, designed to raise awareness on climate change and energy conservation, Nokia’s environmental efforts, and to also influence employee behavior to reduce energy use. Over 250 sites took part in the campaign with 65 sites providing feedback on actions they had taken
Scope 1 Scope 2 (market-based)
Voluntary
<1 year <1 year
It's hard to quantify the annual CO2e or monetary savings from the awareness initiatives

Activity type
Description of activity
Estimated annual CO2e
savings (metric tonnes CO2e)
Scope
Voluntary/ Mandatory
Annual monetary savings
(unit currency
- as specified in CC0.4)
Investment required
(unit currency -
as specified in CC0.4)
Payback period
Estimated lifetime of
the initiative
Comment
and suggested future improvements. Activities included timer and temperature changes, load shedding, improved controls, and a proactive switching off of unnecessary equipment. Nokia also supported WWF’s Earth Hour campaign, switching off the lights of our buildings along with those of 1.23 million individual actions taken to raise greater awareness on the fight against climate change
Product design
We improve the energy efficiency of our products in use by refining hardware models, developing software and supporting customers with energy management services. We aim to ensure that every new mobile networks' product is at least 15% more energy efficient than the previous model.
Scope 3
Voluntary
6-10 years
This activity is related to our products and our customers benefit from the CO2 and financial savings i.e.monetary savings and payback period for our investment is not directly relevant.

Activity type
Description of activity
Estimated annual CO2e
savings (metric tonnes CO2e)
Scope
Voluntary/ Mandatory
Annual monetary savings
(unit currency
- as specified in CC0.4)
Investment required
(unit currency -
as specified in CC0.4)
Payback period
Estimated lifetime of
the initiative
Comment
Transportation: fleet
We employed newer fuel-efficient vehicles in our car fleet as per our fleet policy to further develop our low-emission fleet and maintain related emissions below the market average. Car fleet CO₂ e/vehicle km were reduced by 8% between 2015-2016, kilometers driven by 12% and as a result absolute emissions reduced by 19%.
8560 Scope 1
Voluntary
<1 year 3-5 years
The fleet is used both by our service engineers for network site maintenance visits and by employees as benefit cars.
CC3.3c
What methods do you use to drive investment in emissions reduction activities?
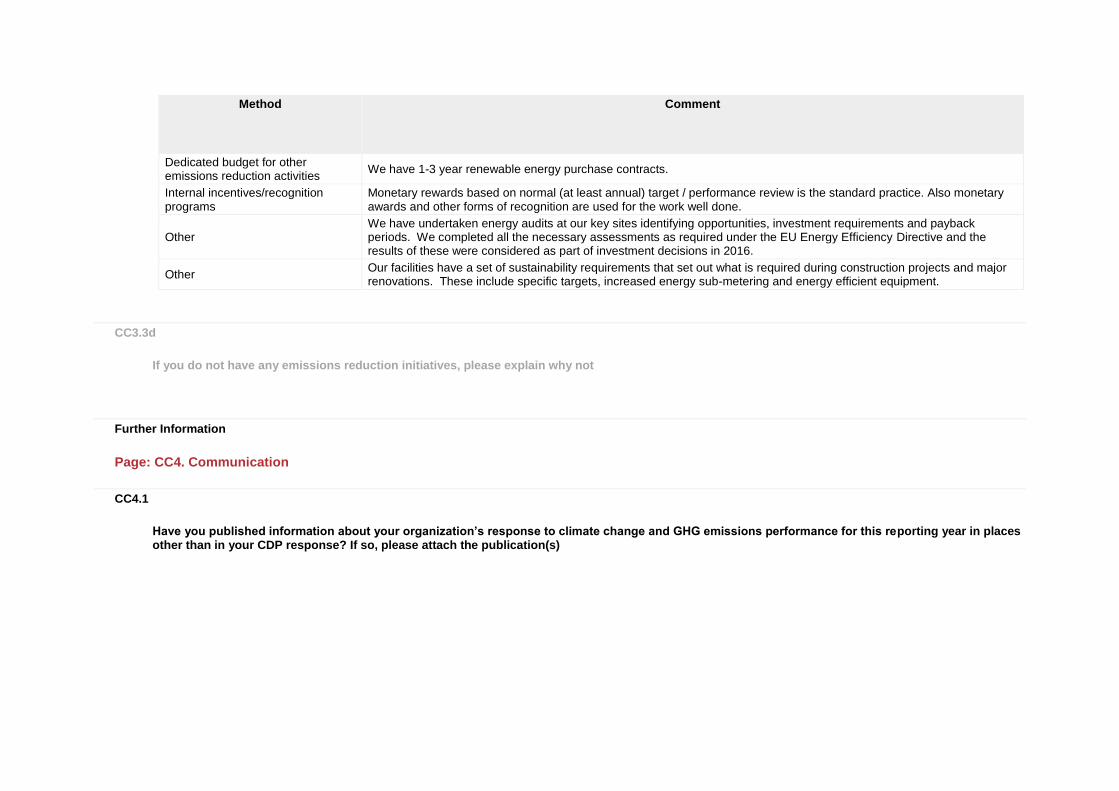
Method
Comment
Compliance with regulatory requirements/standards
Carbon Reduction Commitment in UK was the first regulatory carbon reduction standard that binds Nokia.
Method
Comment
Dedicated budget for other emissions reduction activities
We have 1-3 year renewable energy purchase contracts.
Internal incentives/recognition programs
Monetary rewards based on normal (at least annual) target / performance review is the standard practice. Also monetary awards and other forms of recognition are used for the work well done.
Other We have undertaken energy audits at our key sites identifying opportunities, investment requirements and payback periods. We completed all the necessary assessments as required under the EU Energy Efficiency Directive and the results of these were considered as part of investment decisions in 2016.
Other Our facilities have a set of sustainability requirements that set out what is required during construction projects and major renovations. These include specific targets, increased energy sub-metering and energy efficient equipment.
CC3.3d
If you do not have any emissions reduction initiatives, please explain why not
Further Information
Page: CC4. Communication
CC4.1
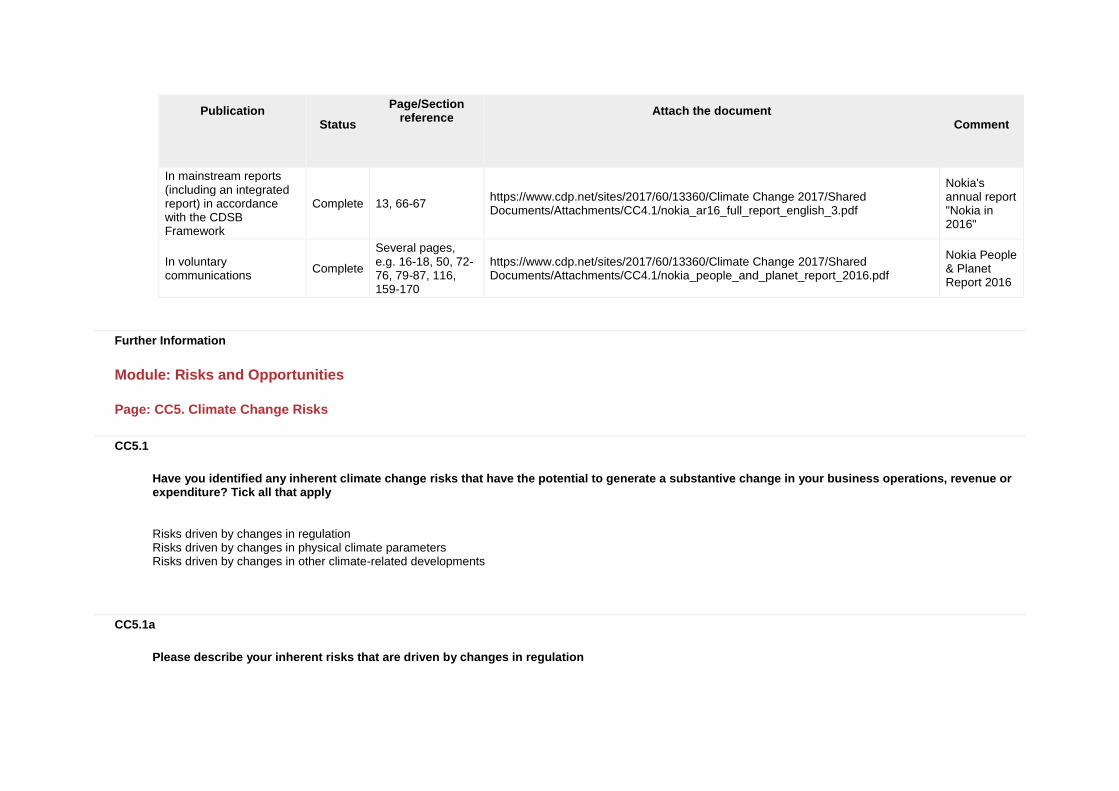
Have you published information about your organization’s response to climate change and GHG emissions performance for this reporting year in places other than in your CDP response? If so, please attach the publication(s)
Publication
Status
Page/Section reference
Attach the document
Comment
In mainstream reports (including an integrated report) in accordance with the CDSB Framework
Complete 13, 66-67 https://www.cdp.net/sites/2017/60/13360/Climate Change 2017/Shared Documents/Attachments/CC4.1/nokia_ar16_full_report_english_3.pdf
Nokia's annual report "Nokia in 2016"
In voluntary communications
Complete
Several pages, e.g. 16-18, 50, 72-76, 79-87, 116, 159-170
https://www.cdp.net/sites/2017/60/13360/Climate Change 2017/Shared Documents/Attachments/CC4.1/nokia_people_and_planet_report_2016.pdf
Nokia People & Planet Report 2016
Further Information
Module: Risks and Opportunities
Page: CC5. Climate Change Risks
CC5.1
Have you identified any inherent climate change risks that have the potential to generate a substantive change in your business operations, revenue or expenditure? Tick all that apply
Risks driven by changes in regulation Risks driven by changes in physical climate parameters Risks driven by changes in other climate-related developments
CC5.1a
Please describe your inherent risks that are driven by changes in regulation
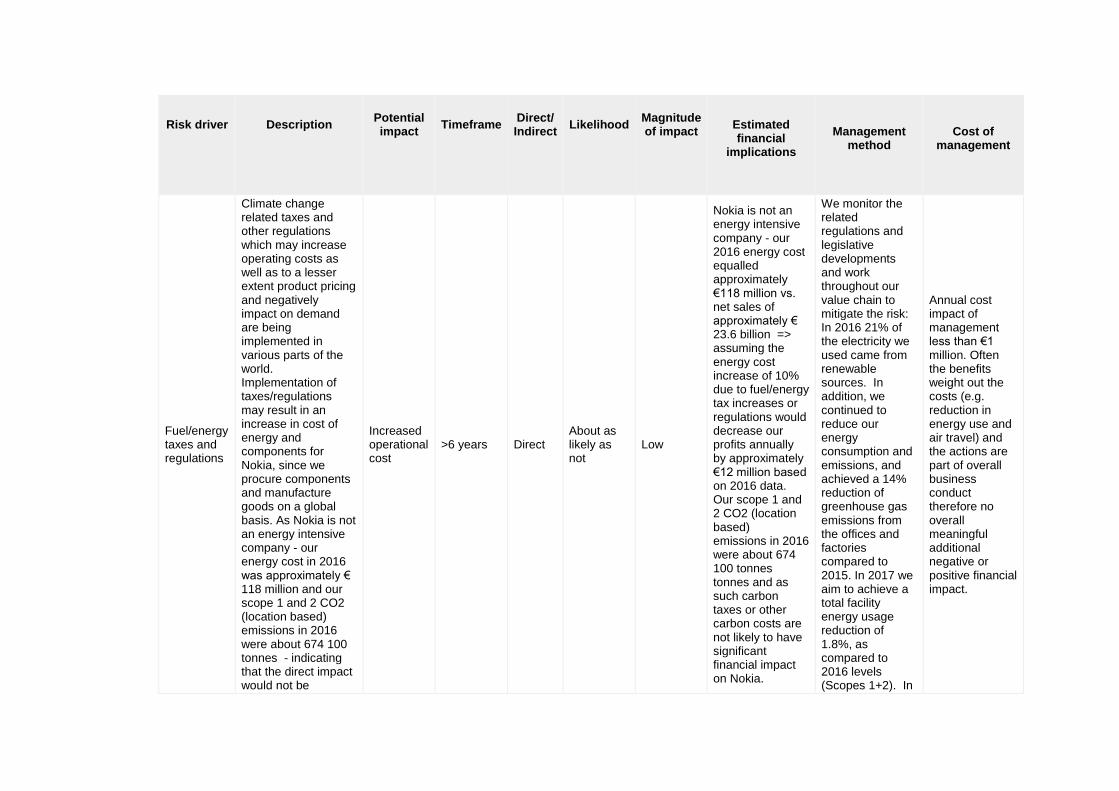
Risk driver
Description
Potential impact
Timeframe
Direct/ Indirect
Likelihood
Magnitude of impact
Estimated financial
implications
Management
method
Cost of
management
Fuel/energy taxes and regulations
Climate change related taxes and other regulations which may increase operating costs as well as to a lesser extent product pricing and negatively impact on demand are being implemented in various parts of the world. Implementation of taxes/regulations may result in an increase in cost of energy and components for Nokia, since we procure components and manufacture goods on a global basis. As Nokia is not an energy intensive company - our energy cost in 2016 was approximately € 118 million and our scope 1 and 2 CO2 (location based) emissions in 2016 were about 674 100 tonnes - indicating that the direct impact would not be
Increased operational cost
>6 years Direct About as likely as not
Low
Nokia is not an energy intensive company - our 2016 energy cost equalled approximately €118 million vs. net sales of approximately € 23.6 billion => assuming the energy cost increase of 10% due to fuel/energy tax increases or regulations would decrease our profits annually by approximately €12 million based on 2016 data. Our scope 1 and 2 CO2 (location based) emissions in 2016 were about 674 100 tonnes tonnes and as such carbon taxes or other carbon costs are not likely to have significant financial impact on Nokia.
We monitor the related regulations and legislative developments and work throughout our value chain to mitigate the risk: In 2016 21% of the electricity we used came from renewable sources. In addition, we continued to reduce our energy consumption and emissions, and achieved a 14% reduction of greenhouse gas emissions from the offices and factories compared to 2015. In 2017 we aim to achieve a total facility energy usage reduction of 1.8%, as compared to 2016 levels (Scopes 1+2). In
Annual cost impact of management less than €1 million. Often the benefits weight out the costs (e.g. reduction in energy use and air travel) and the actions are part of overall business conduct therefore no overall meaningful additional negative or positive financial impact.

Risk driver
Description
Potential impact
Timeframe
Direct/ Indirect
Likelihood
Magnitude of impact
Estimated financial
implications
Management
method
Cost of
management
material. However this can also impact the whole value chain, increase the price of products and reduce consumer / our customers purchasing power. The changes could also have an impact on our market and a 1% reduction in the demand of our products would lead to about €236 million reduction in our annual sales based on 2016 data. However in our risk analysis the assumption is that the adverse impact on our industry or Nokia would not be disproportionately higher than on other industries or to our competitors at least to a significant extent.
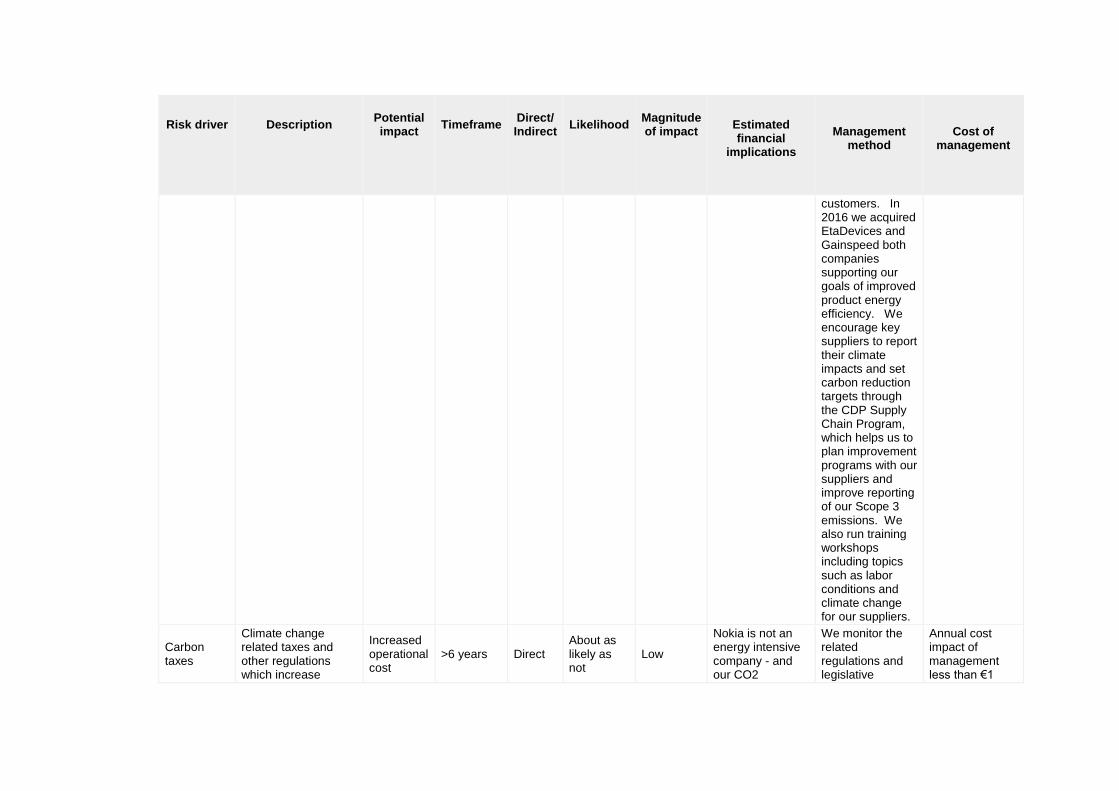
2016 we were the first telco equipment vendor to sign the commitment to Science-Based Targets initiative and submitted our long term emission reduction targets. In 2016, we launched the Zero Emission 2.0 product offering with 20 new innovations, and AirScale base station which can reduce operator CO2 emissions by up to 60%. This helps our operator customers to reduce energy consumption and costs in their networks. In 2016 we modernized 27% more base stations than in 2015, average energy savings of 43% for our
Risk driver
Description
Potential impact
Timeframe
Direct/ Indirect
Likelihood
Magnitude of impact
Estimated financial
implications
Management
method
Cost of
management
customers. In 2016 we acquired EtaDevices and Gainspeed both companies supporting our goals of improved product energy efficiency. We encourage key suppliers to report their climate impacts and set carbon reduction targets through the CDP Supply Chain Program, which helps us to plan improvement programs with our suppliers and improve reporting of our Scope 3 emissions. We also run training workshops including topics such as labor conditions and climate change for our suppliers.
Carbon taxes
Climate change related taxes and other regulations which increase
Increased operational cost
>6 years Direct About as likely as not
Low
Nokia is not an energy intensive company - and our CO2
We monitor the related regulations and legislative
Annual cost impact of management less than €1

Risk driver
Description
Potential impact
Timeframe
Direct/ Indirect
Likelihood
Magnitude of impact
Estimated financial
implications
Management
method
Cost of
management
operating costs as well as to a lesser extent product pricing and negatively impact on demand are being implemented in various parts of the world. Implementation of taxes/regulations may result in an increase in cost of energy for Nokia, since we sell, source components and manufacture goods on a global basis with operations in more than 100 countries. As Nokia is not an energy intensive company the direct impact would not be material. However this can impact also the whole value chain, increase the price of products and reduce customer purchasing power. The changes could also have an impact on our market and a 1% reduction in the demand of our
emissions are relatively low: our scope 1 and 2 CO2 (location based) emissions in 2016 were about 674 100 tonnes tonnes. Our 2016 energy cost equalled approximately €118 million vs. net sales of approximately € 23.6 billion - assuming the energy cost increase of 10% due to carbon tax this would decrease our profits annually by approximately €12million based on 2016 data.
developments and work throughout our value chain to mitigate the risk: In 2016 21% of the electricity we used came from renewable sources. In addition, we continued to reduce our energy consumption and emissions, and achieved a 14% reduction of greenhouse gas emissions from the offices and factories compared to 2015. In 2017 we aim to achieve a total facility energy usage reduction of 1.8%, as compared to 2016 levels (Scopes 1+2). In 2016 we were the first telco equipment vendor to sign the
million. Often the benefits weight out the costs (e.g. reduction in energy use and air travel) and the actions are part of overall business conduct therefore no overall meaningful additional negative or positive financial impact.

Risk driver
Description
Potential impact
Timeframe
Direct/ Indirect
Likelihood
Magnitude of impact
Estimated financial
implications
Management
method
Cost of
management
products would lead to about €236 million reduction in our annual sales based on 2016 data. However in our risk analysis the assumption is that the adverse impact to our industry or Nokia would not be disproportionately higher than on other industries or to our competitors at least to a significant extent.
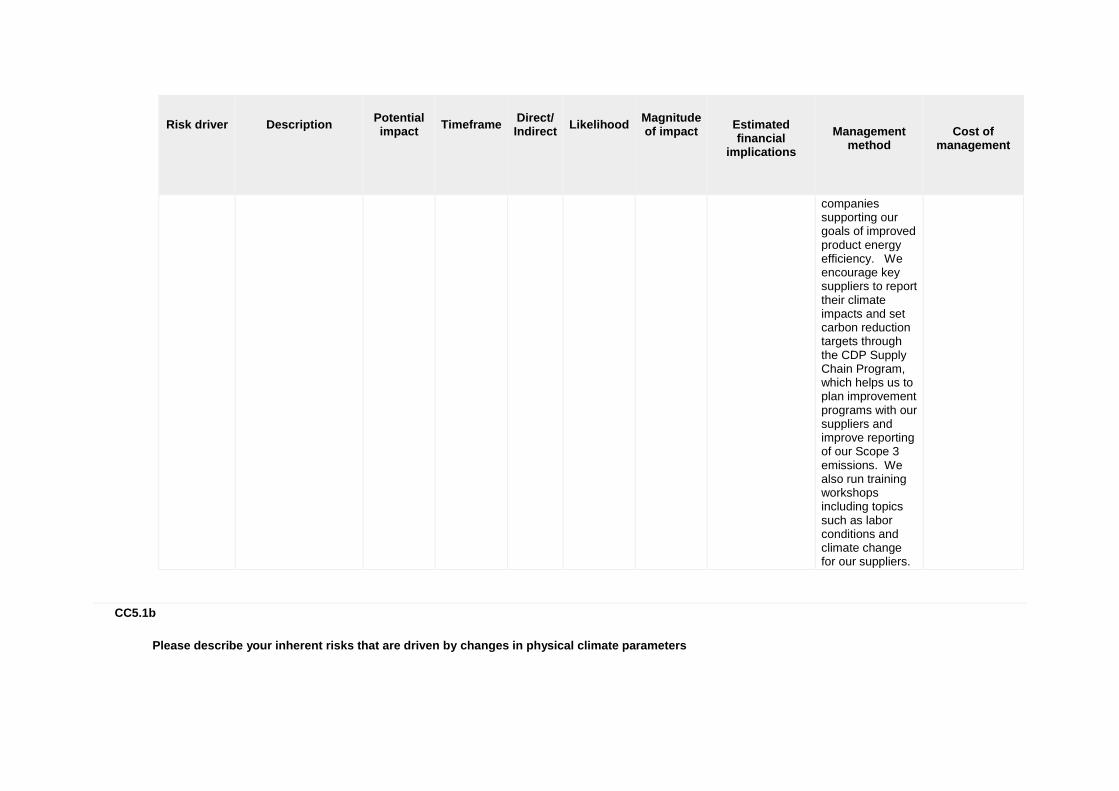
commitment to Science-Based Targets initiative and submitted our long term emission reduction targets. In 2016, we launched the Zero Emission 2.0 product offering with 20 new innovations, and AirScale base station which can reduce operator CO2 emissions by up to 60%. This helps our operator customers to reduce energy consumption and costs in their networks. In 2016 we modernized 27% more base stations than in 2015, average energy savings of 43% for our customers. In 2016 we acquired EtaDevices and Gainspeed both
Risk driver
Description
Potential impact
Timeframe
Direct/ Indirect
Likelihood
Magnitude of impact
Estimated financial
implications
Management
method
Cost of
management
companies supporting our goals of improved product energy efficiency. We encourage key suppliers to report their climate impacts and set carbon reduction targets through the CDP Supply Chain Program, which helps us to plan improvement programs with our suppliers and improve reporting of our Scope 3 emissions. We also run training workshops including topics such as labor conditions and climate change for our suppliers.
CC5.1b
Please describe your inherent risks that are driven by changes in physical climate parameters

Risk driver
Description
Potential impact
Timeframe
Direct/ Indirect
Likelihood
Magnitude of impact
Estimated financial
implications
Management
method
Cost of
management
Change in precipitation extremes and droughts
The risk is mainly related to our component manufacturers', but also Nokia’s own, operational capabilities if located in water scarce areas or areas prone to flooding. Nokia studied in 2010-2013 its water footprint by using WBCSD’s Water tool, WWF/DEG Water Risk Filter and LCAs. Nokia's business changed since then however the main findings related to water risks are still valid related to our business. Nokia's own activities require a minimal quantity of water. In 2016 our total water use was 318 100 m3 - mainly headcount
Reduction/disruption in production capacity
>6 years Indirect (Supply chain)
About as likely as not
Low-medium
If not properly managed unexpected severe droughts and/or floods can have an impact on suppliers’ as well as Nokia’s own operations - with potential cost impact of millions of euros - especially if it leads to serious problems in component supply. However, we believe that the overall severity of the financial implications would be alleviated by actions, including those related to our business continuity as well as insurance. Especially related to draughts, we do not expect
Nokia has studied its water footprint by using WBCSD’s Water tool and WWF/DEG Water Risk Filter. The risk is mainly related to our component manufacturers', but also Nokia’s own, operational possibilities if located in water scarce or flood-prone areas. If this risk becomes more concrete these suppliers and / or Nokia need to look for alternative supply sources. This is a part of our normal on-going sourcing process. Additionally, Nokia has in place insurance for property damage that includes buildings,
Nokia purchases certain insurance for various purposes, including managing property damage and business disruptions. The activity of finding alternative supply sources is a part of our normal sourcing process without significant additional cost implications i.e. less than €1 million annually. In addition there are some headcount etc. related costs for CDP related activities.
Risk driver
Description
Potential impact
Timeframe
Direct/ Indirect
Likelihood
Magnitude of impact
Estimated financial
implications
Management
method
Cost of
management
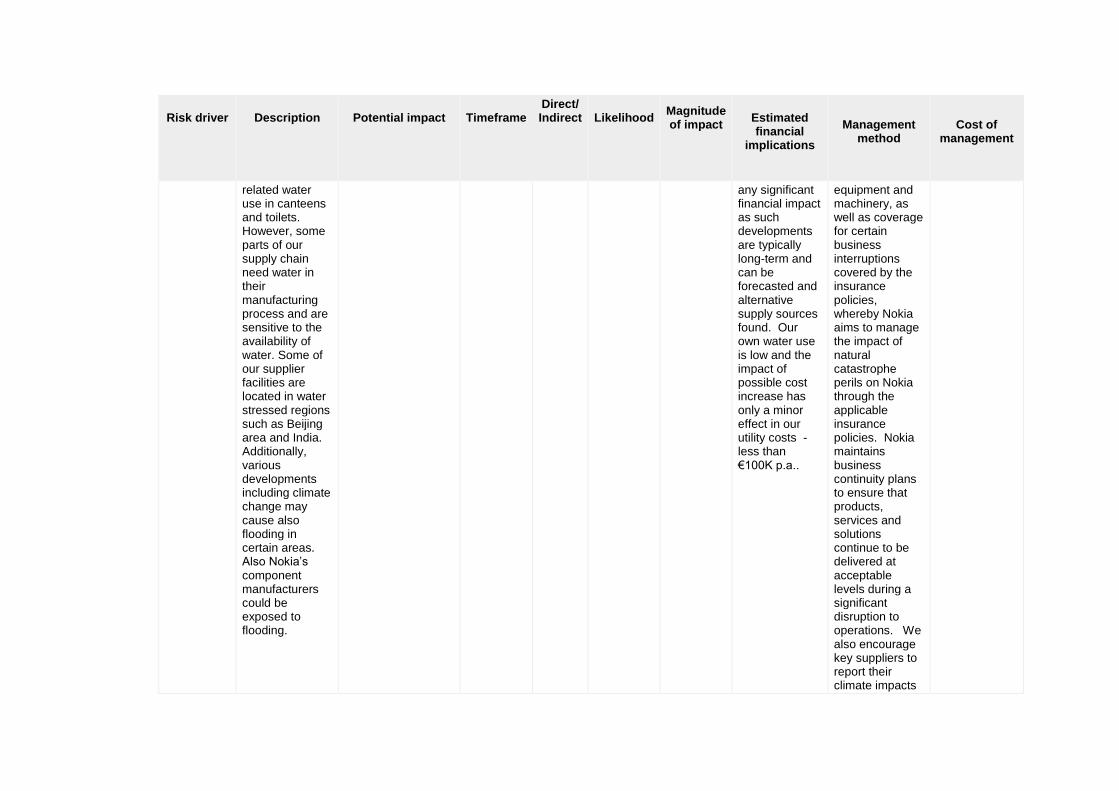
related water use in canteens and toilets. However, some parts of our supply chain need water in their manufacturing process and are sensitive to the availability of water. Some of our supplier facilities are located in water stressed regions such as Beijing area and India. Additionally, various developments including climate change may cause also flooding in certain areas. Also Nokia’s component manufacturers could be exposed to flooding.
any significant financial impact as such developments are typically long-term and can be forecasted and alternative supply sources found. Our own water use is low and the impact of possible cost increase has only a minor effect in our utility costs - less than €100K p.a..
equipment and machinery, as well as coverage for certain business interruptions covered by the insurance policies, whereby Nokia aims to manage the impact of natural catastrophe perils on Nokia through the applicable insurance policies. Nokia maintains business continuity plans to ensure that products, services and solutions continue to be delivered at acceptable levels during a significant disruption to operations. We also encourage key suppliers to report their climate impacts

Risk driver
Description
Potential impact
Timeframe
Direct/ Indirect
Likelihood
Magnitude of impact
Estimated financial
implications
Management
method
Cost of
management
and set carbon reduction targets through the CDP Supply Chain Program, which helps us to plan improvement programs with our suppliers. In 2016, 243 of our key suppliers, an increase of 63 from 2015 and representing 54% of our total procurement spend, responded to the CDPs request to disclose their climate performance information. Our suppliers, except those with very low environmental impacts, must also have a documented environmental management system (EMS) in place.

Risk driver
Description
Potential impact
Timeframe
Direct/ Indirect
Likelihood
Magnitude of impact
Estimated financial
implications
Management
method
Cost of
management
Tropical cyclones (hurricanes and typhoons)
Some of Nokia suppliers have production facilities in areas where tropical cyclones may occur. If the frequency of cyclones clearly increases due to climate change, cyclone hits the production facility and causes damage it can have an impact on the supplier's operations and the supplier / Nokia may need to look for alternative supply sources. Also our customers are in some cases vulnerable to changes in physical climate parameters like tropical cyclones.
Reduction/disruption in production capacity
>6 years Indirect (Supply chain)
Unlikely Low
Some of our suppliers have their manufacturing plants in the areas that can be sensitive to tropical cyclones. - with potential damage related cost impact of millions of euros - especially if it leads to serious problems in component supply. The probability of tropical cyclone caused by the climate change causing severe damage to a production facility of a critical supplier (or to our customer) is rather small so we do rate also the probable financial impact small.
These suppliers and / or Nokia need to look for alternative supply sources. Looking for alternative supply sources is a part of our normal on-going sourcing process. Additionally, Nokia has in place insurance for property damage that includes buildings, equipment and machinery, as well as coverage for certain business interruptions covered by the insurance policies, whereby Nokia aims to manage the impact of natural catastrophe perils such as tropical cyclones (hurricanes and typhoons) on
The activity is a part of our normal sourcing process without significant additional cost implication expected i.e. less than €1 million annually, and additionally Nokia purchases certain insurance for various purposes, including managing property damage and business disruptions.

Risk driver
Description
Potential impact
Timeframe
Direct/ Indirect
Likelihood
Magnitude of impact
Estimated financial
implications
Management
method
Cost of
management
Nokia through the applicable insurance policies. Nokia maintains business continuity plans to ensure that products, services and solutions continue to be delivered at acceptable levels during a significant disruption to operations.
CC5.1c
Please describe your inherent risks that are driven by changes in other climate-related developments
Risk driver
Description
Potential impact
Timeframe
Direct/ Indirect
Likelihood
Magnitude of impact
Estimated financial
implications
Management
method
Cost of
management
Changing consumer behavior
Climate change can impact negatively the whole world economy including e.g. consumer purchasing
Reduced demand for goods/services
>6 years Indirect (Client)
About as likely as not
Medium
Climate change impact on our customers (and their consumer customers)
Below some examples on how our activities may make our
Our total R&D spend was € 4904 million in 2016 and a part of this
Risk driver
Description
Potential impact
Timeframe
Direct/ Indirect
Likelihood
Magnitude of impact
Estimated financial
implications
Management
method
Cost of
management
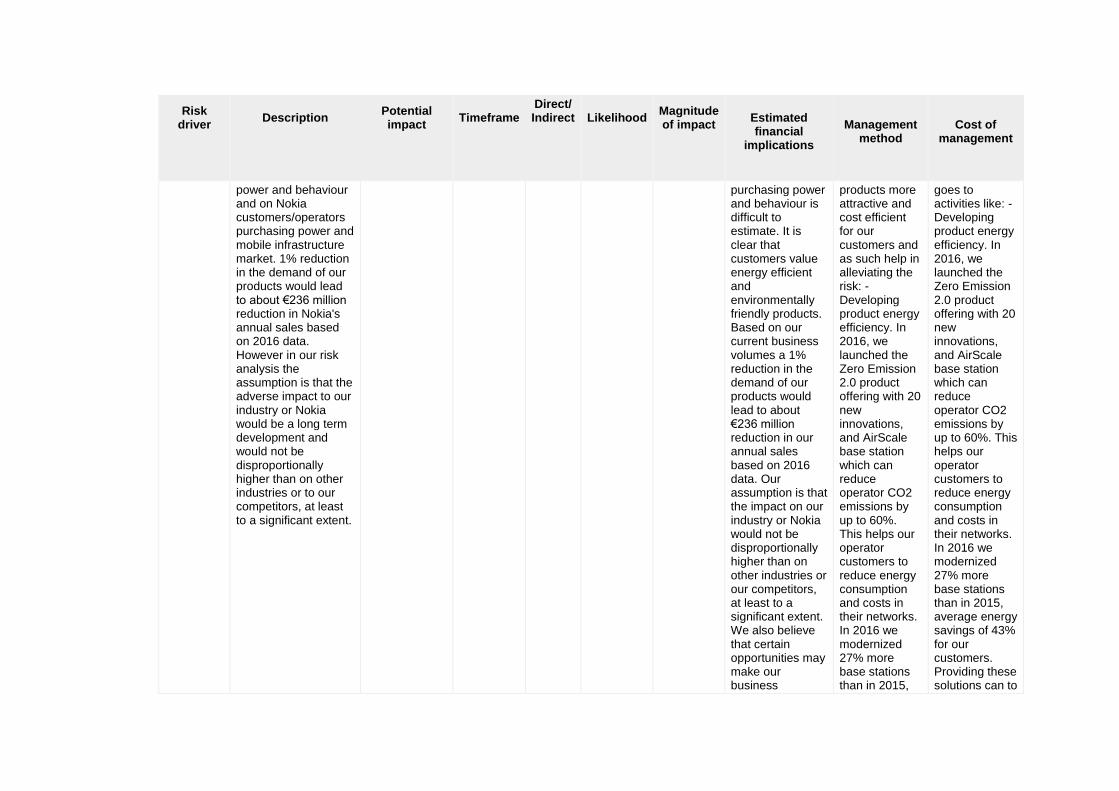
power and behaviour and on Nokia customers/operators purchasing power and mobile infrastructure market. 1% reduction in the demand of our products would lead to about €236 million reduction in Nokia's annual sales based on 2016 data. However in our risk analysis the assumption is that the adverse impact to our industry or Nokia would be a long term development and would not be disproportionally higher than on other industries or to our competitors, at least to a significant extent.
purchasing power and behaviour is difficult to estimate. It is clear that customers value energy efficient and environmentally friendly products. Based on our current business volumes a 1% reduction in the demand of our products would lead to about €236 million reduction in our annual sales based on 2016 data. Our assumption is that the impact on our industry or Nokia would not be disproportionally higher than on other industries or our competitors, at least to a significant extent. We also believe that certain opportunities may make our business
products more attractive and cost efficient for our customers and as such help in alleviating the risk: - Developing product energy efficiency. In 2016, we launched the Zero Emission 2.0 product offering with 20 new innovations, and AirScale base station which can reduce operator CO2 emissions by up to 60%. This helps our operator customers to reduce energy consumption and costs in their networks. In 2016 we modernized 27% more base stations than in 2015,
goes to activities like: - Developing product energy efficiency. In 2016, we launched the Zero Emission 2.0 product offering with 20 new innovations, and AirScale base station which can reduce operator CO2 emissions by up to 60%. This helps our operator customers to reduce energy consumption and costs in their networks. In 2016 we modernized 27% more base stations than in 2015, average energy savings of 43% for our customers. Providing these solutions can to

Risk driver
Description
Potential impact
Timeframe
Direct/ Indirect
Likelihood
Magnitude of impact
Estimated financial
implications
Management
method
Cost of
management
relatively less vulnerable and possibly mitigate negative impacts.
average energy savings of 43% for our customers. - Our products improve connectivity and reduce the need for unnecessary travel and commuting e.g. by enabling virtual meetings and remote work. - Our own & supplier related activities reduce energy costs.
some extent mitigate the risks. These costs are incurred as a part of normal product development process and thus no major additional cost is incurred because of the climate change related actions =less than € 1 million annual cost impact.
Fluctuating socio-economic conditions
A scenario is that social unrest, war, & other political risks increase as a result of climate change. This would impact negatively on the economy, consumer purchasing power, and in some cases lead to inability to continue business in certain areas.1% reduction in the demand of Nokia
Inability to do business
>6 years Indirect (Client)
Unlikely Medium
Climate change impact on the fluctuating socio-economic conditions and related political and economic risks is difficult to estimate especially over the long term. 1% reduction in the demand of our products would lead to about
Managing long term political risks is challenging especially in global scale. However our following activities may make our products more attractive and cost efficient for our customers and
Our total R&D spend was € 4904 million in 2016 and a part of this goes to activities like: - Developing product energy efficiency. In 2016, we launched the Zero Emission 2.0 product offering with 20

Risk driver
Description
Potential impact
Timeframe
Direct/ Indirect
Likelihood
Magnitude of impact
Estimated financial
implications
Management
method
Cost of
management
products would lead to about €236 million reduction in our annual sales based on 2016 data. This would also have an impact on the telecommunications infrastructure market but our assumption is that the adverse impact on our industry or Nokia would not be disproportionally higher than on other industries or on our competitors, at least to significant extent.
€236 million reduction in our annual sales based on 2016 data. Our assumption is that the adverse impact on our industry or Nokia would not be disproportionally higher than on other industries or our competitors at least to significant extent. We also believe that certain opportunities may make our business less vulnerable and possibly mitigate the negative impacts.
help in alleviating the risk of fluctuating socio economic conditions and its impact on our customers purchasing power & preferences: - Developing product energy efficiency. In 2016, we launched the Zero Emission 2.0 product offering with 20 new innovations, and AirScale base station which can reduce operator CO2 emissions by up to 60%. This helps our operator customers to reduce energy consumption and costs in their networks. In 2016 we modernized
new innovations, and AirScale base station which can reduce operator CO2 emissions by up to 60%. This helps our operator customers to reduce energy consumption and costs in their networks. In 2016 we modernized 27% more base stations than in 2015, average energy savings of 43% for our customers. Providing these solutions can to some extent mitigate the risks. These costs are incurred as a part of normal product development process and thus no major

Risk driver
Description
Potential impact
Timeframe
Direct/ Indirect
Likelihood
Magnitude of impact
Estimated financial
implications
Management
method
Cost of
management
27% more base stations than in 2015, average energy savings of 43% for our customers. - Our products improve connectivity and reduce the need for unnecessary travel and commuting e.g. by enabling virtual meetings and remote work. - Our own & supplier related activities reduce energy costs.
extra cost is incurred because of the climate change related actions =less than € 1 million annual cost impact).
CC5.1d
Please explain why you do not consider your company to be exposed to inherent risks driven by changes in regulation that have the potential to generate a substantive change in your business operations, revenue or expenditure

CC5.1e
Please explain why you do not consider your company to be exposed to inherent risks driven by changes in physical climate parameters that have the potential to generate a substantive change in your business operations, revenue or expenditure
CC5.1f
Please explain why you do not consider your company to be exposed to inherent risks driven by changes in other climate-related developments that have the potential to generate a substantive change in your business operations, revenue or expenditure
Further Information
Page: CC6. Climate Change Opportunities
CC6.1
Have you identified any inherent climate change opportunities that have the potential to generate a substantive change in your business operations, revenue or expenditure? Tick all that apply
Opportunities driven by changes in regulation Opportunities driven by changes in physical climate parameters Opportunities driven by changes in other climate-related developments
CC6.1a
Please describe your inherent opportunities that are driven by changes in regulation
Opportunity driver
Description
Potential impact
Timeframe
Direct/Indirect
Likelihood
Magnitude of impact
Estimated financial
implications
Management
method
Cost of
management
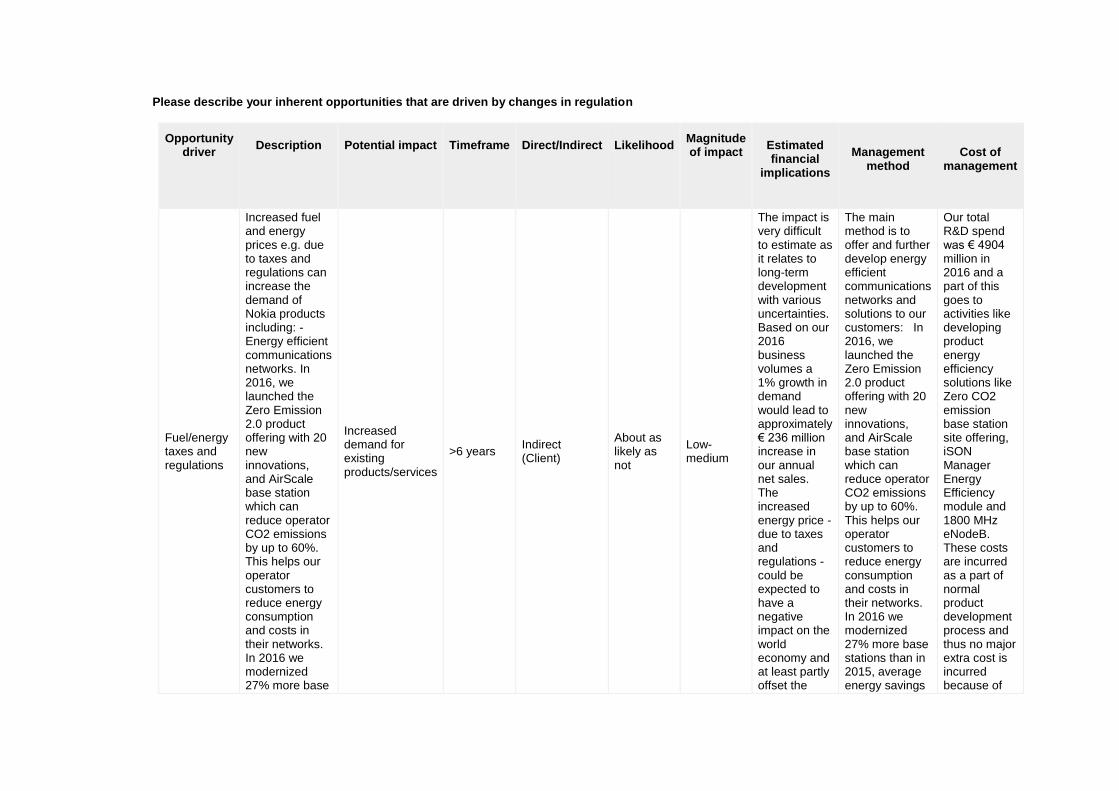
Fuel/energy taxes and regulations
Increased fuel and energy prices e.g. due to taxes and regulations can increase the demand of Nokia products including: - Energy efficient communications networks. In 2016, we launched the Zero Emission 2.0 product offering with 20 new innovations, and AirScale base station which can reduce operator CO2 emissions by up to 60%. This helps our operator customers to reduce energy consumption and costs in their networks. In 2016 we modernized 27% more base
Increased demand for existing products/services
>6 years Indirect (Client)
About as likely as not
Low-medium
The impact is very difficult to estimate as it relates to long-term development with various uncertainties. Based on our 2016 business volumes a 1% growth in demand would lead to approximately € 236 million increase in our annual net sales. The increased energy price - due to taxes and regulations - could be expected to have a negative impact on the world economy and at least partly offset the
The main method is to offer and further develop energy efficient communications networks and solutions to our customers: In 2016, we launched the Zero Emission 2.0 product offering with 20 new innovations, and AirScale base station which can reduce operator CO2 emissions by up to 60%. This helps our operator customers to reduce energy consumption and costs in their networks. In 2016 we modernized 27% more base stations than in 2015, average energy savings
Our total R&D spend was € 4904 million in 2016 and a part of this goes to activities like developing product energy efficiency solutions like Zero CO2 emission base station site offering, iSON Manager Energy Efficiency module and 1800 MHz eNodeB. These costs are incurred as a part of normal product development process and thus no major extra cost is incurred because of

Opportunity driver
Description
Potential impact
Timeframe
Direct/Indirect
Likelihood
Magnitude of impact
Estimated financial
implications
Management
method
Cost of
management
stations than in 2015, average energy savings of 43% for our customers. In 2016 we acquired EtaDevices and Gainspeed both companies supporting our goals of improved product energy efficiency. - Our products improve connectivity and reduce the need for unnecessary travel and commuting e.g. by enabling virtual meetings and remote work.
possibly increased demand for products and services.
of 43% for our customers. In 2016 we acquired EtaDevices and Gainspeed both companies supporting our goals of improved product energy efficiency. Our products improve connectivity and reduce the need for unnecessary travel and commuting e.g. by enabling virtual meetings and remote work.
the climate change related actions =less than € 1 million annual cost impact.
CC6.1b
Please describe your inherent opportunities that are driven by changes in physical climate parameters
Opportunity driver
Description
Potential impact
Timeframe
Direct/ Indirect
Likelihood
Magnitude of impact
Estimated financial
implications
Management
method
Cost of
management
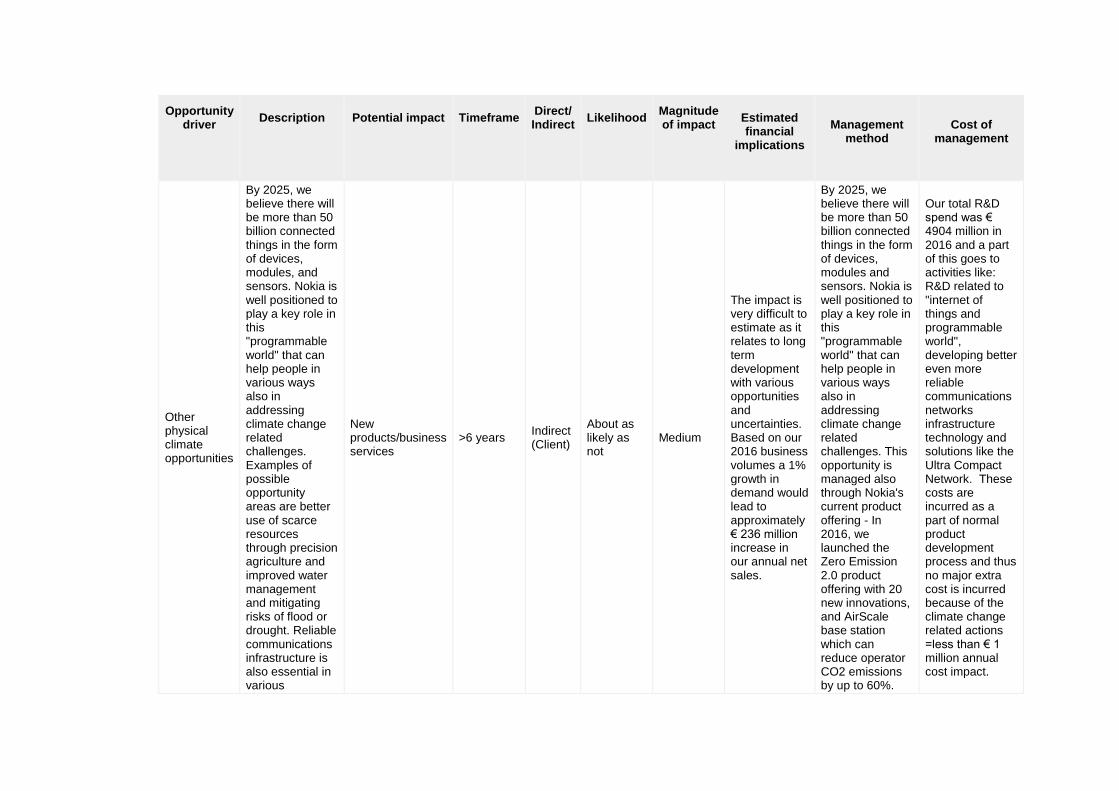
Other physical climate opportunities
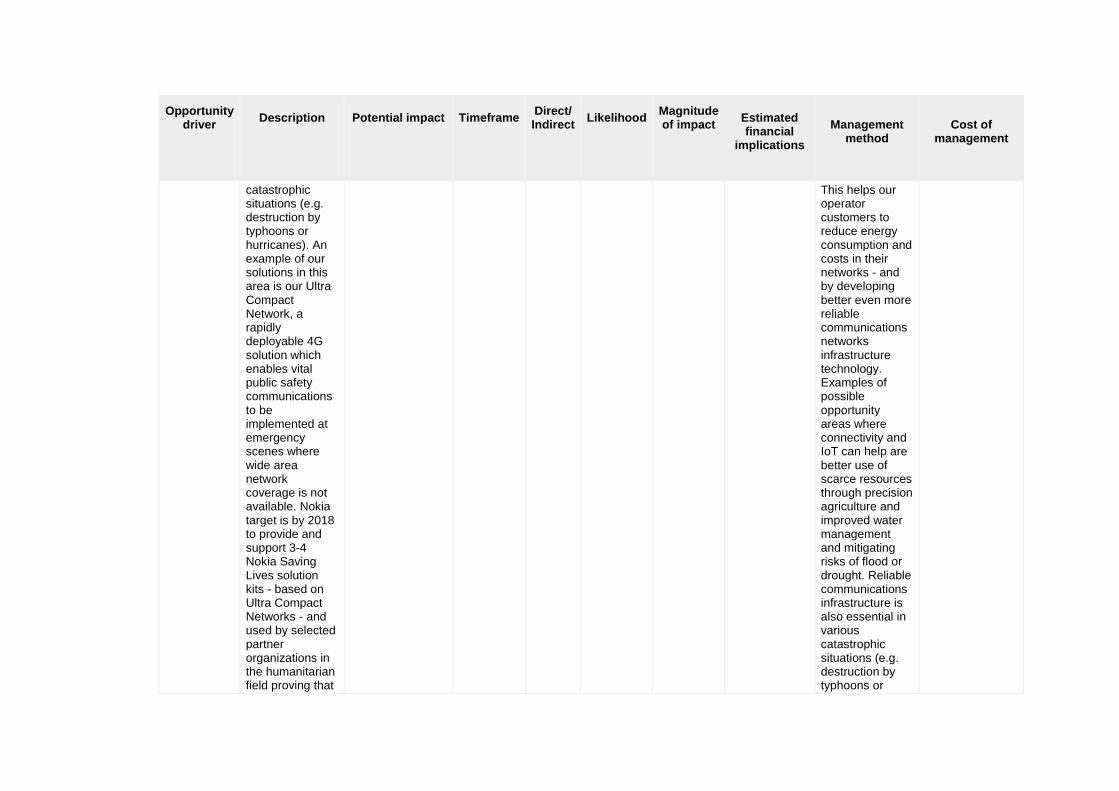
By 2025, we believe there will be more than 50 billion connected things in the form of devices, modules, and sensors. Nokia is well positioned to play a key role in this "programmable world" that can help people in various ways also in addressing climate change related challenges. Examples of possible opportunity areas are better use of scarce resources through precision agriculture and improved water management and mitigating risks of flood or drought. Reliable communications infrastructure is also essential in various
New products/business services
>6 years Indirect (Client)
About as likely as not
Medium
The impact is very difficult to estimate as it relates to long term development with various opportunities and uncertainties. Based on our 2016 business volumes a 1% growth in demand would lead to approximately € 236 million increase in our annual net sales.
By 2025, we believe there will be more than 50 billion connected things in the form of devices, modules and sensors. Nokia is well positioned to play a key role in this "programmable world" that can help people in various ways also in addressing climate change related challenges. This opportunity is managed also through Nokia's current product offering - In 2016, we launched the Zero Emission 2.0 product offering with 20 new innovations, and AirScale base station which can reduce operator CO2 emissions by up to 60%.
Our total R&D spend was € 4904 million in 2016 and a part of this goes to activities like: R&D related to "internet of things and programmable world", developing better even more reliable communications networks infrastructure technology and solutions like the Ultra Compact Network. These costs are incurred as a part of normal product development process and thus no major extra cost is incurred because of the climate change related actions =less than € 1 million annual cost impact.
Opportunity driver
Description
Potential impact
Timeframe
Direct/ Indirect
Likelihood
Magnitude of impact
Estimated financial
implications
Management
method
Cost of
management
catastrophic situations (e.g. destruction by typhoons or hurricanes). An example of our solutions in this area is our Ultra Compact Network, a rapidly deployable 4G solution which enables vital public safety communications to be implemented at emergency scenes where wide area network coverage is not available. Nokia target is by 2018 to provide and support 3-4 Nokia Saving Lives solution kits - based on Ultra Compact Networks - and used by selected partner organizations in the humanitarian field proving that
This helps our operator customers to reduce energy consumption and costs in their networks - and by developing better even more reliable communications networks infrastructure technology. Examples of possible opportunity areas where connectivity and IoT can help are better use of scarce resources through precision agriculture and improved water management and mitigating risks of flood or drought. Reliable communications infrastructure is also essential in various catastrophic situations (e.g. destruction by typhoons or

Opportunity driver
Description
Potential impact
Timeframe
Direct/ Indirect
Likelihood
Magnitude of impact
Estimated financial
implications
Management
method
Cost of
management
Nokia technology saves lives.
hurricanes). An example of our solutions in this area is our Ultra Compact Network, a rapidly deployable 4G solution which enables vital public safety communications to be implemented at emergency scenes where wide area network coverage is not available.
CC6.1c
Please describe your inherent opportunities that are driven by changes in other climate-related developments
Opportunity driver
Description
Potential impact
Timeframe
Direct/ Indirec
t
Likelihood
Magnitude of
impact
Estimated financial
implications
Management
method
Cost of
management
Changing consumer behavior
Climate change can lead to voluntary (attitudes etc.) or forced
Increased demand for existing
>6 years Indirect (Client)
About as likely as not
Low-medium
The impact is very difficult to estimate
Nokia develops and sells products
Our total R&D spend was € 4904 million in
Opportunity driver
Description
Potential impact
Timeframe
Direct/ Indirec
t
Likelihood
Magnitude of
impact
Estimated financial
implications
Management
method
Cost of
management
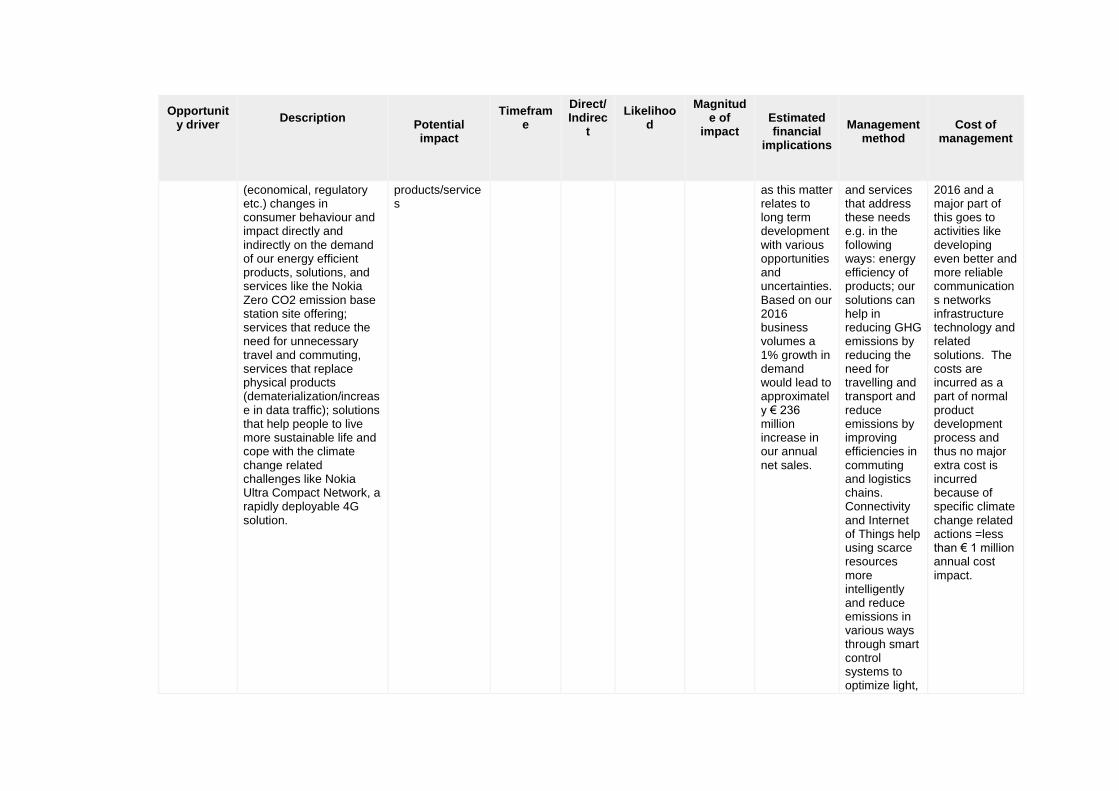
(economical, regulatory etc.) changes in consumer behaviour and impact directly and indirectly on the demand of our energy efficient products, solutions, and services like the Nokia Zero CO2 emission base station site offering; services that reduce the need for unnecessary travel and commuting, services that replace physical products (dematerialization/increase in data traffic); solutions that help people to live more sustainable life and cope with the climate change related challenges like Nokia Ultra Compact Network, a rapidly deployable 4G solution.
products/services
as this matter relates to long term development with various opportunities and uncertainties. Based on our 2016 business volumes a 1% growth in demand would lead to approximately € 236 million increase in our annual net sales.
and services that address these needs e.g. in the following ways: energy efficiency of products; our solutions can help in reducing GHG emissions by reducing the need for travelling and transport and reduce emissions by improving efficiencies in commuting and logistics chains. Connectivity and Internet of Things help using scarce resources more intelligently and reduce emissions in various ways through smart control systems to optimize light,
2016 and a major part of this goes to activities like developing even better and more reliable communications networks infrastructure technology and related solutions. The costs are incurred as a part of normal product development process and thus no major extra cost is incurred because of specific climate change related actions =less than € 1 million annual cost impact.

Opportunity driver
Description
Potential impact
Timeframe
Direct/ Indirec
t
Likelihood
Magnitude of
impact
Estimated financial
implications
Management
method
Cost of
management
nutrition, water supply, agriculture and manufacturing. Connectivity solutions and Internet of Things help introducing smart metering, smart traffic, logistics and intelligent energy solutions to reduce emissions and energy costs and bring new business opportunities and help companies to respond the increased consumer demand for energy efficient products, solutions and services. Examples of Nokia energy efficient
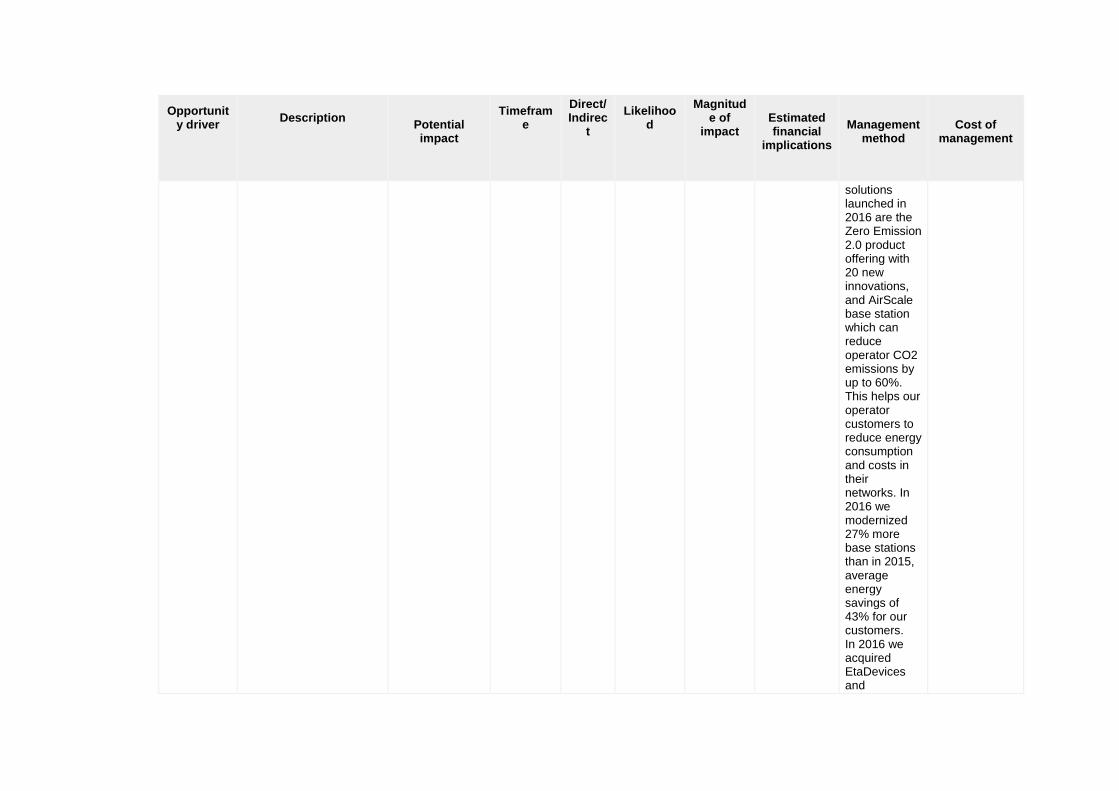
Opportunity driver
Description
Potential impact
Timeframe
Direct/ Indirec
t
Likelihood
Magnitude of
impact
Estimated financial
implications
Management
method
Cost of
management
solutions launched in 2016 are the Zero Emission 2.0 product offering with 20 new innovations, and AirScale base station which can reduce operator CO2 emissions by up to 60%. This helps our operator customers to reduce energy consumption and costs in their networks. In 2016 we modernized 27% more base stations than in 2015, average energy savings of 43% for our customers. In 2016 we acquired EtaDevices and

Opportunity driver
Description
Potential impact
Timeframe
Direct/ Indirec
t
Likelihood
Magnitude of
impact
Estimated financial
implications
Management
method
Cost of
management
Gainspeed both companies supporting our goals of improved product energy efficiency.
CC6.1d
Please explain why you do not consider your company to be exposed to inherent opportunities driven by changes in regulation that have the potential to generate a substantive change in your business operations, revenue or expenditure
CC6.1e
Please explain why you do not consider your company to be exposed to inherent opportunities driven by changes in physical climate parameters that have the potential to generate a substantive change in your business operations, revenue or expenditure
CC6.1f

Please explain why you do not consider your company to be exposed to inherent opportunities driven by changes in other climate-related developments that have the potential to generate a substantive change in your business operations, revenue or expenditure
Further Information
Module: GHG Emissions Accounting, Energy and Fuel Use, and Trading
Page: CC7. Emissions Methodology
CC7.1
Please provide your base year and base year emissions (Scopes 1 and 2)
Scope
Base year
Base year emissions (metric tonnes CO2e)
Scope 1 Wed 01 Jan 2014 - Wed 31 Dec 2014
169200
Scope 2 (location-based) Wed 01 Jan 2014 - Wed 31 Dec 2014
599800
Scope 2 (market-based) Wed 01 Jan 2014 - Wed 31 Dec 2014
554600
CC7.2
Please give the name of the standard, protocol or methodology you have used to collect activity data and calculate Scope 1 and Scope 2 emissions

Please select the published methodologies that you use
The Greenhouse Gas Protocol: A Corporate Accounting and Reporting Standard (Revised Edition)
Defra Voluntary Reporting Guidelines
US EPA Climate Leaders: Direct HFC and PFC Emissions from Use of Refrigeration and Air Conditioning Equipment
US EPA Climate Leaders: Indirect Emissions from Purchases/Sales of Electricity and Steam
US EPA Climate Leaders: Direct Emissions from Stationary Combustion
US EPA Climate Leaders: Direct Emissions from Mobile Combustion Sources
US EPA Mandatory Greenhouse Gas Reporting Rule
CC7.2a
If you have selected "Other" in CC7.2 please provide details of the standard, protocol or methodology you have used to collect activity data and calculate Scope 1 and Scope 2 emissions
CC7.3
Please give the source for the global warming potentials you have used
Gas
Reference
CO2 IPCC Fourth Assessment Report (AR4 - 100 year)
CO2 IPCC Fourth Assessment Report (AR4 - 100 year)
CH4 IPCC Fourth Assessment Report (AR4 - 100 year)

Gas
Reference
N2O IPCC Fourth Assessment Report (AR4 - 100 year)
HFCs IPCC Fourth Assessment Report (AR4 - 100 year)
PFCs IPCC Fourth Assessment Report (AR4 - 100 year)
SF6 IPCC Fourth Assessment Report (AR4 - 100 year)
CC7.4
Please give the emissions factors you have applied and their origin; alternatively, please attach an Excel spreadsheet with this data at the bottom of this page
Fuel/Material/Energy
Emission Factor
Unit
Reference
Biogas Please see the attached excel sheet for the emission factors
Coke oven gas Please see the attached excel sheet for the emission factors
Cooling Please see the attached excel sheet for the emission factors
Diesel/Gas oil Please see the attached excel sheet for the emission factors
Distillate fuel oil No 2 Please see the attached excel sheet for the emission factors
Distillate fuel oil No 6 Please see the attached excel sheet for the emission factors
Electricity Please see the attached excel sheet for the emission factors
Heat Please see the attached excel sheet for the emission factors
Liquefied Natural Gas (LNG) Please see the attached excel sheet for the emission factors

Fuel/Material/Energy
Emission Factor
Unit
Reference
Liquefied petroleum gas (LPG) Please see the attached excel sheet for the emission factors
Motor gasoline Please see the attached excel sheet for the emission factors
Natural gas Please see the attached excel sheet for the emission factors
Propane Please see the attached excel sheet for the emission factors
Residual fuel oil Please see the attached excel sheet for the emission factors
Steam Please see the attached excel sheet for the emission factors
Other: HFCs Please see the attached excel sheet for the emission factors
Other: PFCs Please see the attached excel sheet for the emission factors
Further Information
All emission factors are contained within the attached documents. Related to CC7.1, our base year 2014 Scope 1 emissions for the "Combined comparable company", as reported in People and Planet 2016 Report, are 124 400 tonnes, excluding the car fleet emissions, which we started to track from 2015 onwards. Anyhow, to have a more complete base year data, in base year data we use the 2015 car fleet emissions as proxy for 2014 fleet data emissions, leading to 169 200 tonnes CO2e baseline Scope 1 emissions .
Attachments
https://www.cdp.net/sites/2017/60/13360/Climate Change 2017/Shared Documents/Attachments/ClimateChange2017/CC7.EmissionsMethodology/CH4-N2O Worldwide Emission Factors.xlsx https://www.cdp.net/sites/2017/60/13360/Climate Change 2017/Shared Documents/Attachments/ClimateChange2017/CC7.EmissionsMethodology/Emissions.pdf https://www.cdp.net/sites/2017/60/13360/Climate Change 2017/Shared Documents/Attachments/ClimateChange2017/CC7.EmissionsMethodology/Residual Mix Factors for Europe.xlsx https://www.cdp.net/sites/2017/60/13360/Climate Change 2017/Shared Documents/Attachments/ClimateChange2017/CC7.EmissionsMethodology/Residual Mix 2016 (USA-Canada).pdf https://www.cdp.net/sites/2017/60/13360/Climate Change 2017/Shared Documents/Attachments/ClimateChange2017/CC7.EmissionsMethodology/USEPA
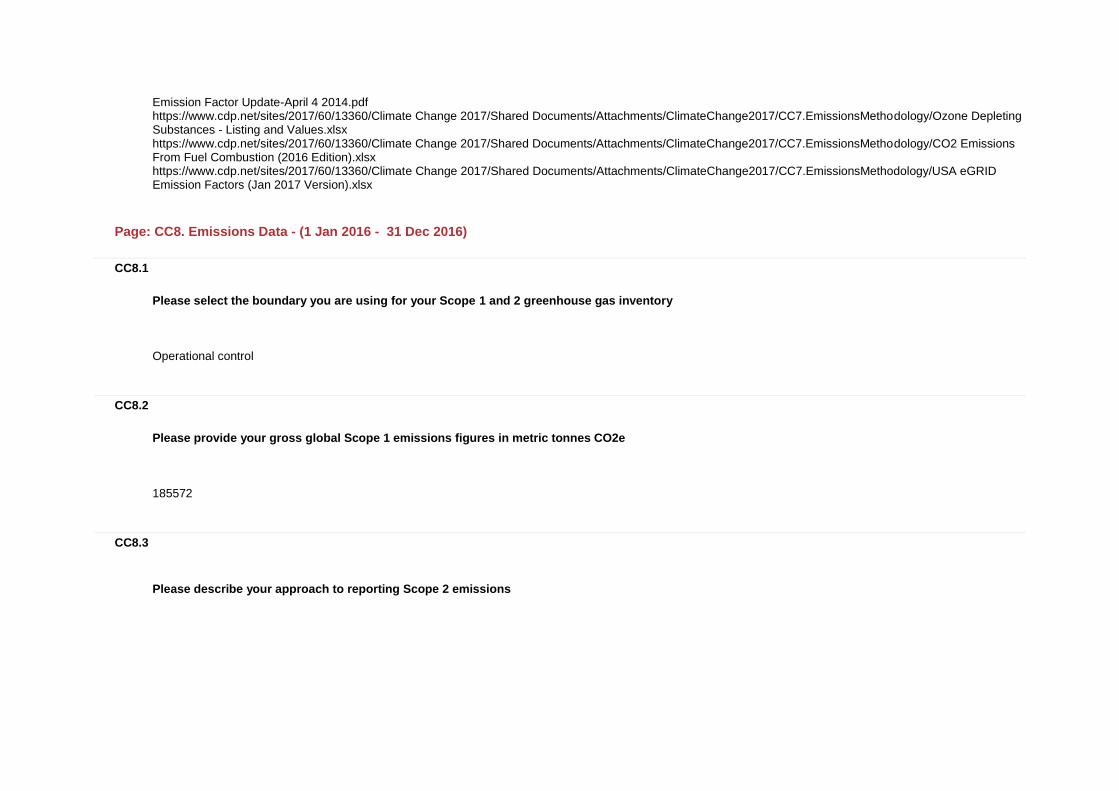
Emission Factor Update-April 4 2014.pdf https://www.cdp.net/sites/2017/60/13360/Climate Change 2017/Shared Documents/Attachments/ClimateChange2017/CC7.EmissionsMethodology/Ozone Depleting Substances - Listing and Values.xlsx https://www.cdp.net/sites/2017/60/13360/Climate Change 2017/Shared Documents/Attachments/ClimateChange2017/CC7.EmissionsMethodology/CO2 Emissions From Fuel Combustion (2016 Edition).xlsx https://www.cdp.net/sites/2017/60/13360/Climate Change 2017/Shared Documents/Attachments/ClimateChange2017/CC7.EmissionsMethodology/USA eGRID Emission Factors (Jan 2017 Version).xlsx
Page: CC8. Emissions Data - (1 Jan 2016 - 31 Dec 2016)
CC8.1
Please select the boundary you are using for your Scope 1 and 2 greenhouse gas inventory
Operational control
CC8.2
Please provide your gross global Scope 1 emissions figures in metric tonnes CO2e
185572
CC8.3
Please describe your approach to reporting Scope 2 emissions
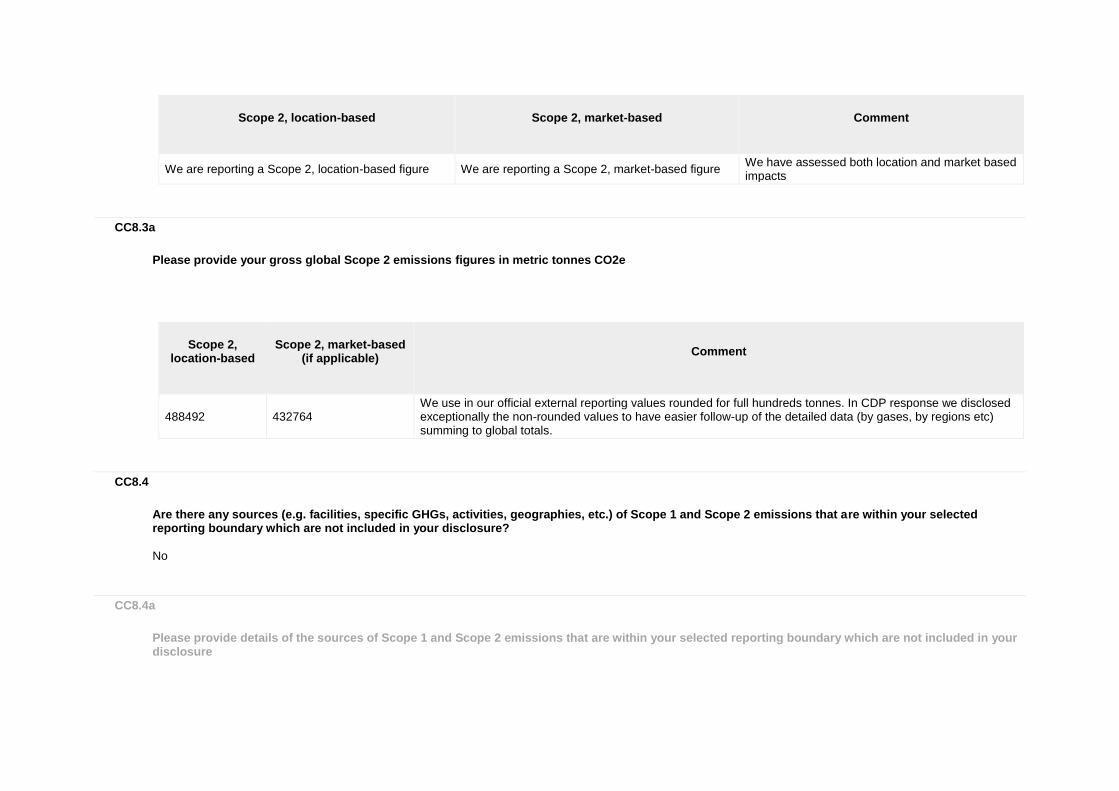
Scope 2, location-based
Scope 2, market-based
Comment
We are reporting a Scope 2, location-based figure We are reporting a Scope 2, market-based figure We have assessed both location and market based impacts
CC8.3a
Please provide your gross global Scope 2 emissions figures in metric tonnes CO2e
Scope 2,
location-based
Scope 2, market-based
(if applicable)
Comment
488492 432764 We use in our official external reporting values rounded for full hundreds tonnes. In CDP response we disclosed exceptionally the non-rounded values to have easier follow-up of the detailed data (by gases, by regions etc) summing to global totals.
CC8.4
Are there any sources (e.g. facilities, specific GHGs, activities, geographies, etc.) of Scope 1 and Scope 2 emissions that are within your selected reporting boundary which are not included in your disclosure?
No
CC8.4a
Please provide details of the sources of Scope 1 and Scope 2 emissions that are within your selected reporting boundary which are not included in your disclosure

Source
Relevance of Scope 1 emissions from this
source
Relevance of location-based Scope 2 emissions from this
source
Relevance of market-based Scope 2
emissions from this source (if applicable)
Explain why the source is excluded
CC8.5
Please estimate the level of uncertainty of the total gross global Scope 1 and 2 emissions figures that you have supplied and specify the sources of uncertainty in your data gathering, handling and calculations
Scope
Uncertainty range
Main sources of
uncertainty
Please expand on the uncertainty in your data
Scope 1 More than 10% but less than or equal to 20%
Assumptions Extrapolation Metering/ Measurement Constraints Data Management
Operational data associated with leased vehicles exhibits the most uncertainty due to estimation procedure associated with car specific CO2/km provided by the car manufacturers and travel distance per vehicle. Natural gas usage estimations associated with those leased facilities, where actual operational data is not provided by the facility manager, yields to more uncertainty. Estimated natural gas usage accounted for less than 1% of natural gas usage, when compared to total usage.
Scope 2 (location-based)
Less than or equal to 2%
Extrapolation Metering/ Measurement Constraints
Electricity usage estimations associated with those leased facilities where actual operational data is not provided by the facility manager provides a slight degree of uncertainty. Estimated electricity usage accounted for less than 2% of electricity usage, when compared to total usage.
Scope 2 (market-based)
More than 2% but less than or equal to 5%
Extrapolation Metering/ Measurement Constraints
Electricity usage estimations associated with those leased facilities where actual operational data not provided by the facility manager provides a slight degree of uncertainty. Estimated electricity usage accounted for less than 2% of electricity usage, when compared to total usage.
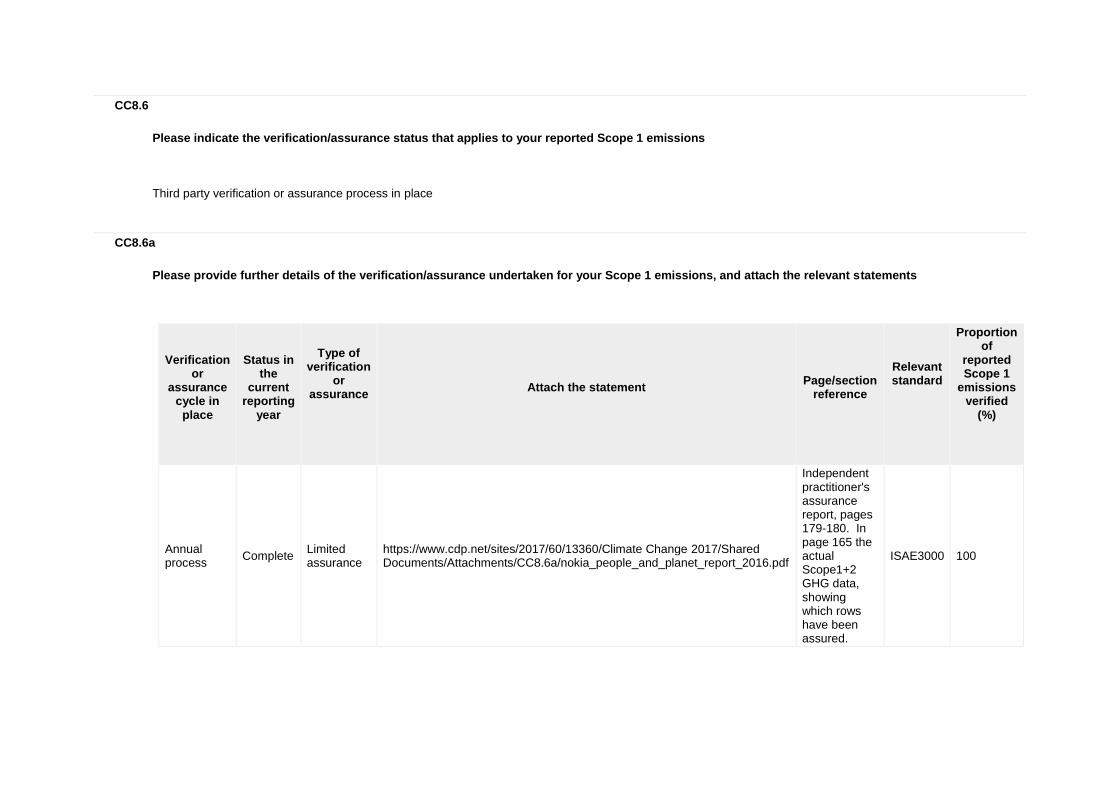
CC8.6
Please indicate the verification/assurance status that applies to your reported Scope 1 emissions
Third party verification or assurance process in place
CC8.6a
Please provide further details of the verification/assurance undertaken for your Scope 1 emissions, and attach the relevant statements
Verification
or assurance
cycle in place
Status in
the current
reporting year
Type of verification
or assurance
Attach the statement
Page/section
reference
Relevant standard
Proportion of
reported Scope 1
emissions verified
(%)
Annual process
Complete Limited assurance
https://www.cdp.net/sites/2017/60/13360/Climate Change 2017/Shared Documents/Attachments/CC8.6a/nokia_people_and_planet_report_2016.pdf
Independent practitioner's assurance report, pages 179-180. In page 165 the actual Scope1+2 GHG data, showing which rows have been assured.
ISAE3000 100
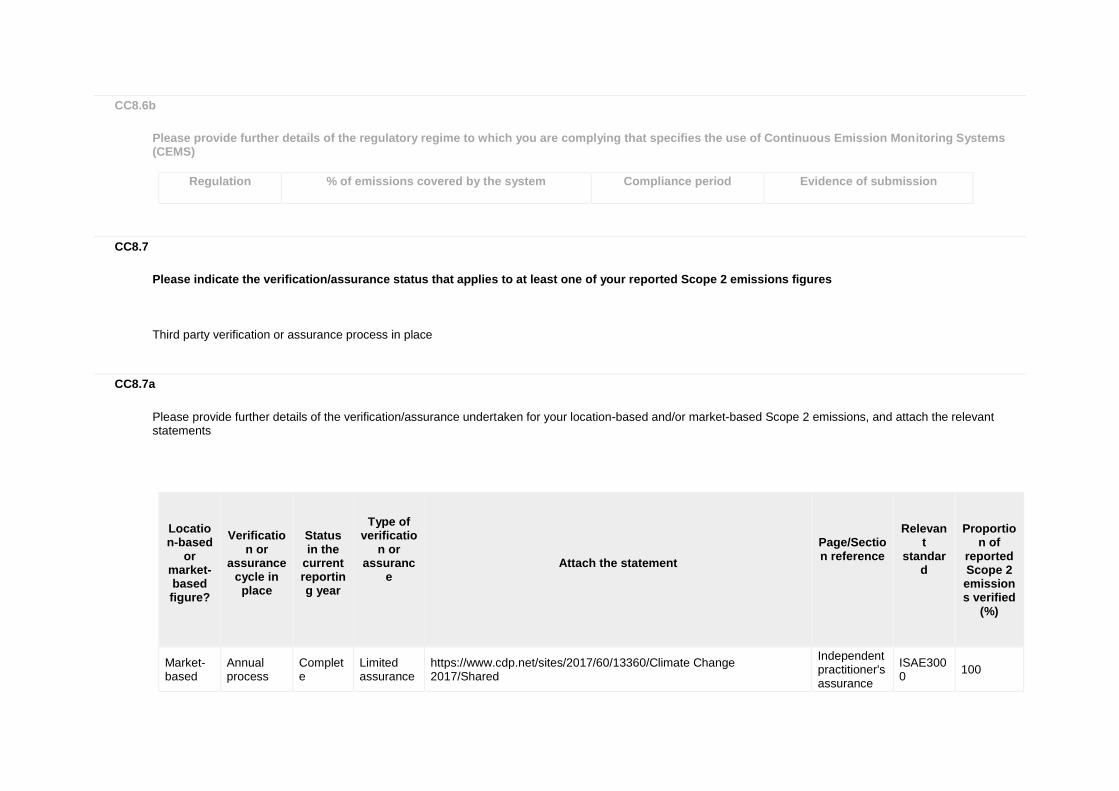
CC8.6b
Please provide further details of the regulatory regime to which you are complying that specifies the use of Continuous Emission Monitoring Systems (CEMS)
Regulation
% of emissions covered by the system
Compliance period
Evidence of submission
CC8.7
Please indicate the verification/assurance status that applies to at least one of your reported Scope 2 emissions figures
Third party verification or assurance process in place
CC8.7a
Please provide further details of the verification/assurance undertaken for your location-based and/or market-based Scope 2 emissions, and attach the relevant statements
Location-based
or market-based figure?
Verificatio
n or assurance
cycle in place
Status in the
current reporting year
Type of verificatio
n or assuranc
e
Attach the statement
Page/Section reference
Relevant
standard
Proportion of
reported Scope 2 emissions verified
(%)
Market-based
Annual process
Complete
Limited assurance
https://www.cdp.net/sites/2017/60/13360/Climate Change 2017/Shared
Independent practitioner's assurance
ISAE3000
100

Location-based
or market-based figure?
Verificatio
n or assurance
cycle in place
Status in the
current reporting year
Type of verificatio
n or assuranc
e
Attach the statement
Page/Section reference
Relevant
standard
Proportion of
reported Scope 2 emissions verified
(%)
Documents/Attachments/CC8.7a/nokia_people_and_planet_report_2016.pdf
report, pages 179-180. In page 165 the actual Scope1+2 GHG data, showing which rows have been assured.
Location-based
Annual process
Complete
Limited assurance
https://www.cdp.net/sites/2017/60/13360/Climate Change 2017/Shared Documents/Attachments/CC8.7a/nokia_people_and_planet_report_2016.pdf
Independent practitioner's assurance report, pages 179-180. In page 165 the actual Scope1+2 GHG data, showing which rows have been assured.
ISAE3000
100
CC8.8

Please identify if any data points have been verified as part of the third party verification work undertaken, other than the verification of emissions figures reported in CC8.6, CC8.7 and CC14.2
Additional data points verified
Comment
Renewable energy products
Assured item: Renewable electricity amount (GWh) and portion of total electricity consumption (%)
Emissions reduction activities
Energy savings achieved in 2016 due to network modernisation (MWh) ; Improved energy efficiency of two products (Case: Photonic Services Switch 1830 PSS-24x. Case: Surepay solution); Number of suppliers that set GHG emission reduction targets (in CDP)
Other: Energy use Energy consumption within Nokia, by types of energy (GWh); Energy consumption of sold products (GWh)
CC8.9
Are carbon dioxide emissions from biologically sequestered carbon relevant to your organization?
No
CC8.9a
Please provide the emissions from biologically sequestered carbon relevant to your organization in metric tonnes CO2
Further Information
Page: CC9. Scope 1 Emissions Breakdown - (1 Jan 2016 - 31 Dec 2016)
CC9.1
Do you have Scope 1 emissions sources in more than one country?

Yes
CC9.1a
Please break down your total gross global Scope 1 emissions by country/region
Country/Region
Scope 1 metric tonnes CO2e
Europe, Middle East and Africa (EMEA) 8111
Americas 21102
Asia Pacific (or JAPA) 1594
India 569
Rest of world 154197
CC9.2
Please indicate which other Scope 1 emissions breakdowns you are able to provide (tick all that apply)
By GHG type
CC9.2a
Please break down your total gross global Scope 1 emissions by business division

Business division
Scope 1 emissions (metric tonnes CO2e)
CC9.2b
Please break down your total gross global Scope 1 emissions by facility
Facility
Scope 1 emissions (metric tonnes CO2e)
Latitude
Longitude
CC9.2c
Please break down your total gross global Scope 1 emissions by GHG type
GHG type
Scope 1 emissions (metric tonnes CO2e)
CO2 182948
CH4 214
N2O 986
HFCs 1424
CC9.2d
Please break down your total gross global Scope 1 emissions by activity
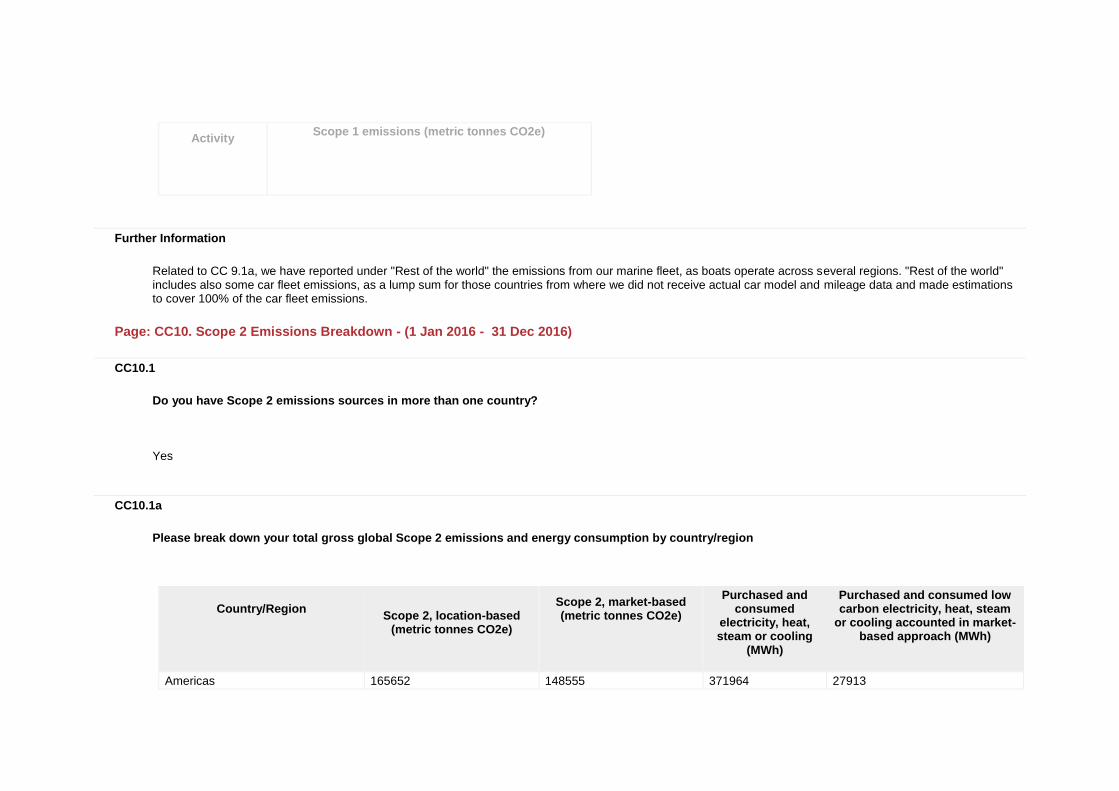
Activity
Scope 1 emissions (metric tonnes CO2e)
Further Information
Related to CC 9.1a, we have reported under "Rest of the world" the emissions from our marine fleet, as boats operate across several regions. "Rest of the world" includes also some car fleet emissions, as a lump sum for those countries from where we did not receive actual car model and mileage data and made estimations to cover 100% of the car fleet emissions.
Page: CC10. Scope 2 Emissions Breakdown - (1 Jan 2016 - 31 Dec 2016)
CC10.1
Do you have Scope 2 emissions sources in more than one country?
Yes
CC10.1a
Please break down your total gross global Scope 2 emissions and energy consumption by country/region
Country/Region
Scope 2, location-based
(metric tonnes CO2e)
Scope 2, market-based (metric tonnes CO2e)
Purchased and consumed
electricity, heat, steam or cooling
(MWh)
Purchased and consumed low carbon electricity, heat, steam
or cooling accounted in market-based approach (MWh)
Americas 165652 148555 371964 27913

Country/Region
Scope 2, location-based
(metric tonnes CO2e)
Scope 2, market-based (metric tonnes CO2e)
Purchased and consumed
electricity, heat, steam or cooling
(MWh)
Purchased and consumed low carbon electricity, heat, steam
or cooling accounted in market-based approach (MWh)
Asia Pacific (or JAPA) 126564 126564 197714 0
Europe, Middle East and Africa (EMEA)
111394 72763 414719 184601
India 84882 84882 103609 0
CC10.2
Please indicate which other Scope 2 emissions breakdowns you are able to provide (tick all that apply)
CC10.2a
Please break down your total gross global Scope 2 emissions by business division
Business division
Scope 2, location-based (metric tonnes CO2e)
Scope 2, market-based (metric tonnes CO2e)
CC10.2b
Please break down your total gross global Scope 2 emissions by facility

Facility
Scope 2, location-based (metric tonnes CO2e)
Scope 2, market-based (metric tonnes CO2e)
CC10.2c
Please break down your total gross global Scope 2 emissions by activity
Activity
Scope 2, location-based (metric tonnes CO2e)
Scope 2, market-based (metric tonnes CO2e)
Further Information
Page: CC11. Energy
CC11.1
What percentage of your total operational spend in the reporting year was on energy?
More than 0% but less than or equal to 5%
CC11.2
Please state how much heat, steam, and cooling in MWh your organization has purchased and consumed during the reporting year

Energy type
MWh
Heat 47346
Steam 0
Cooling 6492
CC11.3
Please state how much fuel in MWh your organization has consumed (for energy purposes) during the reporting year
608126
CC11.3a
Please complete the table by breaking down the total "Fuel" figure entered above by fuel type
Fuels
MWh
Diesel/Gas oil 12292
Residual fuel oil 36070
Motor gasoline 418778
Propane 647
Natural gas 136806
Coke oven gas 117
Biogas 3417
CC11.4

Please provide details of the electricity, heat, steam or cooling amounts that were accounted at a low carbon emission factor in the market-based Scope 2 figure reported in CC8.3a
Basis for applying a low carbon emission factor
MWh consumed associated with low carbon electricity,
heat, steam or cooling
Emissions factor (in units of
metric tonnes CO2e per MWh)
Comment
Energy attribute certificates, Guarantees of Origin
184601 0 Countries that purchased Guarantees of Origin: Belgium, Finland, Germany, Poland Switzerland
Energy attribute certificates, Renewable Energy Certificates (RECs)
27914 0 Country that purchased RECs: United States
CC11.5
Please report how much electricity you produce in MWh, and how much electricity you consume in MWh
Total electricity consumed
(MWh)
Consumed
electricity that is purchased (MWh)
Total electricity produced
(MWh)
Total renewable
electricity produced (MWh)
Consumed renewable
electricity that is produced by company (MWh)
Comment
1034169 1034169 0 0 0
Further Information
Page: CC12. Emissions Performance
CC12.1

How do your gross global emissions (Scope 1 and 2 combined) for the reporting year compare to the previous year?
Decreased
CC12.1a
Please identify the reasons for any change in your gross global emissions (Scope 1 and 2 combined) and for each of them specify how your emissions compare to the previous year
Reason
Emissions value
(percentage)
Direction of
change
Please explain and include calculation
Emissions reduction activities
10.2 Decrease
Nokia has invested in various "Green Projects" in 2016 that accounted for a 1,220 tCO2e reduction. However, those projects only represent a small percentage of actual, active, energy usage reductions within our facilities, as noted by the significant reduction in electricity usage. The major reason for that observed energy usage reduction is the direct result of facility management personnel enacting various energy efficiency best practices at facilities focused both at the general "office population", and more importantly within our laboratories. Nokia has conducted numerous assessments of energy usage within facilities that contain both laboratories and office area, and has verified that laboratory operations account for over 75% of energy usage within those commingled facilities. As such, facility managers have been working with laboratory representatives to reduce energy usage from laboratory equipment, as well as manage airflow and temperature controls within laboratory areas. Nokia is presently installing sub-meters within laboratories to be able to better quantify those specific energy reductions. In addition, we are calculating the "power usage effectiveness (PUE) of individual laboratories, and establishing PUE targets for the various types of laboratories contained within our facilities. Annual Emissions (tCO2e) Fuel combustion in facilities: (2015) 32,270, (2016) 29,932 Refrigerant losses: (2015) 6,157, (2016) 1,411 Manufacturing emissions: (2015) 530, (2016) 33 Fire suppression system losses: (2015) 419, (2016) 1 Purchased electricity: (2015) 486,591, (2016) 418,740 Purchased heating: (2015) 12,326 (2016) 10,727 Purchased cooling: (2015) 3,110 (2016) 3,298 Applicable 2015 Emissions: 541,404 tCO2e Applicable 2016 Emissions: 464,140 tCO2e These sites are contained in both 2015 and 2016 Real Estate Portfolio 2015: Facility Electricity Usage Indicator: 0.039 kwh/month-m2 2016: Facility Electricity Usage Indicator: 0.036 kwh/month-m2 2015 Total Scope 1 and 2: 679,306 tCO2e (464,140 tCO2e-541,404 tCO2e)/679,306 tCO2e)*100=11.4% 11.4% - 1.2% (change in boundary) = 10.2%
Divestment 0 No change
Acquisitions 0 No change
At the end of 2015, our shareholders voted overwhelmingly to approve the Alcatel-Lucent acquisition, and in early January 2016 we announced that we had gained control of Alcatel- Lucent through the successful public exchange offer for all outstanding Alcatel-Lucent securities by holding nearly 80% of outstanding Alcatel-

Reason
Emissions value
(percentage)
Direction of
change
Please explain and include calculation
Lucent securities. On November 2, 2016, we achieved 100% ownership of Alcatel-Lucent. Former Alcatel-Lucent operations are fully included in our 2016 Nokia Group reporting. We use the term “Comparable combined company” when we refer to information including combined Nokia Group and former Alcatel-Lucent data prior to acquisition of Alcatel-Lucent in January 2016. In the CDP response, where we do comparisons to 2015, comparisons are done against “Comparable combined company” and hence acquisition is not explaining the differences in the data. The recalculated "Comparable combined company" values are different from the numbers provided in Nokia's 2016 CDP Climate response for the 2015, as 2016 response was for "Nokia standalone".
Mergers 0 No change
Change in output 0 No change
.
Change in methodology
0 No change
Change in boundary
1.2 Decrease
As part of integrating our real estate portfolios, we were able to reduce our real estate portfolio net area by around 5%, which contributed to a net 3% reduction in electricity usage and associated 1.8% reduction in tCO2e. Facilities removed from 2015 Real Estate Portfolio: 9,616 tCO2e Facilities added to Real Estate Portfolio in 2016: 1,200 tCO2e (9,616 tCO2e - 1,200 tCO2e) = 8,416 tCO2e 2015 Total Scope 1 and 2: 679,306 tCO2e (8,416 tCO2e/679,306 tCO2e)* 100 = 1.2%
Change in physical operating conditions
3.7 Increase Increased use of fuel within cable-laying marine vessels due to extreme marine /weather conditions and greater vessel operations. 2015: 354,533 MWh, 93,050 tCO2e 2016: 450,204 MWh, 117,900 tCO2e 2015 Total Scope 1 and 2: 679,306 tCO2e ((117,900 tCO2e-93,050 tCO2e)/679,306 tCO2e)*100 = 3.7%
Unidentified 0 No change
Other 1.3 Decrease
We employed newer fuel-efficient vehicles in our car fleet as per our fleet policy to further develop our low-emission fleet and maintain related emissions below the market average.Car fleet CO₂ e/vehicle km were reduced by 8% between 2015-2016, kilometers driven by 12% and as a result absolute emissions reduced by 19%. 2015: 44,852 tCO2e 2016: 36,297 tCO2e 2015 Total Scope 1 and 2: 679,306 tCO2e ((36,297 tCO2e-44,852 tCO2e)/679,306 tCO2e)*100 = 1.3%
CC12.1b

Is your emissions performance calculations in CC12.1 and CC12.1a based on a location-based Scope 2 emissions figure or a market-based Scope 2 emissions figure?
Market-based
CC12.2
Please describe your gross global combined Scope 1 and 2 emissions for the reporting year in metric tonnes CO2e per unit currency total revenue
Intensity figure =
Metric numerator (Gross global combined
Scope 1 and 2 emissions)
Metric denominator:
Unit total revenue
Scope 2 figure used
% change from
previous year
Direction of change
from previous
year
Reason for change
26.2 metric tonnes CO2e 23614000000 Market-based
2.6 Increase
Despite the fact that our Scope 1 and 2 emissions decreased by 9.0%, largely due to energy efficiency activities, Nokia's annual revenue decreased by 11.2%, over that same time period. Thus, the resulting calculation procedure resulted in a positive intensity figure value.
CC12.3
Please provide any additional intensity (normalized) metrics that are appropriate to your business operations
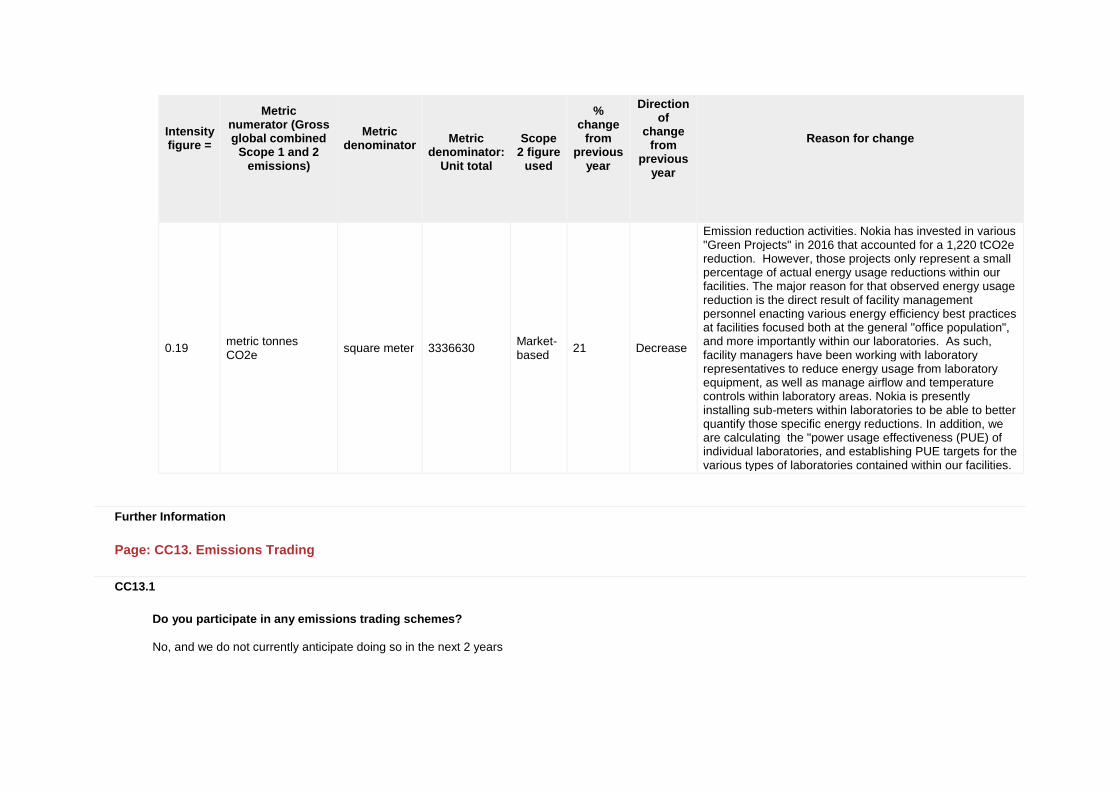
Intensity figure =
Metric numerator (Gross global combined
Scope 1 and 2 emissions)
Metric denominator
Metric
denominator: Unit total
Scope
2 figure used
% change
from previous
year
Direction of
change from
previous year
Reason for change
0.19 metric tonnes CO2e
square meter 3336630 Market-based
21 Decrease
Emission reduction activities. Nokia has invested in various "Green Projects" in 2016 that accounted for a 1,220 tCO2e reduction. However, those projects only represent a small percentage of actual energy usage reductions within our facilities. The major reason for that observed energy usage reduction is the direct result of facility management personnel enacting various energy efficiency best practices at facilities focused both at the general "office population", and more importantly within our laboratories. As such, facility managers have been working with laboratory representatives to reduce energy usage from laboratory equipment, as well as manage airflow and temperature controls within laboratory areas. Nokia is presently installing sub-meters within laboratories to be able to better quantify those specific energy reductions. In addition, we are calculating the "power usage effectiveness (PUE) of individual laboratories, and establishing PUE targets for the various types of laboratories contained within our facilities.
Further Information
Page: CC13. Emissions Trading
CC13.1
Do you participate in any emissions trading schemes?
No, and we do not currently anticipate doing so in the next 2 years

CC13.1a
Please complete the following table for each of the emission trading schemes in which you participate
Scheme name
Period for which data is supplied
Allowances allocated
Allowances purchased
Verified emissions in metric tonnes CO2e
Details of ownership
CC13.1b
What is your strategy for complying with the schemes in which you participate or anticipate participating?
CC13.2
Has your organization originated any project-based carbon credits or purchased any within the reporting period?
No
CC13.2a
Please provide details on the project-based carbon credits originated or purchased by your organization in the reporting period
Credit origination
or credit purchase
Project type
Project identification
Verified to which standard
Number of credits (metric
tonnes CO2e)
Number of credits (metric tonnes
CO2e): Risk adjusted volume
Credits canceled
Purpose, e.g. compliance

Further Information
Page: CC14. Scope 3 Emissions
CC14.1
Please account for your organization’s Scope 3 emissions, disclosing and explaining any exclusions
Sources of Scope 3
emissions
Evaluation status
metric tonnes CO2e
Emissions calculation methodology
Percentage of
emissions calculated using data obtained
from suppliers or value
chain partners
Explanation
Purchased goods and services
Relevant, calculated
1725900
Purchased goods and services: emissions are reported based on data collected with CDP Climate Survey from Nokia’s biggest suppliers, representing around 27% of total purchase spend in 2016 (23% in 2015). In 2016 we used a hybrid method for the first time, using emissions allocated for Nokia by the suppliers and as new method, also intensity based (GHG/€) allocation, where allocated emissions were not available or allocation was not reliable based on different internal quality measures. Collected data is then multiplied to cover 100% of spend. Around 65% of suppliers’ emissions allocated for Nokia are suppliers’ Scope1+2 emissions and 35% suppliers’ upstream scope 3 emissions, so data partly covers emissions beyond Tier 1. Suppliers providing transportation services for products are
27.00%
We recognize that this emission category includes a lot of uncertainty, as suppliers have different qualities in their own reporting and in allocating emissions to Nokia, and due to the extrapolation Nokia does for data to represent 100% of Nokia spend. Calculation is covering purchased good and services of Nokia's Networks business, which was covering 92% of net sales and 97% of employees of the Nokia Group continued operations in 2016.

Sources of Scope 3
emissions
Evaluation status
metric tonnes CO2e
Emissions calculation methodology
Percentage of
emissions calculated using data obtained
from suppliers or value
chain partners
Explanation
excluded as “emissions from transportation and distribution” are reported in a separate scope 3 category. Some suppliers provide both “purchased goods” and smaller amounts of “capital goods” and for simplicity all their emissions are reported under purchased goods. 2016 disclosure is based on the latest CDP data representing suppliers’ year 2015 emissions. CDP Supply chain request includes information on the emission factors and GWP values used by each of the suppliers, but due to volume of information we are not summarizing them in this response.
Capital goods Relevant, calculated
408700
The relevance of emissions from this category to be included in the Scope 3 inventory is assessed each year, as capital goods purchases vary from year to year. The threshold for inclusion is 0.5 % of total Scope 1+2+3 emissions. Emissions from capital goods are based on financial data on property, plant, and equipment additions during the reporting year and estimated by using the GHG Protocol Scope 3 Evaluator tool. The Scope3 Evaluator tool has emission factors and GWPs embedded. We recognize that this emission category includes a lot of uncertainty, as reporting is based on Scope 3 Evaluator tool's average methods.

Sources of Scope 3
emissions
Evaluation status
metric tonnes CO2e
Emissions calculation methodology
Percentage of
emissions calculated using data obtained
from suppliers or value
chain partners
Explanation
Fuel-and-energy-related activities (not included in Scope 1 or 2)
Not relevant, calculated
41400
Fuel and energy related activities not included in Scope 1 and 2: not presently being included in Nokia's carbon footprint, because emissions are by calculation less than 0,1% of total Scope 3 emissions (41 400 tonnes in 2016) and hence not relevant based on size. This category is not relevant either based on influence, risk or stakeholder point of view.
Upstream transportation and distribution
Relevant, calculated
268400
Data includes emissions from inbound and outbound logistics. “Former Nokia” data is based in 2016 on the top 13 (5 in 2014-2015) logistics supply partners (LSP) delivery data (tonne-km) and transportation mode. Former Alcatel-Lucent 2016 data is covering data from 12 LSPs. EPA’s latest CO2e emission factors were used to (re) calculate 2014-2016 emissions for both Nokia Group and Combined comparable company. Nokia changed reporting from pay weight to real weight in 2016 and due to feasibility, no recalculation was done for past values for weight. Upstream emissions include emissions from transportation paid by Nokia. Quality of the data in this category is good, as it is based on detailed tonne-km and delivery mode data.
100.00%
Waste generated in operations
Not relevant, explanation provided
Waste generated in operations: not presently being assessed because emissions are by calculation less than 0,1% of total Scope 3 emissions. This category is not relevant either
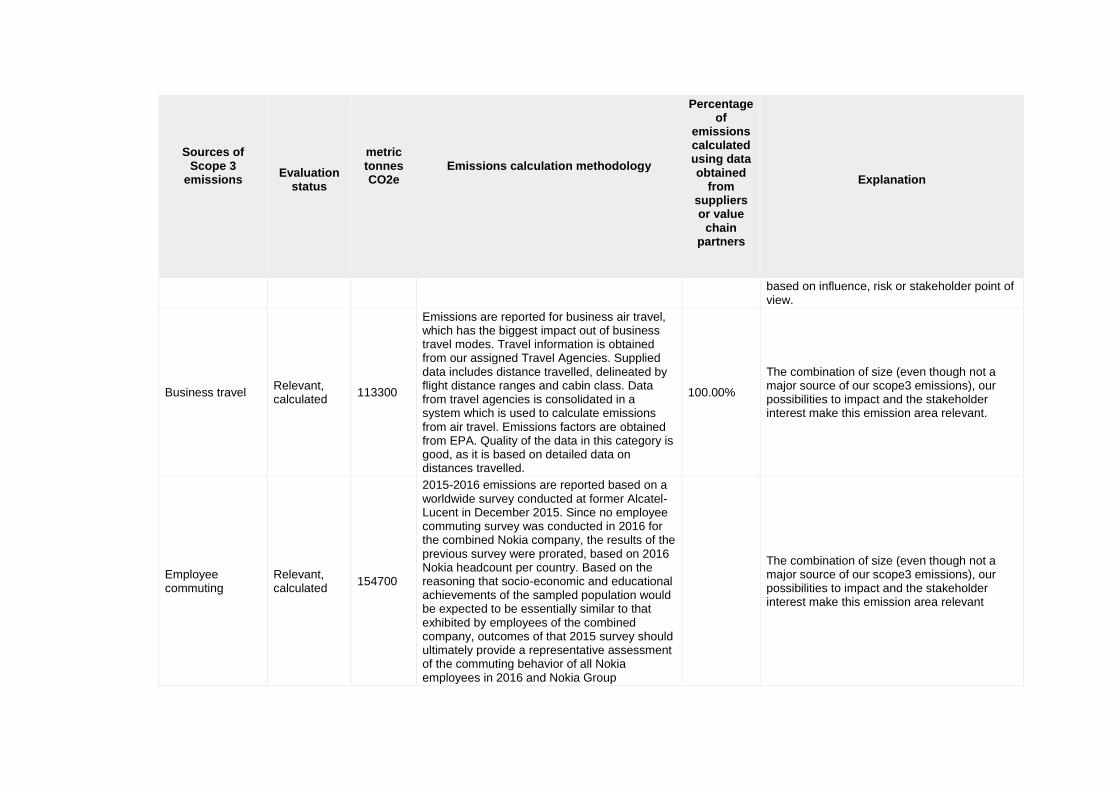
Sources of Scope 3
emissions
Evaluation status
metric tonnes CO2e
Emissions calculation methodology
Percentage of
emissions calculated using data obtained
from suppliers or value
chain partners
Explanation
based on influence, risk or stakeholder point of view.
Business travel Relevant, calculated
113300
Emissions are reported for business air travel, which has the biggest impact out of business travel modes. Travel information is obtained from our assigned Travel Agencies. Supplied data includes distance travelled, delineated by flight distance ranges and cabin class. Data from travel agencies is consolidated in a system which is used to calculate emissions from air travel. Emissions factors are obtained from EPA. Quality of the data in this category is good, as it is based on detailed data on distances travelled.
100.00%
The combination of size (even though not a major source of our scope3 emissions), our possibilities to impact and the stakeholder interest make this emission area relevant.
Employee commuting
Relevant, calculated
154700
2015-2016 emissions are reported based on a worldwide survey conducted at former Alcatel-Lucent in December 2015. Since no employee commuting survey was conducted in 2016 for the combined Nokia company, the results of the previous survey were prorated, based on 2016 Nokia headcount per country. Based on the reasoning that socio-economic and educational achievements of the sampled population would be expected to be essentially similar to that exhibited by employees of the combined company, outcomes of that 2015 survey should ultimately provide a representative assessment of the commuting behavior of all Nokia employees in 2016 and Nokia Group
The combination of size (even though not a major source of our scope3 emissions), our possibilities to impact and the stakeholder interest make this emission area relevant
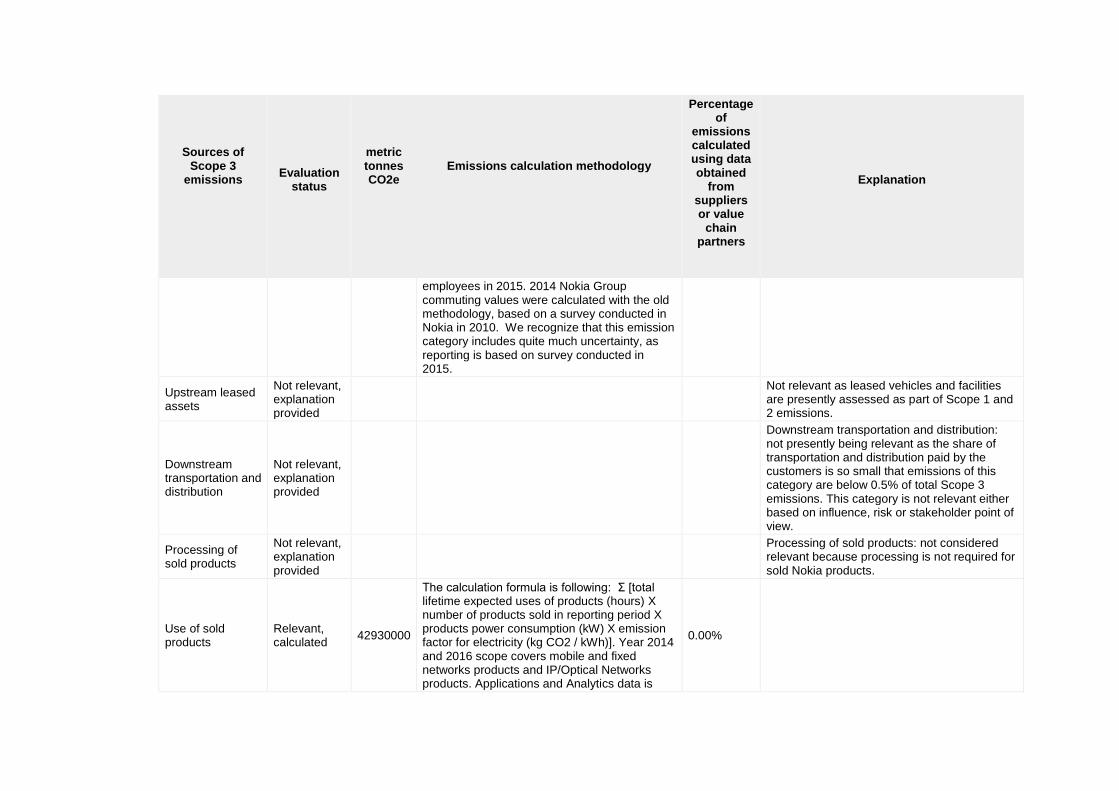
Sources of Scope 3
emissions
Evaluation status
metric tonnes CO2e
Emissions calculation methodology
Percentage of
emissions calculated using data obtained
from suppliers or value
chain partners
Explanation
employees in 2015. 2014 Nokia Group commuting values were calculated with the old methodology, based on a survey conducted in Nokia in 2010. We recognize that this emission category includes quite much uncertainty, as reporting is based on survey conducted in 2015.
Upstream leased assets
Not relevant, explanation provided
Not relevant as leased vehicles and facilities are presently assessed as part of Scope 1 and 2 emissions.
Downstream transportation and distribution
Not relevant, explanation provided
Downstream transportation and distribution: not presently being relevant as the share of transportation and distribution paid by the customers is so small that emissions of this category are below 0.5% of total Scope 3 emissions. This category is not relevant either based on influence, risk or stakeholder point of view.
Processing of sold products
Not relevant, explanation provided
Processing of sold products: not considered relevant because processing is not required for sold Nokia products.
Use of sold products
Relevant, calculated
42930000
The calculation formula is following: Σ [total lifetime expected uses of products (hours) X number of products sold in reporting period X products power consumption (kW) X emission factor for electricity (kg CO2 / kWh)]. Year 2014 and 2016 scope covers mobile and fixed networks products and IP/Optical Networks products. Applications and Analytics data is
0.00%

Sources of Scope 3
emissions
Evaluation status
metric tonnes CO2e
Emissions calculation methodology
Percentage of
emissions calculated using data obtained
from suppliers or value
chain partners
Explanation
available for 2016 only. Product use time varies between 6 and 15 years, depending on the products. Energy use calculations are based on product group specific ETSI standards where ever standards have been published. Total product coverage is over 80%. Calculations are so far based on assumption that all MN, FN, ION and A&A products are powered by grid electricity. Emission factor used is IEA’s latest world average CO2 -emission factor.
End of life treatment of sold products
Not relevant, explanation provided
Not considered relevant. Based on a LCA done by Nokia for a typical Nokia mobile network product (urban base station site in Europe), the use-phase accounts for over 84% of global warming potential, production (supply chain and own operations) for 14%, logistics for 2% and end-of-life treatment rounds to 0%. Furthermore, former Alcatel-Lucent reported a very small negative value for the end-of-life treatment associated with the recycled materials in their products. End-of-life treatment emissions are not significant either in other Nokia product categories. This category is not relevant either based on influence, risk or stakeholder point of view.
Downstream leased assets
Not relevant, explanation provided
Downstream leased assets: not presently being relevant because emissions are by calculation less than 0,1% of total Scope 3 emissions. This category is not relevant either
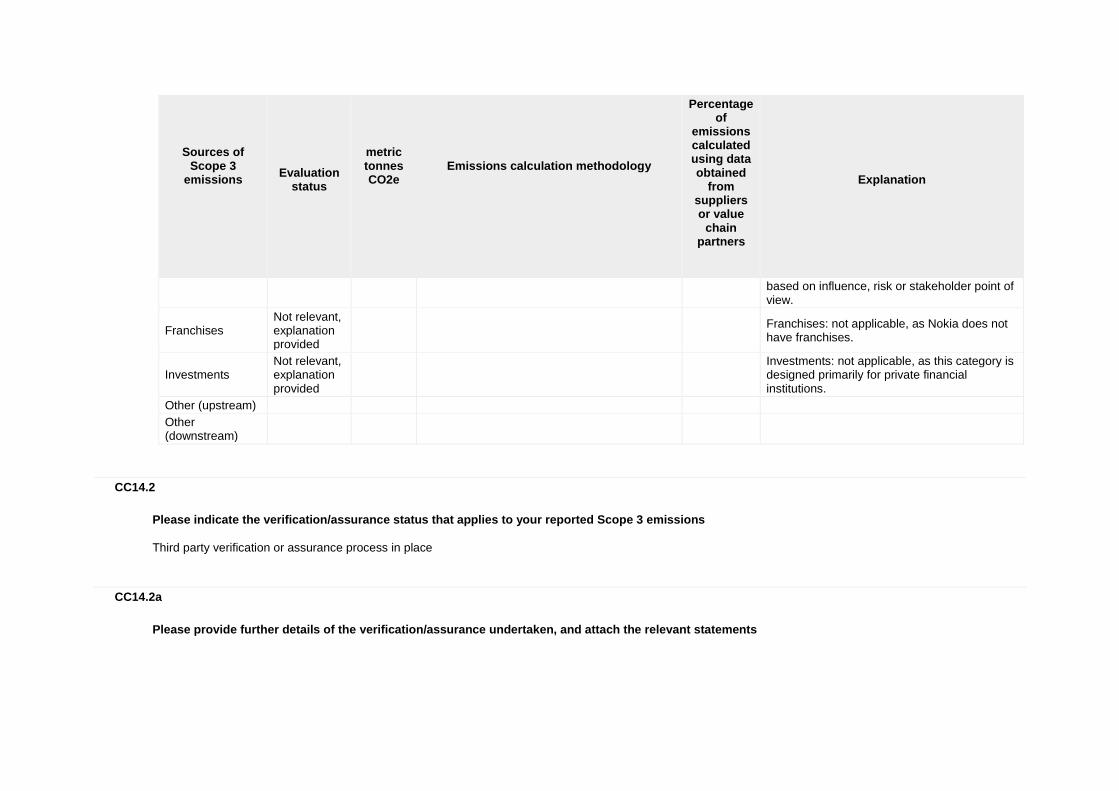
Sources of Scope 3
emissions
Evaluation status
metric tonnes CO2e
Emissions calculation methodology
Percentage of
emissions calculated using data obtained
from suppliers or value
chain partners
Explanation
based on influence, risk or stakeholder point of view.
Franchises Not relevant, explanation provided
Franchises: not applicable, as Nokia does not have franchises.
Investments Not relevant, explanation provided
Investments: not applicable, as this category is designed primarily for private financial institutions.
Other (upstream)
Other (downstream)
CC14.2
Please indicate the verification/assurance status that applies to your reported Scope 3 emissions
Third party verification or assurance process in place
CC14.2a
Please provide further details of the verification/assurance undertaken, and attach the relevant statements
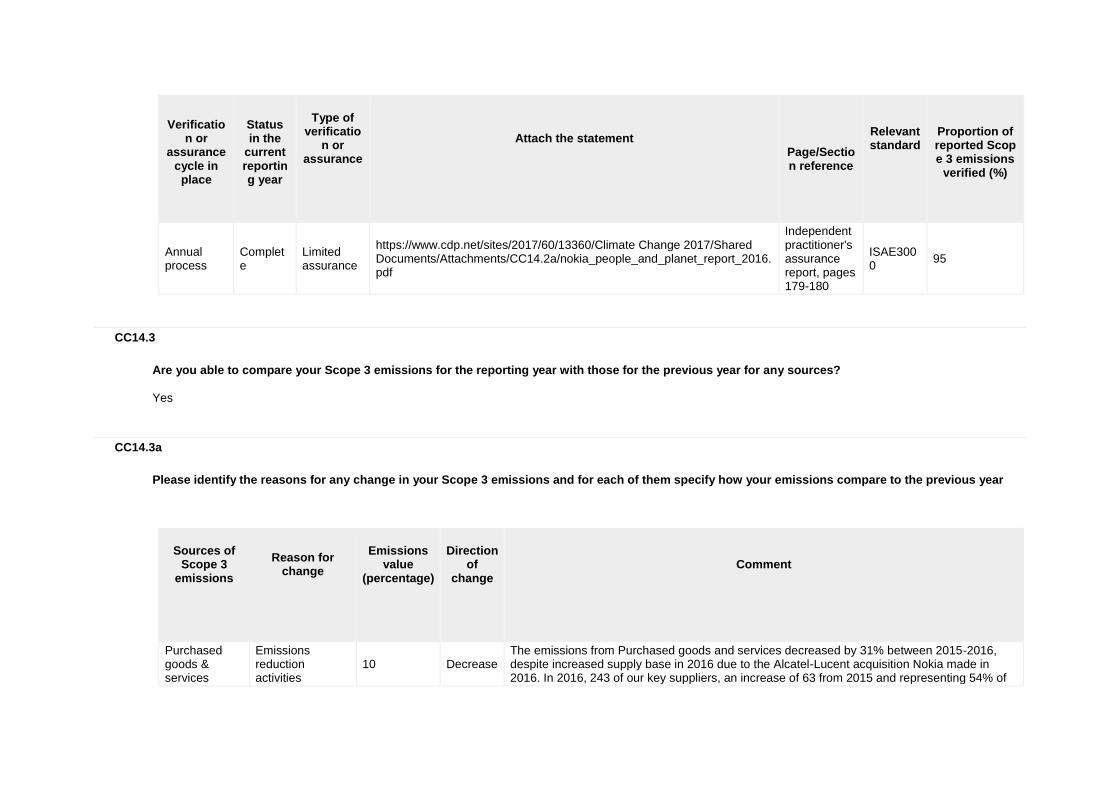
Verificatio
n or assurance
cycle in place
Status in the
current reporting year
Type of
verification or
assurance
Attach the statement
Page/Section reference
Relevant standard
Proportion of reported Scope 3 emissions
verified (%)
Annual process
Complete
Limited assurance
https://www.cdp.net/sites/2017/60/13360/Climate Change 2017/Shared Documents/Attachments/CC14.2a/nokia_people_and_planet_report_2016.pdf
Independent practitioner's assurance report, pages 179-180
ISAE3000
95
CC14.3
Are you able to compare your Scope 3 emissions for the reporting year with those for the previous year for any sources?
Yes
CC14.3a
Please identify the reasons for any change in your Scope 3 emissions and for each of them specify how your emissions compare to the previous year
Sources of
Scope 3 emissions
Reason for
change
Emissions
value (percentage)
Direction
of change
Comment
Purchased goods & services
Emissions reduction activities
10 Decrease The emissions from Purchased goods and services decreased by 31% between 2015-2016, despite increased supply base in 2016 due to the Alcatel-Lucent acquisition Nokia made in 2016. In 2016, 243 of our key suppliers, an increase of 63 from 2015 and representing 54% of

Sources of
Scope 3 emissions
Reason for
change
Emissions
value (percentage)
Direction
of change
Comment
our total procurement spend, responded to the CDPs request to disclose their climate performance information. Of these 192 disclosed their carbon emissions (an increase of 52 from 2015) and 127 also provided emission reduction targets (an increase of 35 from 2015). The total saving from these carbon reduction initiatives was 10 million metric tons of CO2 equivalents and around USD 938 million during the course of the year. Not all these savings were allocated for Nokia, but also to other customers of these suppliers. Also, there are uncertainties in the reporting of this Category 1 of Scope 3, so we are conservative and estimate 10% of the emission savings to be a result of suppliers' emission reduction activities, partly initiated thanks to Nokia's training sessions, joint environmental improvement programs and Nokia's supplier requirements.
Purchased goods & services
Unidentified 21 Decrease
The emissions from Purchased goods and services decreased by 31% between 2015-2016, despite increased supply base in 2016 due to the Alcatel-Lucent acquisition Nokia made in 2016. There are uncertainties in the reporting of this Category 1 of Scope 3, so we are conservative and estimate 10% of the emission savings to be a result of suppliers' emission reduction activities and allocate the rest of reduction as "unidentified".
Employee commuting
Other: Reduced amount of employees
3 Decrease
2015-2016 emissions are reported based on a worldwide survey conducted at former Alcatel-Lucent in December 2015. Since no employee commuting survey was conducted in 2016 for the combined Nokia company, the results of the previous survey were prorated, based on 2016 Nokia headcount per country. Due to the prorating method, reduction relates to the reduced amount of employees and change of amount of employees between different countries, as counties are having different carbon intensities based on the 2015 survey.
Business travel
Change in physical operating conditions
1 Increase
In 2016, with the expected intensity of ongoing integration, our emissions related to business travel, based on flown air miles, were around 113 300 metric tons of CO2 equivalents emissions, meaning a 1% increase compared to the 2015 level, when the former Alcatel-Lucent is also included in the comparison. During 2016 we have worked hard to discourage the need for business travel and encourage the use of virtual meetings using new video conferencing facilities and virtual collaboration software. This also allows employees to work from home more frequently.
CC14.4
Do you engage with any of the elements of your value chain on GHG emissions and climate change strategies? (Tick all that apply)
Yes, our suppliers Yes, our customers Yes, other partners in the value chain
CC14.4a
Please give details of methods of engagement, your strategy for prioritizing engagements and measures of success
1. Suppliers i) Method of engagement We engage our top300 suppliers asking them to join CDP program. We have also engaged the suppliers to the CDP Action Exchange Program. In 2016, we invited all our most carbon-intense suppliers to participate in Nokia's annual Climate Change Webinars, where we shared our best practices on emissions reductions achieved in our facility management, research and development, operations, logistics, travel, and fleet activities. We also address Energy Efficiency and Emissions reduction topics at our Supplier face to face Corporate Responsibility workshops that we conduct in high-risk countries. ii) Strategy for prioritization We prioritize suppliers based on spend and carbon impact. iiii) Measure of success We track the success via several CDP program metrics. As a result of the awareness and engagement campaign every year, the amount of the suppliers who report their emissions through CDP to us is increasing year on year (from 66 in 2012 to 243 in 2016). Via CDP we track also e.g. how many suppliers set carbon reduction targets and how much savings are achieved. In 2016, the total saving from our suppliers’ carbon reduction initiatives was 10 million metric tons of CO2e and around $938 million during the course of the year. 2. Customers i) Method of engagement We have annual corporate responsibility reviews with our customers to better understand their needs. In 2016, we continued to engage in projects where we analyzed the energy efficiency of our key customers’ networks, made recommendations for improvements such as modernization, and introducing more energy efficient solutions. We also participate in joint event demonstrations with customers. We provide information on energy and carbon efficient product offering via our regular customer relationship management and marketing channels. ii) Strategy for prioritization We set priorities together with our customers. In 2016 key focus areas included responsible sourcing and procurement, and energy efficiency of telecommunications networks. At least 80% of the base stations' life-cycle CO2 emissions are caused by the use-time energy consumption and hence we pay a lot of attention to the use-time energy efficiency iiii) Measure of success We measured success e.g. by measuring amount of demonstration requests our Zero emission base station site got among customers and other stakeholders in Mobile World Congress.We modernized 27% more customer base station sites than in 2015, bringing average energy savings of 43% for our customers. Over 120 customers have at least one Zero Emissions product from Nokia. 3. Other partners in the value chain

i) Method of engagement An example of the climate work we do with other partners in the value chain, is membership in Global e-Sustainability Initiative (GeSI), which brings together ICT sector, instead of individual work done in parallel. We are also members of the Climate Leadership Council, Digital Europe & the European Round Table of Industrialists (ERT) forum and we contributed to the UN Sustainable Development Goals (SDGs) adopted by the United Nations General Assembly in 2015. Our effort will focus on the goals where we can make most impact, including the SDG number 13, taking urgent action to combat climate change and its impact. Related to standardization, we work with the ITU-D and in fact in 2016 lead the ITU-D study on “ICT and Climate Change”. Section three of this report on “Climate change mitigation” addresses the policies and technological efforts from ICT organizations that contribute by reducing their own GHG emissions. The report then recalls an estimation of the potential GHG reduction that can result from enabling the following economic sectors with ICT: mobility and logistics, manufacturing, food, buildings, energy, work and business, health, and learning. In this respect, particular attention is paid to urban areas where a growing proportion of the world population lives, and the benefits of innovative ICTs applied to “smart cities” are summarized and illustrated with references to some best practices. ii) Strategy for prioritization As at least 80% of the environmental impact of our business comes during the use phase of base stations, we are especially eager to engage with partners who are having the same challenges. On the other hand, we are engaging with partners with whom we are able to expand the positive impacts ICT technology is providing for environmental protection. iiii) Measure of success Publications on common studies and reports (for example GeSI’s Smarter2030) are helping not only Nokia but wider value chain members to understand and prioritize climate actions.
CC14.4b
To give a sense of scale of this engagement, please give the number of suppliers with whom you are engaging and the proportion of your total spend that they represent
Type of
engagement
Number of suppliers
% of total spend (direct and indirect)
Impact of engagement
Active engagement
243 54%
In 2016, 243 of our key suppliers, an increase of 63 from 2015 and representing 54% of our total procurement spend, responded to the CDPs request to disclose their climate performance information. Of these 192 disclosed their carbon emissions (an increase of 52 from 2015) and 127 also provided emission reduction targets (an increase of 35 from 2015). The total saving from these carbon reduction initiatives was 10 million metric tons of CO2 equivalents and around USD 938 million during the course of the year.
CC14.4c
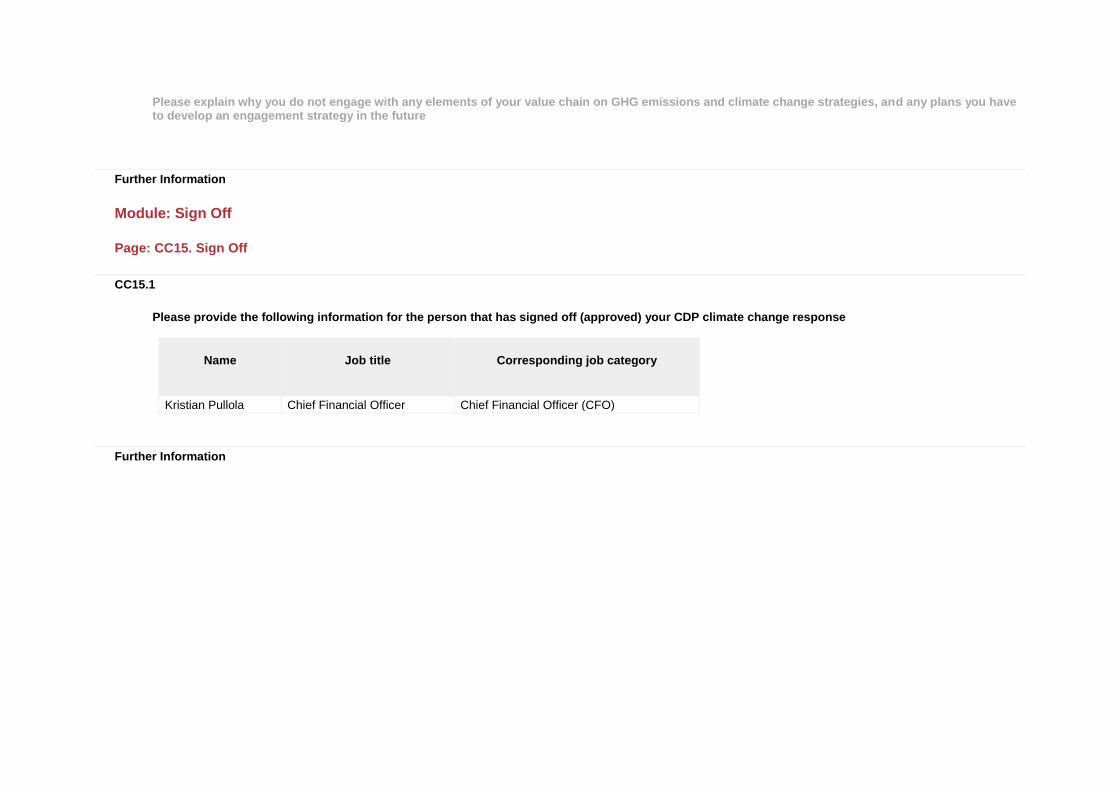
Please explain why you do not engage with any elements of your value chain on GHG emissions and climate change strategies, and any plans you have to develop an engagement strategy in the future
Further Information
Module: Sign Off
Page: CC15. Sign Off
CC15.1
Please provide the following information for the person that has signed off (approved) your CDP climate change response
Name
Job title
Corresponding job category
Kristian Pullola Chief Financial Officer Chief Financial Officer (CFO)
Further Information