cdl containers & plastic shopping bags in the … 1: cdl container & thin plastic shopping...
TRANSCRIPT

Strategies, Marketing and Social Research
Head Office: 259 Glen Osmond Rd, Frewville SA 5063
[email protected] www.mcgregor.com.au
Tel: 08 8433 0200 Fax: 08 8338 2360
CDL Containers & Plastic Shopping
Bags in the Litter Stream
Prepared for: John Phillips
On behalf of: KESAB
Project No: 10605
Date: July 2016
Disclaimer Statement The material in this report is assembled in good faith and is based on the perceptions of respondents who may have been surveyed. It is made available on the understanding that any views, suggestions or recommendations expressed in this report does not constitute professional advice, and McGregor Tan Research accepts no liability for its use. T:\! FINAL REPORTS 2016\10605 KESAB CDL Containers & Plastic Bags in the Litter Stream Report - July 2016.docx 2 of 20
CONTENTS
Section 1 Introduction ........................................................................................... 1
Background ............................................................................................................. 2
Methodology ............................................................................................................ 2
Section 2 CDL Containers & Thin Plastic Shopping Bags Analysis ................ 3
2.1 CDL Item Comparison ................................................................................. 4
2.2 Thin Plastic Shopping Bag Comparison ...................................................... 6
Appendix 1: CDL Container & Thin Plastic Shopping Bag Tables ........................................... 8

- 1 -
Section 1
Introduction

- 2 -
This document has been prepared to report on the percentage of beverage items covered under
the South Australian Container Deposit Legislation (CDL) and the percentage of thin plastic
shopping bags (less than 35 microns) counted in the KAB National Litter Index for 2008/09,
2009/10 and 2010/11, 2011/12, 2012/13, 2013/14, 2014/15 and 2015/16.
Background
1.1 KESAB commenced regular litter monitoring in 1998 and in 2005 KAB,
utilising the same litter count methodology used by KESAB and through the
support of the Australian Government, recommenced its bi-annual litter count
and the annual National Litter Index (NLI).
1.2 The NLI counts are conducted in November and May each year, across the
Australian Capital Territory, New South Wales, the Northern Territory,
Queensland, South Australia, Tasmania, Victoria and Western Australia. The
November and May data is collated and used to report annually on the
findings about litter in Australia.
1.3 In 1975 the South Australian Government introduced the Container Deposit
Legislation (CDL) that imposed a deposit on a range of beverage containers.
The deposit is included in the retail price and refunded when the container is
returned to a collection point.
1.4 In January 2003, the CDL was extended to cover most beverages under 1
litre, such as juice cartons, fruit boxes, flavoured milk cartons, etc.
1.5 In September 2008 the deposit on drink containers covered by the CDL was
increased from 5 cents to 10 cents.
1.6 In May 2009 the South Australian Government banned thin plastic shopping
bags less than 35 microns.
Methodology
1.7 Items included in the South Australian Container Deposit Legislation (CDL)
have been used for the purpose of comparing the percentage of these items
in the litter stream among different states and territories. All data has been
drawn from the 2008/09, 2009/10, 2010/11, 2011/12, 2012/13, 2013/14,
2014/15 and 2015/16 KAB National Litter Index recorded figures.
1.8 Similarly, only the data drawn from the 2008/09, 2009/10, 2010/11, 2011/12,
2012/13, 2013/14, 2014/15 and 2015/16 KAB National Litter Counts were
used in calculating the percentage of thin plastic shopping bags in the litter
stream among different states and territories.

- 3 -
Section 2
CDL Containers & Thin Plastic
Shopping Bags Analysis

- 4 -
2.1 CDL Item Comparison
The number of beverage items covered under the South Australian Container
Deposit Legislation (CDL) counted in the litter stream were compared to the overall
number of items counted in the litter stream in NSW, NT, QLD, SA, VIC and WA to
derive the percentage of CDL items in the litter stream for each of those states and
territories for 2008/09, 2009/10, 2010/11, 2011/12, 2012/13, 2013/14, 2014/15 and
2015/16.
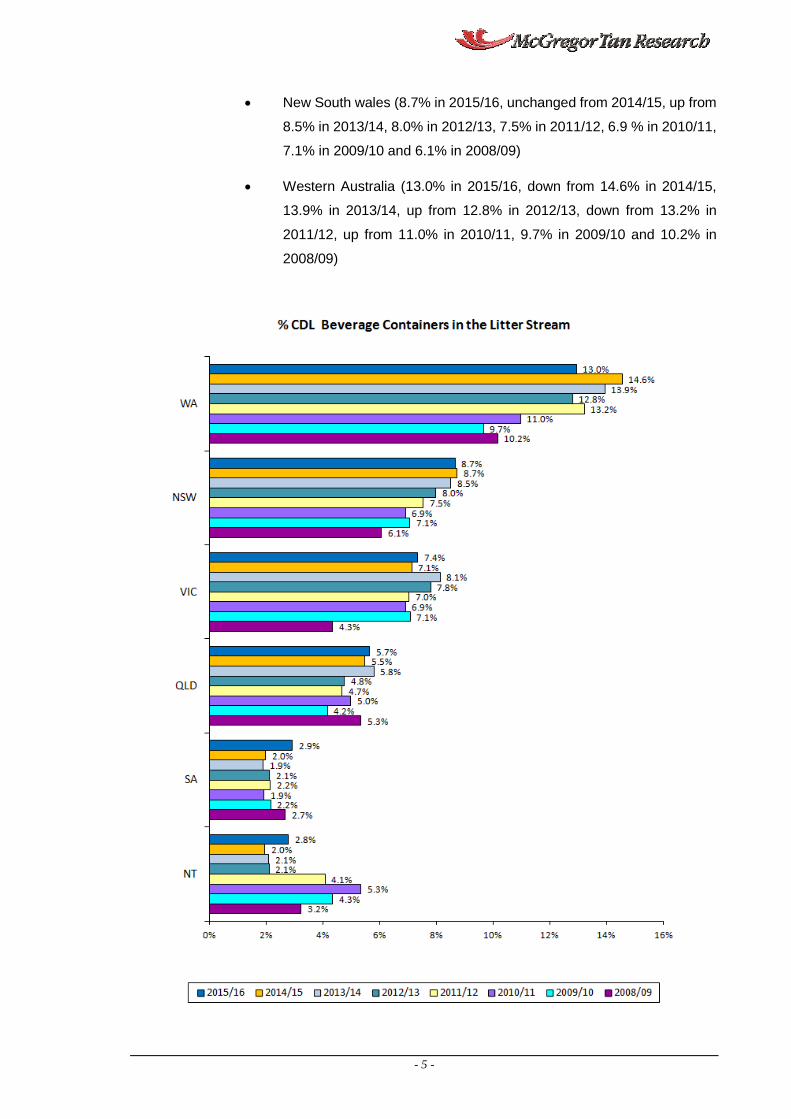
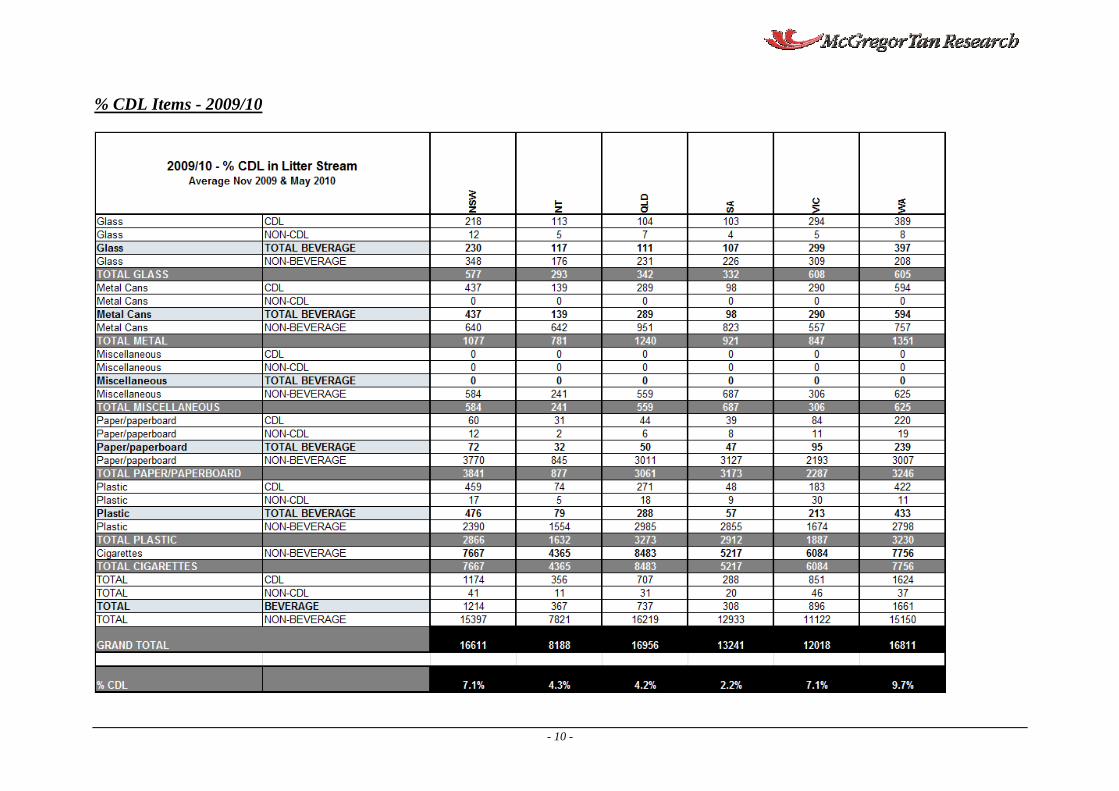
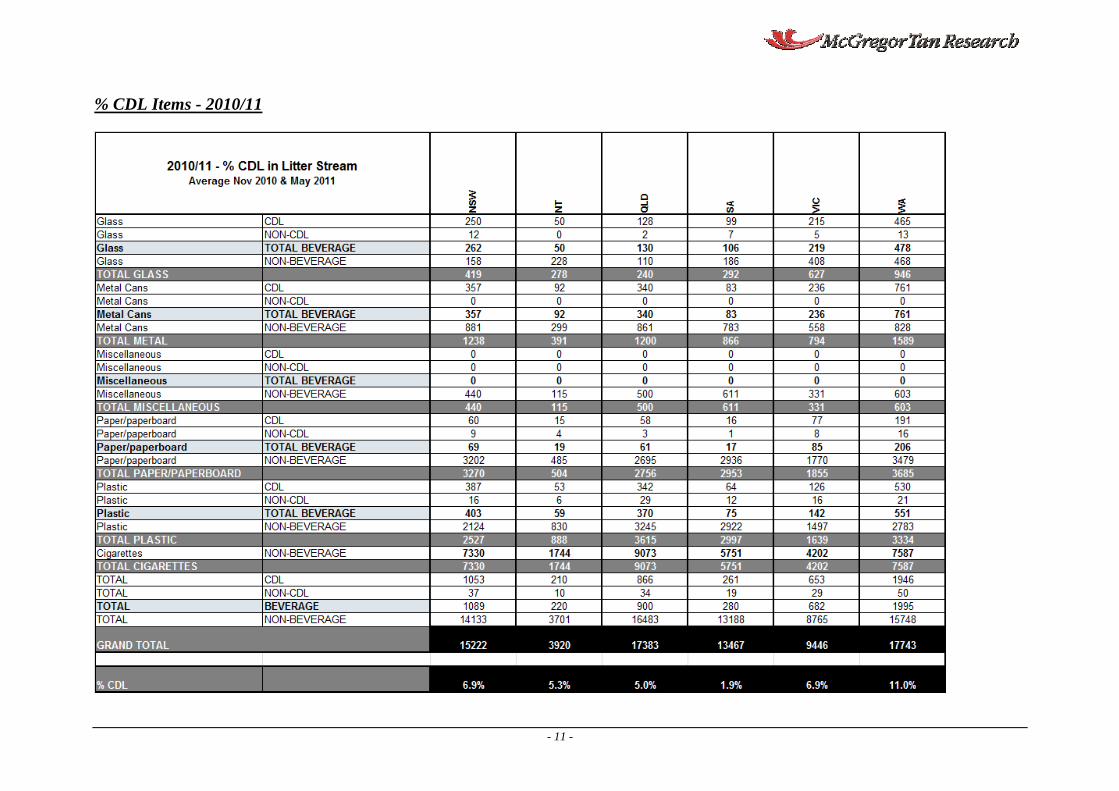
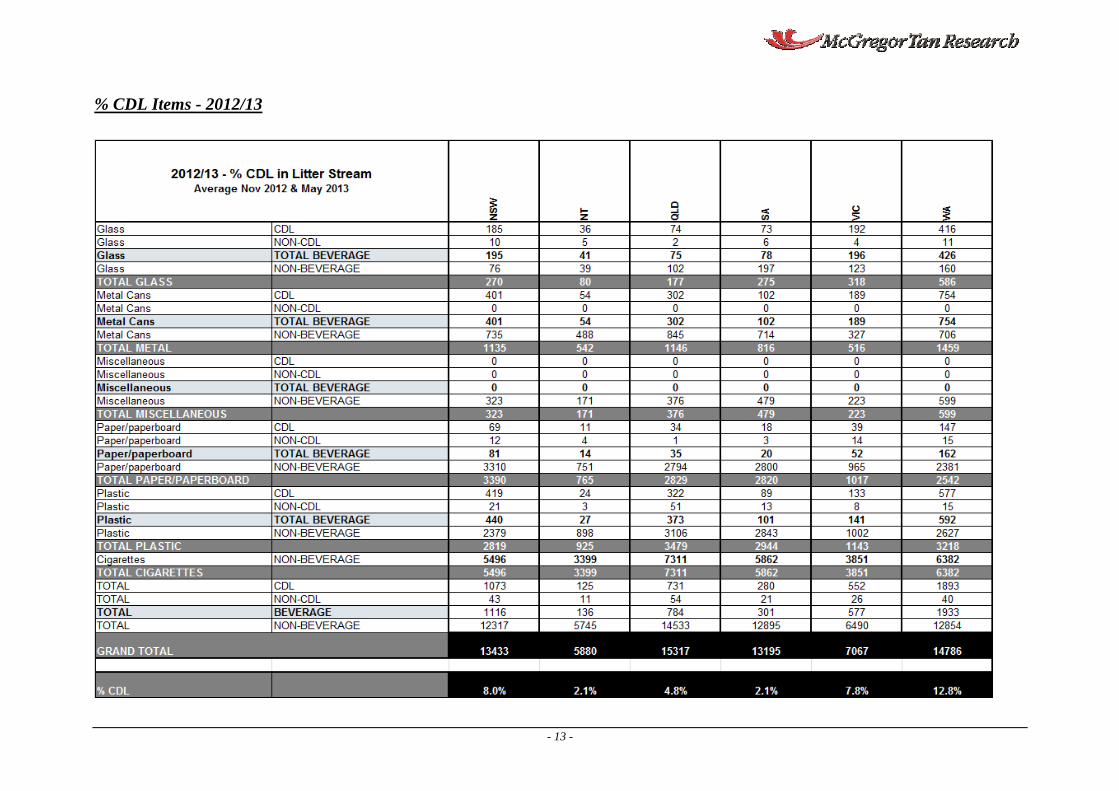
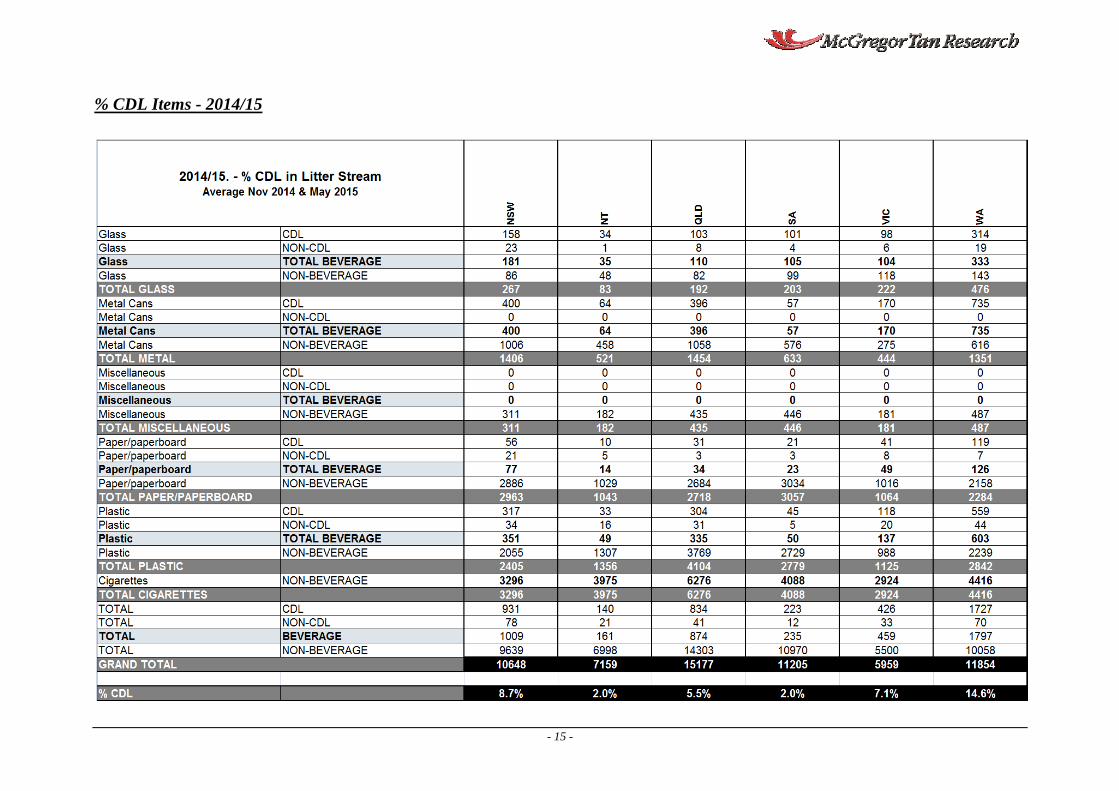
The percentage of CDL items in the litter stream for NSW, NT, QLD, SA, VIC and
WA is represented in the following table:
State/ Territory 2008/09 2009/10 2010/11 2011/12 2012/13 2013/14 2014/15 2015/16
NSW 6.1% 7.1% 6.9% 7.5% 8.0% 8.5% 8.7% 8.7%
NT 3.2% 4.3% 5.3% 4.1% 2.1% 2.1% 2.0% 2.8%
QLD 5.3% 4.2% 5.0% 4.7% 4.8% 5.8% 5.5% 5.7%
SA 2.7% 2.2% 1.9% 2.2% 2.1% 1.9% 2.0% 2.9%
VIC 4.3% 7.1% 6.9% 7.0% 7.8% 8.1% 7.1% 7.4%
WA 10.2% 9.7% 11.0% 13.2% 12.8% 13.9% 14.6% 13.0%
Analysis of the results reveals that the Northern Territory had the lowest percentage
of CDL items in their litter stream in 2015/16 followed by SA, QLD, VIC, NSW and
WA. The percentage of CDL litter items in the litter stream for the states and
territories analysed over the last 6 years were:
Northern Territory (2.8% in 2015/16, up from 2.0% in 2014/15, 2.1% in
2013/14 and 2012/13, down from 4.1% in 2011/12, 5.3% in 2010/11,
4.3% in 2009/10 and 3.2% in 2008/09)
South Australia (2.9% in 2015/16, up from 2.0% in 2014/15, 1.9% in
2013/14, 2.1% in 2012/13, 2.2% in 2011/12, 1.9% in 2010/11, 2.2% in
2009/10 and 2.7% in 2008/09)
Queensland (5.7% in 2015/16, up from 5.5% in 2014/15, down from
5.8% in 2013/14, up from 4.8% in 2012/13, 4.7% in 2011/12, 5.0% in
2010/11, 4.2% in 2009/10 and 5.3% in 2008/09)
Victoria (7.4% in 2015/16, up from 7.1% in 2014/15, down from 8.1%
in 2013/14, 7.8% in 2012/13, up from 7.0% in 2011/12, 6.9% in
2010/11, 7.1% in 2009/10 and 4.3% in 2008/09)
- 5 -
New South wales (8.7% in 2015/16, unchanged from 2014/15, up from
8.5% in 2013/14, 8.0% in 2012/13, 7.5% in 2011/12, 6.9 % in 2010/11,
7.1% in 2009/10 and 6.1% in 2008/09)
Western Australia (13.0% in 2015/16, down from 14.6% in 2014/15,
13.9% in 2013/14, up from 12.8% in 2012/13, down from 13.2% in
2011/12, up from 11.0% in 2010/11, 9.7% in 2009/10 and 10.2% in
2008/09)

- 6 -
2.2 Thin Plastic Shopping Bag Comparison
The number of thin plastic shopping bags (less than 35 microns) which are banned
in South Australia, that were counted in the litter stream were compared to the
overall number of items counted in the litter stream in NSW, NT, QLD, SA, VIC and
WA to derive the percentage of thin plastic shopping bags in the litter stream for
each of those states and territories for 2008/09, 2009/10, 2010/11, 2011/12,
2012/13, 2013/14, 2014/15 and 2015/16.
The percentage of thin plastic shopping bags in the litter stream for NSW, NT, QLD,
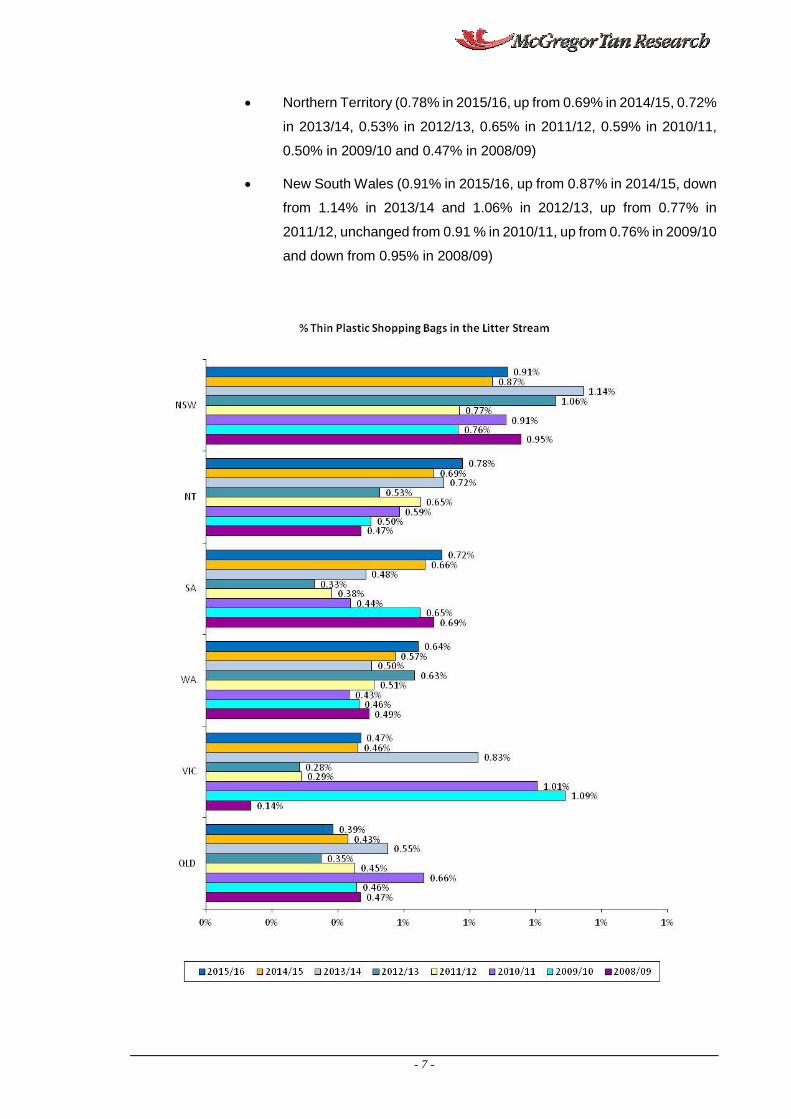
SA, VIC and WA is represented in the following table:
State / Territory 2008/09 2009/10 2010/11 2011/12 2012/13 2013/14 2014/15 2015/16
NSW 0.95% 0.76% 0.91% 0.77% 1.06% 1.14% 0.87% 0.91%
NT 0.47% 0.50% 0.59% 0.65% 0.53% 0.72% 0.69% 0.78%
QLD 0.47% 0.46% 0.66% 0.45% 0.35% 0.55% 0.43% 0.39%
SA 0.69% 0.65% 0.44% 0.38% 0.33% 0.48% 0.66% 0.72%
VIC 0.14% 1.09% 1.01% 0.29% 0.28% 0.83% 0.46% 0.47%
WA 0.49% 0.46% 0.43% 0.51% 0.63% 0.50% 0.57% 0.64%
Analysis of the results reveal that Queensland had the lowest percentage of thin
plastic shopping bags in their litter stream in 2015/16 followed by VIC, WA, SA, NT
and NSW. The percentage of thin plastic shopping bags in the litter stream for the
states and territories analysed over the last 6 years were:
Queensland (0.39% in 2015/16, down from 0.43% in 2014/15, 0.55%
in 2013/14, up from 0.35% in 2012/13, down from 0.45% in 2011/12,
0.66% in 2010/11, 0.46% in 2009/10 and 0.47% in 2008/09)
Victoria (0.47% in 2015/16, up from 0.46% in 2014/15, down from
0.83% in 2013/14, up from 0.28% in 2012/13 and 0.29% in 2011/12,
down from 1.01% in 2010/11 and 1.09% in 2009/10, up from 0.14% in
2008/09)
Western Australia (0.64% in 2015/16, up from 0.44% in 2014/15, 0.50%
in 2013/14, 0.63% in 2012/13, 0.51% in 2011/12, 0.43% in 2010/11,
0.46% in 2009/10 and 0.49% in 2008/09)
South Australia (0.72% in 2015/16, up from 0.66% in 2014/15, 0.48%
in 2013/14, 0.33% in 2012/13, 0.38% in 2011/12, 0.44% in 2010/11,
0.65% in 2009/10 and 0.69% in 2008/09)
- 7 -
Northern Territory (0.78% in 2015/16, up from 0.69% in 2014/15, 0.72%
in 2013/14, 0.53% in 2012/13, 0.65% in 2011/12, 0.59% in 2010/11,
0.50% in 2009/10 and 0.47% in 2008/09)
New South Wales (0.91% in 2015/16, up from 0.87% in 2014/15, down
from 1.14% in 2013/14 and 1.06% in 2012/13, up from 0.77% in
2011/12, unchanged from 0.91 % in 2010/11, up from 0.76% in 2009/10
and down from 0.95% in 2008/09)

- 8 -
Appendix 1:
CDL Container & Thin Plastic
Shopping Bag Tables
- 9 -
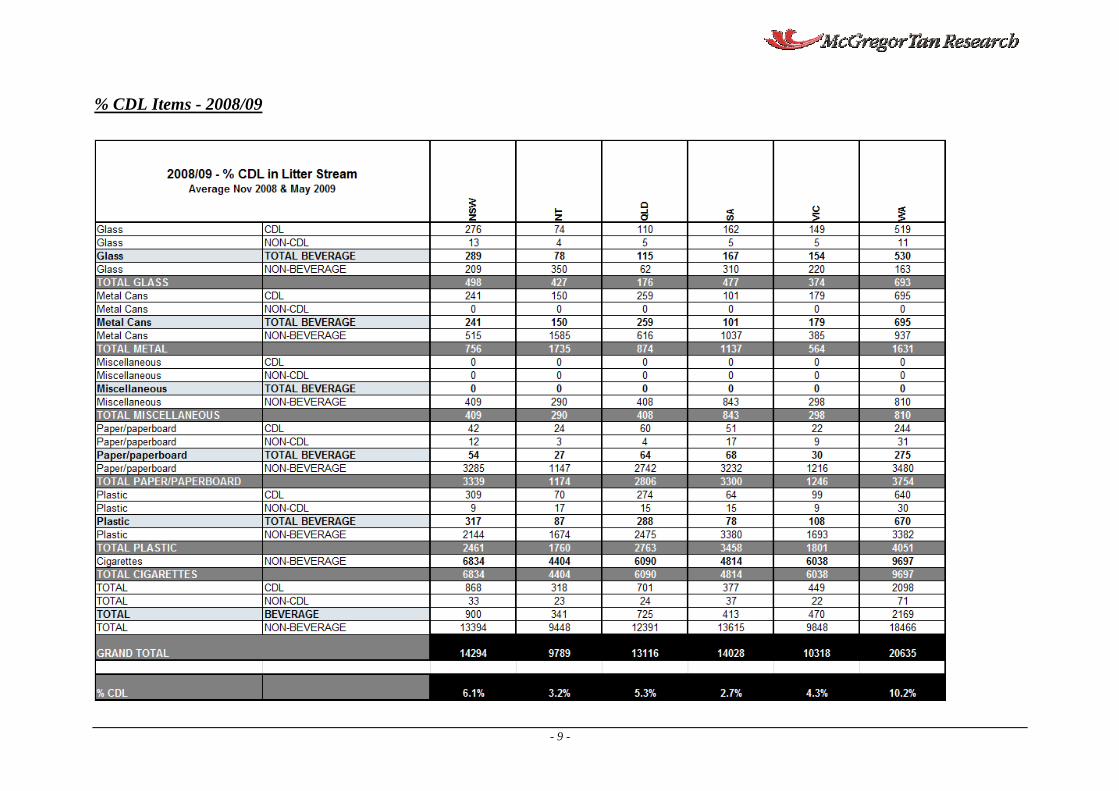
% CDL Items - 2008/09
- 10 -
% CDL Items - 2009/10
- 11 -
% CDL Items - 2010/11

- 12 -
% CDL Items - 2011/12
- 13 -
% CDL Items - 2012/13

- 14 -
% CDL Items - 2013/14
- 15 -
% CDL Items - 2014/15
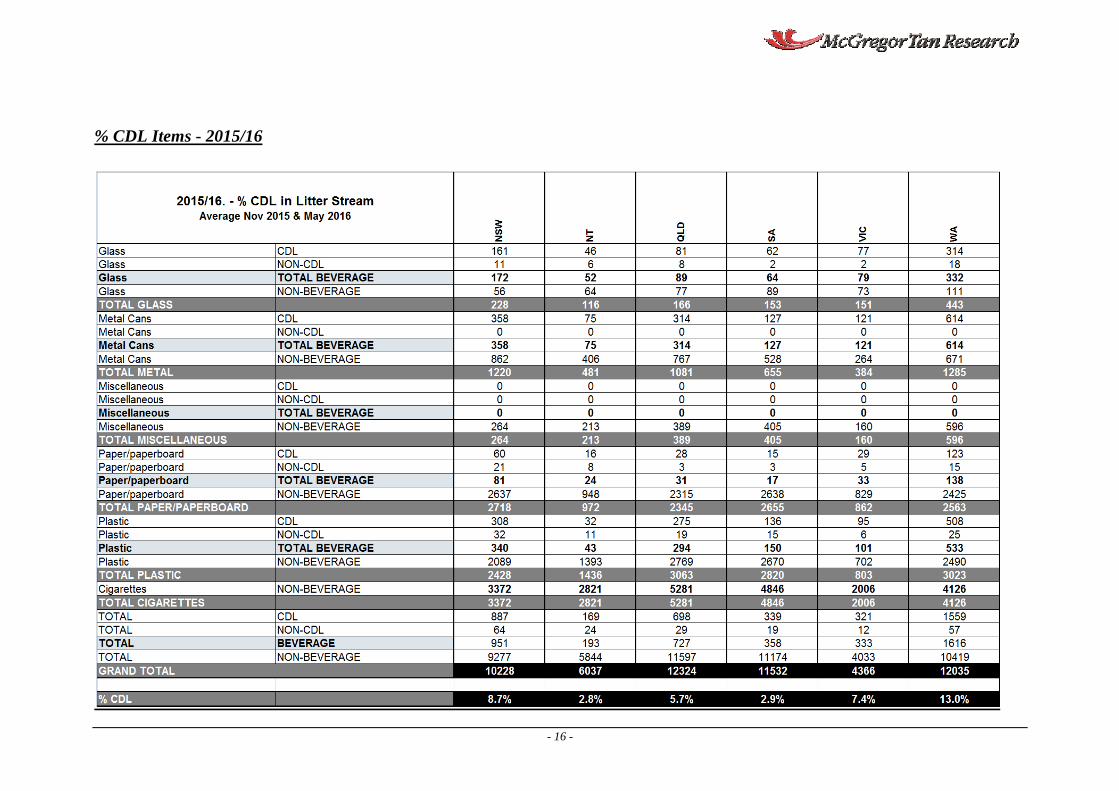
- 16 -
% CDL Items - 2015/16

- 17 -
Thin Plastic Shopping Bags – 2008/09, 2009/10, 2010/11, 2011/12, 2012/13, 2013/14, 2014/15 & 2015/16
2008/09 NSW NT QLD SA VIC WA
thin plastic shopping bags 137 46 62 97 14 102
total items 14294 9789 13116 14028 10318 20635
% litter 0.95% 0.47% 0.47% 0.69% 0.14% 0.49%
2009/10 NSW NT QLD SA VIC WA
thin plastic shopping bags 127 41 78 86 131 78
total items 16611 8188 16956 13241 12018 16811
% litter 0.76% 0.50% 0.46% 0.65% 1.09% 0.46%
2010/11 NSW NT QLD SA VIC WA
thin plastic shopping bags 139 23 115 59 95 77
total items 15222 3920 17383 13467 9446 17743
% litter 0.91% 0.59% 0.66% 0.44% 1.01% 0.43%
2011/12 NSW NT QLD SA VIC WA
thin plastic shopping bags 100 37 71 54 25 75
total items 12940 5684 15696 14028 8664 14612
% litter 0.77% 0.65% 0.45% 0.38% 0.29% 0.51%

- 18 -