cdc public health grand rounds 16, 2014 · a turning point for impact . ... pqrs gpro: physician...
TRANSCRIPT
CDC PUBLIC HEALTH GRAND ROUNDS
September 16, 2014
Preventing A Million Heart Attacks and Strokes: A Turning Point for Impact
Accessible Version: https://youtu.be/Dj4XNpMvKME

2 2
Million Hearts®: Where We Are and Where We Need to Go
Janet Wright, MD, FACC Executive Director, Million Hearts®
Division for Heart Disease and Stroke Prevention, CDC
Center for Medicare and Medicaid Innovation
3 3
Heart Disease and Stroke:
Deadly, Costly, Unequal
More than 1.5 million heart attacks and strokes
each year
Cause of 1 of every 3 deaths
800,000 cardiovascular disease deaths
$315.4 billion in healthcare costs and lost productivity
Leading contributor to racial disparities in life
expectancy

4 4
…and Preventable
Each year,
200,000
preventable
deaths from
heart disease
and stroke
occur in people
under 75 years
old

5 5
Million Hearts®
US Department of Health and Human Services
initiative, co-led by
Centers for Disease Control and Prevention (CDC)
Centers for Medicare & Medicaid Services (CMS)
Partners across federal and state agencies and
private organizations
Goal: Prevent 1 million heart attacks
and strokes by 2017

6 6
Key Components of Million Hearts®
Excelling in the ABCS Optimizing care
Focus on the ABCS
Health information technology
Innovations in care delivery
TRANS
FAT
ABCS: Aspirin when appropriate , Blood pressure control, Cholesterol management, Smoking cessation
Keeping Us Healthy Changing the environment
Health
Disparities

7 7
Preventing a Million: Targets for Our Environment
Intervention
2009 - 2010
Pre-Initiative
Estimate
2017 Target
Smoking prevalence 26% 10% reduction (~24%)
Sodium reduction 3580 mg/day 20% reduction (~2900 mg/day)
Trans fat reduction 0.6% of calories 100% reduction (0% of calories)
National Survey on Drug Use and Health 2009-2010
National Health and Nutrition Examination Survey 2009-2010

8 8
Preventing a Million: Targets for Optimizing Care
Intervention
2009 - 2010
Pre-Initiative
Estimate
2017
Population-
wide Target
2017
Clinical
Target
Aspirin when appropriate 54% 65% 70%
Blood pressure control 53% 65% 70%
Cholesterol management 33% 65% 70%
Smoking cessation 22% 65% 70%
National Ambulatory Medical Care Survey, National Health and Nutrition Examination Survey

9
Million Hearts® Lessons Learned:
Getting to Goal
Challenges
Perception that heart
attack and stroke are
inevitable
Competing priorities line
added here
Incomplete adoption of
evidence-based
approaches
Isolated efforts
Solutions
Clear, consistent,
compelling action steps;
real-life high-performers
Making cardiovascular
health a national priority
Practical, ready-to-use tools
and resources; value-based
models of care
Collaboration is key

10 10
Million Hearts® Progress
Goal of Million Hearts® resonates
1.3 million hits to website, 48,000 e-newsletter subscribers
Strong teamwork across HHS and beyond
Measure alignment (comparing apples to apples)
Data-sharing and analysis
Tool development and sharing
Successes in the field
Champions are teaching what works
Programs are aligning for reach and impact

11 11
CDC
CMS
Million Hearts® Progress
Public Health-Healthcare Collaboration

12 12
Monitoring Progress
Short-term Outcomes
Performance Indicators Data Source 2011 2012 2013
Outpatient EHR
adoption NAMCS EHR supplement 34% 40% 48%
Clinical Quality Measure
Reporting PQRS GPRO (ABCS) n=46 n=58 n=147*
Sodium procurement
policies
Chronic disease state policy
tracking system 2 5 6
100% smoke-free
coverage in US
Americans for non-smoker’s
rights; CDC 48.1% 48.9% 49.1%
E-update subscribers Gov’t subscription service 34,071 38,344 43,726
Results as of August 2014 except *PQRS GPRO 2013 data preliminary, 09/16/14
EHR: Electronic health record NAMCS: National Ambulatory Medical Care Survey
PQRS GPRO: Physician Quality Reporting System Group Practice Reporting Option
ABCS: Aspirin when appropriate , Blood pressure control, Cholesterol management, Smoking cessation

13 13
Monitoring Progress
Intermediate Outcomes
Performance Indicators Data Source 2011 2012 2013
Aspirin use NAMCS 54% Summer 2014 UNK
PQRS GPRO N/A 83% 78%*
Blood pressure control NHANES 53% 52% 2015
PQRS GPRO 68% 69% 62%*
Cholesterol
management
NHANES 33% 43% 2015
PQRS GPRO 53% 56% 54%*
Smoking assessment
and treatment
NAMCS 22% Summer 2014 UNK
PQRS GPRO N/A 87% 83%*
Current smoking
prevalence
NSDUH (combustible tobacco)
26% 25% Winter 2014
NHIS (cigarettes) 19% 18% 17.5%
Sodium intake (mg/day) NHANES 3594 Fall 2014 2016
Results as of August 2014 except *PQRS GPRO 2013 data preliminary, 09/16/14. NAMCS: National Ambulatory Medical Care Survey. PQRS GPRO: Physician Quality Reporting System, Group Practice Reporting Option. UNK: Unknown.
NHANES: National Health and Nutrition Examination Survey. N/A: Not available.
NHIS: National Health Interview Survey. NSDUH: National Survey on Drug Use and Health.

14 14
Monitoring Progress
Long-term Outcomes
Performance Indicators Data Source
Medicare Fee for Service - AMI and stroke hospitalization rates CMS Dashboard (per 1,000 beneficiaries)
Results as of August 2014. CMS: Centers for Medicare & Medicaid Services.
Rates are among those beneficiaries aged ≥65 years with Medicare Part A and B coverage and were adjusted to appropriately represent the
number of full-time equivalent beneficiaries enrolled during the period and the 2010 Medicare population age distribution.
0
2
4
6
8
10
2007 2008 2009 2010 2011 2012 2013
Ra
te p
er
1,0
00
be
ne
fic
iari
es
AMI
All acutestroke
Acutehemorrhagicstroke
Acuteischemicstroke
Acute
myocardial
infarction (AMI)
15 15
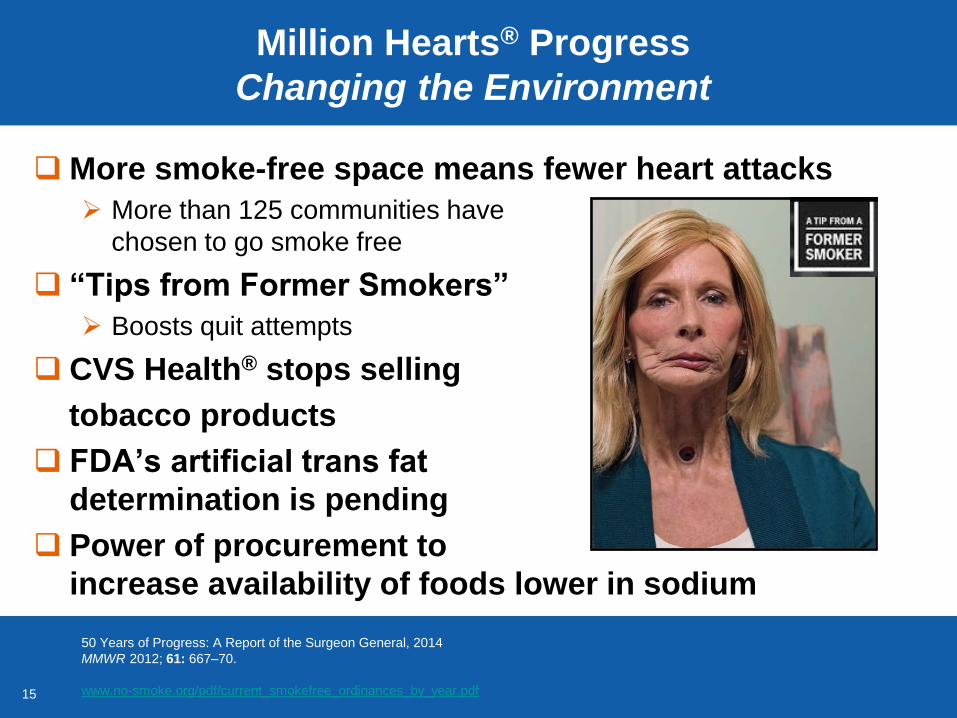
Million Hearts® Progress
Changing the Environment
More smoke-free space means fewer heart attacks
More than 125 communities have
chosen to go smoke free
“Tips from Former Smokers”
Boosts quit attempts
CVS Health® stops selling
tobacco products
FDA’s artificial trans fat
determination is pending
Power of procurement to
increase availability of foods lower in sodium
50 Years of Progress: A Report of the Surgeon General, 2014
MMWR 2012; 61: 667–70.
www.no-smoke.org/pdf/current_smokefree_ordinances_by_year.pdf

16 16
Million Hearts® Progress
Optimizing Care – Performance on ABCS
State-level data available from Healthcare Effectiveness Data and Information Set, Uniform Data System, and Physician Quality Reporting System
Clinical Quality Measures Dashboard : millionhearts.hhs.gov/aboutmh/achieving-goals.html
HHS: Department of Health and Human Services
HRSA: Health Resources and Services Administration
“Dashboard” approach shows status of progress in ABCS by geographic area
Red = 0% - 49%; Yellow = 50% - 69%; Green = 70%+; Grey = no data available

17 17
Million Hearts® Progress
Optimizing Care – Performance on ABCS
State-level data available from Healthcare Effectiveness Data and Information Set, Uniform Data System, and
Physician Quality Reporting System
Performance Rate 0-49%
50%-69%
70%+
No data available
Smoking Assessment and Treatment Performance Rates
Reported by HRSA Healthcare Sites
Smoking Assessment and Treatment 2011 Smoking Assessment and Treatment 2013

18 18
Million Hearts® Progress
Addressing Health Disparities
CDC-Association of State and Territorial Health Officials
(ASTHO) Million Hearts® Hypertension Control Project
Ohio improved hypertension control among African American males
From 70% to 73% in 6 months in 11 healthcare sites
CMS’ Quality Improvement Organizations (QIO)
Special projects in 3 states
Reaching over 1.9 million patients
Through 400+ practices and partners
Community and faith-based organizations
NAACP
“100 Congregations” for Million Hearts®
19 19
What Must Happen to Prevent a Million Heart
Attacks and Strokes by 2017?
6.3 million smokers must quit
10 million people must control their hypertension
There must be a 20% reduction in sodium intake
Focus on populations
with the greatest burden
and at greatest risk

20 20
Success in Blood Pressure Control: 2013 Hypertension Champions
Andrew Tremblay, MD Chair, Department of Primary Care
Cheshire Medical Center/Dartmouth-Hitchcock Keene

21
Create a
Culture
of Health
Decrease Medical
Costs
Allow Investment
in Prevention
Improve Health
of All
Residents
Our Three-part Aim

22
Medical Care System
Integration of Public Health System and Medical Care System as a Strategic Concept
Promotion, Prevention,
Preparedness
Public Health System
(Healthy Community)
Protective
Factors and
Resources
Integration
Community Partners and Individuals
A TRANSFORMED HEALTH SYSTEM: PRODUCING HEALTHY
PEOPLE IN HEALTHY COMMUNITIES
Complex
Medical Care
Patient
Centered
Primary Care
Protection of
Vulnerable
People
© Adapted by Y. Goldsberry, R. Fedrizzi, D. Bazos, L. Ayers LaFave and, J. Schlegelmilch from Centers for Disease Control and Prevention
Disease Care

23
Cheshire Medical Center/Dartmouth-Hitchcock Keene
(CMC/DHK)
38,000 active adult patients
Over 125 providers
Several multi-specialty groups
32% with hypertension
Over 12,000 individuals
8.5% Medicaid-eligible
3.7% racial or ethnic minority

24 24
Inconsistencies included
Work flow between primary care teams (medical homes)
and providers
Engagement of specialty care departments
Documentation, especially of second BP readings (dictation
and vital flow sheet) by providers into EMR
Inconsistent BP technique and multiple brands
of equipment
Lack of timely maintenance and calibration of equipment
Barriers to Optimal BP Control Observed at CMC/DHK
EMR: Electronic Medical Record

25 25
Cost barrier of blood pressure rechecks and lack of
consistent, centralized process
Lack of resources to effectively manage registries
No agreement on universal triage and treatment
algorithms
Varied process for flow staff to notify provider of
elevated blood pressure
Lack of engagement and alignment of patients and
the community
Additional Barriers Observed at CMC/DHK

26 26
Setting An Above Average Goal:
81% of Patients with HTN Control
Strategies deployed to improve HTN control Multidisciplinary Quality Improvement Team
Hypertension Champions
Free nurse clinics
Eliminated cost barriers
Implemented protocol based modifications
Electronic Health Record Use
Provider-specific registry coordination
Behavioral health strategies used to engage patients in
convenient locations (e.g., YMCA, work, home)
HTN: Hypertension

27 27
1. Convened a multi-disciplinary team Grounded in our quality improvement framework and
Clinical-Community Integration Model
Won the 2014 CMC/DHK Chairman’s Award
2. Surveyed primary care providers and nursing staff about
their barriers to adequate blood pressure control
3. Calibrated all cuffs and standardized future purchasing
4. Created a core competency for nursing staff in all
departments and community partners YMCA, nursing homes and visiting registered nurses
5. Distributed a single blood pressure brochure
throughout the community
Consistent message and care plan prompt
10 Strategies for Success
QI: Quality improvement
CMC/DHK: Cheshire Medical Center/Dartmouth-Hitchcock Keene

28 28
6. Created a nurse clinic No-cost blood pressure rechecks and triaging
7. Created single evidence-supported triage and treatment
algorithms For primary care, specialty care, and community
8. Provided individual provider registries Monthly data feedback
Increased the number of registry managers
9. Incentivized providers for meeting blood pressure
control targets
10. Widely distributed “Know Your Numbers” wallet cards More than 12,000 issued
10 Strategies for Success, continued

29
Provider-specific Registry Management
Example of
Provider-specific
Registry with
personal
identifiers
removed

30
Tracking Progress Through Provider-specific Registry Management
0
20
40
60
80
100
120
140
160
180
June July Aug Sept
Total # pts withevaluated HTN
Total # Medicare ptswith elevated HTN
Total # Non-Medicarepts with elevatedHTN
Provider
specific
feedback
provided both
as charts and
graphs
HTN: hypertension

31
Medical Care System
Integration Applied to Million Hearts® Initiative
Public Health System
(Healthy Community)
Complex
Medical Care
Patient
Centered
Primary Care
Protective
Factors and
Resources
Protection of
Vulnerable
People
Integration
Community Partners and Individuals
© Adapted by Y. Goldsberry, R. Fedrizzi, D. Bazos, L. Ayers LaFave and, J. Schlegelmilch from Centers for Disease Control and Prevention
CVD: Cardiovascular disease
Promotion, Prevention,
and Preparedness
Optimal CVD
medication compliance
and treatment
Improved blood
pressure control,
cholesterol screening
Know Your Numbers card, healthy eating
and active living
initiatives
Tobacco control
advocacy, HeartSafe
designation
Disease Care
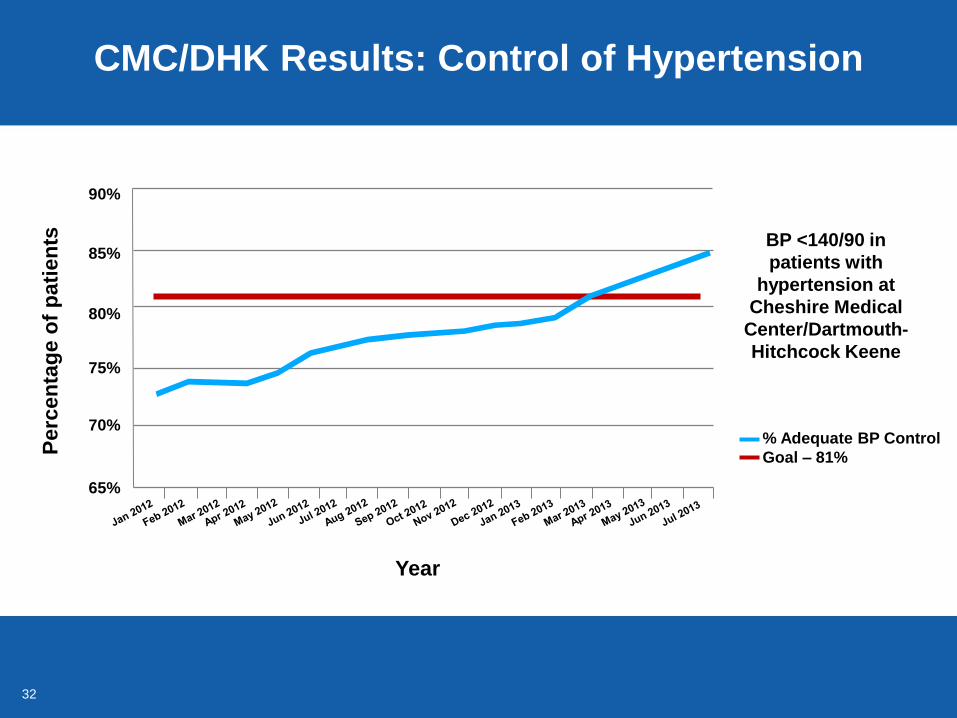
32
CMC/DHK Results: Control of Hypertension
BP <140/90 in
patients with
hypertension at
Cheshire Medical
Center/Dartmouth-
Hitchcock Keene
% Adequate BP Control
Goal – 81%
Year
90%
85%
80%
75%
70%
65%
Perc
en
tag
e o
f p
ati
en
ts

33
The Reward for a Job Well Done
Is the Ability to Do More
New Hampshire awarded an
ASTHO/Million Hearts® Grant
CMC/DHK funded to:
Provide technical assistance to Federally-qualified
Health Centers in 2 counties
Replicate strategies and success in more diverse,
urban settings

34
Examples of New Community Partnerships
YMCA will now offer reduced and no cost memberships
to patients at Manchester Community Health Center
The Organization for Refugee and Immigrant Success will
provide a summer farm stand in the parking lot of Manchester
Community Health Center to increase access to fresh fruits
and vegetables
Strengthened relationship and collaboration with the
Manchester Health Department

35 35
Expanding registry coordination to provide
comprehensive chronic disease management
Explore the use of blood pressure kiosks
“Activity is Good Medicine”
Integrate nutrition counseling and therapy
Pharmacist integration
Spreading improvement
A plan for maintaining gains
More to Do…..

36 36
Tobacco Use Prevention in Massachusetts
Patricia P. Henley, M.Ed. Director, Office of Community Health and Tobacco Use Prevention
Massachusetts Tobacco Cessation and Prevention Program
Massachusetts Department of Public Health

37 37
The State of Massachusetts
Massachusetts is
44th in the nation for land area
13th in the nation for population
1st in the nation for the number of local public health
departments
351 municipalities with limited county government

38
Adult Smoking Prevalence Among Subgroups
in Massachusetts, 2013
16.6%
33.5% 31.8%
28.6% 27.7% 26.5%
23.9%
13.3%
9.1%
6.0%
MA Adults People withpoor mental
health
MassHealth* Disabled LGBT* <$25Khousehold
income
High schoolor less**
Private healthinsurance*
$75K +household
income
Collegedegree**
More Likely to Smoke Less Likely to Smoke
77% of MA smokers
LGBT: Lesbian, Gay, Bisexual and Transgender
Massachusetts Behavioral Risk Factor Surveillance System
*Adults, age 18 - 64
** Adults, age 25+

39 39
Massachusetts Tobacco Control
Program (MTCP) Budget
$35.9
$31.6 $31.6 $31.3
$54.3
$44.3
$33.3
$5.8
$2.5 $3.7 $4.3
$8.3
$12.8 $12.2
$4.5 $4.5 $4.2 $4.2 $4.0 $3.9
$0.0
$10.0
$20.0
$30.0
$40.0
$50.0
$60.0
in m
illi
on
s
MTCP Funding by Fiscal Year FY 1994-FY 2015
New Administration
State Fiscal Crisis

40
Massachusetts Tobacco Prevention Infrastructure
at State and Local Levels
Despite budget cuts, maintained core infrastructure Local programs
Cessation services
Surveillance and evaluation
Legal and policy experts
Communications
Earned media, publicity gained through editorial influence*
Paid media
Youth engagement
Quitline and QuitWorks
All of the above contribute to promoting sustainable policy change
*Earned media may include newspaper, television, radio, and the Internet, and may include formats such as news articles or shows, letters
to the editor, editorials, and polls

41 41
Local Boards of Health Programs
14 Board of Health tobacco control programs Cover 184 municipalities and 65% of
MA population
Provide local enforcement of
tobacco regulations
Retail store monitoring, inspections
and compliance checks
Local policy education and promotion

42
Community Partnership Programs
8 Community Partnership programs Cover entire state in 8 regions
Coordinate communications
Earned media
Local media outreach
Build local partnerships
Promote policy, systems and
environmental strategies

43
The 84 Youth Prevention Program
The 84 chapters
Named after the 84% of youth
who choose not to smoke
75+ chapters statewide
Policy-focused youth groups
Provide youth perspective to
tobacco industry influence in
their communities
School-based chapters promote
social norms and local policy

44
MTCP Prevention Model
Technical Assistance includes
• Model regulation language
• Statewide TA providers
MTCP: Massachusetts Tobacco Control Program
TA: Technical assistance

45 45
Five Priorities for Tobacco Control
in Massachusetts
1. Access to comprehensive cessation benefits for all state residents
Goal: Increase smokers making quit attempts
2. Protect youth from tobacco industry tactics Goal: Reduce number of youth who begin using tobacco
3. Increase the price of tobacco
Goal: Reduce all tobacco use
4. Ensure all smokers receive intervention by healthcare providers Goal: Provide smokers with motivation to quit
5. Protect everyone from secondhand smoke Goal: Protect the health of nonsmokers and smokers
46 46
Priority One: Access to Cessation Benefits
through Quitline Programs
Quitline or The Massachusetts Smokers' Helpline Discusses MA state health benefits for tobacco cessation
with callers
QuitWorks Educates healthcare providers about benefits available to
patients who want or need to quit
Community programs promote cessation-related
benefits and resources, including the Quitline
Key characteristic of callers to the Quitline 44% have Medicaid
quitworks.makesmokinghistory.org
makesmokinghistory.org/1-800-quitnow.html

47 47
Priority Two: Protect Youth from Industry Tactics
by Focusing on Local Policy Initiatives
Reducing tobacco retailer density Prohibiting the sale of tobacco in healthcare institutions
Limiting number of local tobacco retail permits
Pricing No single cigar packaging
Flavoring Restricting flavored tobacco products
Age restriction, including e-cigarettes

48
Protect Youth from Industry Tactics:
Cigar Packaging Regulation
4
33
65
0
10
20
30
40
50
60
70
2012 2013 2014
Regulation prohibits sale of cheap single cigars
Single cigars cannot be sold for under $2.50
By 2014, 31.8% of the population covered by regulation
Nu
mb
er
of
mu
nic
ipa
liti
es
wit
h
cig
ar
pa
ck
ag
ing
re
gu
lati
on
Year
Massachusetts Tobacco Control Program Municipal Policy Tracking System

49
30.2%
35.7%34.4%
30.3%
26.0%
20.9% 20.5%
17.4%16.0%
14.0%
10.7%
0%
10%
20%
30%
40%
1993 1995 1997 1999 2001 2003 2005 2007 2009 2011 2013
Perc
ent
of
Stu
dents
.Current Cigarette Use Among Massachusetts
High School Students, 1993-2013
Current cigarette use: Smoked cigarettes one or more days during the past 30 days.
16% — HP 2020
goal
Budget cuts
Model regulation
Tax increase
Year
www.doe.mass.edu/cnp/hprograms/yrbs/

50
$0.51 $0.76
$1.51
$2.51
$3.51
$1.82
$2.67
$3.85
$5.46
$4.57 $4.91
$6.34
$7.38 $7.45
$7.98
$9.35
0
1
2
3
4
5
6
7
8
9
10
Pri
ce
in
do
lla
rs
Fiscal Year
State excise tax Price of cigarettes
Priority Three: Increase the Price
of a Pack of Cigarettes
www.mass.gov/dor/
Projection for FY 2014 based on 10 months of data

51 51
Minimum Price Law
Regulations were issued in 1989 to enforce a 1945
law prohibiting retailers from selling cigarettes
below cost
Regulation provides a formula to calculate the
minimum price
The minimum price for Marlboro cigarettes in
Massachusetts is $9.54 per pack
Not a public health law, but has public health
benefits

52
$0.26
$0.51
$0.76
$1.51
$2.51
$3.51
565 547
510
466 465 451
406 388
369 361 346
355
297 280 274 282 277
278
225 222 224 221 214
179
0.00
0.50
1.00
1.50
2.00
2.50
3.00
3.50
4.00
100
200
300
400
500
600
Fiscal Year
MA Excise Tax Per Pack
Cigarette packs sold
Two Year Average Tax Per Pack
Number of Cigarette Packs Sold
Massachusetts, FY 1991 to FY 2014
www.mass.gov/dor/
* Projected for FY 2014 based on 10 months of data
Millio
ns o
f P
ac
ks
So
ld
Ta
x in
Do
lla
rs p
er
Pa
ck

53
68% 72% 73%
79%
85% 82%
0%
10%
20%
30%
40%
50%
60%
70%
80%
2011 2012 2013
Pe
rce
nta
ge
of
MA
Sm
ok
ers
Year
Saw a healthprofessional in
last 12 mo
Advised to quitsmoking by
healthprofessional
Provider Interventions Among Massachusetts Smokers
Priority Four: Ensure All Smokers Receive
Intervention by their Healthcare Provider
Massachusetts Behavioral Risk Factor Surveillance System (BRFSS), 2013

54
Priority Five: Protect All Massachusetts
Residents from Secondhand Smoke
As of June 2014, 38 public housing authorities
with 28,361 units are smoke-free
5 9
17
38
0
15
30
45
60
Prior FY 2012 FY 2013 FY 2014
568
3,353
18,371
28,361
0
5,000
10,000
15,000
20,000
25,000
30,000
Prior FY 2012 FY 2013 FY 2014
Number of Housing Authorities Number of Units
Fiscal Years Fiscal Years
Massachusetts Tobacco Control Program Smoke-free Public Housing Database

55
Make Smoking History:
the Role of Strong Public Policy
We focus on sustainable policies
We focus on maintaining a core infrastructure to
support strong policy strategies
We base our strategies on both practice-based
evidence and evidence-based practice
We evaluate strategies and their impact

56
The work continues!

57 57
Partnerships to Improve Cardiovascular Health through Sodium Reduction in Los Angeles County
Patricia L. Cummings, MPH, PhD
Program Manager, Sodium Reduction Initiative
Epidemiologist, Division of Chronic Disease and Injury Prevention
Los Angeles County Department of Public Health

58 58
Improving Cardiovascular Health
in Los Angeles County (LAC)
Million Hearts® efforts in LAC
ABCS
Sodium reduction
Clinical preventive services
Clinical community linkages
Sodium reduction initiative
Case study: 100% Healthy Vending
Machine Policy
Lessons learned
Next steps
ABCS: Aspirin when appropriate, Blood pressure control, Cholesterol management, Smoking cessation

59 59
Cardiovascular Disease Risk Factors and
Burden of Disease in Los Angeles County
Heart attacks and stroke are leading causes of
death in LAC
2011 Los Angeles County Health Survey data, Office of Health Assessment and Epidemiology, Los Angeles County Department of Public Health
CVD: Cardiovascular disease
24% of adults in Los Angeles County (LAC) have
been diagnosed with hypertension

60 60
Sodium: A Public Health Primer
Current levels of sodium ingestion are not safe
Average sodium intake 3,400 - 3,500 mg/day in U.S.
Reduce to <2,300 mg/day for general population
Reduce to 1,500 mg/day for specific populations
– Persons 51 years of age or older, African Americans, and persons
with high blood pressure, diabetes, or chronic kidney disease
Difficult for consumers to reduce sodium intake
74% of adults are unaware of the recommended daily sodium
intake limit
Most sodium added before food preparation or serving
Gunn JP, Kuklina EV, Keenan NL, Labarthe DR. MMWR. 2010;59(24);746-49
Carriquiry A, Moshfegh AJ, Steinfeldt LC, et al. MMWR. 2013,;62(50):1021-25
USDA and HHS. Dietary Guidelines for Americans, 2010. 7th edition. Washington, DC

61 61
68% agree there should be policies or requirements to
lower sodium content of foods in workplace cafeterias
Opinions on Sodium in Los Angeles County
LAC Voter Survey, Food Policy/Healthy Eating Poll. October 2013. Field Research Corp. for the Los Angeles County Department of Public Health
LAC Department of Public Health Internet Panel Survey, Portion Control Ad Test. April 19-May 10, 2013. Global Strategy Group.
81% (5.6 million) LAC adults (18+ years) agree there
should be restrictions placed on how much sodium is
added to packaged and restaurant foods
70% of LAC adults favor reduced access to unhealthy
snacks and beverages in vending machines in public
buildings and work sites

62 62
Los Angeles County Sodium Reduction Initiative
Supported by CDC’s Sodium Reduction in
Communities Program (SRCP)
2010-2013 and 2013-2016: County of Los Angeles
government, City of Los Angeles government, school
districts, and hospitals
Goal — to reduce population sodium intake in
Los Angeles County
Implementing strategies to improve food
service venues
Lower-sodium products, reduced portion sizes,
menu labeling, pricing, placement, and
promotion/media
National partners: Million Hearts® and NSRI
NSRI: National Salt Reduction Initiative

63 63
DPH Healthy Food Procurement (HFP) Initiative
Local, State, and Federal Partnerships
2010: HFP initiative launched by LA County DPH
2011*: County of Los Angeles Board Motion requires DPH
to make nutrition recommendations for all new or renewing
food service contracts in the county
Vending Machine Nutrition Policy (adopted in 2006; revised in 2010)
2010 - present: worked with 6 of 12 departments
e.g., Chief Executive Office, Beaches & Harbors, Health Services,
Public Works, Parks and Recreation, Probations
DPH: Department of Public Health
HFP initiative is supported by CDC’s Communities Putting Prevention to Work, Sodium Reduction in Communities Program, and Community
Transformation Grant.
*Contextual fact

64 64
Food Service Environments in
Los Angeles County (LAC)
37 departments with 100,000+ staff
12 departments purchase, sell, and/or distribute food
2 main categories of food service in LAC
1.Meals and snacks served to dependent community members
Distributive meals (senior meals, after-school snacks), meals served
to hospitals, institutionalized populations (probations)
2.Food sold on government property
Concession operations (cafés, snack shops), food trucks,
work-site cafeterias, vending machines
Estimated 37 million meals and snacks served
each year

65 65
Operationalizing Healthy Nutrition Standards
DPH’s 5-Phase Process Framework
Robles B, Wood M, Kimmons J, Kuo T. Adv Nutr 2013.

66 66
Food Service Contracting Process:
What’s Nutrition Got to Do With It?
Contracting process is similar to applying for a grant
Letter of Intent and Proposal
DPH recommended standards and purchasing practices
are incorporated into RFP and IFB
Bidders conferences are a requirement for the contract
solicitation process
Allows prospective bidders to ask questions
DPH presents nutrition standards and answers questions
Once vendor is selected and contract is executed, DPH
recommendations become requirements
DPH: Department of Public Health
RFP: Request for proposal
IFB: Invitation for bid

67 67
Example of Recommendations for
Placement and Promotion in Vending Machines
ADVERTISE A HEALTHY BEVERAGE CHOICE such as water in promotional space
PLACE BOTTLED WATER AT EYE LEVEL
provide at least 2 or more slots for water
PLACE DIET SODA AND SWEETENED BEVERAGES with a higher calorie count on the bottom shelf
PLACE SIGNAGE on vending machine to highlight healthy options

68 68
Vending Machine Nutrition Policy
ALL SNACKS SOLD IN COUNTY-
CONTRACTED VENDING MACHINES
MUST ADHERE TO THE FOLLOWING
NUTRITION GUIDELINES:

69 69
Case-Study: Chief Executive Office
Vending Contract
500+ machines across 200+ locations
46,471 employees; 15,840 visitors per day across all locations
*Preliminary Data. Total weighted average for beverage and snack machines = 137.3 mg of sodium per package (weighted by sales)
Stratified weighted average by vending type: snacks = 118 mg of sodium per package; beverages = 18.9 mg of sodium per beverage
NEMS-V: Nutrition Environment Measures Vending Survey

70 70
Impact of Sodium Reduction
in Los Angeles County (LAC)
Average sodium per packaged product
adheres to County Vending Machine
Policy nutrition standards
FEM-LA population model for 2004 - 2050
Preliminary estimate: 3,207 - 5,155 deaths
averted from reductions in incidence of heart
disease and stroke due to a 400 mg sodium
reduction in dietary intake in LAC
Up to 2 lives saved every week
Savings in total medical spending
$2.2 - 3.6 billion in LAC from 2004 to 2050
Unpublished data. Estimates using the Future Elderly Model – Los Angeles County (FEM-LA). The FEM is an economic-demographic micro-
simulation developed over the past decade by researchers with funding from the Centers for Medicare and Medicaid Services, the National Institute
on Aging, the Department of Labor, and the MacArthur Foundation.
Bibbins-Domingo K, Chertow GM, Coxson PG et al. N Engl J Med. 2010 Feb 18;362(7):590-9.

71 71
Contributing to Million Hearts
One County and One Policy at a Time
For the 5-year period
covered by Million Hearts ®
2012 - 2017
Up to 560 lives saved
Up to $778 million in medical
costs averted
Does not take other LA
County Million Hearts ®
Programs into account
Unpublished data. Estimates using the Future Elderly Model – Los Angeles County (FEM-LA). The FEM is an economic-demographic micro-
simulation developed over the past decade by researchers with funding from the Centers for Medicare and Medicaid Services, the National Institute
on Aging, the Department of Labor, and the MacArthur Foundation.
Bibbins-Domingo K, Chertow GM, Coxson PG et al N Engl J Med. 2010 Feb 18;362(7):590-9.

72 72
Partnerships to Improve Cardiovascular Health
in Los Angeles County
Limitations
Vendor product list cannot be assumed to be what is in the machine
Lessons Learned
Partnership with department and vendor is valuable for adherence
Evaluation is essential
Next Steps
Continue to refine the sodium reduction framework
Update sodium limits for vending policy to 230 mg per package
Designate intervention data collection points to monitor sodium intake
Share evaluation results

73 73
Educational Materials from Los Angeles County
Food Procurement resources
http://publichealth.lacounty.gov/chronic
Public education resources
www.choosehealthla.com
Salt shocker videos
http://www.youtube.com/user/ChooseHealthLA
Special thanks to:
Dr. Paul Simon, Dr. Tony Kuo
Michelle Wood, Brenda Robles, Dr. Irene Vidyanti
Amelia Rose, Ranjana Wickramasekaran, Katrina Vo
74 74
Million Hearts®, 2015
Accelerating Progress, Achieving Results
Send a clear signal
Measure and report progress in preventing heart
attacks and strokes: every person counts
Millionhearts.gov
Mid-Course Review:
millionhearts.hhs.gov/Docs/MH_Mid-Course_Review.pdf
Detect. Connect. Control.
Remember the ABCS
Aspirin when appropriate, blood pressure control, cholesterol
management, and smoking cessation