cdc npcr for fcds 7 08.ppt - university of...
TRANSCRIPT

Florida’s central cancer registry is funded by NPCR and as a funded g y yprogram has to meet certain requirements and standards.
FCDS thought it would be helpful for you all to know more about NPCR and how you fit into the bigger picture
1

2
Before further exploring NPCR, I would like to set the stage by p g , g yreviewing the history and infrastructure of cancer surveillance in the US so that you can see where NPCR fits into the bigger picture.
3
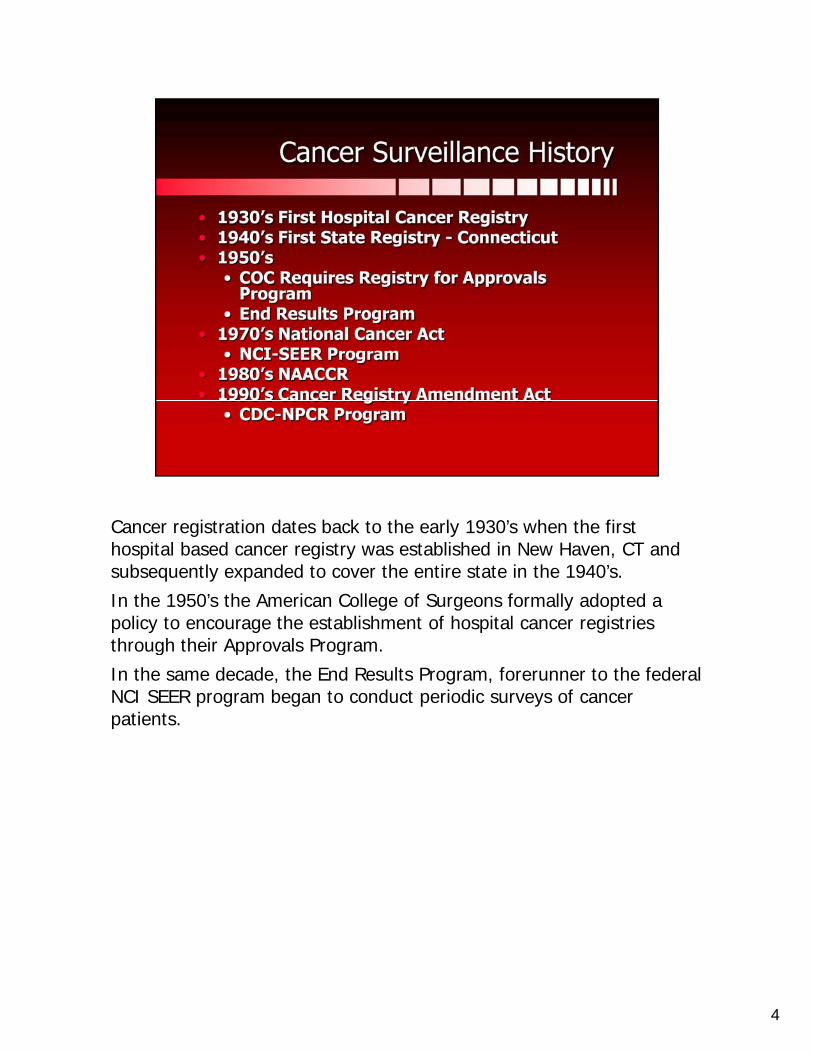
Cancer registration dates back to the early 1930’s when the firstCancer registration dates back to the early 1930 s when the first hospital based cancer registry was established in New Haven, CT and subsequently expanded to cover the entire state in the 1940’s.
In the 1950’s the American College of Surgeons formally adopted a policy to encourage the establishment of hospital cancer registries through their Approvals Program.g pp g
In the same decade, the End Results Program, forerunner to the federal NCI SEER program began to conduct periodic surveys of cancer patients.
4
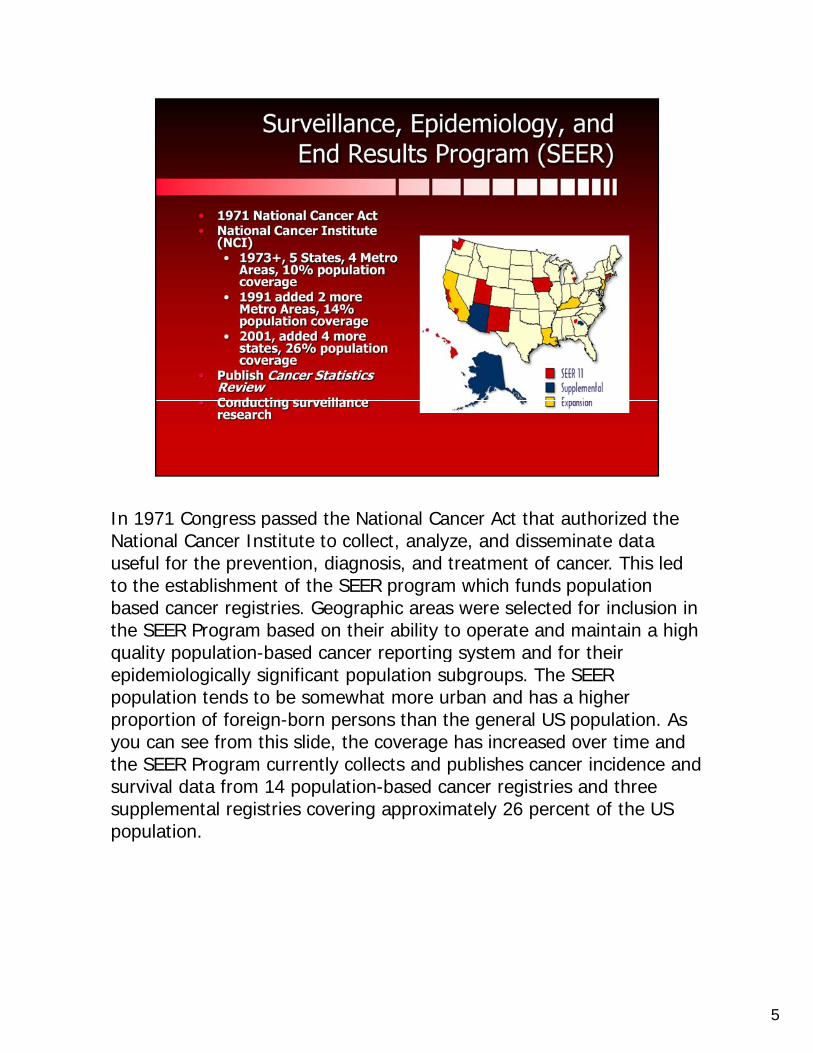
In 1971 Congress passed the National Cancer Act that authorized the g pNational Cancer Institute to collect, analyze, and disseminate data useful for the prevention, diagnosis, and treatment of cancer. This led to the establishment of the SEER program which funds population based cancer registries. Geographic areas were selected for inclusion in the SEER Program based on their ability to operate and maintain a high quality population based cancer reporting system and for theirquality population-based cancer reporting system and for their epidemiologically significant population subgroups. The SEER population tends to be somewhat more urban and has a higher proportion of foreign-born persons than the general US population. As you can see from this slide, the coverage has increased over time and the SEER Program currently collects and publishes cancer incidence and survival data from 14 population-based cancer registries and three supplemental registries covering approximately 26 percent of the US population.
5

As of the late 1980’s, there was no federal program for assessing , p g gcancer incidence in every state. While SEER data provided estimates of cancer incidence for a sample of the US, these data did not provide the geographically specific information needed for the planning and evaluation of cancer control interventions at all local, state, regional and national levels.
l h h 0 h d l i i f hAlthough approx. 40 states had central cancer registries, most of these states lacked the resources and legislative support needed to gather complete data.
6

Citing the need for a national program that would provide the more g p g plocal, state, regional and national cancer incidence data needed for national and state health planning, Congress passed the Cancer Registry Amendment Act in October, 1992 through public law 102-515. This legislation authorized the establishment of the National Program of Cancer Registries. The law also designated The Centers for Disease Control and Prevention as the agency to fund the enhancement andControl and Prevention as the agency to fund the enhancement and support of existing central cancer registries and to fund the planning and implementation of new central cancer registries. The CDC also set requirements for the funded registries and established program standards.
7

NPCR funding began for most supported central registries with the g g pp g1995 diagnosis year. Several supported registries reference years began later.
NPCR funding currently supports central registries and promotes the use of registry data in 45 states, DC, Puerto Rico, and the Pacific Island Jurisdictions and covers most of the US population.
8

This map shows funding by source and as you can see, between NPCR p g y y ,and SEER, the US population is covered.
The goal of NPCR is the availability of complete, high quality, and timely cancer incidence data in every state for planning and evaluation of cancer prevention & control activities
9

The North American Association of Central Cancer Registries (NAACCR) g ( )is a professional organization for central cancer registries and other cancer surveillance organizations in the US and Canada.
NAACCR brings the standard setting and funding agencies like NPCR and SEER together with COC and Central Cancer Registries together for consensus on developing and promoting uniform data standards as well
id d i d i i d l ifi i fas provides education and training and external certification of population-based registries, aggregates and publishes data from central cancer registries and promotes the use of cancer surveillance data.
CDC provides funding to support the infrastructure and work of NAACCR. NPCR staff serve on NAACCR committees and workgroups in collaboration with other agencies such as COC and SEER as well ascollaboration with other agencies such as COC and SEER as well as representatives from state cancer registries.
10

I would like to take a moment to show you where NPCR resides or is yorganizationally situated in the federal government “big picture”
11

CDC is an agency in the US Department of Health and Human Services g y p– circled in red
The Centers for Disease Control and Prevention (CDC) is recognized as the lead federal agency for protecting the health and safety of people -at home and abroad, providing credible information to enhance health decisions, and promoting health through strong partnerships. CDC
h i l f f d l i d l i diserves as the national focus for developing and applying disease prevention and control, environmental health, and health promotion and education activities designed to improve the health of the people of the United States
12
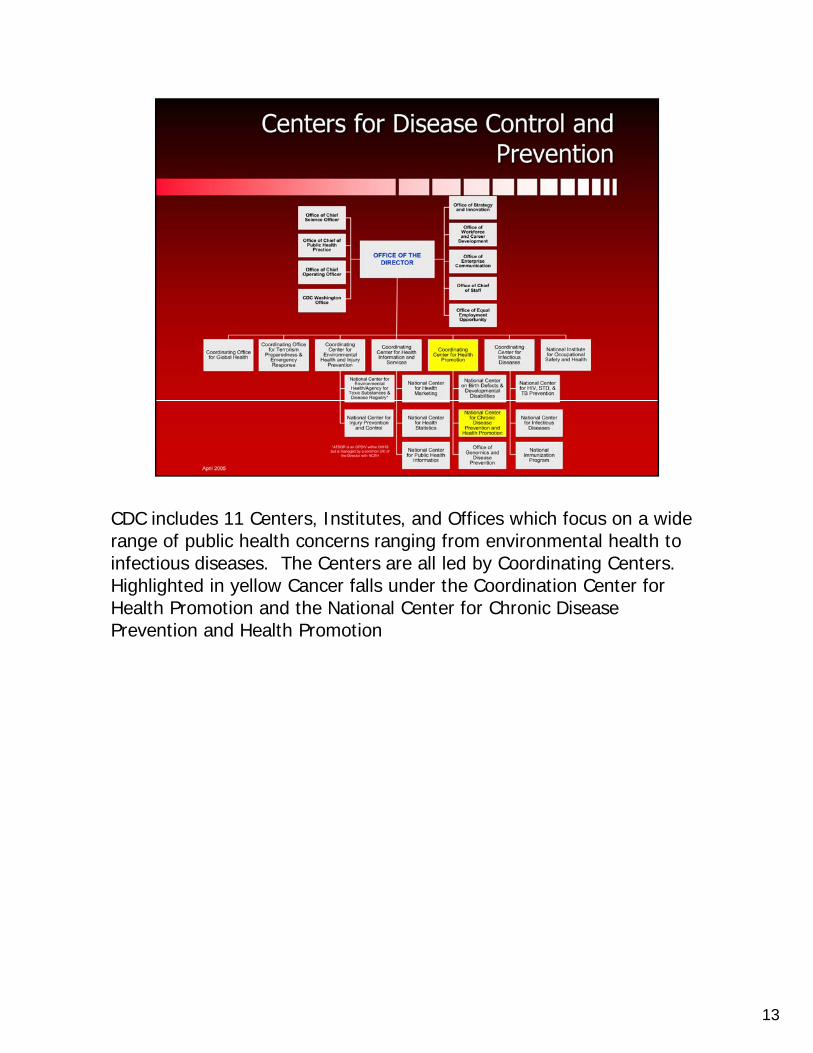
CDC includes 11 Centers, Institutes, and Offices which focus on a wide , ,range of public health concerns ranging from environmental health to infectious diseases. The Centers are all led by Coordinating Centers. Highlighted in yellow Cancer falls under the Coordination Center for Health Promotion and the National Center for Chronic Disease Prevention and Health Promotion
13
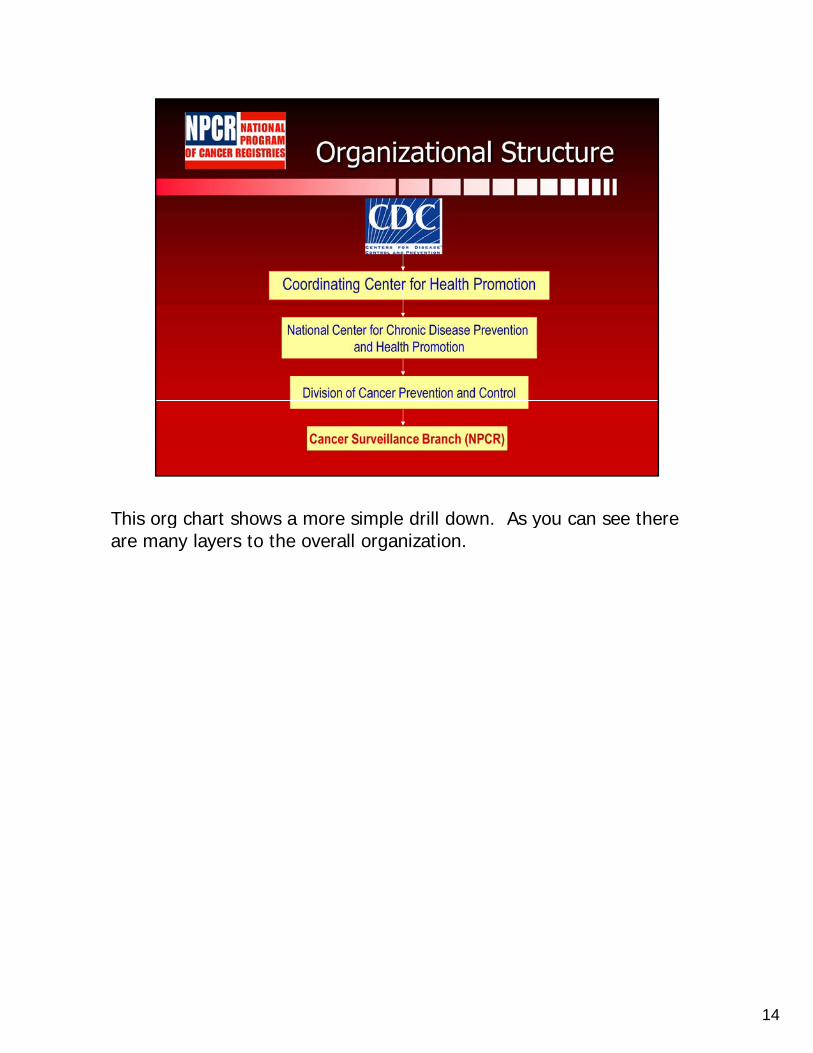
This org chart shows a more simple drill down. As you can see there g p yare many layers to the overall organization.
14
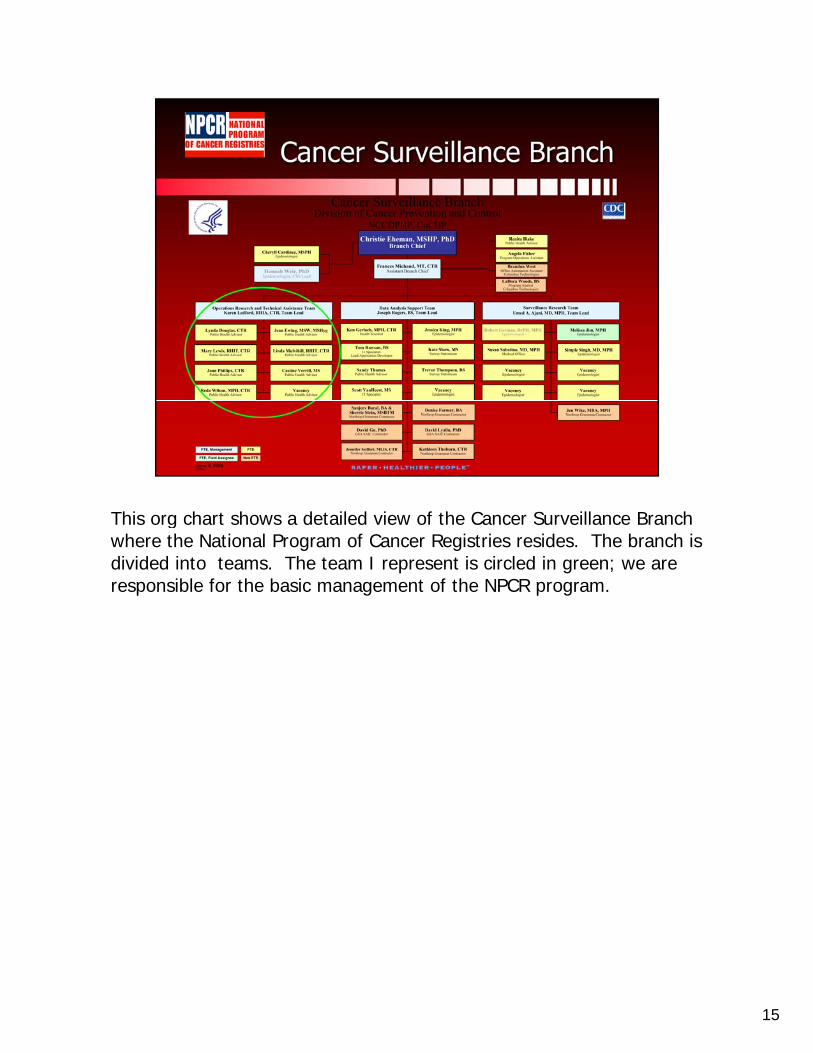
This org chart shows a detailed view of the Cancer Surveillance Branch gwhere the National Program of Cancer Registries resides. The branch is divided into teams. The team I represent is circled in green; we are responsible for the basic management of the NPCR program.
15

16
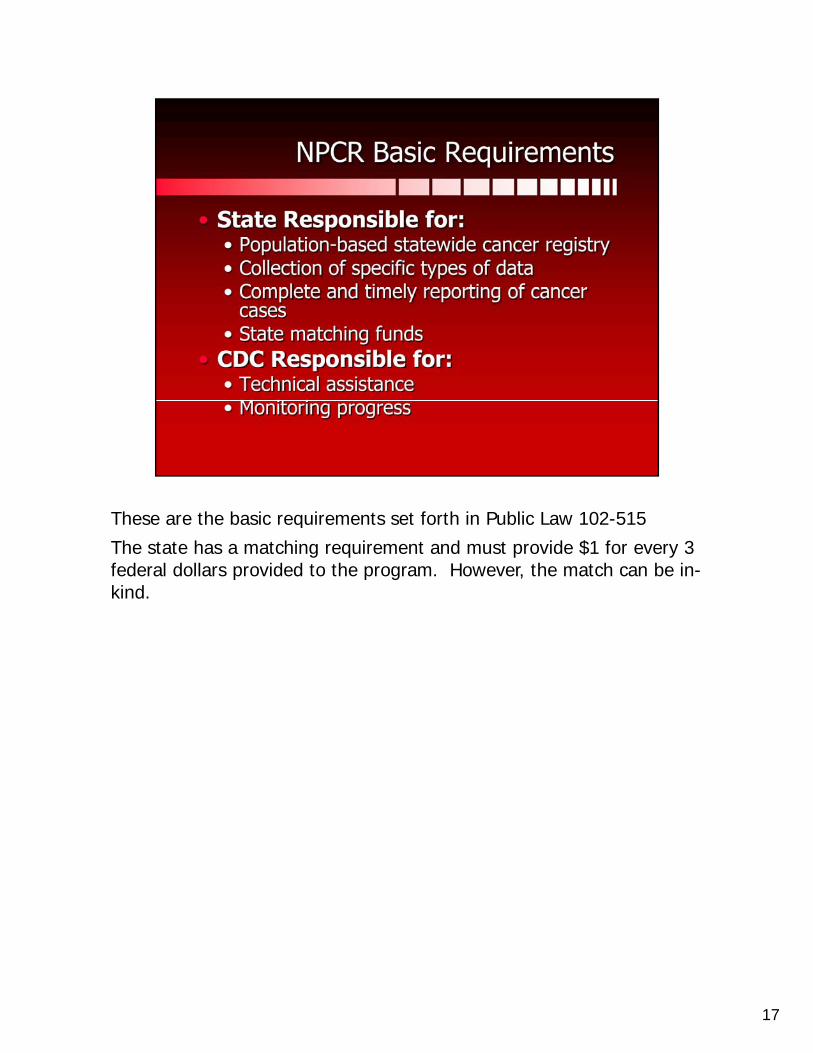
These are the basic requirements set forth in Public Law 102-515q
The state has a matching requirement and must provide $1 for every 3 federal dollars provided to the program. However, the match can be in-kind.
17

Operation and Administration includes p
Core Staff, Written policies and procedures, Hardware and Software ResourcesData management includes
Collection, Format, Storage, Exchange, Linkage, ReportsC fid ti lit S it d D t R lConfidentiality, Security and Data ReleaseCompleteness, TimelinessData Quality Assurance
De-identified is data submitted annually to NPCR Cancer Surveillance System (more about that in later slide)
Data Use - produce annual report or analytic data file. Promote the use of cancer data in state cancer control activities
The advisory committee must include a variety of specific cancer surveillance-related professionals in the state, the purpose of which is to guide state registry activities.
18

The first 3 bullets are the responsibility of the NPCR Program p y gConsultants.
For example, we conducted a site visit of Florida’s Central Registry yesterday. We discussed the registry’s progress and when I return to Atlanta, we will write a formal report that becomes part of the official CDC record for the Program.
Just as the state registry conducts audits of reporting facilities in Florida, NPCR conducts completeness and data quality audits of the funded central registries once every 5 years. CDC contracts with an external firm to perform the audit and analyze the results.
19

This is a list of central registry activities that NPCR has developed g y pstandards for. There are quite a few details for each standard so in the interests of time, I will be highlighting only the 2 standards in yellow. FCDS can provide you with a copy of the standards if you are interested. The point I want to make is that FCDS works hard every day to achieve these standards.
20

FCDS has been funded by NPCR for quite some time and has been y qsuccessful in achieving, maintaining and exceeding the NPCR standards.
The last NPCR audit was conducted in 2004 of 2001 cases and the results for both completeness and data accuracy were very good.
Florida also submits data to NAACCR for external certification and has consistently received the highest level of certification.y g
21
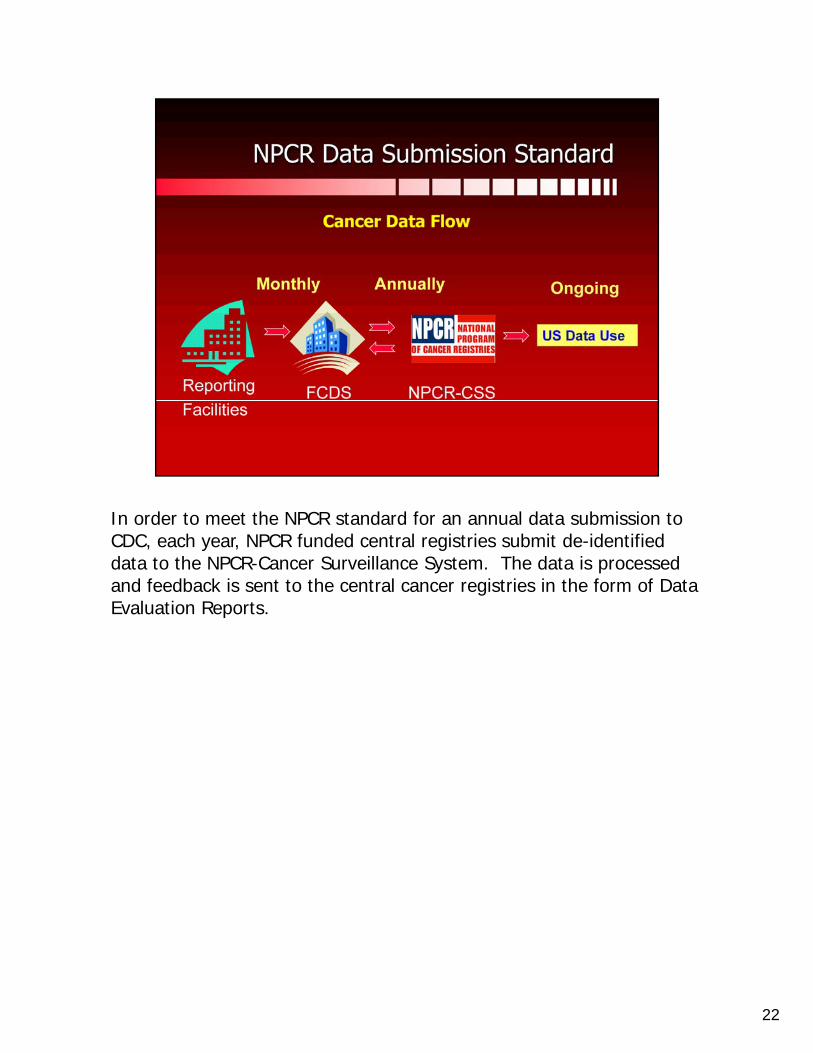
In order to meet the NPCR standard for an annual data submission to CDC, each year, NPCR funded central registries submit de-identified data to the NPCR-Cancer Surveillance System. The data is processed and feedback is sent to the central cancer registries in the form of Data Evaluation Reports.
22

These are the data standards for the central registries associated with gthe required annual data submission to NPCR
The NPCR 24 month standard is the same as the NAACCR standards for Gold Certification
The United State Cancer Statistics Publication Standard is the same as the NAACCR standards for Silver Certification.
23

Each year following the NPCR data submission, each central registry receives a set of Data Evaluation Reports that provide feedback to the state about their data submission. This report on Quality, Completeness and Timeliness of Data shows how Florida met the data standards for the submission. The standards are listed at the bottom of the report
d h l h l d hand the results are at the top. I am very pleased to report that FL met and/or exceeded all of the data standards including the most stringent standard of 90% completeness at 12 months.
24
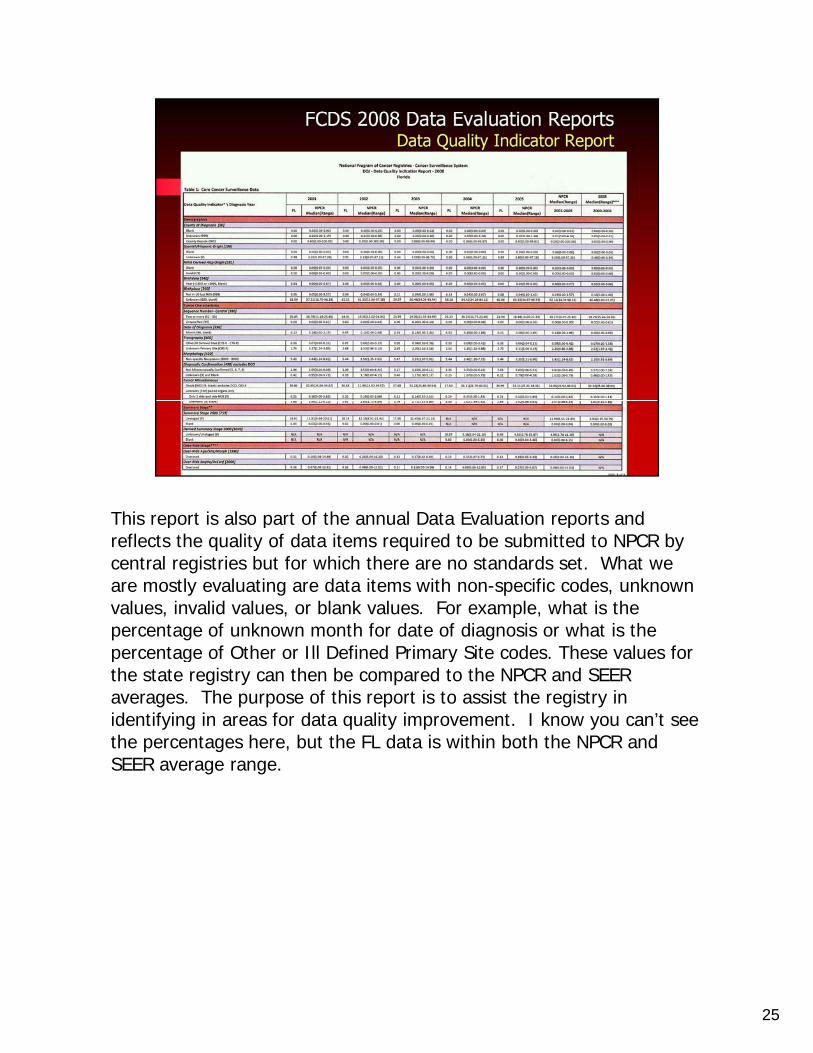
This report is also part of the annual Data Evaluation reports and p p preflects the quality of data items required to be submitted to NPCR by central registries but for which there are no standards set. What we are mostly evaluating are data items with non-specific codes, unknown values, invalid values, or blank values. For example, what is the percentage of unknown month for date of diagnosis or what is the percentage of Other or Ill Defined Primary Site codes These values forpercentage of Other or Ill Defined Primary Site codes. These values for the state registry can then be compared to the NPCR and SEER averages. The purpose of this report is to assist the registry in identifying in areas for data quality improvement. I know you can’t see the percentages here, but the FL data is within both the NPCR and SEER average range.
25
I would like to now show you a few examples of how the data you y p ysubmit to your central cancer registry and that the central registry in turn submits to NPCR is used as part of the US effort in cancer prevention and control.
26
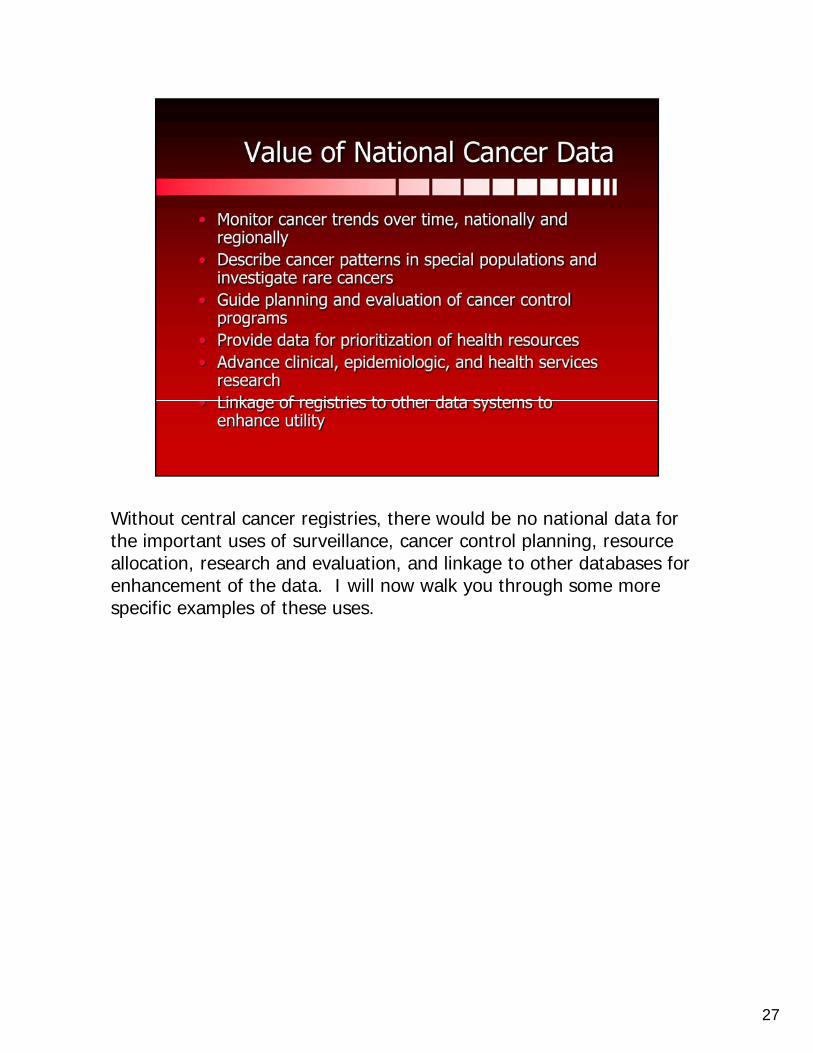
Without central cancer registries, there would be no national data for g ,the important uses of surveillance, cancer control planning, resource allocation, research and evaluation, and linkage to other databases for enhancement of the data. I will now walk you through some more specific examples of these uses.
27

28
CDC-NPCR in collaboration with NCI-SEER has published United States pCancer Statistics annually since 2002.
29

In an joint collaboration with NCI/SEER and NAACCR, CDCIn an joint collaboration with NCI/SEER and NAACCR, CDC provides cancer statistics for 50 states and the District of Columbia. USCS is used for surveillance, cluster investigation, cancer control planning and research and intervention studies. As more central registries over time ha e met the p blication c ite ia the US pop lationhave met the publication criteria, the US population coverage has increased. This slide shows the cover for the most recent USCS which includes incidence and mortality for the 2004 diagnosis year.
30

USCS is on the Web and is queriable. This graph shows rates for the q g ptop 10 US cancers for both male and female, all races.
31

You can also compare a single state with the US. This chart shows a p gcomparison between Florida and the US by site and by gender, showing the top 10 cancer sites for males and females.
32

33
34

Cancer State profiles is part of Cancer Planet and is used as a tool in p pcancer control planning. National data is provided from NPCR central cancer registries.
35

Data linkages are an innovative and important way to improve the g p y pquality and usefulness of cancer data at both the state and national level.
36

This is one example of data linkage.p gThe data central registries submit to NPCR includes several demographic factors, including age, sex, race/ethnicity, and geographic region. However, obtaining complete and accurate information for some data items remains problematic for many registries. The misclassification of American Indians as non-Indians demonstrates a
i l d b i h ll d h b f d b hi hparticular data abstraction challenge, and has been found to be as high as 40 percent in some states. Such misclassification could misinform program planning efforts for cancer prevention activities in the American Indian/Native American populations since they would be based on inaccurate estimates of cancer burden.
37
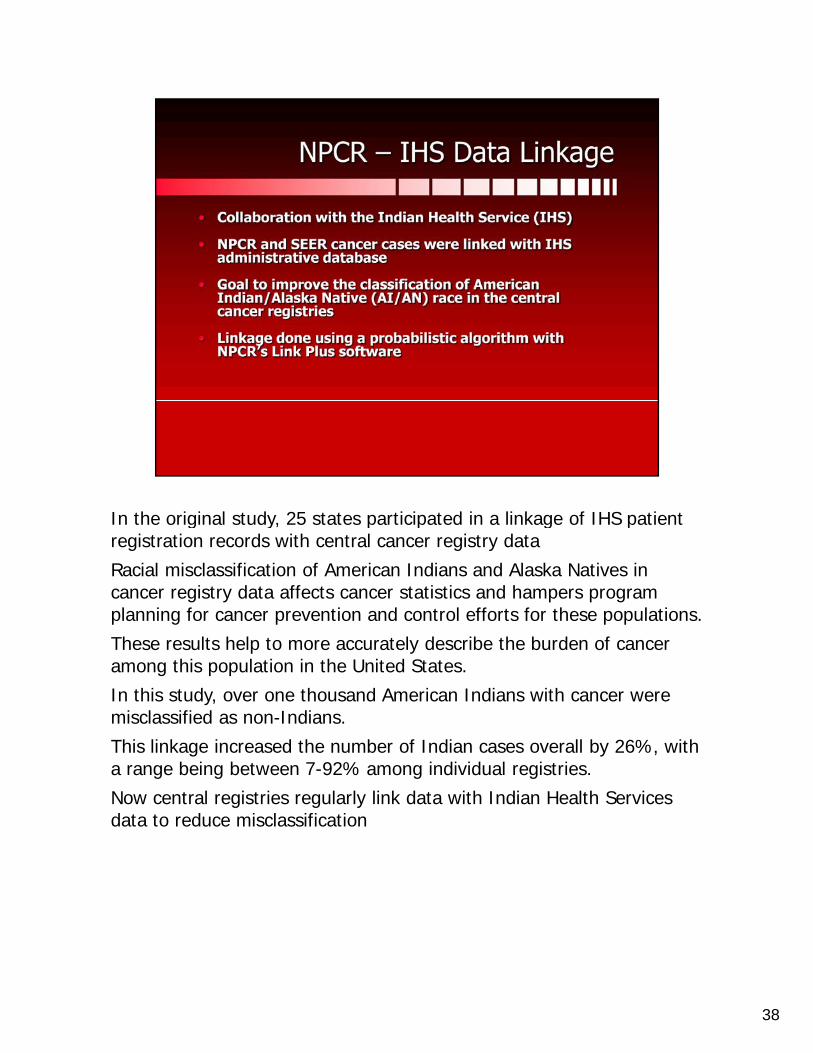
In the original study, 25 states participated in a linkage of IHS patient g y, p p g pregistration records with central cancer registry data
Racial misclassification of American Indians and Alaska Natives in cancer registry data affects cancer statistics and hampers program planning for cancer prevention and control efforts for these populations.
These results help to more accurately describe the burden of cancer p yamong this population in the United States.
In this study, over one thousand American Indians with cancer were misclassified as non-Indians.
This linkage increased the number of Indian cases overall by 26%, with a range being between 7-92% among individual registries.g g g g
Now central registries regularly link data with Indian Health Services data to reduce misclassification
38

The Patterns of Care and Concord studies are just 2 examples of j presearch done at the national, and in the case of the Concord Study, international levels.
39

Your role in cancer surveillance is extremely important. Without y paccurate and timely data reported to central registries from all health care facilities, state and national cancer surveillance would not be very effective and use of the data would be limited.
The slide reflects the complexities registrar’s face today in meeting the standards of different national organizations. The good news is that,
lik h h i i ki h hunlike the past, these organizations are now working together so that there are not so many different and conflicting rules used to collect cancer data.
40
Your high quality data is what makes all of this possible and we g q y pappreciate your daily efforts.
41

42