ccrp frn de sub-group mtg #4
TRANSCRIPT

CCRP FRN DE Sub-Group Mtg #4
December 9, 2015

Check-in

Mary Richardson
FRN Coordinator
Betna Haussmann
WAf
Claire Nicklin I-team
Lecia Grossman,
Tech Support
Eva Weltzier, Waf
Kate Wellard, SAf
Daniel NyambokEAf
Jane Maland-Cady
MF Dir. Intern’l Prog
Marah Moore
DE Coordinator
Briefly share:• One burning question you are coming
with
Maria Yumbla, Andes
Samuel Guindo WAf
Daimon KambewaSAf
Frank TchuwaSAf
Martha Caswell, Andes

TypologiesWealth Ranking
UPSCALING BEST FIT MAIZE-LEGUME TECHNOLOGIES THROUGH MULTI ENVIRONMENT TRIALS AND
FARMER RESEARCH NETWORKS IN MALAWI
WEALTH RANKING IN PROJECT AREAS
Frank Tchuwa, Kate Wellard and Daimon Kambewa

Introduction
• BBIII aim at improving livelihoods of smallholder farmers including the marginalised groups
• This requires identifying and characterising different categories of wealth in project communities
• The information is essential to monitoring and evaluation of project’s impact on different wealth categories in project communities
• However, such information should reflect the perceptions of the locals about wealth in their communities
• Therefore a wealth ranking exercises was conducted in project areas
Objectives
• Identifying categories of wealth, well-being and poverty in communities
• Establishing distribution of households in different wealth categories wealth, well-being and poverty

Methodology
• Identification of farmer perceived wealth ranking indicators• Wealth ranking (well-being) tool
• Adapted from • World Bank (2005) Poverty and Social Impact Analysis Sourcebook http://go.worldbank.org/ZGZHJEDBZ0 • IISD Wealth Ranking and Poverty Analysis
http://www.iisd.org/casl/caslguide/wealthranking.htm
• Procedure 1: Select Local Analysts. 2: Provide Introductions and Explanations. 3: Separate the Group of Participants by Gender. 4: Participants Produce a Wealth Ranking 5: Participants’ Presentations/ Analysis and Discussions 6: Conclude the Activity.

Methodology
• Collecting the evidence • Baseline survey (588 households-sample size)
• 61 variables included in the survey• 31 ratio data (continuous e.g number of assets owned) • 30 nominal (binary- yes/no)
• Data reduction • Principle Component Analysis (PCA in SPSS)• Categorical Principle Component Analysis (CATPCA in STATA)
• Generating wealth categories • Household Wealth Index (Quintiles in stata)

Results: Farmer Perceptions of Wealth• Indicators and criteria for wealth, well-being and poverty
Wealth category Very poor Poor Better off Social characteristics Food insecure all year √ Food insecure half of year √ Food secure all year √Cant send children to school √ Old aged/disabled/orphaned √ Educated √Hire farm labour √Able to buy enough fertilizer √

Results: Farmer Perceptions of Wealth• Indicators and criteria for wealth, well-being and poverty
Wealth categoryAssets Very poor Poor Better off House with grass thatched roof √ √ House with iron sheet roof √House with unburnt bricks wall √ House with burnt bricks wall √ √Ox-cart √Cattle √Goat √ √Pig √ √Chicken √ √Bicycle √ √Motor Bike √Car √Bed √Milling machine √Large land size √

Results: Farmer Perceptions of Wealth• Indicators and criteria for wealth, well-being and poverty
Wealth categoryCopping and livelihood strategy Very poor Poor Better off Begging √ Farm casual labour √ √ Sell agricultural products (small scale) √ √Small business (grocery) √Small business (charcoal selling) √ Small business (firewood selling) √ Small business (local beer brewing √ √ Transporter (bicycle) √ Transporter (car) √

Results: Farmer Perceptions of Wealth
• Wealth categories and distribution of households in categories
• * one group had added the rich category but it was extensively contested during the group presentation
Wealth categories Very poor Poor Better of Rich*
Distribution of households Few Majority Very few Rare

Categories of variables identified
• Demographic characteristics• Age, education,
• Food security• Number of months maize is available for households
• Assets • Household utilities (e.g beds), type of dwelling house, land, livestock,
transportation
• Economic activities • Begging, casual labour, businesses

Results: Data Reduction
• 19 Variables identified in PCA and CATPCA outputs
Item Factor scoreNumber of cars owned 0.84house has iron sheet roof 0.82Number of cattle owned 0.80House has electricity 0.78if bought bread 0.78if household uses candles for lighting 0.77Number of ploughs owned 0.76if went to maize mill 0.74Number of oxcart owned 0.74if bought sugar 0.73
Item Factor scorehousehold has glass windows 0.73house has concrete floor 0.72if bought soap 0.71Number of motorcycle owned 0.70household has burnt brick wall 0.68Number of goats owned 0.66Number of treadle pumps owned 0.61Number of table owned 0.57Number of chairs owned 0.55

Results: Generating Wealth Categories
• Household Wealth Index• Transforming the factor scores to ordinal scores
• None=0• 0.5-0.59=1• 0.6-0.69=2• 0.7-0.79=3• 0.8+=4
• Sum of ordinal scores on 19 selected variables for each household• Household Wealth Index variable generated

Results: Generating Wealth Categories
• Summary of the Household Wealth Indexn mean max min
588 19 44 30
.02
.04
.06
.08
De
nsity
0 10 20 30 40Household Wealth Index (aggregate score)

Results: Generating Wealth Categories • Farmer perceptions on distribution of household wealth categories
Distribution of households by Quintiles Quintiles Frequency %
Poorest 20% 143 24
Lower Middle 20% 125 21
Middle 20% 89 15
Upper Middle 20% 133 23
Richest 20% 99 13
Wealth categories Very poor Poor Better of Rich
Distribution of households Few Majority Very few Rare

Verification of the Household Wealth Index• ANNOVA test on scale (continuous) variables Wealth category (quintiles)
Mean assets owned Poorest 20% Lower Middle 20% Middle 20% Upper Middle 20% Richest 20% Sig (P<0.05)
Car (n=580) 0.0 0.0 0.0 0.0 0.1 0.0001***
Cattle (n=583) 0.0 0.0 0.3 0.7 2.1 0.0000***
Plough (n=583) 0.0 0.0 0.0 0.0 0.2 0.0000***
Oxcart (n=583) 0.0 0.0 0.0 0.1 0.2 0.0000***
Motor cycle (n=581) 0.0 0.0 0.0 0.0 0.1 0.0072***
Goats (n=579) 0.7 0.8 1.6 2.0 3.9 0.0000***
Treadle pump (n=583) 0.0 0.0 0.0 0.1 0.2 0.0000***
Table (n=584) 0.2 0.7 1.0 1.1 1.7 0.0000***
Chair (n=585) 0.8 2.2 3.1 3.5 6.3 0.0000***

Verification of the Household Wealth Index
• Chi Square test on nominal (binary) variables Wealth category (quintiles)
Households owning assets (%) Poorest 20% Lower Middle 20% Middle 20% Upper Middle 20% Richest 20% Sig (P<0.05)
Iron sheet roof house (n=582) 3.6 7.2 37.1 75.2 94.5 0.000***
Electricity in the house (n=583) 0.0 0.8 1.1 1.6 14.3 0.000***
Bought bread (n=582) 29.5 76.8 68.5 85.4 93.9 0.000***Used candles for lighting house (n=583) 2.8 5.6 12.4 9.3 25.5 0.000***Payed for maize milling service (n=582) 96.4 98.4 100.0 98.5 100.0 0.427
Bought sugar (n=582) 58.6 92.8 87.5 94.6 100.0 0.000***
Glass windowed house (n=581) 6.4 14.4 38.2 66.7 89.9 0.000***
Concrete floor house (n=582) 0.7 4.8 22.5 48.4 89.9 0.000***
Bought soap (n=582) 93.6 100.0 98.9 100.0 100.0 0.000***
Burnt brick wall house (n=581) 34.3 63.2 77.5 93.1 96.9 0.000***

Conclusion and way forward
• Consistence in results from both qualitative and quantitative methods• Indicator of robustness (strength) of the methods• We will be analysing the household wealth categories
• By project areas• (Mzimba, Kasungu and Ntcheu)
• By project beneficiaries • Households participating in BBIII project• Households not participating but living in project villages • Households not participating and not living in project villages

Power Analysis

Definitions of “power”
• Definitions of “power” differ across discipline and over time• (Generally) two kinds of power:
• Distributive power—who has power over whom?• Collective power—the capacity of a group to realize its common goals

Ways to conceptualize a Power Analysis Framework
1. Who benefits?
2. Who governs?
3. Who wins?
4. Who has a reputation for power?

Ways to conceptualize a Power Analysis Framework, cont’d
Sources of power
1. Authority and position
2. Access to and control of resources
3. Networks
4. Skills, education, expertise
5. Technology
6. Physicality and personal qualities

Ways to conceptualize a Power Analysis Framework, cont’d
Contexualized power:
1. Situational
2. Domain (e.g. national vs local)

Ways to conceptualize a Power Analysis Framework, cont’d
Expressions of power:
1. Power to . . .
2. Power with . . .
3. Power within . . .

Ways to conceptualize a Power Analysis Framework, cont’d
Spaces of power:
1. Closed
2. Invited
3. Claimed
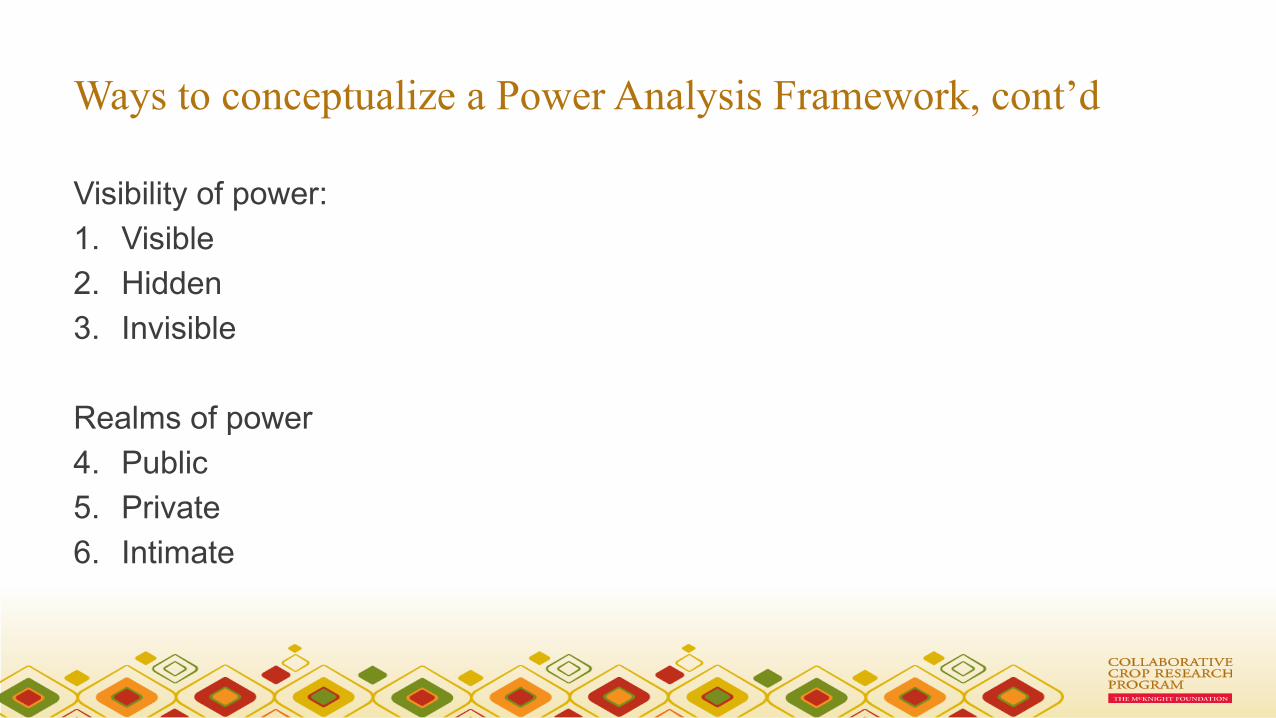
Ways to conceptualize a Power Analysis Framework, cont’d
Visibility of power:
1. Visible
2. Hidden
3. Invisible
Realms of power
4. Public
5. Private
6. Intimate

Possible Research Questions Related to Power
1. Who are the key actors?
2. What are the interests/goals of different actors?
3. How is the problem framed and by whom?
4. What are the key resources?
5. What are the dependencies between actors?
6. What are the rules that regulate decision-making?
7. To what extent are interests/goals reflected in the outcomes of decision-making?

Project Cycles for Power Analysis
• Context analysis• Strategy and action planning• Monitoring and evaluation• Facilitation and learning


FRN Principles
Deep Dive analysisDec., 2015

Background
• FRNs are not always going to look the same, it’s not a recipe• But what makes an FRN an FRN? …Adherence to the principles• The principles were first conceived in a more theoretical space
and now we are seeing if they apply to the practical experience of the DD projects
• They are also meant as a tool that can be used by the projects and all their stakeholders (farmers, researchers, organizations etc.) to guide their work.

GP1. Farmers that represent the social and biophysical diversity of their communities participate in the whole research process.
Operating principles Seed Systems (Waf) FRN NGO (Eaf)
Groundnut (Andes) Best Bets (Saf)
1a) Farmer groups set research priorities and influence the research agenda.
++ The primary purpose of working with farmer group is to orient the breeding program such that new varieties present really needed advantages to farmers, and that seed dissemination becomes a sustainable activity for farmer groups.
++Farmers are participating in whole research process by bringing in one of their treatments into the current experiment.
++The association leadership can be partners in contributing to the research agenda, as well as market actors, but also FV often determines or suggests the research agenda and then farmers express their interest by their participation, which is generally high.
++Through participatory approaches farmers will be involved in defining the research needs, identifying criteria for collecting evidence and, collect data and manage the field trials.
1b) Engage farmer groups and organizations throughout the whole research process from diagnosis, design, implementation, analysis, and communication.
++There are regular meetings with farmers at all the levels of organization, including discussions, evaluations with individuals, members of eth network, and others who may benefit from the network’s activities
++Experiments are set under their own watch. They are involved in data collection and will participate in the analysis
++There is precedent for farmers collecting and interacting with aflatoxin data. Farmers have also contributed to research agenda such as post-harvest drying machines, but exactly which farmers and the dynamics need to be further studied.
++The farmers will be organized into farmer research groups which will actively engage throughout the research process
1c) Ensure farmers who lack financial, social, and resource capitals are included.
++This is possible when those farmers have the time and resources to spare, which is to them most limiting. They may not be interested to engage in running trials or seed production lots, but contribute to various evaluation steps, and discussions on planning and priority setting
+We have involved large number of farmers from diverse agro ecologies in our research- currently undertaking farmer typology survey which will be used to inform future targeting
+We need to create a mechanism for analyze existing networks among farmers, and their relationships, who they are most related, "concentrators", and those who are isolated "network theory" in their social relationships. In general many women are involved, but the evidence needs to be examined of who is participating and not and why. No women extension agents, which is a problem.
++Farmer wealth status assessment was done at baseline and will tracked during the study to ensure that the marginalized groups are also benefiting from the project. The project will deliberately target the marginalized group.
Why is this so essential? Might there be particular farmers more suited to
being part of a FRN?
It doesn’t seem like farmers are really setting the agenda, just participating in the agenda. How good are extension personnel at
facilitating this?

GP2. Research is rigorous, democratized, and focused on understanding biophysical and social variation.
Operating principles Seed Systems (Waf) FRN NGO (Eaf)
Groundnut (Andes) Best Bets (Saf)
2a) Address agriculture’s technical-social problems with research designs, data management, protocols, and sound analysis methods that can reveal patterns and suitable options across diverse agro-ecological and social contexts.
++ Varietal options for a wide range of contexts are being provided. Farmers define the target contexts for variety testing at the planning meetings; variety descriptions based on farmers experiences with specific varieties in specific contexts have been published, for use by people involved in seed dissemination.Some papers on specific adaptation issues have been published. i.e. low P availability.
++we have relied on technology to inform patterns across diverse agro-ecological and social network (use of GIS and ODK)- our farmer base are of diverse ecological and social contexts covering large area in western Kenya region
++Have done sophisticated aflatoxin mapping using ODK, GIS and a database and farmer collection and sampling strategies.
++The project has adopted the term innovation as including technological, organizational and institutional changes. Therefore data on the outcomes of the project are not only limited to technologies innovated but also organizational and institutional changes occurring in the project areas
2b) Evaluate how technology, knowledge, and ideas facilitate inspiration or are adapted in the research and action processes so that others can learn from these experiences.
++The project facilitates exchange visits between partners from different countries, focusing on facilitating exchange of experiences of farmers themselves. It also monitors and documents seed activity.
++We are currently working on setting a database for use in the network
+desire has been expressed on tackling issues of how tech transfer has occurred in the past, still in planning phase
++The project will collect data on how the innovations are being scaled on the farms of farmer experimenters as well as farmers learning from the experimenters.Using a social network analysis the project will collect information to help characterize the nature and trend of innovation scaling out and up in the project areas
2c) Research designs are adequately representative with counterfactuals and comparisons.
++Depending on the type/objective of the trials we have commonly agreed controls or each famer may put their own control variety and agronomic treatment.
+ ++They often use the whole universe of participants but never a control group, can make interesting comparisons between individuals, have done some of that but in general need to go deeper into typologies. Did a convenience sample on urine testing that was less rigorous.
+The project has adopted to use the quasi experimental design in which there is minimal randomization of the participants but close analysis of variations and changes over time. However the project will include a two types of randomized controls to help handle the counterfactual (one control group in the villages where the project is implemented and another control group in the villages away from project villages.
Is it clear what is meant by “technical-social” problems? BB has a good
definition
Sampling issues are one of the biggest issues in CCRP projects. What is quality
research? Did BB just put somewhat because they think their design is weak? Interesting SS sees this as BP and BB as
Social

GP3: Networks foster collaboration and opportunities for learning and knowledge sharing.
Operating principles Seed Systems (Waf) FRN NGO (Eaf)
Groundnut (Andes)
Best Bets (Saf)
3a) Foster genuine and authentic collaborative engagement.
++ While power has some role in deciding priority activities, more actual decision making, and contribution to longer term outcomes comes from people with a genuine interest in varietal issues; people who are engaging for their local group’s benefit. Women participate, take on key roles in specific areas of their interest, and drive the agenda, e.g. working on groundnut improvement for phase 3 in Mali/
++Collaborative engagement currently involving farmers, NGOs and researchers presents opportunities for all partners to learn from. The various capacity strengthening efforts (soft skills, research skills, technological skill) are geared towards cementing this collaboration. Each partner is presented with win-win situation
++ Farmer representatives seem to have a good relationship with Fundacion Valles and actively engage with negotiating research agendas. It is unclear to what extent this permeates to the rank and file. There are a lot of tech transfer moments in practice, even when they are labeled collaborative. Turn over of extentionists contributes to this.
++Will analyze and monitor power relations and work on improving imbalances.All actors will jointly monitor and evaluate progress on FRN.
3b) Facilitate learning and knowledge sharing across farmer groups with similar agendas, interests, and constraints.
++. All local partners have engaged with local radio stations for disseminating experiences, learnings, and facilitate info sharing.
++in participating in research, partners are posed to undergo learning and information sharing beyond farmer group level but also across researchers and research organizations with similar agendas, interests, and constraints.
++The 3 farmers organizations are all articulated through an umbrella organization, so the leaders regularly meet to exchange ideas and there are at least annual field days events where farmers exchange ideas and technologies as well as network with the private sector, Gos and NGOS
++All actors involved in dissemination of innovations, ownership and access to info.Farmer to farmer approaches will be promoted (within communities) and exchanges between groups.
This is a great place to put the capacity piece – maybe meaningful collaboration cannot take
place until everyone is on a level playing field?

Next Steps
• Continue to use the data collection tools—focus on documenting the process of developing FRNs• Differences across regions/projects• Challenges • Learning about what works
• Continue to update documents in DropBox• Set next meetings