ccn 2020 01 - fraser lab
TRANSCRIPT

1ComputationalCrystallographyNewsletter(2020).Volume11,Part1.
Computational Crystallography Newsletter
Ensemble refinement
Vo
lum
e El
even
Jan
ua
ry
MM
XX
TheComputationalCrystallographyNewsletter(CCN)isaregularlydistributedelectronicallyviaemailandthePhenixwebsite,
www.phenix-online.org/newsletter. Feature articles,meeting announcements and reports, information on research or other
itemsofinterest tocomputationalcrystallographersorcrystallographicsoftwareuserscanbesubmitted totheeditoratany
timeforconsideration.Submissionoftextbyemailorword-processingfilesusingtheCCNtemplatesisrequested.TheCCNis
notaformalpublicationandtheauthorsretainfullcopyrightontheircontributions.Thearticlesreproducedheremaybefreely
downloadedforpersonaluse,buttoreference,copyorquotefromit,suchpermissionmustbesoughtdirectlyfromtheauthors
andagreedwiththempersonally.
1
TableofContents•PhenixNews 1
•ExpertAdvice• Fittingtips#19–RemembertousetheinformationfromNCScopies 2
•ShortCommunications• phenix.homology:findinghigh-resolutionmatchesforlow-resolutionmodelsata
chainlevel 5
• LessonsfromusingtheCambridgeStructureDatabase:I–Bondnumber
specification 7
•Articles• EnsemblerefinementproducesconsistentR-freevaluesbutsmallerensemblesizes
thanpreviouslyreporte 11
• dtmin–aDomainTunablePythonMinimizer 22
EditorNigelW.Moriarty,[email protected]
PhenixNewsAnnouncementsNewPhenixRelease
Highlights for the 1.17 version of Phenix
include:
2
• Improved handling of SHELX data in
phenix.reflection_file_converter• eLBOW can output files for Amber andsupportstheOrcaQMpackage
• dials.image_viewer is used for viewing
diffractionimages
• Updatedmapsmoothing• Fix inconsistency in clashscore values inphenix.validation_cryoem when hydrogen
atomsareinthemodel
Please note that this new publication should
beusedtocitetheuseofPhenix:
Macromolecular structure determination
using X-rays, neutrons and electrons: recent
developments in Phenix. Liebschner D,
Afonine PV, BakerML, Bunkóczi G, Chen VB,
CrollTI,HintzeB,HungLW,JainS,McCoyAJ,
Moriarty NW, Oeffner RD, Poon BK, Prisant
MG, Read RJ, Richardson JS, Richardson DC,
Sammito MD, Sobolev OV, Stockwell DH,
Terwilliger TC, Urzhumtsev AG, Videau LL,
Williams CJ, Adams PD: Acta Cryst. (2019).
D75,861-877.
A new tool, phenix.homology, is available inthe nightly and discussed on page 5 of this
newsletter.
Downloads, documentation and changes are
availableatphenix-online.org

11ComputationalCrystallographyNewsletter(2020).11,11-22
ARTICLES
1
EnsemblerefinementproducesconsistentR-freevaluesbutsmallerensemblesizesthanpreviouslyreported
StephanieA.Wankowicza,bandJamesS.Frasera,b,c,d
a-BiophysicsGraduateProgram,UniversityofCaliforniaSanFrancisco,SanFrancisco,CA,USA.b-DepartmentofBioengineeringandTherapeuticSciences,UniversityofCaliforniaSanFrancisco,SanFrancisco,CA,USA.c-QuantitativeBiosciencesInstitute,UniversityofCaliforniaSanFrancisco,SanFrancisco,CA,USA.d-MolecularBiophysicsandIntegratedBioimagingDivision,LawrenceBerkeleyNationalLaboratory,Berkeley,CACorrespondenceemail:[email protected]
2
IntroductionEnsemble refinement combines molecular
dynamics(MD)simulationswithcrystallographic
data to provide amodelof atomic fluctuations
that are present in the crystal lattice. As
implemented in phenix.ensemble_refinement,
MDsimulationsareperformedwherethemodel
is restrainedbya time-averagedX-ray restraint
(Burnley et al. 2012). Because the agreement
withobservedstructure factors is calculatedby
averagingofseveralrecentsnapshotsoftheMD
simulation, ensemble refinement differs
significantly from traditional refinement where
a single structure is used to calculate the
agreement.Toattempttocontrolforcrystalline
disorder, a Translation/Libration/Screw (TLS)
model model is fitted prior to the simulation,
leaving the simulation to fit the residual
differencedensity.Afterthesimulationisrun,a
procedure reduces the ensemble size down
fromallsnapshotsacquiredduringtheperiodto
a minimal set that will reproduce the R-free
within a tolerated value. In the original paper
describing phenix.ensemble_refinement, this
yielded 39-600 ensemble members in the 20
PDB depositions that were subjected to
refinement.Thestructuraldiversityacrossthese
ensemble members is a representation of the
residual conformational heterogeneity after
accountingforthedisordermodeledbytheTLS
model.
3
We set out to run ensemble refinement on a
large number of publicly available X-ray
crystallography structures. Although some
parameter names and default values had
apparentlychangedsincetheoriginalpaper,the
online documentation provided a guide to
reasonable values (Phenix documentation:
ensemble_refinement.html).Forouranalysis,all
structures had a resolution between 1-2.5
Angstroms. Using Phenix version 1.15, we
pursued the following workflow (code is
availableongithub1).
1. Downloadexistingmodelandstructure
factorfiles
2. Runphenix.ready_set
3. Re-refinementofmodelusing
phenix.refine
4. Ensemblerefinementoveragridsearchof
parameters
5. SelectionofbestmodelbasedonRfree
Allinputparametersforouranalysisare
available
(https://ucsf.app.box.com/folder/95195345802).
Non-defaultinputs• wxray_coupled_tbath_offset:
grid search of 2.5, 5, 10
ErrorsAbout 10% of the structures failed during
refinement. There were numerous reasons for
these failures including, a lack of appropriate
1https://github.com/stephaniewanko/Fraser_Lab/tree/master/phenix_pipeline
12
ARTICLES
ComputationalCrystallographyNewsletter(2020).11,11-22
4
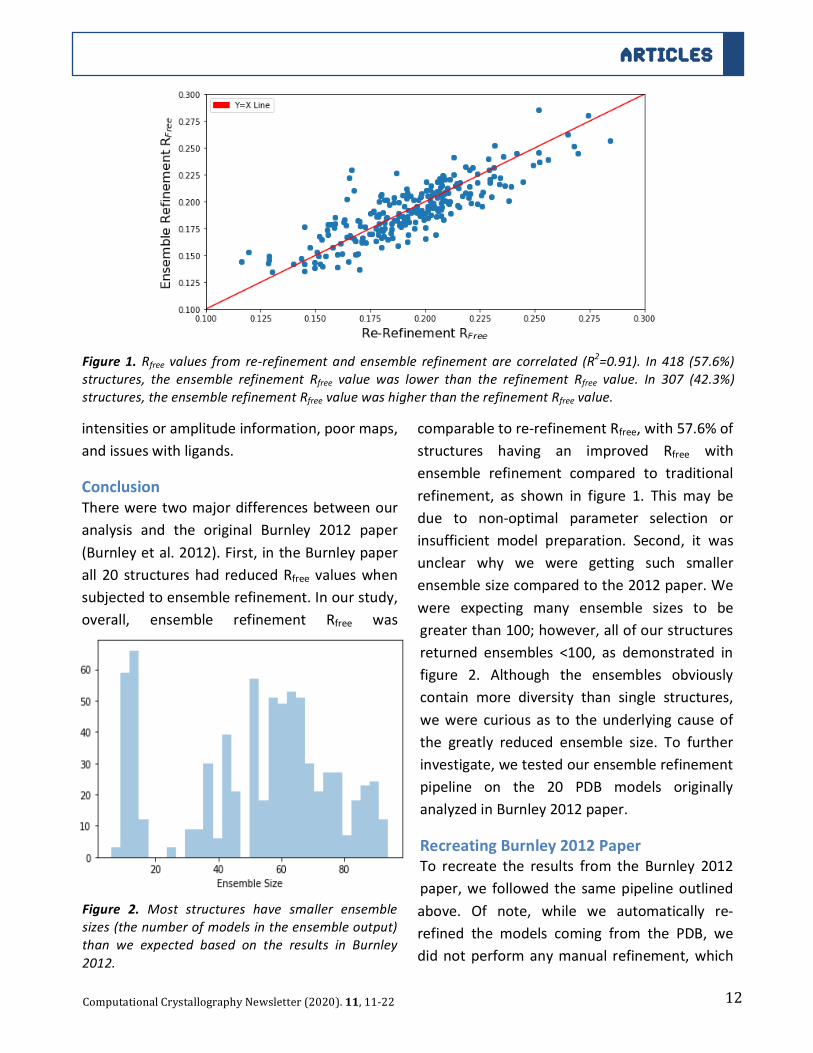
intensitiesoramplitudeinformation,poormaps,
andissueswithligands.
ConclusionThereweretwomajordifferencesbetweenour
analysis and the original Burnley 2012 paper
(Burnleyetal.2012).First, intheBurnleypaper
all 20 structureshad reducedRfree valueswhen
subjectedtoensemblerefinement.Inourstudy,
overall, ensemble refinement Rfree was
5
comparabletore-refinementRfree,with57.6%of
structures having an improved Rfree with
ensemble refinement compared to traditional
refinement, as shown in figure 1. Thismay be
due to non-optimal parameter selection or
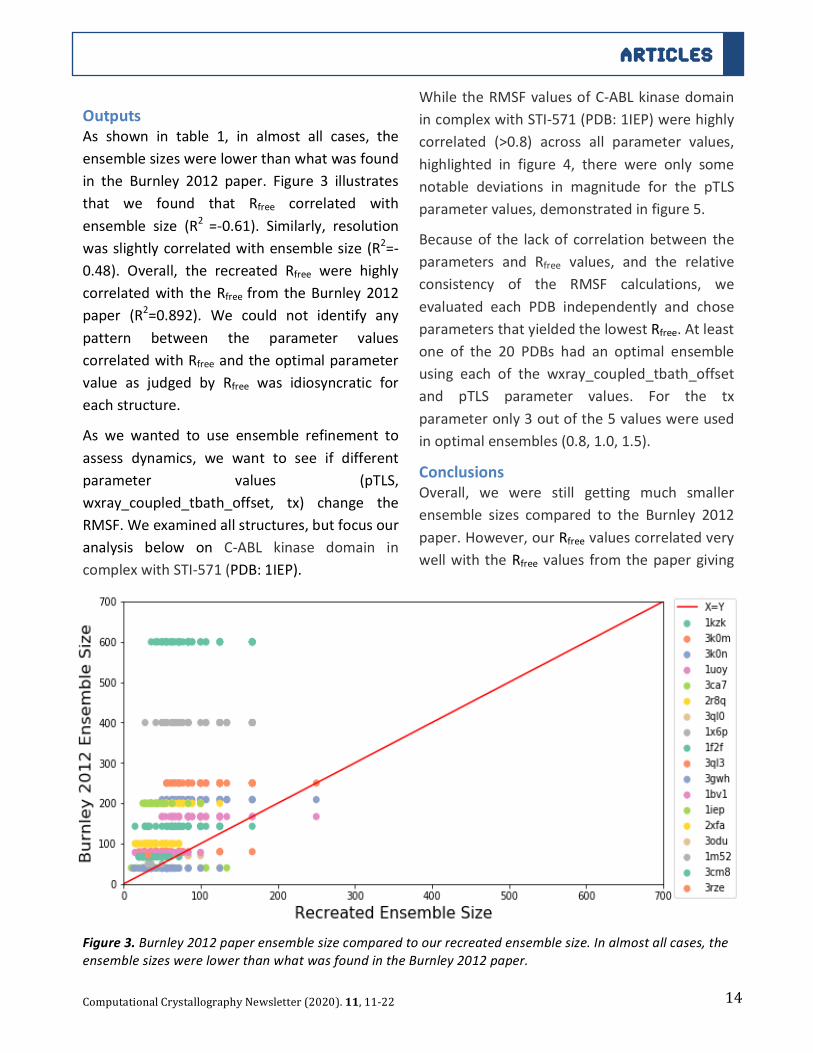
insufficient model preparation. Second, it wasunclear why we were getting such smaller
ensemblesizecomparedtothe2012paper.We
were expecting many ensemble sizes to be
greaterthan100;however,allofourstructures
returned ensembles <100, as demonstrated in
figure 2. Although the ensembles obviously
contain more diversity than single structures,
wewere curious as to the underlying causeof
the greatly reduced ensemble size. To further
investigate,wetestedourensemblerefinement
pipeline on the 20 PDB models originally
analyzedinBurnley2012paper.
RecreatingBurnley2012PaperTo recreate the results from the Burnley 2012
paper,we followed the samepipelineoutlined
above. Of note, while we automatically re-
refined the models coming from the PDB, we
didnotperformanymanual refinement,which
Figure 1.Rfree values from re-refinementand ensemble refinement are correlated (R2=0.91). In 418 (57.6%)
structures, the ensemble refinement Rfree value was lower than the refinement Rfree value. In 307 (42.3%)
structures,theensemblerefinementRfreevaluewashigherthantherefinementRfreevalue.
Figure 2. Most structures have smaller ensemble
sizes(thenumberofmodelsintheensembleoutput)
than we expected based on the results in Burnley
2012.

13
ARTICLES
ComputationalCrystallographyNewsletter(2020).11,11-22
6
leftuswithinputstructureswithslightlyhigher
Rfree/Rworkcompared to theBurnley2012paper
(table 1). We extended our grid search to
include three parameters suggested by the
Phenix documentation (pTLS,
wxray_coupled_tbath_offset,tx).
● pTLSdefines the fractionofatoms included
intheTLSfittingprocedure.Thisisintended
to model static crystalline lattice disorder
and varying this parameter results in
movement being absorbed by the TLS B-
factorsratherthanbyatomicfluctuations.
●wxray_coupled_tbath_offset controls the X-
ray weight. This helps ensures that the
simulationrunsatthetargettemperature.
● tx dictates the structure factor memory
relaxationtime.Thisgovernsthetimeperiod
for which a particular conformation retains
7
its influence. The higher the number, the
more a particular conformation affects the
average.
Additionally, we added harmonic restraints for
all ligands in each structure. Of note, while
Burnley2012paperreportedonlyoneensemble
structure per PDB, we had 36 ensemble
structures (corresponding to a 3 x 3 x 4 grid
search of the parameters pTLS, tx,
wxray_coupled_tbath_offset) and choose one
selectensemblestructurebasedonthecriteria
of lowest Rfree. This test was run on Phenix
versiondev-3584(amid2019version).
Non-defaultinputs• wxray_coupled_tbath_offset:
grid search of 2.5, 5, 10 • pTLS: grid search of
0.6,0.8,1.0 • tx: 0.5, 0.8, 1, 1.5
Table1.InputRvaluesfromBurnley2012comparedtoourinputtoourrecreation.
PDB Resol. OriginalEnsemble
Size
RworkBurnley2012
RfreeBurnley2012
RworkRecreation
RfreeRecreation
RecreationLowestRfree
EnsembleSize
1kzk 1.1 600 0.125 0.153 0.155 0.179 1003k0m 1.3 250 0.104 0.129 0.127 0.144 1673k0n 1.4 209 0.115 0.133 0.117 0.143 1672pc0 1.4 250 0.145 0.188 0.231 0.252 1251uoy 1.5 167 0.104 0.137 0.136 0.165 1253ca7 1.5 40 0.149 0.184 0.237 0.292 562r8q 1.5 200 0.132 0.162 0.164 0.188 1253ql0 1.6 70 0.204 0.254 0.217 0.256 501x6p 1.6 400 0.121 0.149 0.141 0.163 1341f2f 1.7 143 0.128 0.168 0.170 0.210 843ql3 1.8 80 0.160 0.208 0.171 0.207 561ytt 1.8 84 0.139 0.174 0.179 0.206 633gwh 2.0 39 0.160 0.200 0.198 0.230 671bv1 2.0 78 0.149 0.182 0.188 0.240 841iep 2.1 200 0.183 0.238 0.207 0.256 632xfa 2.1 100 0.171 0.217 0.226 0.261 603odu 2.5 50 0.208 0.269 0.247 0.297 321m52 2.6 50 0.161 0.211 0.198 0.240 323cm8 2.9 67 0.194 0.235 0.231 0.264 393rze 3.1 72 0.210 0.280 0.250 0.289 32
14
ARTICLES
ComputationalCrystallographyNewsletter(2020).11,11-22
8
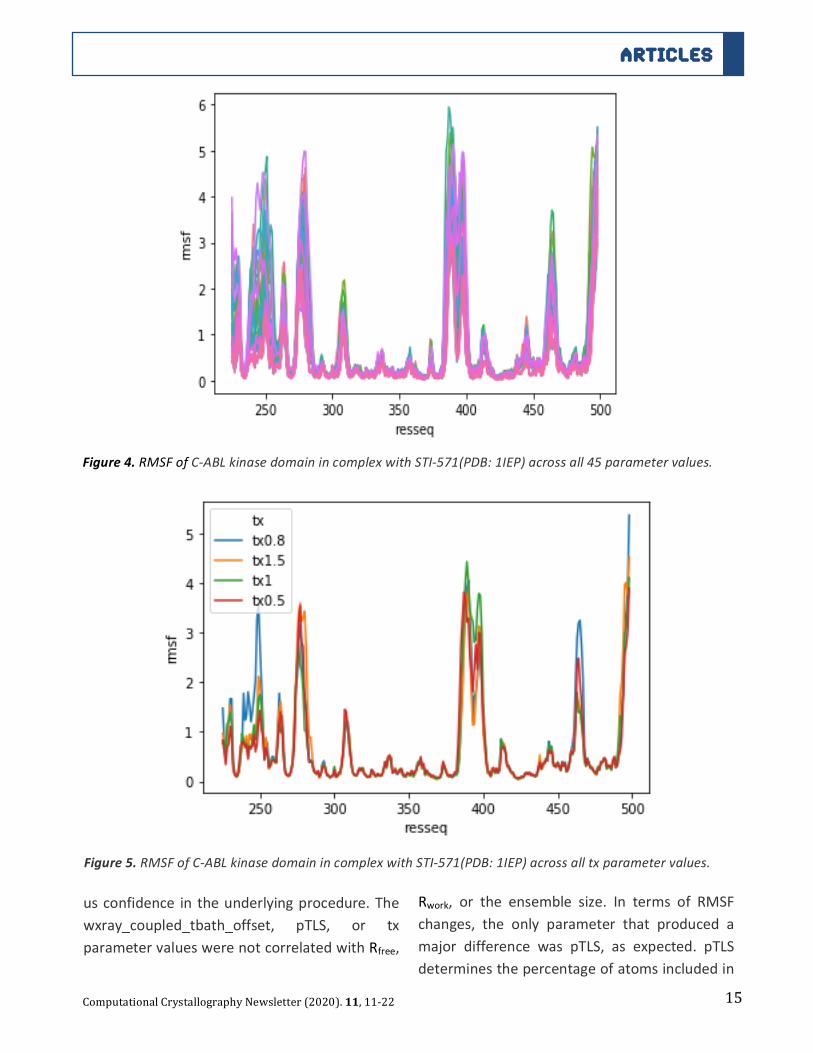
OutputsAs shown in table 1, in almost all cases, the
ensemblesizeswerelowerthanwhatwasfound
in the Burnley 2012 paper. Figure 3 illustrates
that we found that Rfree correlated with
ensemble size (R2 =-0.61). Similarly, resolution
wasslightlycorrelatedwithensemblesize(R2=-
0.48). Overall, the recreated Rfree were highly
correlatedwith theRfree from theBurnley2012
paper (R2=0.892). We could not identify any
pattern between the parameter values
correlatedwithRfreeandtheoptimalparameter
value as judged by Rfree was idiosyncratic for
eachstructure.
As we wanted to use ensemble refinement to
assess dynamics, we want to see if different
parameter values (pTLS,
wxray_coupled_tbath_offset, tx) change the
RMSF.Weexaminedallstructures,butfocusour
analysis below on C-ABL kinase domain in
complexwithSTI-571(PDB:1IEP).
9
WhiletheRMSFvaluesofC-ABLkinasedomain
incomplexwithSTI-571(PDB:1IEP)werehighly
correlated (>0.8) across all parameter values,
highlighted in figure 4, there were only some
notable deviations in magnitude for the pTLS
parametervalues,demonstratedinfigure5.
Becauseof the lackof correlationbetween the
parameters and Rfree values, and the relative
consistency of the RMSF calculations, we
evaluated each PDB independently and chose
parametersthatyieldedthelowestRfree.Atleast
one of the 20 PDBs had an optimal ensemble
using each of the wxray_coupled_tbath_offset
and pTLS parameter values. For the tx
parameteronly3outofthe5valueswereused
inoptimalensembles(0.8,1.0,1.5).
ConclusionsOverall, we were still getting much smaller
ensemble sizes compared to the Burnley 2012
paper.However,ourRfreevaluescorrelatedvery
wellwiththeRfreevaluesfromthepapergiving
Figure3.Burnley2012paperensemblesizecomparedtoourrecreatedensemblesize.Inalmostallcases,the
ensemblesizeswerelowerthanwhatwasfoundintheBurnley2012paper.
15
ARTICLES
ComputationalCrystallographyNewsletter(2020).11,11-22
10
usconfidence intheunderlyingprocedure.The
wxray_coupled_tbath_offset, pTLS, or tx
parametervalueswerenotcorrelatedwithRfree,
11
Rwork, or the ensemble size. In terms of RMSF
changes, the only parameter that produced a
major difference was pTLS, as expected. pTLS
determinesthepercentageofatomsincludedin
Figure4.RMSFofC-ABLkinasedomainincomplexwithSTI-571(PDB:1IEP)acrossall45parametervalues.
Figure5.RMSFofC-ABLkinasedomainincomplexwithSTI-571(PDB:1IEP)acrossalltxparametervalues.

16
ARTICLES
ComputationalCrystallographyNewsletter(2020).11,11-22
12
the TLS model, which predicts the local
positional displacement of atoms in a crystal
structure with the underlying assumption that
theatomsincludedaremembersofarigidbody.
In our results, lower pTLS values (fewer atoms
included in the pTLSmodel) have higher RMSF
on average. It is unclear to us if choosing a
model based on the best Rfree will result in
accurate results for protein conformational
heterogeneity, especially when comparing two
proteinstructureswithdifferentpTLSvalues.
InvestigatingtheensemblesizedifferenceTotrytoresolvethediscrepancyinthe
ensemblesizesfromtheoriginal2012paperto
ourrecreationoftheirresults,weusedthe
optimalparametervaluesfromthetestabove
foreachPDBandtestedfourotherkeyword
changesthatwepredictedmightgiveusresults
closertotheBurnley2012paper.
1) UsingthePhenixversionreleasedmost
closelytotheBurnley2012paper(version
1.8.2,thefirstreleasetocontainthe
phenix.ensemble_refinementcommand).
2) Removingtheuseoftheconformation
dependentrestraintlibrary.
3) Re-settingtheensembleRfreetolerance
parameterto0.001
13
4) Re-settingtheensemblereductionfeature
tofalse
TestingPhenixversion1.8.2The Burnley 2012 paper was run using a different
Phenixversionthanweusedwithourrecreation.We
ran ensemble refinement on Phenix version 1.8.2,
which corresponds to the public release of the
methodaftertheBurnley2012paper.
Non-defaultinputs(Phenixversion1.8.2)• wxray_coupled_tbath_offset,
pTLS, tx parameter values corresponding to the optimal Rfree for each individual PDB from the previous tests.
ErrorsOnly five out of the 20 structures ran ensemble
refinement successfully. There were multiple
reasonsforfailures.TheseincludedapTLSerrorwith
chain breaks and errors reading in parameters fed
intoensemblerefinement.
ConclusionsManystructuresfailedtorunensemblerefinement.
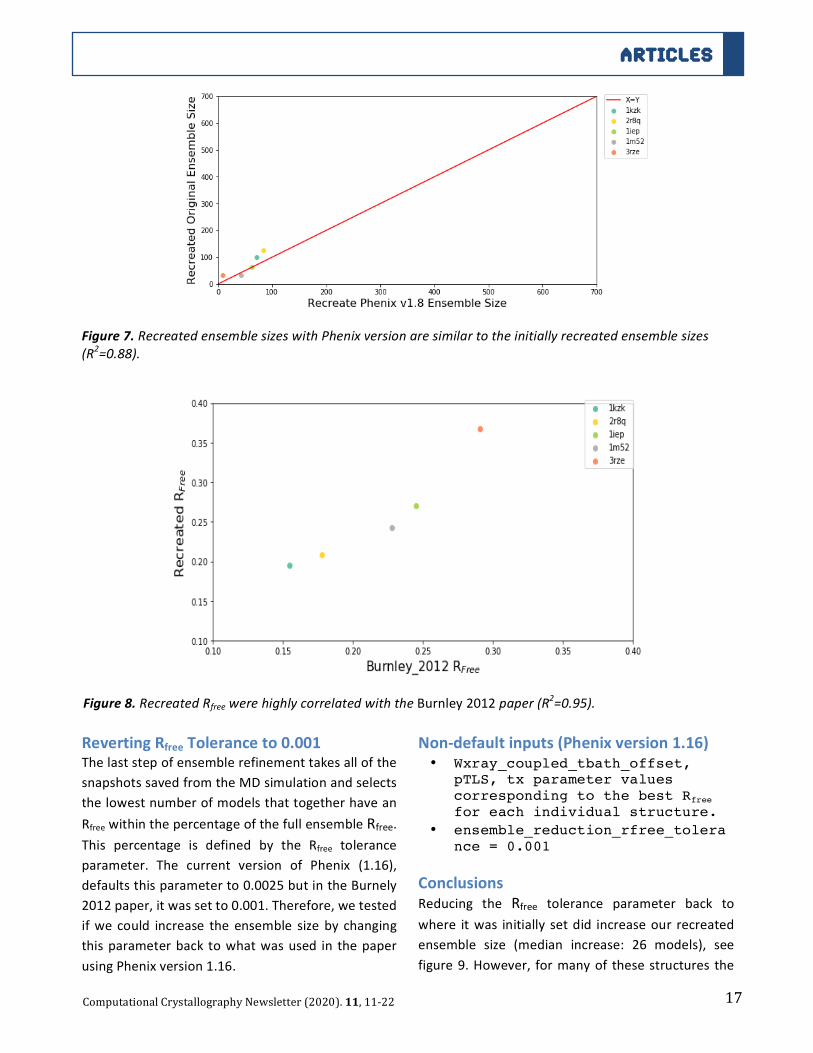
However, for the five structures that finished, the
ensemble sizes were still smaller than expected
based on the Burnley 2012 paper and were highly
correlated with our previous recreation, as seen in
figure 6 and 7. Figure 8 demonstrated that we
continuetoobserveagoodcorrelationbetweenthe
originalandupdatedRfreevalues(R2=0.95).
Figure6.RecreatedensemblesizesaresmallercomparedtotheensemblesizesinBurnley2012(R2=0.57).
17
ARTICLES
ComputationalCrystallographyNewsletter(2020).11,11-22
14
RevertingRfreeToleranceto0.001Thelaststepofensemblerefinementtakesallofthe
snapshotssavedfromtheMDsimulationandselects
thelowestnumberofmodelsthattogetherhavean
RfreewithinthepercentageofthefullensembleRfree.
This percentage is defined by the Rfree tolerance
parameter. The current version of Phenix (1.16),
defaultsthisparameterto0.0025butintheBurnely
2012paper,itwassetto0.001.Therefore,wetested
ifwecould increase the ensemble size by changing
thisparameterbacktowhatwasusedin thepaper
usingPhenixversion1.16.
15
Non-defaultinputs(Phenixversion1.16)• Wxray_coupled_tbath_offset,
pTLS, tx parameter values corresponding to the best Rfree for each individual structure.
• ensemble_reduction_rfree_tolerance = 0.001
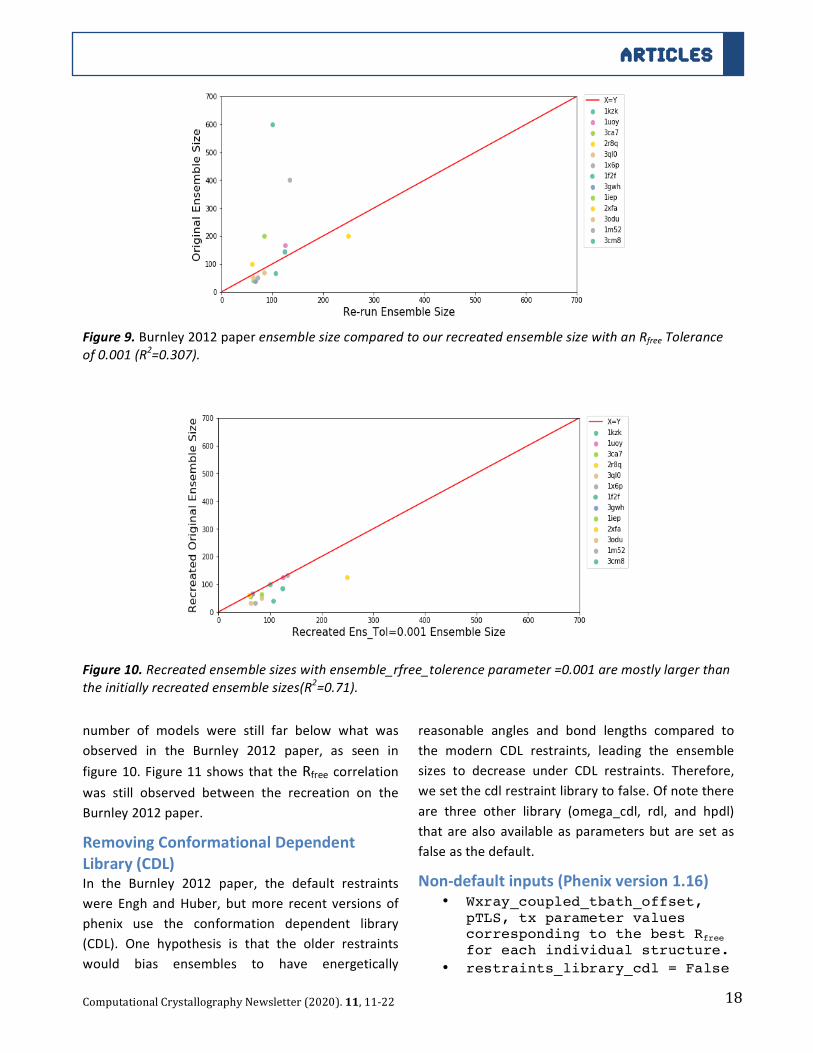
ConclusionsReducing the Rfree tolerance parameter back to
where itwas initially setdid increaseour recreated
ensemble size (median increase: 26 models), see
figure9.However, formanyof thesestructures the
Figure7.RecreatedensemblesizeswithPhenixversionaresimilartotheinitiallyrecreatedensemblesizes
(R2=0.88).
Figure8.RecreatedRfreewerehighlycorrelatedwiththeBurnley2012paper(R2=0.95).
18
ARTICLES
ComputationalCrystallographyNewsletter(2020).11,11-22
16
number of models were still far below what was
observed in the Burnley 2012 paper, as seen in
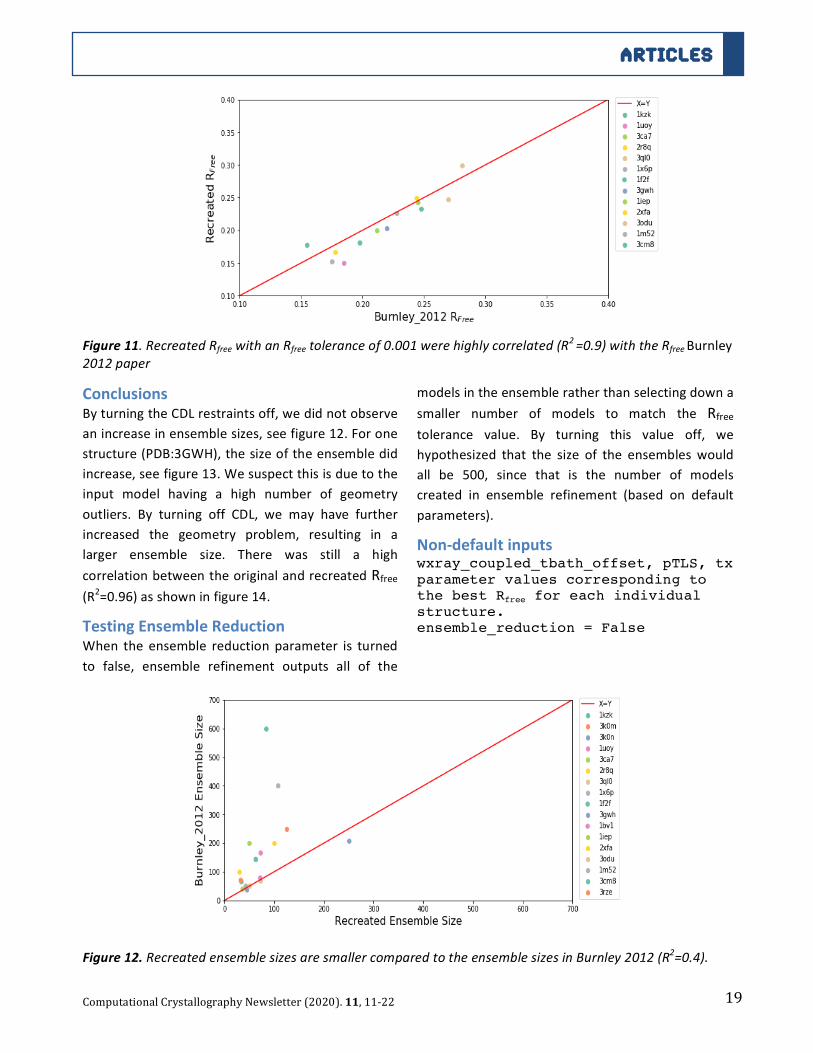
figure10.Figure11shows that theRfree correlationwas still observed between the recreation on the
Burnley2012paper.
RemovingConformationalDependentLibrary(CDL)In the Burnley 2012 paper, the default restraints
were Engh and Huber, butmore recent versions of
phenix use the conformation dependent library
(CDL). One hypothesis is that the older restraints
would bias ensembles to have energetically
17
reasonable angles and bond lengths compared to
the modern CDL restraints, leading the ensemble
sizes to decrease under CDL restraints. Therefore,
wesetthecdlrestraintlibrarytofalse.Ofnotethere
are three other library (omega_cdl, rdl, and hpdl)
thatarealsoavailableasparametersbut aresetas
falseasthedefault.
Non-defaultinputs(Phenixversion1.16)• Wxray_coupled_tbath_offset,
pTLS, tx parameter values corresponding to the best Rfree for each individual structure.
• restraints_library_cdl = False
Figure9.Burnley2012paperensemblesizecomparedtoourrecreatedensemblesizewithanRfreeTolerance
of0.001(R2=0.307).
Figure10.Recreatedensemblesizeswithensemble_rfree_tolerenceparameter=0.001aremostlylargerthan
theinitiallyrecreatedensemblesizes(R2=0.71).
19
ARTICLES
ComputationalCrystallographyNewsletter(2020).11,11-22
18
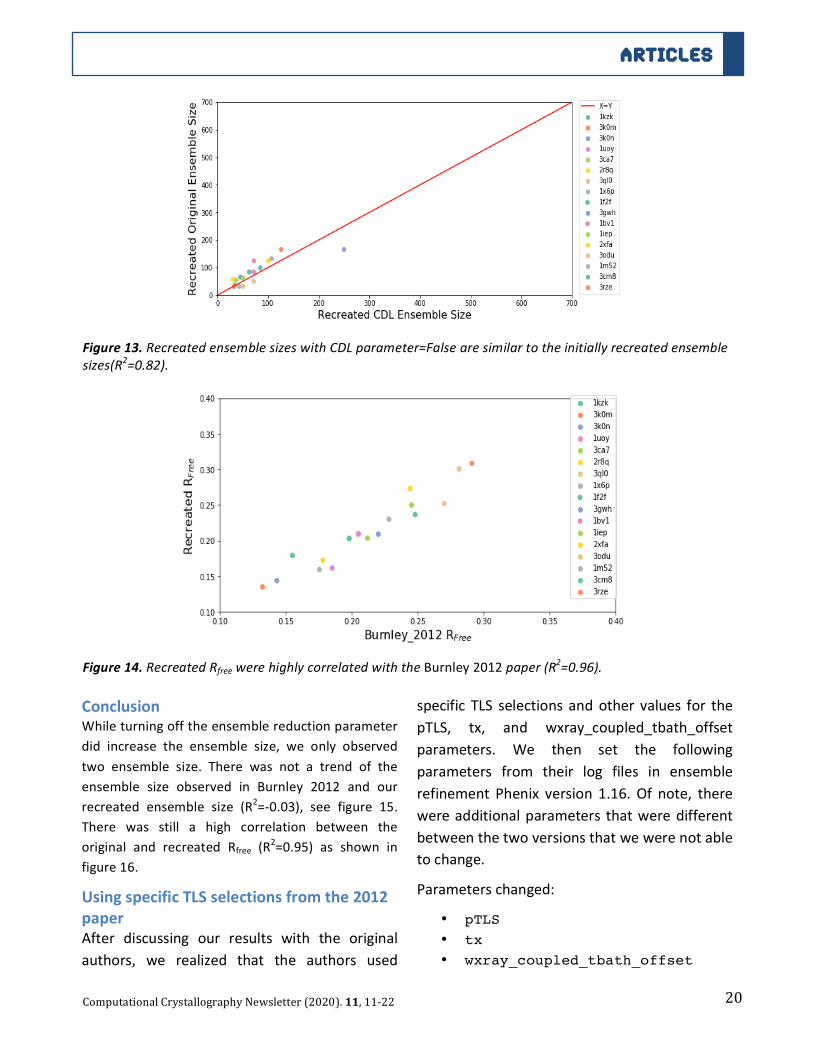
ConclusionsByturningtheCDLrestraintsoff,wedidnotobserve
anincreaseinensemblesizes,seefigure12.Forone
structure(PDB:3GWH),thesizeoftheensembledid
increase,seefigure13.Wesuspectthisisduetothe
input model having a high number of geometry
outliers. By turning off CDL, we may have further
increased the geometry problem, resulting in a
larger ensemble size. There was still a high
correlationbetweentheoriginalandrecreatedRfree
(R2=0.96)asshowninfigure14.
TestingEnsembleReductionWhen the ensemble reductionparameter is turned
to false, ensemble refinement outputs all of the
19
modelsintheensembleratherthanselectingdowna
smaller number of models to match the Rfree
tolerance value. By turning this value off, we
hypothesized that the size of the ensembleswould
all be 500, since that is the number of models
created in ensemble refinement (based on default
parameters).
Non-defaultinputswxray_coupled_tbath_offset, pTLS, tx parameter values corresponding to the best Rfree for each individual structure. ensemble_reduction = False
Figure11.RecreatedRfreewithanRfreetoleranceof0.001werehighlycorrelated(R2=0.9)withtheRfreeBurnley
2012paper
Figure12.RecreatedensemblesizesaresmallercomparedtotheensemblesizesinBurnley2012(R2=0.4).
20
ARTICLES
ComputationalCrystallographyNewsletter(2020).11,11-22
20
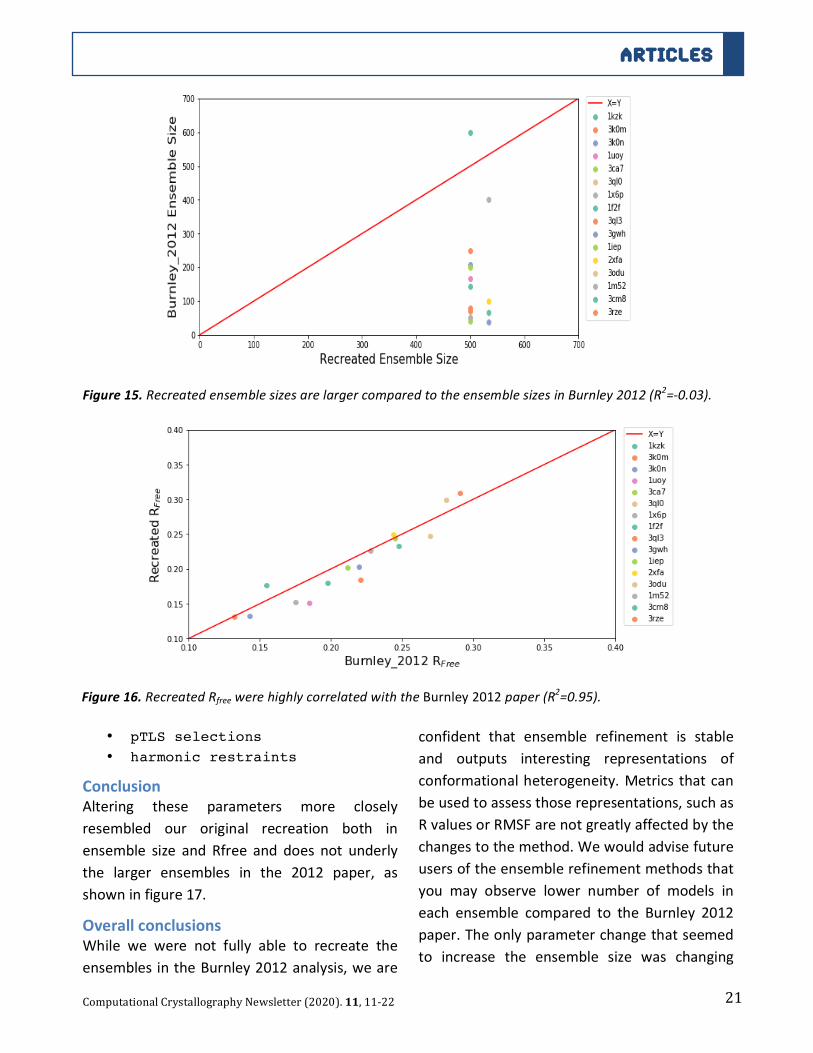
ConclusionWhileturningofftheensemblereductionparameter
did increase the ensemble size, we only observed
two ensemble size. There was not a trend of the
ensemble size observed in Burnley 2012 and our
recreated ensemble size (R2=-0.03), see figure 15.
There was still a high correlation between the
original and recreated Rfree (R2=0.95) as shown in
figure16.
UsingspecificTLSselectionsfromthe2012paperAfter discussing our results with the original
authors, we realized that the authors used
21
specific TLS selectionsand other values for the
pTLS, tx, and wxray_coupled_tbath_offset
parameters. We then set the following
parameters from their log files in ensemble
refinement Phenix version 1.16. Of note, there
wereadditionalparameters thatweredifferent
betweenthetwoversionsthatwewerenotable
tochange.
Parameterschanged:
• pTLS • tx • wxray_coupled_tbath_offset
Figure13.RecreatedensemblesizeswithCDLparameter=Falsearesimilartotheinitiallyrecreatedensemble
sizes(R2=0.82).
Figure14.RecreatedRfreewerehighlycorrelatedwiththeBurnley2012paper(R2=0.96).
21
ARTICLES
ComputationalCrystallographyNewsletter(2020).11,11-22
22
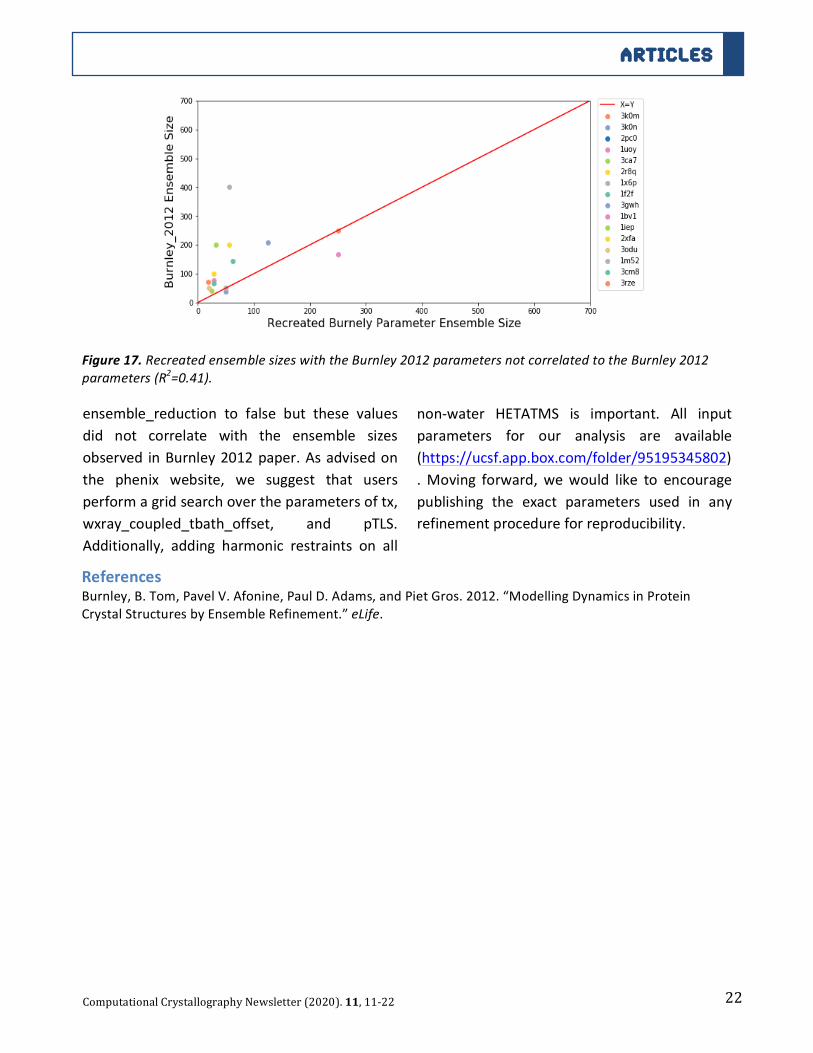
• pTLS selections • harmonic restraints
ConclusionAltering these parameters more closely
resembled our original recreation both in
ensemble size and Rfree and does not underly
the larger ensembles in the 2012 paper, as
showninfigure17.
OverallconclusionsWhile we were not fully able to recreate the
ensemblesintheBurnley2012analysis,weare
23
confident that ensemble refinement is stable
and outputs interesting representations of
conformationalheterogeneity.Metricsthatcan
beusedtoassessthoserepresentations,suchas
RvaluesorRMSFarenotgreatlyaffectedbythe
changestothemethod.Wewouldadvisefuture
usersoftheensemblerefinementmethodsthat
you may observe lower number of models in
each ensemble compared to the Burnley 2012
paper.Theonlyparameterchangethatseemed
to increase the ensemble size was changing
Figure15.RecreatedensemblesizesarelargercomparedtotheensemblesizesinBurnley2012(R2=-0.03).
Figure16.RecreatedRfreewerehighlycorrelatedwiththeBurnley2012paper(R2=0.95).
22
ARTICLES
ComputationalCrystallographyNewsletter(2020).11,11-22
24
ensemble_reduction to false but these values
did not correlate with the ensemble sizes
observed inBurnley2012paper.Asadvisedon
the phenix website, we suggest that users
performagridsearchovertheparametersoftx,
wxray_coupled_tbath_offset, and pTLS.
Additionally, adding harmonic restraints on all
25
non-water HETATMS is important. All input
parameters for our analysis are available
(https://ucsf.app.box.com/folder/95195345802)
.Moving forward, wewould like to encourage
publishing the exact parameters used in any
refinementprocedureforreproducibility.
26
ReferencesBurnley,B.Tom,PavelV.Afonine,PaulD.Adams,andPietGros.2012.“ModellingDynamicsinProteinCrystalStructuresbyEnsembleRefinement.”eLife.
Figure17.RecreatedensemblesizeswiththeBurnley2012parametersnotcorrelatedtotheBurnley2012
parameters(R2=0.41).