ccar: getting to the real objectivecdn2.content.compendiumblog.com/uploads/user/2f903… · ·...
TRANSCRIPT
An Experian white paper
CCAR: Getting to the Real Objective
Table of contentsExecutive summary ....................................................................................................................1
What is the purpose of CCAR? .................................................................................................1
How good are your reverse stress tests? ................................................................................4
Are you really ready? .................................................................................................................5
Are you prepared for a potential rapid crisis — what made the Great Recession “great?” ..........................................................................................................7
Implications for macro correlations and stress diversification from phases of the Great Recession .....................................................................................13
What’s wrong with traditional modeling and simulation processes, and how can they be improved? ............................................................................................17
Conclusion .................................................................................................................................21
About the author .......................................................................................................................22
About Experian’s Global Consulting Practice ......................................................................22
About Decision Analytics ........................................................................................................23
CCAR: Getting to the Real Objective
Page 1 | CCAR: Getting to the Real Objective
Executive summaryThis paper suggests that:
• Banks, reviewers and examiners can best actively manage the Comprehensive Capital Analysis and Review’s (CCAR) real objective with a clear dual strategy that includes both short-term and longer-term goals for stress-testing, modeling and system improvements.
• CCAR is not a redundant set of regulatory compliance exercises. Its effects on risk management include some demanding paradigm shifts from traditional approaches.
• Review of the macroeconomic facts around the Great Recession reveals some useful insights for bank extreme-risk scenario development, econometric modeling and stress simulations.
What is the purpose of CCAR?Many large banks have been under regulatory pressure to improve their loss forecasting models and stress testing. This work often centers on the model-based projections of stress losses and profitability associated with the Federal Reserve’s annual CCAR, popularly known as “the Fed stress test.” The number of banking institutions subject to this intensive scrutiny of stress-test projections has now widened this year to include all banks with assets of $10 billion or more.1
The largest banks must now undergo formalized stress testing at least twice a year — midsize and regional banks once a year. Stress tests have long been in use for risk management, and Basel II Pillar 1 requires stress tests. Although stress testing is not new, the intensity of the Fed’s CCAR involvement is, as is unprecedented information sharing about stress-loss forecasts. To “pass” CCAR stress test, banks must retain at least 5 percent tier 1 common equity-to-risk-based assets under the Fed’s severely adverse stress scenarios (and after the bank’s current planned capital actions).
Some observers have been concerned about the costs of these efforts:
“ The [Fed] capital stress tests … are too complex, costly, time-consuming and redundant. Bankers tell me this exercise takes ‘tens of thousands’ of man-hours.” — Barbara Rehm, American Banker Editor at Large, March 2012
1 CCAR applies to banks with assets of $50 billion or more. Similar rules for large midsize banks ($10 billion to $50 billion) and new Basel capital rules — which include stress testing needs for all larger, midsize and smaller banks — have significantly elevated the general banking focus on stress testing. Stress tests in CCAR stem from the Dodd-Frank Act, leading to their short description as DFAST (Dodd-Frank Act Stress Tests). “The primary difference between the Dodd-Frank Act supervisory stress tests and CCAR post-stress capital analysis is the capital action assumptions that are combined with these projections to estimate post-stress capital levels and ratios” (Federal Reserve, Comprehensive Capital Analysis and Review 2013: Assessment Framework and Results, March 2013, p.5).
CCAR: Getting to the Real Objective
An Experian white paper | Page 2
The Fed stress tests are an important benchmark in the evolving use of stress testing as a cornerstone risk-management tool. Despite some similarities with Basel, CCAR’s main aims are paradigm shifting. The tests provide an annual spur for broader bank stress testing encompassing the balance sheet including credit and liquidity and operational risk, greater integration of models and greater focus on extreme scenarios. However, in meeting these challenging and complex new modeling, system and testing needs, it is also important for banks, model reviewers and examiners not to lose the forest for the trees.
Now is a very appropriate time for intensive efforts around stress tests, though excessive focus on the details of the journey and not the destination could defeat the ultimate purpose. There are only a certain set of resources available to a typical bank, a certain set of data, and certain finite time windows available each year to achieve new modeling objectives, for example. In addition, these modeling and system objectives are not trivial or standard; they are ambitious.
Faced with a challenging set of objectives for stress-testing models and systems, many bank management teams need to step back during this process to frequently touch base with a seemingly simple cornerstone question: What is the real purpose of CCAR, and is this objective being met right now? A customized blend of short-term severe capital sufficiency tests and yearly progress through phases of a longer term plan for model and system improvements is critical. This dual approach can help bring confidence and order to this inherently challenging and complex process.
Despite exhaustive data and model building, testing, vetting and reviewing, a bank’s stress testing needs do not stop with any new set of CCAR-aimed models and systems built on data that spans the Great Recession and financial crisis. The needs also do not stop with passing the Fed stress test every year. More steps are needed to reach a larger set of objectives around CCAR’s ultimate purpose.
The ultimate objective of CCAR and other similar new capital regulations (including new Basel rules) is for banks to weather successfully the next and all future actual live severe stress scenario(s), particularly those of a magnitude that were previously capable of bringing down large banks and jeopardizing the system as a whole. Neither regulators nor rigor in historical-data modeling and reviews can substitute for the full details of every bank’s critical short-term and long-term leadership needs in this respect. If all of a bank’s current efforts around CCAR and other similar new regulations do not help to produce risk and capital management that ultimately proves out under “live fire” — whenever the next actual live stress scenario(s) may occur — then these efforts will be judged to have largely failed.
CCAR: Getting to the Real Objective
Page 3 | CCAR: Getting to the Real Objective
The keys to achieving CCAR’s ultimate purpose are demanding and multifaceted, but I would like to highlight three of these approaches here because, demanding as these needs are, in order to achieve best practice, many banks need to aim for more in these areas:
• Plausible and functional risk imagination — Beyond the traditional details of data, systems and model building, a bank should not neglect the need to think through a broad range of plausible extreme risk scenarios with disciplined development of actionable insight and conclusions. This means building, testing and simulating new models, systems and processes creatively, rigorously and flexibly for more complete and effective preparatory bank stress simulation and risk and capital management. The best practices in stress-risk planning include wide-ranging scenarios, new forms of simulation and model testing, and, ultimately, more insightful decision making — all directly linked.
• Balance with dynamic integrative risk management — More capital, by itself, is not necessarily conducive to lower stress risks. Higher equity capital demands a competitive return. If a bank takes on more levels of risk to achieve these returns in order to maintain or grow capital, what is the total effect on the bank’s stress-risk profile? And in what ways, and to what extent on extreme stress paths, do unclear elevations of credit risk and/or operational or other risks impact liquidity risks, as was seen during the recent financial crisis? Simply assuming that recent tight credit standards will remain fully in place is not realistic in light of traditional competitive growth pressures and other countervailing regulatory pressures. Therefore, why not simulate the effects of managed higher-risk shifts in the portfolio distribution? This can provide key insights for both stress-test robustness and properly controlled growth.2
• Leading indicators in loss forecasting — Even more challenging is the need to meet new regulatory calls, under Dodd-Frank and Basel III, for counter-cyclical capital. Here again, the lessons from the financial crisis were stark, but point-in-time models that simply reflect the exogenous macroeconomic variables in the Fed’s stress scenarios are not sufficient tools to help achieve this dynamic capital purpose. Leading indicators in loss forecasting models are needed, but a careful review of the events leading up to the full-on panic stage of the financial crisis, as discussed further below, also suggests that this is a particularly challenging modeling and risk-simulation problem.
2 This is a suggested need for fuller stress simulation, not lower capital. The relationship between capital, required returns and other regulatory and social pressures on banks — perhaps especially for larger banks — is complex.
CCAR: Getting to the Real Objective
An Experian white paper | Page 4
How good are your reverse stress tests?The Dodd-Frank stress tests under CCAR, which are extreme, are best viewed as the Fed’s attempt at a generic reverse stress test — a general “break the bank” scenario.3 If a bank, in addition to CCAR/DFAST-scenario modeling and stress forecasting, is not also deploying extensive resources on developing, integrating and testing its own fulsome set of bank-customized, idiosyncratic extreme-risk scenarios, then it is likely missing several of the larger points behind CCAR.
• What combinations of plausible extreme stress events could bring down your bank?
• How many of these plausible extreme-risk events are there?
• Which of these extreme scenarios are most important, most likely and/or most severe?
• How can these be effectively integrated into new models and systems?
• Does the nature of these plausible extremes require new types of analytic stress testing?
Improved stress-risk management should include not just new historically based models and “Fed-like” internal stress scenarios, but extensively developed and functionally integrated customized internal scenarios reflecting each bank’s set of plausibly real and significant stress threats.
An unfortunate side effect of most large banks passing the Fed stress tests each year may be complacency, with too much reliance on a single annual regulatory stress test used by all. Just as nature abhors a vacuum, stress failure risks develop in the weak spots around uniform testing procedures. Banks need to ask a broad range of tough and customized “what if?” questions. Regulators are not all-knowing, and the Fed stress tests are best viewed as a general starting template.
3 Basel Committee on Banking Supervision, Consultative Document, Principles for sound stress testing practices and supervision, May 2009 (pp. 12, 18–19, 22).
CCAR: Getting to the Real Objective
Page 5 | CCAR: Getting to the Real Objective
Are you really ready? Over the past 50-plus years, some significant financial event — a new Gross Domestic Product (GDP) recession or similar — has occurred about every five years on average, with 10 years at the most between events. This seems driven by certain repeated economic behaviors, which morph into different variants over time.
It is hard to argue against the high probability of some significant adverse financial event within the next three to five years. Obviously we don’t know the “when,” we don’t know the “what,” and we certainly don’t know the “how bad.” And of course new, higher levels of bank capital and other protections and lessons learned from the financial crisis provide new levels of preparedness. On the other hand, even as the increasingly robust U.S. economic recovery has continued, unemployment, the work-through of “overhang” foreclosures and mortgage losses, and structural disparities remain relatively elevated. This leaves certain vulnerabilities and shortfalls in general economic confidence. With the pretty strong likelihood that something significantly adverse and perhaps largely unexpected will occur relatively soon, now is a very appropriate time for intensive focused efforts on stress testing.
This viewpoint on the long historical patterns brings a related question to mind: Are current intensive regulatory efforts aimed at higher capital requirements an attempt to roughly achieve something that current bank models and loss forecasts are not typically very capable of? If most bank loss forecasts and linked balance sheet accounting systems could better predict the need for more countercyclical capital — no small feat — then the regulatory sledgehammer might indeed become more redundant. But, this is not generally so today. Better models and systems may help in the long run, but the more general short-term solution may be higher judgmental, rigorous and well-documented reserve setting.4
Ten years ago, concerns were already raised about a growing general home-price bubble. Today the world is different with new growing risk patterns and concerns. If you believe that many “crises” are precipitated by warning signs, there certainly are a number of plausible extreme scenarios to consider. How about a cascading series of panic-inducing shocks or events sparked by an impactful cyber-terrorist attack, for example, or some other series of information-system failures? Enough warning signs are evident today in this broad area of risk to place it at the top of many lists, including the Office of the Comptroller of the Currency (OCC) ranking such risk concerns very high.5
Let’s not forget the role of the media in any panic-inducing scenarios that may be of the highest relevance for your bank. Certainly there was ample evidence of this during the 2008 financial panic. When crisis sells as a media event in today’s instant-information age, it tends to unleash self-fulfilling channels of financial momentum.
4 Ludwig, Eugene A., and Volcker, Paul A., “Bank Reform Takes One Flawed Step Forward,” Wall Street Journal, 1/18/2013. For a discussion with measures of the capital differences between larger and smaller banks, see Hoenig, Thomas M., “Basel III Capital: A Well-Intended Illusion,” April 9, 2013, International Association of Deposit Insurers 2013 Research Conference, Basel, Switzerland.
5 See, e.g., Semiannual Risk Perspective, Spring 2013, Office of the Comptroller of the Currency.
CCAR: Getting to the Real Objective
An Experian white paper | Page 6
Is your bank painstakingly working through and empirically simulating a range of extreme risk scenarios of this nature and their plausible specific-market and broader macroeconomic impacts, then taking these scenarios into your model simulations and stress-model robustness testing?
In a related example, in 1968 the Royal Dutch Shell oil company began to “reperceive” its future, following the lead of a new group planning team. One plausibly extreme scenario imagined by this team (and played out for management) was the likely possibility of the oil-rich nations effectively becoming a cartel and creating a spike in the world oil price. As a result, Royal Dutch Shell wound up much better prepared than other oil companies when the first oil-price shock from the Organization of Petroleum-Exporting Countries (OPEC) cartel ultimately hit the world economy in 1973.6 With today’s computing power eons ahead of where it was in 1968, is your bank using a robust set of scenario analytics to perceive a full range of your organization’s possible and adjudged likely futures?
Arguably, every bank should have such a team dedicated to risk imagination, rigorous evaluation and scenario building that is well thought out around plausible threats against the bank. This team, while maintaining confidentiality, should not work in isolation. It should communicate and interact directly with CCAR (and Basel) loss-forecast modelers and associated capital risk managers. It may be a more or less in-depth process to trace through the full empirical stress-risk implications of these future plausible extremes and to simulate their full economic and portfolio ramifications across the balance sheet in robustness tests for models and capital.
To be sure, with multiple parties and scenarios involved, these efforts can become complex. Sound management requires balanced overall objectives and clear timelines and deadlines in overall stress-risk planning — not only longer term improved systems and simulations, but shorter term preparedness is critical. A partially developed new view (including judgment) of some plausible extreme that subsequently materializes will likely be better than no prior view at all. And in subsequent hindsight, even partial visualizations of the realized scenario will likely have been better resource time spent than over-engineered views of many other alternative scenarios.
6 This is described in Schwartz, Peter, The Art of the Long View (1991). I thank Leonard Roseman of Capital One for this story and reference.
CCAR: Getting to the Real Objective
Page 7 | CCAR: Getting to the Real Objective
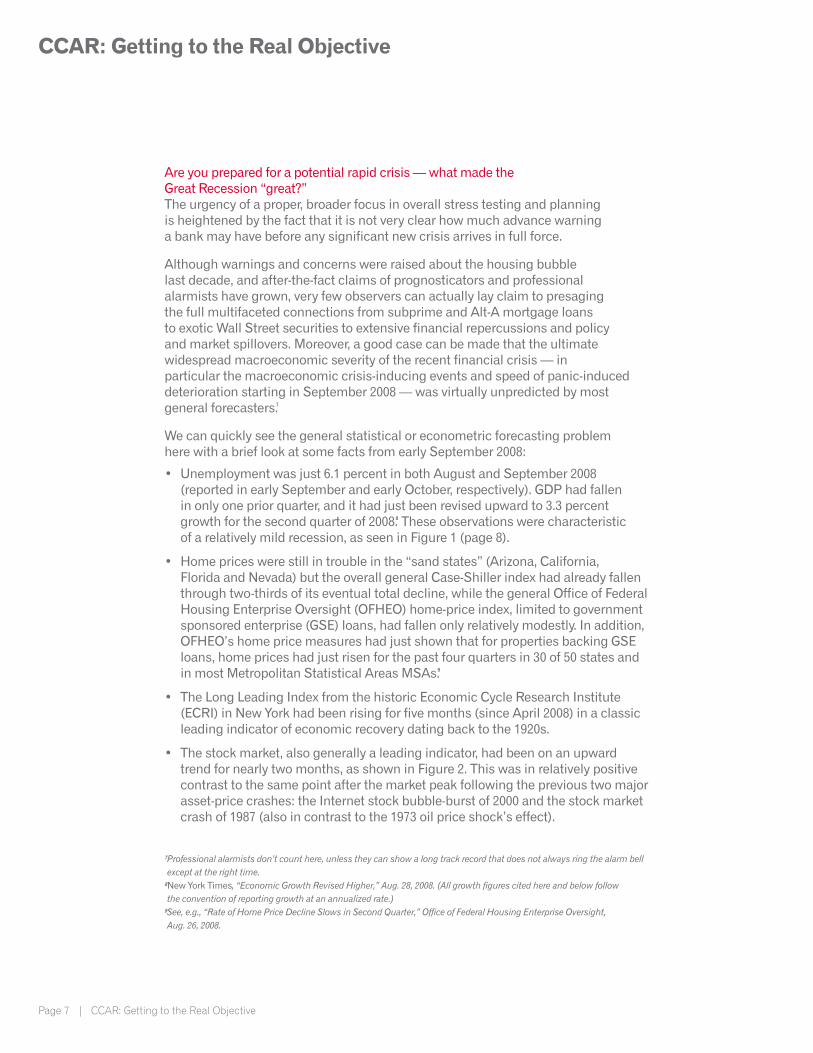
Are you prepared for a potential rapid crisis — what made the Great Recession “great?”The urgency of a proper, broader focus in overall stress testing and planning is heightened by the fact that it is not very clear how much advance warning a bank may have before any significant new crisis arrives in full force.
Although warnings and concerns were raised about the housing bubble last decade, and after-the-fact claims of prognosticators and professional alarmists have grown, very few observers can actually lay claim to presaging the full multifaceted connections from subprime and Alt-A mortgage loans to exotic Wall Street securities to extensive financial repercussions and policy and market spillovers. Moreover, a good case can be made that the ultimate widespread macroeconomic severity of the recent financial crisis — in particular the macroeconomic crisis-inducing events and speed of panic-induced deterioration starting in September 2008 — was virtually unpredicted by most general forecasters.7
We can quickly see the general statistical or econometric forecasting problem here with a brief look at some facts from early September 2008:
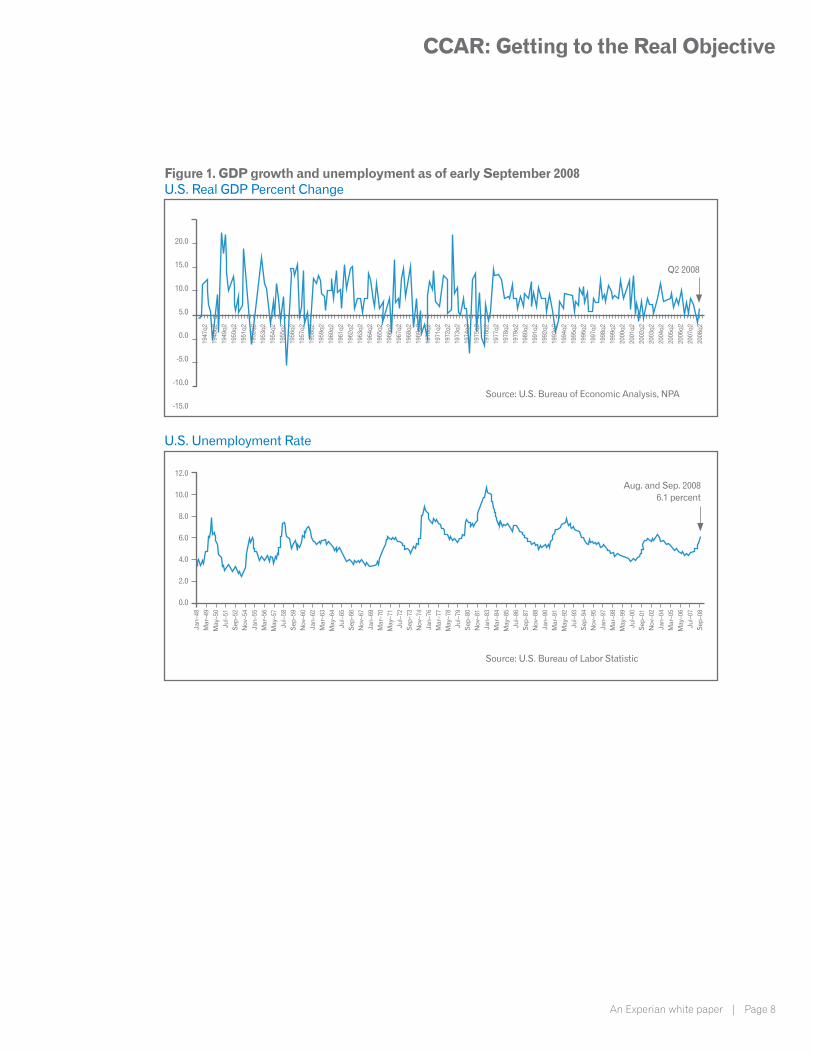
• Unemployment was just 6.1 percent in both August and September 2008 (reported in early September and early October, respectively). GDP had fallen in only one prior quarter, and it had just been revised upward to 3.3 percent growth for the second quarter of 2008.8 These observations were characteristic of a relatively mild recession, as seen in Figure 1 (page 8).
• Home prices were still in trouble in the “sand states” (Arizona, California, Florida and Nevada) but the overall general Case-Shiller index had already fallen through two-thirds of its eventual total decline, while the general Office of Federal Housing Enterprise Oversight (OFHEO) home-price index, limited to government sponsored enterprise (GSE) loans, had fallen only relatively modestly. In addition, OFHEO’s home price measures had just shown that for properties backing GSE loans, home prices had just risen for the past four quarters in 30 of 50 states and in most Metropolitan Statistical Areas MSAs.9
• The Long Leading Index from the historic Economic Cycle Research Institute (ECRI) in New York had been rising for five months (since April 2008) in a classic leading indicator of economic recovery dating back to the 1920s.
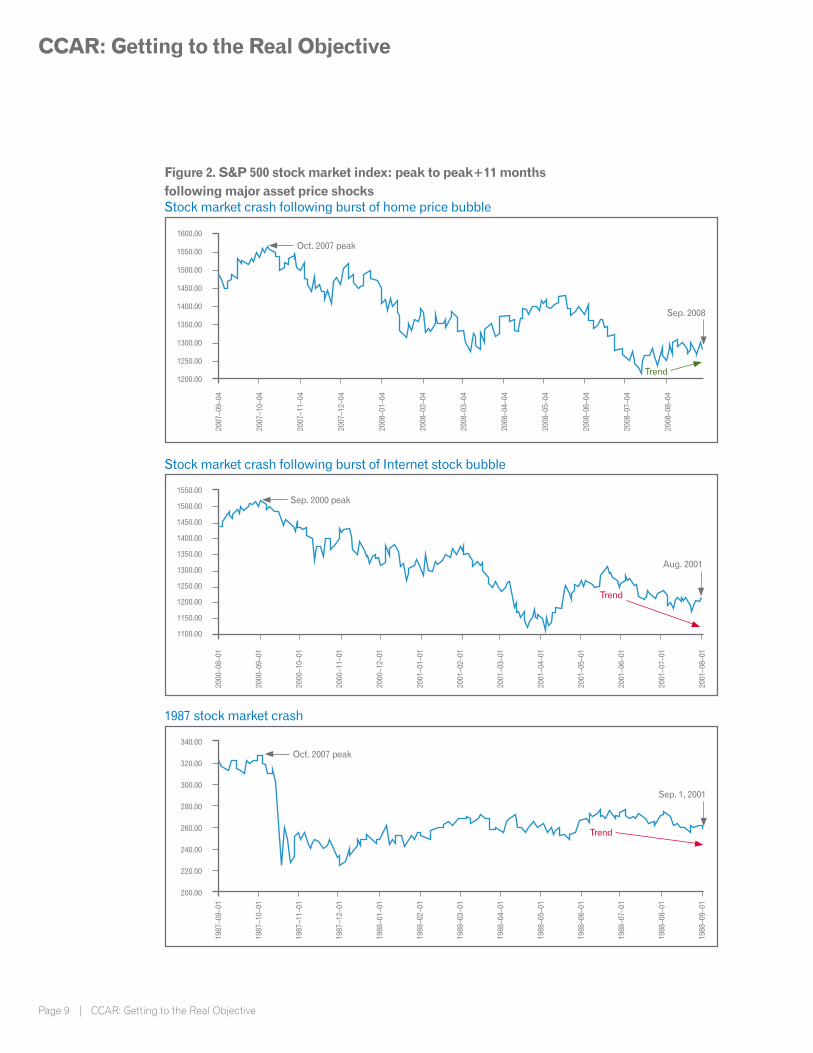
• The stock market, also generally a leading indicator, had been on an upward trend for nearly two months, as shown in Figure 2. This was in relatively positive contrast to the same point after the market peak following the previous two major asset-price crashes: the Internet stock bubble-burst of 2000 and the stock market crash of 1987 (also in contrast to the 1973 oil price shock’s effect).
7 Professional alarmists don’t count here, unless they can show a long track record that does not always ring the alarm bell except at the right time.
8 New York Times, “Economic Growth Revised Higher,” Aug. 28, 2008. (All growth figures cited here and below follow the convention of reporting growth at an annualized rate.)
9 See, e.g., “Rate of Home Price Decline Slows in Second Quarter,” Office of Federal Housing Enterprise Oversight, Aug. 26, 2008.
CCAR: Getting to the Real Objective
An Experian white paper | Page 8
Figure 1. GDP growth and unemployment as of early September 2008U.S. Real GDP Percent Change
U.S. Unemployment Rate
12.0
10.0
8.0
6.0
4.0
2.0
0.0
Jan–
48M
ar–4
9M
ay–5
0Ju
l–51
Sep
–52
Nov
–54
Jan–
55M
ar–5
6M
ay–5
7Ju
l–58
Sep
–59
Nov
–60
Jan–
62M
ar–6
3M
ay–6
4Ju
l–65
Sep
–66
Nov
–67
Jan–
69M
ar–7
0M
ay–7
1Ju
l–72
Sep
–73
Nov
–74
Jan–
76M
ar–7
7M
ay–7
8Ju
l–79
Sep
–80
Nov
–81
Jan–
83M
ar–8
4M
ay–8
5Ju
l–86
Sep
–87
Nov
–88
Jan–
90M
ar–9
1M
ay–9
2Ju
l–93
Sep
–94
Nov
–95
Jan–
97M
ar–9
8M
ay–9
9Ju
l–00
Sep
–01
Nov
–02
Jan–
04M
ar–0
5M
ay–0
6Ju
l–07
Sep
–08
Source: U.S. Bureau of Labor Statistic
Aug. and Sep. 20086.1 percent
20.0
15.0
10.0
5.0
0.0
-5.0
-10.0
-15.0
1947
q2
1948
q219
49q2
1950
q219
51q2
1952
q219
53q2
1954
q219
55q2
1956
q219
57q2
1958
q219
59q2
1960
q219
61q2
1962
q219
63q2
1964
q219
65q2
1966
q219
67q2
1968
q219
69q2
1970
q219
71q2
1972
q219
73q2
1974
q219
75q2
1976
q219
77q2
1978
q219
79q2
1980
q219
91q2
1992
q219
93q2
1994
q219
95q2
1996
q219
97q2
1998
q219
99q2
2000
q220
01q2
2002
q220
03q2
2004
q220
05q2
2006
q220
07q2
2008
q2
Source: U.S. Bureau of Economic Analysis, NPA
Q2 2008
CCAR: Getting to the Real Objective
Page 9 | CCAR: Getting to the Real Objective
Figure 2. S&P 500 stock market index: peak to peak+11 months following major asset price shocksStock market crash following burst of home price bubble
Stock market crash following burst of Internet stock bubble
1987 stock market crash
1600.00
1550.00
1500.00
1450.00
1400.00
1350.00
1300.00
1250.00
1200.00
2007
–09–
04
2007
–10–
04
2007
–11–
04
2007
–12–
04
2008
–01–
04
2008
–02–
04
2008
–03–
04
2008
–04–
04
2008
–05–
04
2008
–06–
04
2008
–07–
04
2008
–08–
04
1550.00
1500.00
1450.00
1400.00
1350.00
1300.00
1250.00
1200.00
1150.00
1100.00
340.00
320.00
300.00
280.00
260.00
240.00
220.00
200.00
2000
–08–
01
2000
–09–
01
2000
–10–
01
2000
–11–
01
2000
–12–
01
2001
–01–
01
2001
–02–
01
2001
–03–
01
2001
–04–
01
2001
–05–
01
2001
–06–
01
2001
–07–
01
2001
–08–
01
1987
–09–
01
1987
–10–
01
1987
–11–
01
1987
–12–
01
1988
–01–
01
1988
–02–
01
1988
–03–
01
1988
–04–
01
1988
–05–
01
1988
–06–
01
1988
–07–
01
1988
–08–
01
1988
–09–
01
Sep. 2008
Oct. 2007 peak
Trend
Sep. 2000 peak
Aug. 2001
Trend
Oct. 2007 peak
Sep. 1, 2001
Trend
CCAR: Getting to the Real Objective
An Experian white paper | Page 10
Yes, these were all observed facts in early September 2008. Although I had no professional role in macroeconomic or home-price forecasting at that time, looking carefully at these historical facts now, it is hard to be unsympathetic to the general forecasting ignorance about what would come next. Not only had the overall macroeconomic recession to that point in September 2008 been a relatively mild one, there were some pretty positive signs that the recession seemed to be stabilizing or ending.
Many observers now seem to have largely (or conveniently) forgotten these facts because we all know (now, of course) what happened next. Hindsight is always 20/20 — more important for today’s forecasters, what do these carefully examined past facts say about the value of general leading economic indicators?
To be sure, there were other more esoteric negative financial indicators at that time emanating from the problems on Wall Street (still recovering from the collapse of private-label MBS/ABS that began in summer 2007). In the wake of the bursting of the home-price bubble, the economy was arguably very fragile (especially around certain particular financial-market expectations). More important perhaps, there were also policy actions taking place on Wall Street and in Washington, D.C. A critical “forensic” question now is: How exactly did those adverse financial-market indicators, with limited macroeconomic impacts by themselves, subsequently spill over, very quickly, into a full-on widespread panic and macroeconomic crisis?
Within one to three weeks in September 2008, the economy entered a historically massive broad-based macroeconomic slide. For the economy overall and its impacts across bank asset classes, instead of an economic recovery, many factors devolved to worse extremes very quickly, approaching (and in some ways surpassing) Depression-era financial and general market behavior. Real GDP and the stock market cratered, unemployment soared to more than 10 percent, and home prices turned down more sharply again to a renewed second phase of severe decline. How and why did this happen? What launched the September 2008 financial panic, which then so quickly spilled over into a general macroeconomic loss of confidence and broadly adverse and dangerous real market factors across the diverse macro economy? Was this an inevitable economic consequence of the fragile state of certain linked financial markets and general market confidence at the time?
Or, because the fundamental macro economy was (and is) inherently more stable than that (even then, in early September 2008, as suggested by the data cited above), was this actually more of a product of institutional forces (including the instant media age) and policy errors? Many observers here point to the failure of Lehman Brothers, etc., and surrounding prior and subsequent policy actions, but there are various unsettled questions.10
10 Events include the government takeover of Fannie Mae and Freddie Mac that wiped out shareholders (Sept. 6), the bankruptcy of Lehman Brothers (Sept. 13), the near collapse and corporate takeovers of Washington Mutual, Wachovia and Merrill Lynch, the bailout of AIG, and extreme market and government actions over the following weeks and months (with delays in Congress), etc., all amplified by extensive media coverage and commentary.
CCAR: Getting to the Real Objective
Page 11 | CCAR: Getting to the Real Objective
Most discussions around bank capital regulations today (and no small amount of claims by various economists) seem simply to assume that the unprecedented macroeconomic slide launched by the events of September 2008 stemmed from exogenous macroeconomic forces that were an inevitable consequence of the home-price crash and the financial crisis wrought by shoddy maintenance of lending standards undergirding exotic and opaque Wall Street financial instruments. But, in fact, as we’ve just seen, the general shape of a mild recession to that critical point in 2008 and developing positive economic indicators at that time suggests otherwise. The underlying overall macro economy may simply not have been as fundamentally “fragile” at that time as has now come to be quite popularly believed. This underlying fundamental strength of the U.S. economy certainly appears to be back more fully today even though, on the other hand, a great deal of macroeconomic damage was done (with widespread damage to economic confidence) following the events of September 2008.
If institutional forces and unintentionally volatile policy responses were indeed critical factors in September 2008, shouldn’t banks’ extreme plausible scenarios and simulations also consider the interactions between various markets, the macro economy and the likelihood of risky forces again shaping future policy responses with unintended consequences? The events of 2008 were actually not the first episode in which government’s uncertain large policy steps in the face of difficult financial-market circumstances seem to have had enormous unintended macroeconomic consequences. The only other recession since the Great Depression that has seen unemployment exceed 10 percent was in 1982, and the depth of that recession, it has been argued, was not intended by the Fed’s tight monetary policy at that time. The Fed wanted to “wring” high inflation out of the economy, not “shock” it out; however, an unexpected shift in money velocity did not cooperate.11 “Managing” the macro economy under stressful financial-market conditions is inherently difficult, to say the least.
If 2008 was actually a second postwar-recession example of well-intended but impactful government missteps driving unemployment greater than 10 percent, this historical record suggests a pattern that well could be repeated among future plausible extreme scenarios. In the vernacular of Nassim Taleb’s “black swan theory,” 12 while hard to predict in its exact future shape, government may be the gorilla black swan.
This goes well beyond the simple exogenously given macroeconomic variables published each year in the Fed stress test scenarios. But, these are not small or academic questions today. For broadly reasoned bank loss forecasting, scenario stress testing and capital risk management that ultimately proves out (with proper balance) to succeed against “unforeseeable” stress risks faced by banks today, these kinds of considerations by bank senior management may prove to be crucial.
11 See Tatom, John A., “Was the 1982 Velocity Decline Unusual?” Federal Reserve Bank of St. Louis Review, August/September 1983.
12 Taleb, Nassim Nicholas, Fooled By Randomness, 2001, and The Black Swan: The Impact of the Highly Improbable (1st ed.). London: Penguin, 2007.
CCAR: Getting to the Real Objective
An Experian white paper | Page 12
Various banks and observers have called the Fed’s severely adverse stress scenarios — fashioned after the 2008 to 2009 crisis events — extreme. Let’s all hope that this remains an apt description for a good long time. A truly thorough bank stress-testing process, however, now has to imagine plausible future worst-case risk scenarios that could somehow cause a massive, broad-based and relatively sudden — largely unexpected, at least in magnitude — general macroeconomic full-on crisis of some similar kind. Or, for certain large bank assets or for smaller local or regional banks a more localized worst-case crisis with similarly severe consequences may very well be relevant on particular plausible extreme paths.
Finally, in this vein, apart from the unprecedented speed of the macroeconomic decline launched in September 2008, it is worth asking: What was the key general driving force that made the Great Recession “great?” I would suggest that it was probably not the preceding home-price bubble and collapse — the general market correction here was two-thirds over in September 2008, and the last third may never have happened without the widespread panic launched at that time. Although very important in establishing fragile conditions, the much ballyhooed financial crisis on Wall Street, by itself, was probably not the key driving force either at the overall macroeconomic level. My view is this: The essence of the macroeconomic crisis (in GDP and unemployment) was widespread financial-market, business and public/consumer perception of dangerous “unmanaged” events spiraling out of control. This included profoundly impactful realizations that traditionally trusted system safeguards were either lacking or insufficient. In short, the full-on macroeconomic crisis was largely driven by widespread fear. This is what truly made the Great Recession great. It may prove to be crucial for bank stress planners to trace through alternative plausible future extreme scenarios where the same general principles of fear-driven economic crisis may someday (sooner or later) again be launched.
CCAR: Getting to the Real Objective
Page 13 | CCAR: Getting to the Real Objective
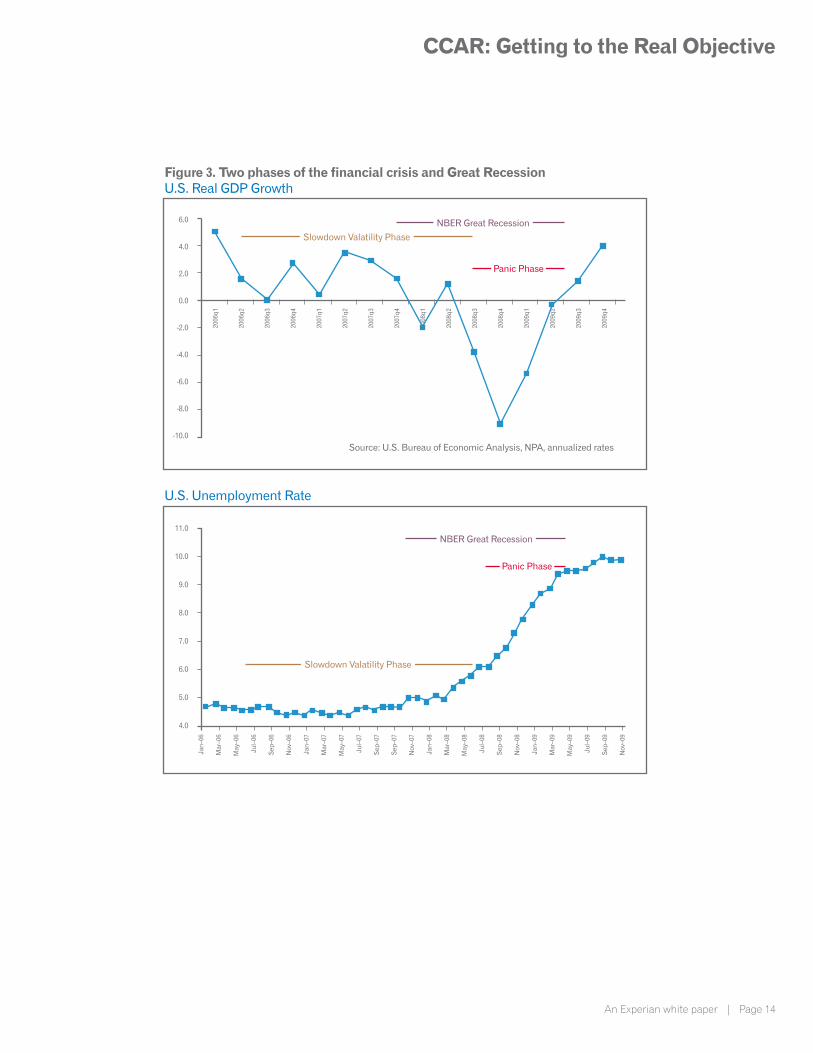
Implications for macro correlations and stress diversification from phases of the Great RecessionFor stress tests and economic capital estimates, the Great Recession and associated financial crisis have now become common benchmarks. But, there are pitfalls here in data usage. The National Bureau of Economic Research (NBER) officially dates the Great Recession from December 2007 to June 2009; however, as suggested above, this full economic downturn contains two quite different phases (also with an earlier start, in some respects), as summarized in Figure 3. The Fed’s severely adverse scenarios correspond to the second phase.
The first phase of the financial crisis, which can be called the “slowdown volatility phase,” did not generate a severe overall macroeconomic “crisis.” This phase began with the bursting of the home-price bubble in mid-2006 (some areas continued to rise into 2007) before the start of the official recession. The resulting large home-price correction spurred the collapse of “private-label” mortgage- and asset-backed securitization beginning in August 2007 — also before the start of the official recession.
Private-label subprime and Alt-A Wall Street mortgage finance had been undermined by several other problems (weakened appraisals and underwriting, exotic financial instruments and opaqueness creating market uncertainty). With subprime and Alt-A loans comprising more than half of new mortgages, and housing speculation as the home-price bubble inflated, the subsequent sharp home-price decline catalyzed and sealed the demise of private-label securitization. As of late August 2008, the broad Case-Shiller index was two-thirds of the way through its total ultimate decline, but the OFHEO home price index at that point (limited to Fannie Mae and Freddie Mac loans) was only about one-third through its eventual total decline. The home values backing subprime and Alt-A mortgages fell most sharply first.
CCAR: Getting to the Real Objective
An Experian white paper | Page 14
Figure 3. Two phases of the financial crisis and Great RecessionU.S. Real GDP Growth
U.S. Unemployment Rate
11.0
10.0
9.0
8.0
7.0
6.0
5.0
4.0
6.0
4.0
2.0
0.0
-2.0
-4.0
-6.0
-8.0
-10.0
2006
q1
2006
q2
2006
q3
2006
q4
2007
q1
2007
q2
2007
q3
2007
q4
2008
q1
2008
q2
2008
q3
2008
q4
2009
q1
2009
q2
2009
q3
2009
q4
Jan–
06
Mar
–06
May
–06
Jul–
06
Sep
–06
Nov
–06
Jan–
07
Mar
–07
May
–07
Jul–
07
Sep
–07
Sep
–07
Nov
–07
Jan–
08
Mar
–08
May
–08
Jul–
08
Sep
–08
Nov
–08
Jan–
09
Mar
–09
May
–09
Jul–
09
Sep
–09
Nov
–09
Slowdown Valatility Phase
NBER Great Recession
Panic Phase
Slowdown Valatility Phase
NBER Great Recession
Panic Phase
Source: U.S. Bureau of Economic Analysis, NPA, annualized rates
CCAR: Getting to the Real Objective
Page 15 | CCAR: Getting to the Real Objective
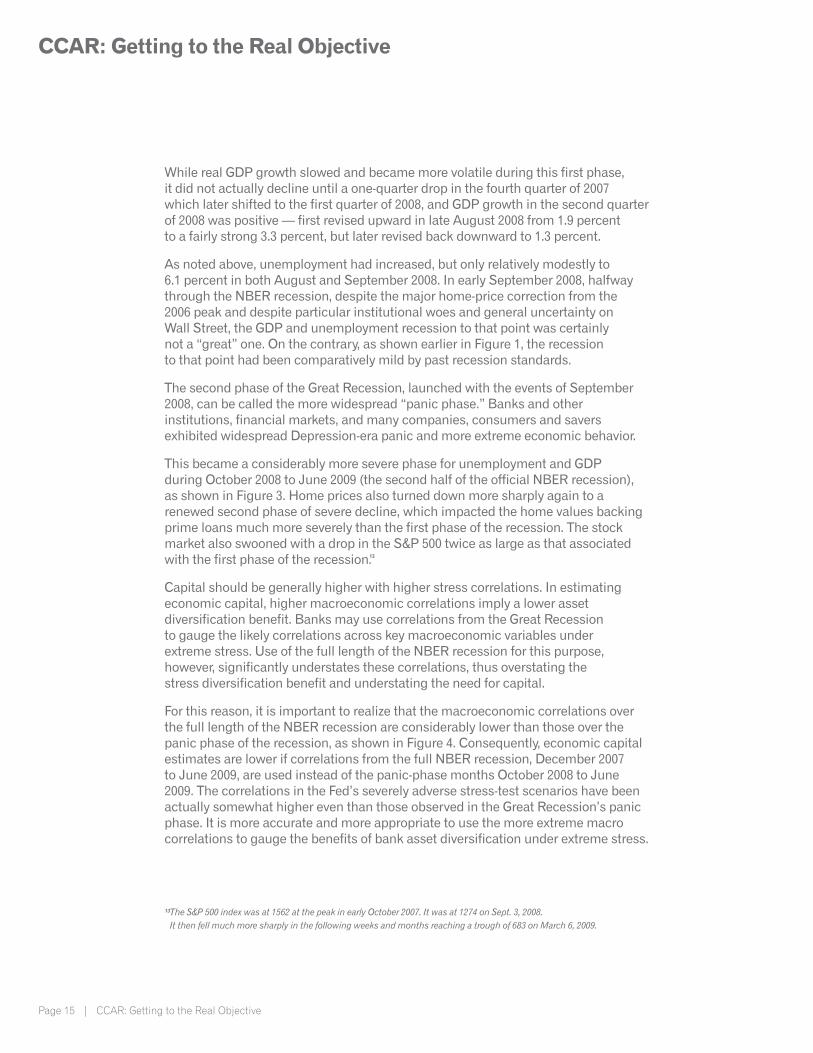
While real GDP growth slowed and became more volatile during this first phase, it did not actually decline until a one-quarter drop in the fourth quarter of 2007 which later shifted to the first quarter of 2008, and GDP growth in the second quarter of 2008 was positive — first revised upward in late August 2008 from 1.9 percent to a fairly strong 3.3 percent, but later revised back downward to 1.3 percent.
As noted above, unemployment had increased, but only relatively modestly to 6.1 percent in both August and September 2008. In early September 2008, halfway through the NBER recession, despite the major home-price correction from the 2006 peak and despite particular institutional woes and general uncertainty on Wall Street, the GDP and unemployment recession to that point was certainly not a “great” one. On the contrary, as shown earlier in Figure 1, the recession to that point had been comparatively mild by past recession standards.
The second phase of the Great Recession, launched with the events of September 2008, can be called the more widespread “panic phase.” Banks and other institutions, financial markets, and many companies, consumers and savers exhibited widespread Depression-era panic and more extreme economic behavior.
This became a considerably more severe phase for unemployment and GDP during October 2008 to June 2009 (the second half of the official NBER recession), as shown in Figure 3. Home prices also turned down more sharply again to a renewed second phase of severe decline, which impacted the home values backing prime loans much more severely than the first phase of the recession. The stock market also swooned with a drop in the S&P 500 twice as large as that associated with the first phase of the recession.13
Capital should be generally higher with higher stress correlations. In estimating economic capital, higher macroeconomic correlations imply a lower asset diversification benefit. Banks may use correlations from the Great Recession to gauge the likely correlations across key macroeconomic variables under extreme stress. Use of the full length of the NBER recession for this purpose, however, significantly understates these correlations, thus overstating the stress diversification benefit and understating the need for capital.
For this reason, it is important to realize that the macroeconomic correlations over the full length of the NBER recession are considerably lower than those over the panic phase of the recession, as shown in Figure 4. Consequently, economic capital estimates are lower if correlations from the full NBER recession, December 2007 to June 2009, are used instead of the panic-phase months October 2008 to June 2009. The correlations in the Fed’s severely adverse stress-test scenarios have been actually somewhat higher even than those observed in the Great Recession’s panic phase. It is more accurate and more appropriate to use the more extreme macro correlations to gauge the benefits of bank asset diversification under extreme stress.
13 The S&P 500 index was at 1562 at the peak in early October 2007. It was at 1274 on Sept. 3, 2008. It then fell much more sharply in the following weeks and months reaching a trough of 683 on March 6, 2009.
CCAR: Getting to the Real Objective
An Experian white paper | Page 16
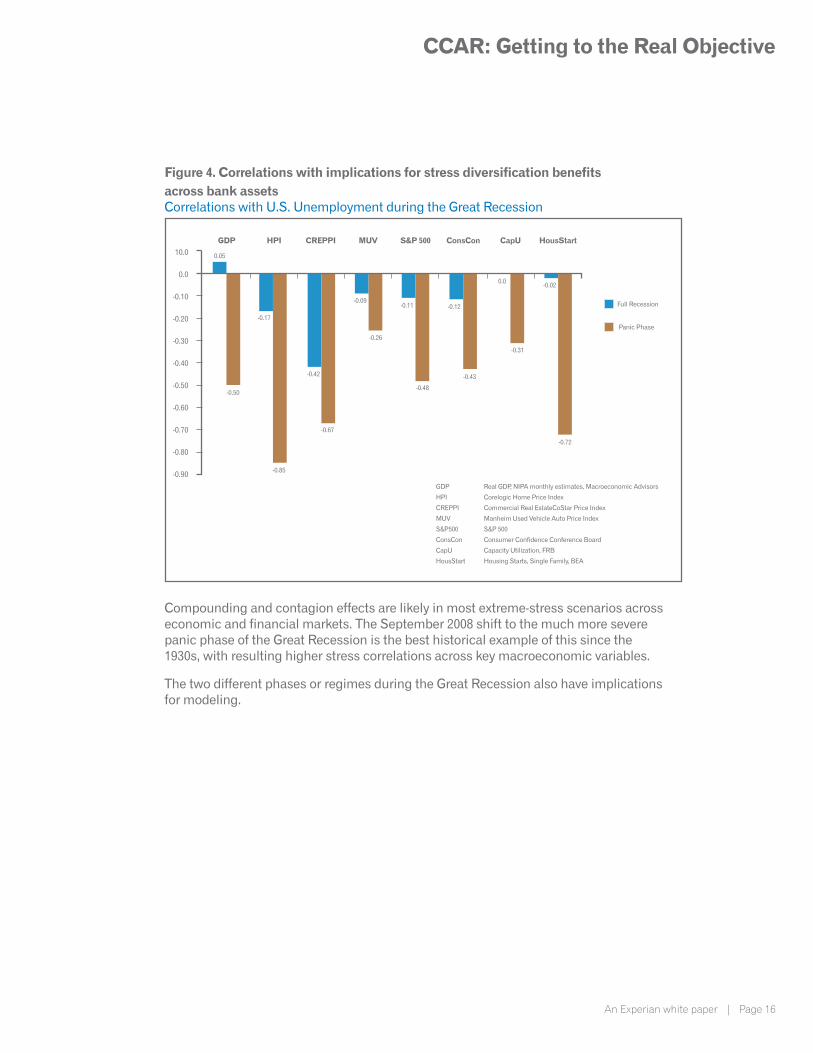
Figure 4. Correlations with implications for stress diversification benefits across bank assetsCorrelations with U.S. Unemployment during the Great Recession
Compounding and contagion effects are likely in most extreme-stress scenarios across economic and financial markets. The September 2008 shift to the much more severe panic phase of the Great Recession is the best historical example of this since the 1930s, with resulting higher stress correlations across key macroeconomic variables.
The two different phases or regimes during the Great Recession also have implications for modeling.
10.0
0.0
-0.10
-0.20
-0.30
-0.40
-0.50
-0.60
-0.70
-0.80
-0.90
GDP HPI CREPPI MUV S&P 500 ConsCon CapU HousStart
0.05
-0.50
-0.17
-0.85
-0.42
-0.67
-0.09
-0.26
-0.11
-0.48
-0.43
-0.12
0.0
-0.31
-0.02
-0.72
Full Recession
Panic Phase
GDP Real GDP, NIPA monthly estimates, Macroeconomic Advisors
HPI Corelogic Home Price Index
CREPPI Commercial Real EstateCoStar Price Index
MUV Manheim Used Vehicle Auto Price Index
S&P500 S&P 500
ConsCon Consumer Confidence Conference Board
CapU Capacity Utilization, FRB
HousStart Housing Starts, Single Family, BEA
CCAR: Getting to the Real Objective
Page 17 | CCAR: Getting to the Real Objective
What’s wrong with traditional modeling and simulation processes, and how can they be improved?Models developed on historical data spanning the financial crisis and Great Recession may not fully account for the regime-shift or nonlinear effects of macroeconomic variables following the pivotal month of September 2008. If the effects of these variables on default likelihood, prepayments, loss severities and exposures at default are constrained by the model structure to be the same throughout a four to seven year history, for example, then default and loss may be under-predicted around and following the panic phase of the Great Recession. The greater correlations (multicollinearity) across key macroeconomic risk drivers during the panic phase may also tend to weaken model results.
Modeling and loss forecasting developments around Basel and financial market risks — value at risk (VAR), etc. — have a long history with considerable mathematical elegance and rigors in theory. But, in 2007 and 2008, it became clear that existing mathematically beautiful stress-tests had largely failed. CCAR, Dodd-Frank and Basel III all react to the failures of typical previous stress-testing processes and the surrounding environment.
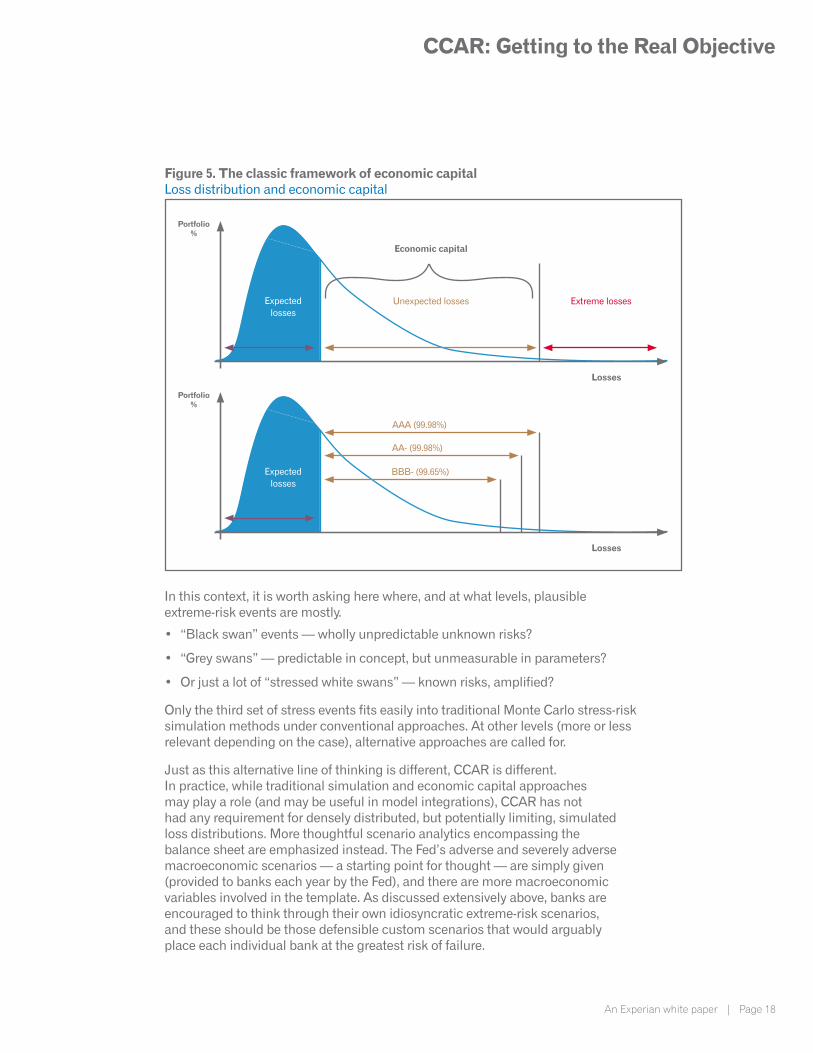
Figure 5 depicts the classic framework and definition of economic capital (the amount needed to cover unexpected losses). Economic capital is the amount of capital which a bank needs to be able to absorb unexpected but possible losses (at a given probability and confidence level) over a certain time horizon. Statistical or other sensible models or assumptions must be used for the probability of default (PD), loss given default (LGD) and exposure at default (EAD), as well as for correlation and diversification. These risk parameters, along with typically generated random shocks, generate the simulated loss distribution. This distribution may thus reflect the simulation of hundreds to many thousands of potential economic states. Under Basel and other capital standards, banks generally use the 99.9th percentile of the simulated loss distribution for economic capital — this is an implied 1-in-1,000-year event scenario.
The practical reality of this process, however, is that all of these very many simulated states can create an illusion of safety. Mathematical and modeling tractability and parsimony, for example, tends to limit the number of key state variables. Even 10,000 simulated alternative scenarios for just two key state-risk variables (home prices and unemployment, for example, are very commonly used today across mortgage and other asset classes) is no substitute for plausible risk imagination. It is, at best, a good start.
CCAR: Getting to the Real Objective
An Experian white paper | Page 18
Figure 5. The classic framework of economic capitalLoss distribution and economic capital
In this context, it is worth asking here where, and at what levels, plausible extreme-risk events are mostly.
• “Black swan” events — wholly unpredictable unknown risks?
• “Grey swans” — predictable in concept, but unmeasurable in parameters?
• Or just a lot of “stressed white swans” — known risks, amplified?
Only the third set of stress events fits easily into traditional Monte Carlo stress-risk simulation methods under conventional approaches. At other levels (more or less relevant depending on the case), alternative approaches are called for.
Just as this alternative line of thinking is different, CCAR is different. In practice, while traditional simulation and economic capital approaches may play a role (and may be useful in model integrations), CCAR has not had any requirement for densely distributed, but potentially limiting, simulated loss distributions. More thoughtful scenario analytics encompassing the balance sheet are emphasized instead. The Fed’s adverse and severely adverse macroeconomic scenarios — a starting point for thought — are simply given (provided to banks each year by the Fed), and there are more macroeconomic variables involved in the template. As discussed extensively above, banks are encouraged to think through their own idiosyncratic extreme-risk scenarios, and these should be those defensible custom scenarios that would arguably place each individual bank at the greatest risk of failure.
Portfolio%
Portfolio%
Expectedlosses
Expectedlosses
Losses
Losses
BBB- (99.65%)
AA- (99.98%)
AAA (99.98%)
Unexpected losses Extreme losses
Economic capital
CCAR: Getting to the Real Objective
Page 19 | CCAR: Getting to the Real Objective
These scenarios should be mindful of major lessons from the financial crisis and the preceding market boom, for example that:
• Collective independent actions can generate hidden magnitudes of risk (systemic risks), including various forms of counterparty and operational risks interacting with liquidity risk.
• Higher probabilities on “rare events” should be actively managed in full view of the current environment well in advance of a developing potential severe stress event. By the time a significant new threat is widely and fully recognized, however, hedging may be prohibitively expensive. When banks fall short of theoretical ideals, a virtual certainty, external risks are imposed.
• Limitations of risk management, both bank and government limitations, as discussed above, may have significant unintended consequences.
Tail-event modeling is not really testable empirically with historical data, but once a bank’s historical-data models are built, modelers need to also think bigger around alternative “new generation” forms of scenario analytics and stress-risk simulation.
The traditional framework of economic capital also tends to assume that this capital is a fixed cushion, but it is not. As implied above, the balance sheet melts down pretty quickly in a true crisis, putting a greater emphasis now on the balance sheet and potential fast developing stress risks in the short term, as discussed extensively further above.
Correspondingly, of course, CCAR/DFAST focuses on the financial losses of net charge-offs and balance sheet accounting and the corresponding allowances for loss reserves for each quarter of a 9-quarter forecast horizon. Basel, in contrast, has tended to be more focused traditionally on the ultimate, eventual realization of total net economic losses (associated with 1-year PD models), with less concern about accounting practices and exactly where and how these losses are accounted for. Both of these perspectives remain very relevant, and it is part of CCAR challenge to banks to discover the best custom modeling and system methods for integrating these perspectives.
For all of these reasons and more, CCAR is not a redundant set of regulatory compliance exercises. Its effects on risk management include demanding paradigm shifts from traditional approaches.
At the same time, there can be no doubt that, practically speaking, this is a very ambitious agenda. Common challenges in addressing the paradigm shifts across banks today span data, models and systems. Banks have previously had many component and overall loss forecasting models for different purposes, but the CCAR does not quite fit any of the traditional model molds. Both top-down and bottom-up perspectives are necessary. Bottom-up models, such as transition models in line with the Fed’s CCAR modeling practice, have superior forecasting properties for the relevant forecast horizons, but they are also resource intensive and high maintenance in development and usage.
CCAR: Getting to the Real Objective
An Experian white paper | Page 20
A common approach has been improvements along with creative combinations of existing models. This tends to lead the regulator to ask: How does this all really fit together? Fear of a hidden mistake or error is strong, and reviewers and regulators are driven by CCAR and the fear of past forecasting and model failures. As noted earlier, a customized blend of short-term severe robust capital sufficiency tests together with progress each year through phases of a longer term plan for model and system improvements, including model integrations, is critical. A well-managed dual approach of this type can help bring confidence and order to this inherently challenging and complex modeling and risk-simulation process.
At the same time, reviewers and examiners can also lose effectiveness in these processes if they seek to micro-manage modeling and simulation details of lesser importance in the big picture. Examiners as well as bank management should frequently touch base to see the big picture. Regardless of a bank’s current location on the path to longer-term modeling and system improvements, the first priority is severe robust capital sufficiency tests that meet the bank at its current level of modeling and system capabilities, wherever this may be. Conservative assumptions and judgments, as generally emphasized by regulators, can tend to compensate for unknowns.
This does tend to create a dilemma, however, in loss forecasting. Conservative assumptions built in from the ground up in data, modeling and/or forecasts are beneficial for stress-loss forecasting but counterproductive for integrated business “base path” loss forecasting. Or, alternatively, more “realistic” assumptions built in from the ground up may not provide sufficient conservatism for stress path loss projections and simulations. Here again, a dual path — in this case, for “base” assumptions versus “stress” assumptions — may be useful to address this issue. This approach can also help to better maintain credibility of model loss forecasts, thus facilitating the use of both base forecasts and empirical stress testing as an ongoing integral part of dynamic organizational risk management.
Given the technical and demanding nature of the issues involved, there is at times a disturbing tendency to either give up on statistical loss forecasting or, conversely, allow limited statistical-technique compliance to substitute for the even harder problems of business-preparedness compliance. Avoiding this requires a full risk-management framework steeped in broad business, macroeconomic and statistical experience — this is not something that can be delegated to segregated statistical experts alone, nor to isolated risk managers relying solely on their experience and judgments. Best-practice bank management is able to develop effective means for drawing contributions broadly from across the organization and breaking down “silos.”
CCAR: Getting to the Real Objective
Page 21 | CCAR: Getting to the Real Objective
Statistical and mathematical models and methods for stress loss forecasting can be valuable tools when properly developed and used. But, in the end, they are little more than rigorous ways to organize and discipline thinking around the full slate of potential bank stress risks. A potentially great danger results when these models wind up limiting and constraining thinking, thus limiting a bank’s stress-risk preparedness. CCAR approach encouraging customized scenario analytics is in part an attempt to counter this tendency. Continued technical improvements and ongoing maintenance of strong and integrated capital sufficiency tests and risk management governance within banks, involving much more than just checking the regulatory boxes, are both essential.
ConclusionThe 2008 financial and macroeconomic crisis left an indelible mark on the financial system and the economy unlike anything since the Great Depression. Prominently included with this legacy for banks is the rigor of the Fed’s annual CCAR process. Loss forecasting and bank stress simulation calls for great humility and also for very creative and properly focused efforts to improve and develop deeper insights for integrated capital and risk management.
CCAR approach is demanding and paradigm shifting, laying out a resource-intensive and ambitious agenda for banks. But, even partial answers to the key broad points on this agenda (starting with the right questions) may be better than none. Along this complex journey, best-practice bank management should frequently touch base on the big picture.
No one knows when or where or how strong it will be, but somewhere out there on the horizon the next crisis is looming.
CCAR: Getting to the Real Objective
An Experian white paper | Page 22
About the authorJohn Straka, Ph.D. has been a Senior Business Consultant with Experian’s Global Consulting Practice, leading several CCAR-related modeling and review projects. He has more than 25 years of modeling and risk-management experience. Previously Dr. Straka held various modeling and leadership positions at Freddie Mac for nearly 18 years, where he was Vice President of customer facing models and analytics leading teams responsible for all statistical scoring models including automated underwriting, behavioral scoring, and loss mitigation modeling along with certain risk-exposure modeling and analyses.
He also worked earlier as an economist at the Social Security Administration and in macroeconomic forecasting and analysis at the Congressional Budget Office. He earned a B.A. in economics from Williams College and a M.A. and Ph.D. in economics from Cornell University.
About Experian’s Global Consulting PracticeExperian’s business consultants deliver powerful insight that is used by clients to enhance credit-management strategies across their consumer and small-business portfolios and the Customer Life Cycle. Experian’s Global Consulting Practice is a credentialed consultancy dedicated to creating measurable and sustainable value for organizations around the globe in financial services, banking, mortgage, automotive finance, telecommunications and utilities, microfinance, retail credit and debt collections. We specialize in analytics-based decision strategies, data-driven products and services, regulatory compliance and fraud risk management across acquisitions, customer management, collections and overall portfolio management.
Experian’s business consultants provide clients with exceptional credit and fraud risk-management strategic insight, detailed enhancement opportunities, and deployment strategies through deep business subject-matter expertise and client intimacy, as well as a client engagement methodology to ensure consistency. We have deep knowledge of data, analytics and software and have demonstrated the ability to synthesize this intelligence with the deep understanding of credit-management principles and practices to solve our clients’ complex business needs.
CCAR: Getting to the Real Objective
Page 23 | CCAR: Getting to the Real Objective
About Decision AnalyticsExperian Decision Analytics enables organizations to make analytics-based customer decisions to achieve and sustain dramatic growth and profitability. Through our unique combination of consumer and business information, analytics, strategy and execution, we help clients maximize and actively manage customer value.
Meaningful information is key to effective decision-making, and Experian is an expert in connecting, organizing, interpreting and applying data, transforming it into information and analytics to address real-world challenges. We collaborate closely with clients to identify what matters most about their business and customers, then create and implement analytics-based decisions to manage their strategies over time. In today’s fast-paced environment where developing, implementing, and sustaining an effective strategy is imperative, we help organizations unlock a wealth of benefits immediately — and set the stage for long-term success. Increased revenue: Our products and services enable clients to increase revenue by providing the insight and agility they need to find and engage the right customers, target products more effectively, and grow market share.
Controlled risk: A broad range of risk-management products and services help organizations verify identity, manage and detect fraud, optimize collection and recovery, and balance risk and reward.
Operational efficiency: We help organizations quickly integrate information and processes to enhance operational efficiency and boost agility. Our flexible, collaborative approach helps organizations increase speed to market and improve the quality of customers’ experiences.
Compliance as differentiation: Proven expertise lets clients use compliance as a source of competitive advantage. We help ensure compliance with essential regulations, while helping organizations better understand customers.

Experian475 Anton Blvd.Costa Mesa, CA 92626T: 1 888 414 1120www.experian.com/consultingservices
©2013ExperianInformationSolutions,Inc.•Allrightsreserved
Experian and the Experian marks used herein are service marks or registered trademarks of Experian Information Solutions, Inc.
Other product and company names mentioned herein are the property of their respective owners. 11/13•2000/1167•6934-CS