ccar and dfast the journey continues - deloitte us and s the journey continues 2 ccar and dfast the...
TRANSCRIPT

CCAR and DFAST The journey continuesJuly 2016
CCAR and DFAST The journey continuesJuly 2016

CCAR and DFAST | the journey continues
2
CCAR and DFASTThe journey continues
The Federal Reserve (Fed) released the results of its Comprehensive Capital Analysis and Review (CCAR) for 2016 on June 29.1 Some key facts:
• Fed noted objections to two firms out of thirty-three (Deutsche Bank and Santander) and required resubmission for one (Morgan Stanley)
• All objections and resubmissions were driven by Fed-cited weaknesses around qualitative issues
• No firm failed to meet post-stress capital minimums and, compared to four firms the previous year, only one firm (M&T) needed to scale back its capital distribution request to do so, taking a so-called “mulligan”
The prior week’s release of the Dodd-Frank Act Stress Test (DFAST) results provided more detailed information on the Fed’s stress test. Compared to CCAR, those results exclude buybacks and capital issuances and hold past common dividends constant.
Some key takeaways
• Systemic and complex firms2 continue to fall short of the Fed’s high expectations. While the Fed noted that all banks are making progress, it singled out systemic and complex firms as needing to make continued progress toward meeting and exceeding expectations in all aspects of capital planning. Some key areas needing improvement include:
– Risk identification – Critical or effective challenge of assumptions and results
– Strong internal controls – Effective internal audit program and coverage
• Large and noncomplex firms are meeting or close to meeting expectations. With one exception, this group has demonstrated that it is able to remediate past concerns in revenue and loss modeling, consider material risks, and address key control and governance of capital planning.
• Stress impact: A tale of two industries. The Fed’s stress scenario this year resulted in two very different outcomes, depending on business focus. The magnitude of the decline in capital ratios compared to the prior year was more severe for firms with a traditional commercial and industrial lending (C&I) focus and less stressful for trading-oriented firms.
• Capital actions matter. The requested capital actions have a significant influence on minimum post-stress ratios for most firms and were generally larger than the prior year. For trading firms that took a mulligan last year, the lower stress impact this year appears to have provided enough capital buffer that they did not need to scale back.
• Tier 1 leverage and Tier 1 capital most constraining ratios. While all firms exceeded the minimum requirements under stress, the leverage and Tier 1 ratios had the lowest buffers over minimums of the four regulatory requirements. Thirteen of the firms were most constrained by Tier 1 leverage, followed by twelve hemmed in by Tier 1 capital. Trading and custody banks in particular were constrained by the leverage requirement. Common equity Tier 1 was most constraining for five firms. Three firms found total capital to be a challenge. One firm was equally constrained by Tier 1 leverage and common equity Tier 1.
• Loan loss rate improvements stalled. Aggregate loan loss rates were the same as last year with worsening C&I losses largely offsetting improvements in commercial real estate (CRE) and first-lien mortgages from less severe trough property prices.
• Fed risk-weighted asset (RWA) growth forecasts continue to pressure ratios. Aggregate growth in RWA slowed to 9.6 percent compared to 13.2 percent last year, easing pressure on capital ratios. However, the easing was largely contained in the largest trading firms and custody banks, with regional and other firms seeing higher RWA growth than last year.
1 Board of Governors of the Federal Reserve System, “Federal Reserve releases results of Comprehensive Capital Analysis and Review (CCAR),” ( June 29, 2016), available at http://www.federalreserve.gov/newsevents/press/bcreg/20160629a.htm.
2 Systemic and Complex firms in this document refers to (1) those firms subject to the Federal Reserve’s Large Institution Supervision Coordination Committee (LISCC) framework and (2) large and complex bank holding companies (BHCs) and intermediate holding companies (IHCs) of foreign banking organizations that have total assets greater than $250 billion or total on-balance sheet foreign exposure of more than $10 billion. Large and noncomplex firms are US BHCs and IHCs that are not part of the LISCC framework, have assets of between $50 billion and $250 billion, and have total on-balance sheet foreign exposure of less than $10 billion.
CCAR and DFAST | the journey continues
3
Our takeSystemic and complex firms will dominate the Fed’s CCAR supervisory agenda
• A pivot to systemic and complex firms. Recent comments by Fed Governor Dan Tarullo3 that the Fed intends to suspend the qualitative aspects of CCAR for large and noncomplex firms could further intensify the program for systemic and complex firms. Starting as early as the next CCAR cycle, the Fed will be able to shift expertise and resources to reviews of systemic and complex firms, including new intermediate holding company (IHC) entrants.
• CCAR around the clock. The Fed has already noted that as part of its “year-round” supervisory program supporting CCAR, it intends to conduct a thorough review of internal audit.4 This is just one part of the Fed’s efforts to spread CCAR-related reviews throughout the year and avoid the peak demand of April’s “Normandy invasion.” Institutions should expect to see more CCAR-related exams happen prior to plan submission in 2017.
• No guarantees. For the fourth year in a row, at least one firm that received an objection or was required to resubmit had “passed” muster the prior year. This is a clear demonstration of the Fed’s escalating expectations and desire for steady progress over time.
• Continued use of conditional approval. Conditional approval with resubmission continues as a tool to push firms with particular but not widespread weaknesses to remediate quickly. Conditional approval and resubmission was given to two of the largest firms for the first time in 2013, none in 2014, and now one in both 2015 and 2016.
3 Bloomberg, “Fed’s Tarullo on Bank Regulations, Fed Policy, Economy,” ( June 2, 2016), available at http://www.bloomberg.com/news/videos/2016-06-02/fed-s-tarullo-on-bank-regulations-fed-policy-economy.
4 Board of Governors of the Federal Reserve System, “Comprehensive Capital Analysis and Review 2016: Assessment Framework and Results,” ( June 29, 2006), available at http://www.federalreserve.gov/newsevents/press/bcreg/bcreg20160629a1.pdf. See specifically: “As part of the year-round supervisory program supporting CCAR, the Federal Reserve plans to conduct a thorough review of the largest firms’ internal audit coverage of capital planning practices starting later in 2016.”
Ratio CCAR severely adverse 2016
CategoryActual Q4 2015
Stress minimum
Minimum required
Buffer over minimum
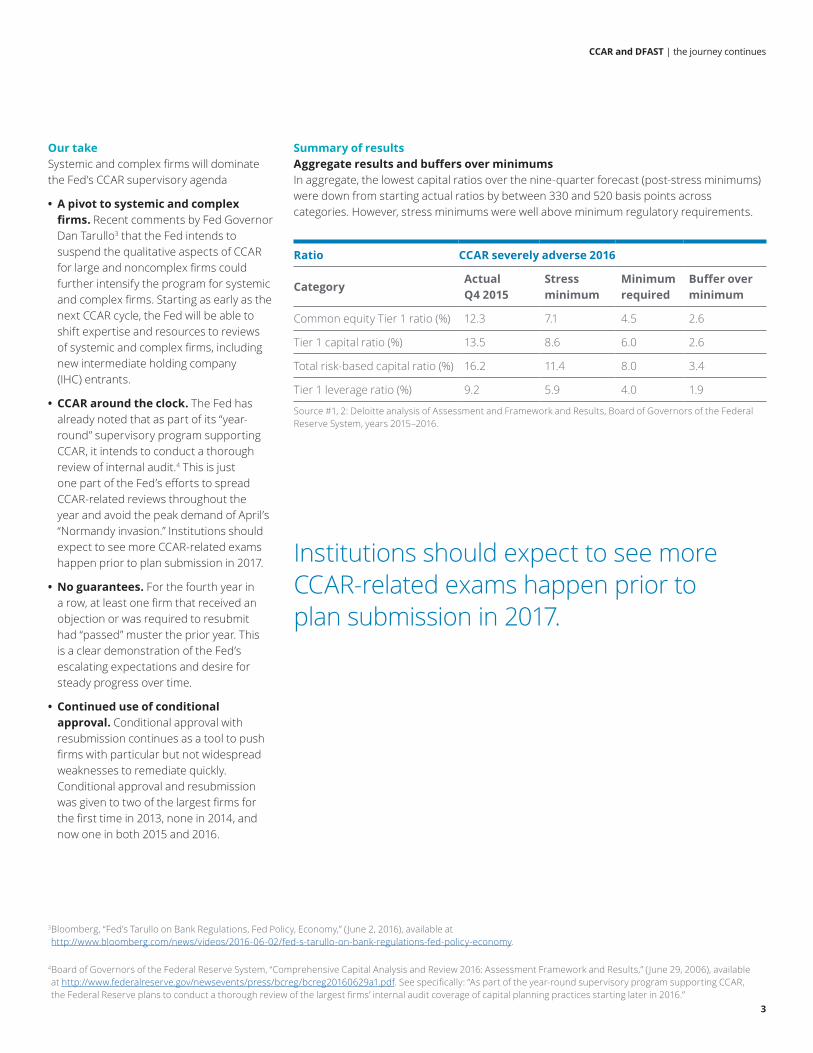
Common equity Tier 1 ratio (%) 12.3 7.1 4.5 2.6
Tier 1 capital ratio (%) 13.5 8.6 6.0 2.6
Total risk-based capital ratio (%) 16.2 11.4 8.0 3.4
Tier 1 leverage ratio (%) 9.2 5.9 4.0 1.9
Source #1, 2: Deloitte analysis of Assessment and Framework and Results, Board of Governors of the Federal Reserve System, years 2015–2016.
Summary of results Aggregate results and buffers over minimumsIn aggregate, the lowest capital ratios over the nine-quarter forecast (post-stress minimums) were down from starting actual ratios by between 330 and 520 basis points across categories. However, stress minimums were well above minimum regulatory requirements.
Institutions should expect to see more CCAR-related exams happen prior to plan submission in 2017.
CCAR and DFAST | the journey continues
4
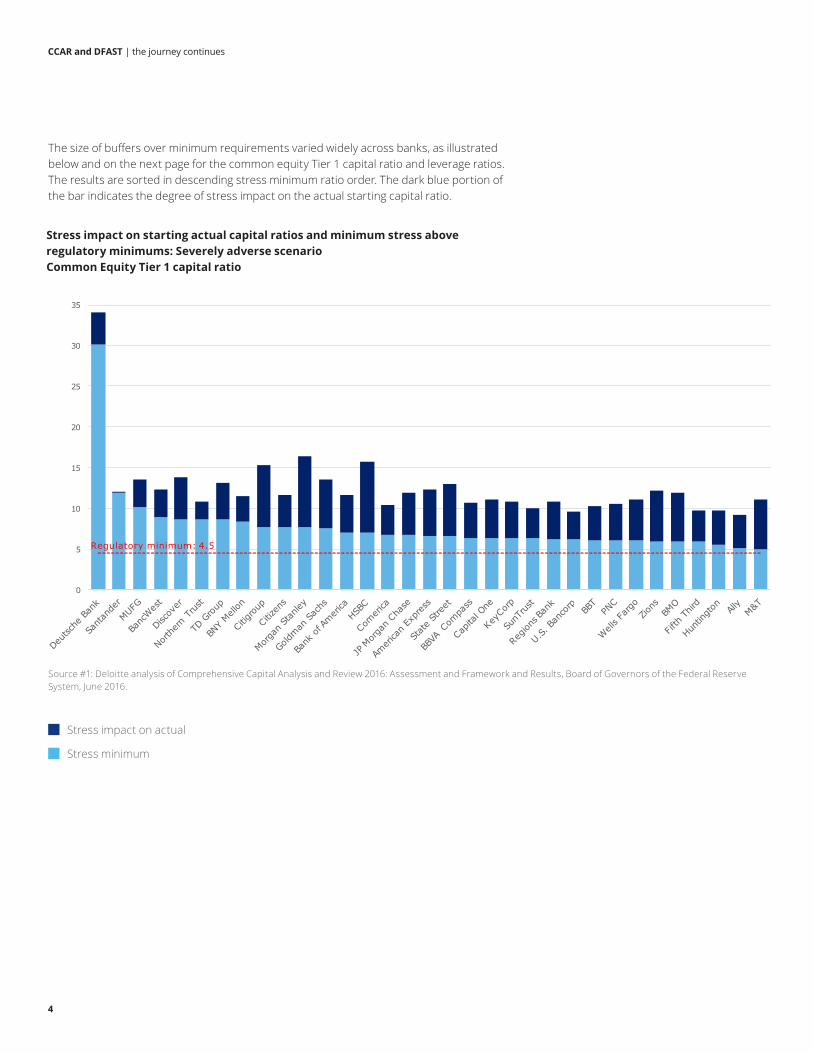
The size of buffers over minimum requirements varied widely across banks, as illustrated below and on the next page for the common equity Tier 1 capital ratio and leverage ratios. The results are sorted in descending stress minimum ratio order. The dark blue portion of the bar indicates the degree of stress impact on the actual starting capital ratio.
5
5
Common Equity Tier 1 ResultsStress Impact and Buffers over the regulatory minimum vary widely across CCAR BHCs
0
5
10
15
20
25
30
35
Stress Impact on Actual Stress Minimum
Regulatory minimum: 4.5
Stress impact on starting actual capital ratios and minimum stress aboveregulatory minimums: Severely adverse scenarioCommon Equity Tier 1 capital ratio
Stress impact on actual
Stress minimum
Source #1: Deloitte analysis of Comprehensive Capital Analysis and Review 2016: Assessment and Framework and Results, Board of Governors of the Federal Reserve System, June 2016.
CCAR and DFAST | the journey continues
5
1
1
Tier 1 Leverage Results
Stress Impact and Buffers over the regulatory minimum vary widely across CCAR BHCs
0
2
4
6
8
10
12
14
Stress Impact on Actual Stress Minimum
Regulatory minimum: 4
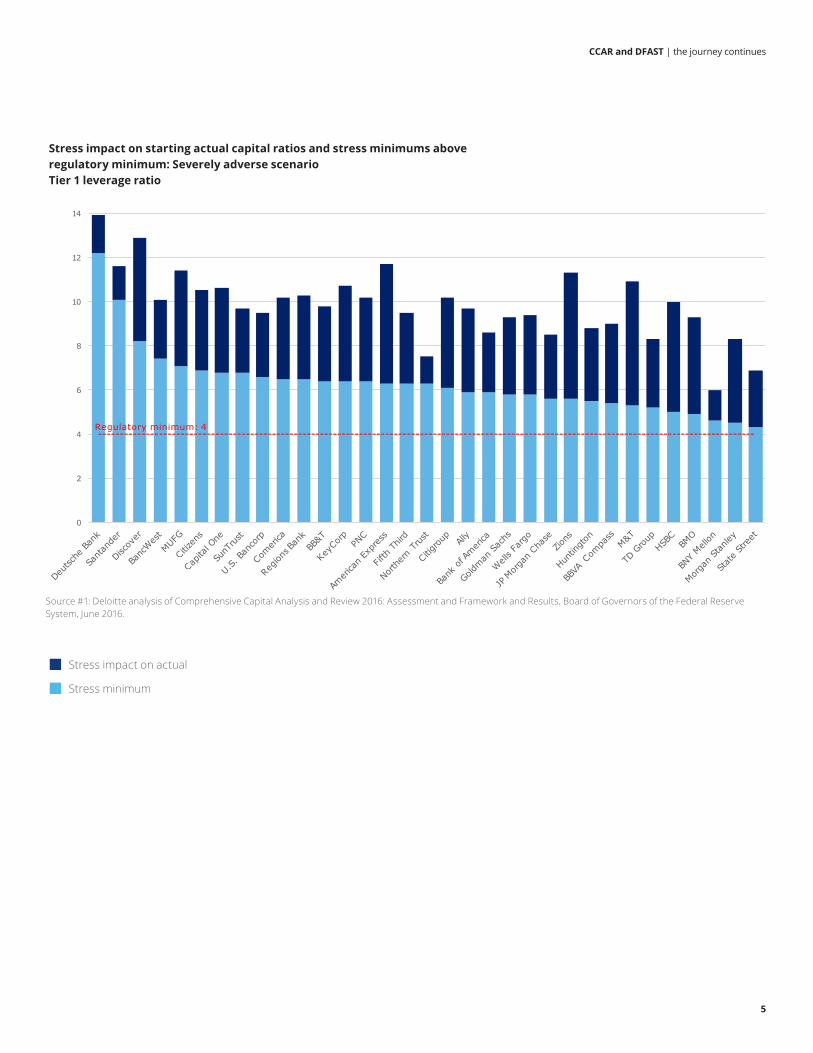
Stress impact on actual
Stress minimum
Source #1: Deloitte analysis of Comprehensive Capital Analysis and Review 2016: Assessment and Framework and Results, Board of Governors of the Federal Reserve System, June 2016.
Stress impact on starting actual capital ratios and stress minimums aboveregulatory minimum: Severely adverse scenarioTier 1 leverage ratio
CCAR and DFAST | the journey continues
6
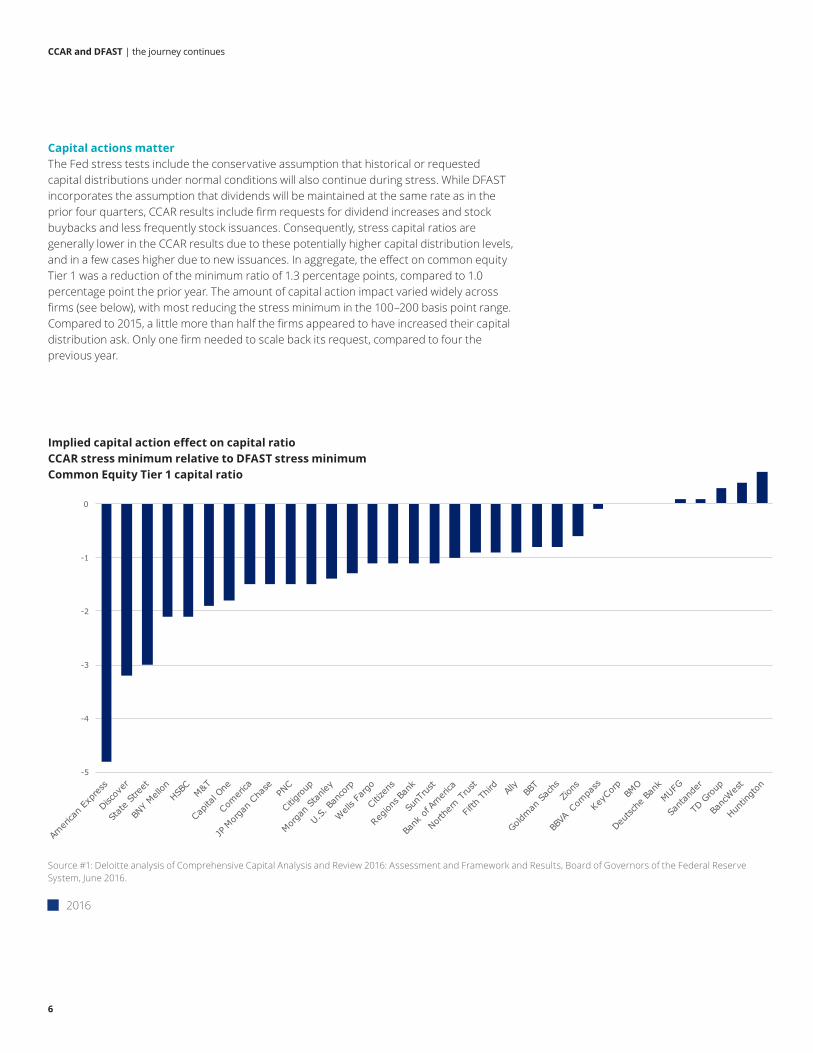
Capital actions matterThe Fed stress tests include the conservative assumption that historical or requested capital distributions under normal conditions will also continue during stress. While DFAST incorporates the assumption that dividends will be maintained at the same rate as in the prior four quarters, CCAR results include firm requests for dividend increases and stock buybacks and less frequently stock issuances. Consequently, stress capital ratios are generally lower in the CCAR results due to these potentially higher capital distribution levels, and in a few cases higher due to new issuances. In aggregate, the effect on common equity Tier 1 was a reduction of the minimum ratio of 1.3 percentage points, compared to 1.0 percentage point the prior year. The amount of capital action impact varied widely across firms (see below), with most reducing the stress minimum in the 100–200 basis point range. Compared to 2015, a little more than half the firms appeared to have increased their capital distribution ask. Only one firm needed to scale back its request, compared to four the previous year.
-5
-4
-3
-2
-1
0
1
Implied Capital Action Effect on Capital Ratio CCAR Stress Minimum Relative to DFAST Stress Minimum
Common Equity Tier 1 Capital Ratio
2016
Implied capital action effect on capital ratioCCAR stress minimum relative to DFAST stress minimumCommon Equity Tier 1 capital ratio
2016
Source #1: Deloitte analysis of Comprehensive Capital Analysis and Review 2016: Assessment and Framework and Results, Board of Governors of the Federal Reserve System, June 2016.

CCAR and DFAST | the journey continues
7
Stress impact on capital ratios improves for some The stress impact on bank holding companies (BHC) capital ratios (starting capital ratio compared to minimum post-stress capital ratio) has improved in aggregate this year, reversing a worsening trend. However, about one-third of the firms, largely more traditional lenders, continued to experience worsening trends.
CCAR stress impact on capital ratios – calculated (stress minimum less actual)
BHC aggregate Ratio (%)
Capital category 2014 2015 2016Change 2015– 2016
Common equity Tier 1 ratio (%) n/a n/a (5.2) n/a
Tier 1 capital ratio (%) (5.1) (5.8) (4.9) 0.9
Total risk-based capital ratio (%) (5.2) (5.9) (4.8) 1.1
Tier 1 leverage ratio (%) (3.0) (3.5) (3.3) 0.2
Source #1, 2, 3: Deloitte analysis of Comprehensive Capital Analysis and Review: Assessment and Framework and Results, Board of Governors of the Federal Reserve System, years 2014–2016.
In aggregate, post-stress minimum capital ratios are substantially higher than in prior years and, as noted earlier, exceed the minimum required.
CCAR severely adverse ratio – minimum
BHC aggregate Ratio (%)
Capital category 2014 2015 2016Change 2015– 2016
Common equity Tier 1 ratio (%) 6.9 6.6 7.1 0.5
Tier 1 capital ratio (%) 7.8 7.7 8.6 0.9
Total risk-based capital ratio (%) 10.4 10.3 11.4 1.1
Tier 1 leverage ratio (%) 5.4 5.3 5.9 0.6
Source #1, 2, 3: Deloitte analysis of Comprehensive Capital Analysis and Review: Assessment and Framework and Results, Board of Governors of the Federal Reserve System, years 2014–2016.
CCAR and DFAST | the journey continues
8
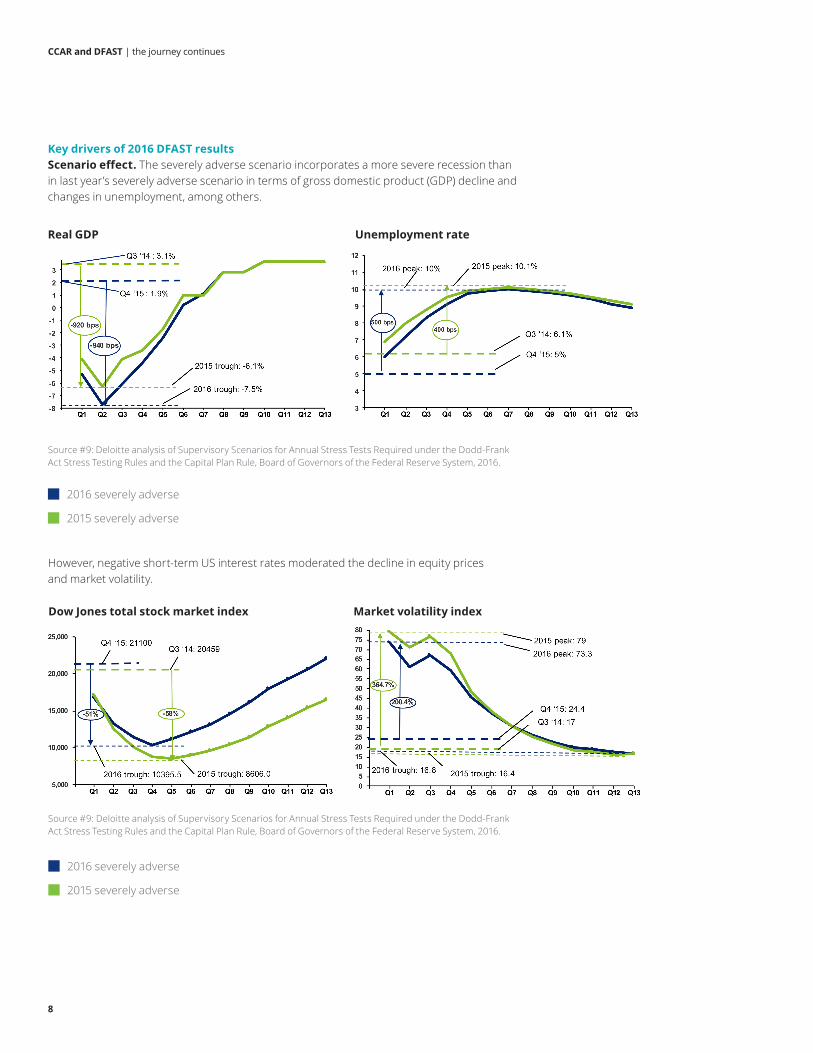
2016 severely adverse
2015 severely adverse
Dow Jones total stock market index Market volatility index
Source #9: Deloitte analysis of Supervisory Scenarios for Annual Stress Tests Required under the Dodd-Frank Act Stress Testing Rules and the Capital Plan Rule, Board of Governors of the Federal Reserve System, 2016.
However, negative short-term US interest rates moderated the decline in equity prices and market volatility.
Key drivers of 2016 DFAST resultsScenario effect. The severely adverse scenario incorporates a more severe recession than in last year’s severely adverse scenario in terms of gross domestic product (GDP) decline and changes in unemployment, among others.
Source #9: Deloitte analysis of Supervisory Scenarios for Annual Stress Tests Required under the Dodd-Frank Act Stress Testing Rules and the Capital Plan Rule, Board of Governors of the Federal Reserve System, 2016.
2016 severely adverse
2015 severely adverse
Real GDP Unemployment rate

CCAR and DFAST | the journey continues
9
Collectively, these scenario changes reduced the severity of aggregate losses compared to the prior year. But results varied significantly across firms, with trading firms less affected and traditional lenders generally having more severe outcomes from negative interest rates and the recession.
Loans loss rate improvements stall.As shown in the chart below, the improving trend in stress loss rates stalled compared to last year at 6.1 percent of the portfolio. However, results by sub-portfolio were mixed with C&I deteriorating and CRE and first-lien mortgages improving compared to the prior year.
Loan loss percentage (%)
Loan type 2013 2014 2015 2016
Change from 2015 to 2016
Total loan losses 7.5 6.9 6.1 6.1 .
First-lein mortgages 6.6 5.7 3.6 3.2 (.4)
Junior liens and HELOC 9.6 9.6 8. 8.1 .1
C&I 6.8 5.4 5.4 6.3 .9
CRE 8. 8.4 8.6 7.0 (1.6)
Credit cards 16.7 15.2 13.1 13.4 .3
Other comsumer 6.1 6. 5.8 5.7 (.1)
Other loans 1.8 2.7 2.9 3.4 .5
Source #5, 6, 7, 8: Deloitte analysis of Dodd-Frank Act Stress Test: Supervisory Stress Test Methodology and Results, Board of Governors of the Federal Reserve System, years 2013–2016.
CCAR and DFAST | the journey continues
10
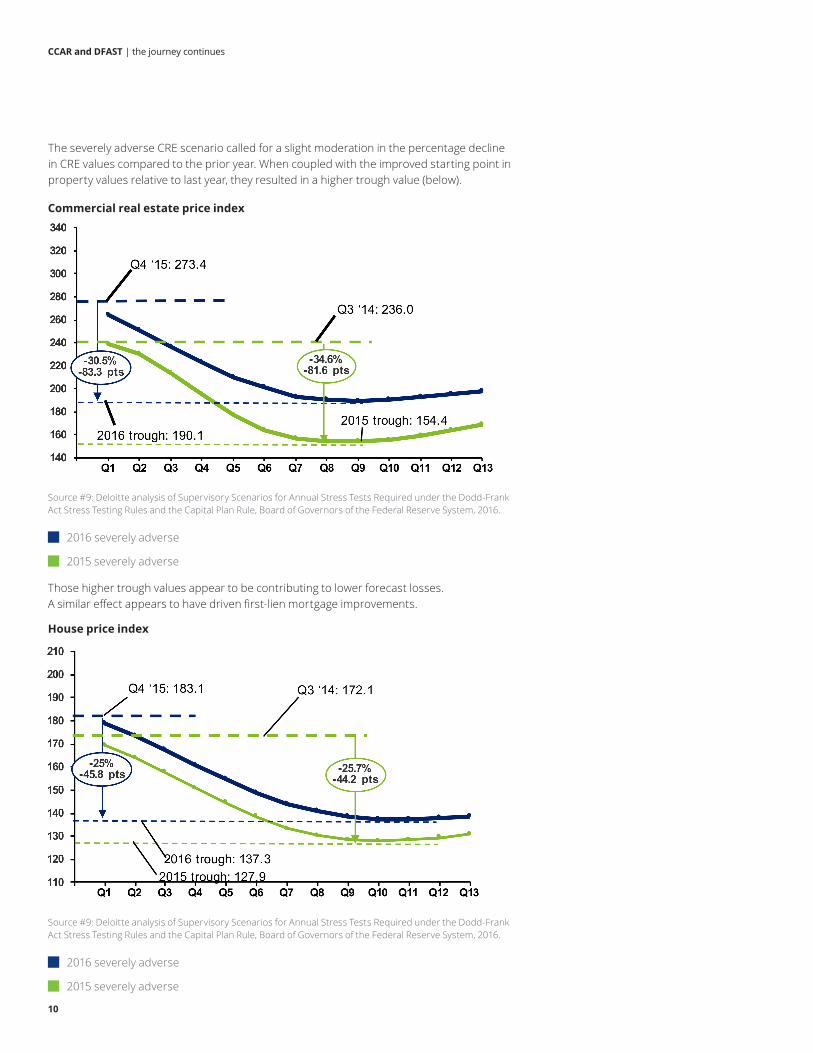
Those higher trough values appear to be contributing to lower forecast losses. A similar effect appears to have driven first-lien mortgage improvements.
Source #9: Deloitte analysis of Supervisory Scenarios for Annual Stress Tests Required under the Dodd-Frank Act Stress Testing Rules and the Capital Plan Rule, Board of Governors of the Federal Reserve System, 2016.
2016 severely adverse
2015 severely adverse
Source #9: Deloitte analysis of Supervisory Scenarios for Annual Stress Tests Required under the Dodd-Frank Act Stress Testing Rules and the Capital Plan Rule, Board of Governors of the Federal Reserve System, 2016.
2016 severely adverse
2015 severely adverse
The severely adverse CRE scenario called for a slight moderation in the percentage decline in CRE values compared to the prior year. When coupled with the improved starting point in property values relative to last year, they resulted in a higher trough value (below).
Commercial real estate price index
House price index

CCAR and DFAST | the journey continues
11
6.1
4.2
3.6
1.20.9
0.7 0.7 0.6 0.6 0.6 0.6 0.5 0.4 0.3 0.2 0.2 0.1 0
-0.1 -0.2 -0.2 -0.3 -0.3 -0.3 -0.3 -0.4-0.7 -0.7
-1.4 -1.4
-2.7
-4
-3
-2
-1
0
1
2
3
4
5
6
7
Source #5, 6: Deloitte analysis of Dodd-Frank Act Stress Test: Supervisory Stress Test Methodology and Results, Board of Governors of the Federal Reserve System, years 2015–2016.
On the other hand, more severe recession assumptions appear to have worsened the outcome on C&I loans.
Of course, depending on portfolio quality and mix, the effect of the scenario on total loan losses compared to the prior year varied widely across firms. The chart below shows changes in the total loan loss rates from the prior year sorted in descending order.
DFAST loan loss rate differences by BHC (2016 minus 2015)
Pre-provision net revenue (PPNR) as percentage of average assetsA great deal of divergence in results between trading banks and regional firms can be attributed to PPNR. In aggregate, PPNR as a percent of average assets was stronger than the previous three stress tests and up 0.4 percentage points relative to 2015.
PPNR as % of average assets
2013 2014 2015 2016
2.4 2.3 2.1 2.5
Source #5, 6, 7, 8: Deloitte analysis of Dodd-Frank Act Stress Test: Supervisory Stress Test Methodology and Results, Board of Governors of the Federal Reserve System, years 2013–2016.

CCAR and DFAST | the journey continues
12
DFAST PPNR as % of average asset difference by BHC (2016 minus 2015)
Source #5, 6: Deloitte analysis of Dodd-Frank Act Stress Test: Supervisory Stress Test Methodology and Results, Board of Governors of the Federal Reserve System, years 2015–2016.
1.4
1.10.9
0.5 0.50.4
0.2 0.20
-0.1-0.2 -0.2
-0.3-0.4
-0.5-0.6 -0.6 -0.6
-0.7 -0.7 -0.7 -0.7 -0.7-0.8 -0.8 -0.8
-0.9-1
-1.1
-1.4
-3.5
-4
-3
-2
-1
0
1
2
However, 22 of the 31 firms subject to DFAST last year saw their PPNR ratio worsen. The lion share of PPNR improvements came from the six trading firms as shown in the table below for the change in the PPNR when compared to last year.
The key drivers of PPNR changes from last year that led to this divergence include:
• More moderate stock price declines and lower market volatility led to less severe declines in revenue for trading banks over the nine quarters.
• Negative interest rate assumptions weakened net interest income, a more dominant revenue source of traditional banks.
• Operational risk losses (excluding litigation costs) were moderately higher as a percentage of RWAs. A change in the Fed’s operational risk modeling approach spread losses more broadly to firms with histories of operational losses that may have lacked unexpected tail events, but that remain vulnerable to those risks.

CCAR and DFAST | the journey continues
13
Global market shock and counterparty losses rise. The design of the stress scenario was less severe for PPNR of trading banks. But losses from the global market shock and counterparty positions applied to the eight trading and custody banks rose in aggregate $10 billion or around 10 percent relative to prior years.
Losses in $billions
2013 2014 2015 2016
97 98 103 113
Source #5, 6, 7, 8: Deloitte analysis of Dodd-Frank Act Stress Test: Supervisory Stress Test Methodology and Results, Board of Governors of the Federal Reserve System, years 2013–2016.
This increase occurred primarily due to one trading bank as shown in the chart below.
1
1
2015 vs 2016 DFAST Trading and Counterparty Losses –Severely Adverse Scenario
$BN
0
5
10
15
20
25
30
35
JP Morgan Chase
Bank of America
Goldman Sachs
Citigroup Morgan Stanley
Wells Fargo BNY Mellon State Street
Fed Projections 2015
Fed Projections 2016
DFAST FED Trading and Counterparty Losses - 2015 vs 2016
% Difference 38.14 % 13.64 % 5.88 % -9.19 % -17.72 % 32.88 % 66.67 % -25.00 %
Source #5, 6: Deloitte analysis of Dodd-Frank Act Stress Test: Supervisory Stress Test Methodology and Results, Board of Governors of the Federal Reserve System, years 2015–2016.
Fed projections 2016
Fed projections 2015
DFAST Fed trading and counterparty losses — 2016 vs 2015
Growth in forecasted RWA moderated, reducing pressure on ratios. Aggregate RWAs rose by 9.6 percent compared to 13.2 percent in the prior DFAST. The moderation in RWA growth was concentrated in trading and custody banks and in part driven by changes in the Fed’s approach to market risk RWA calculation. More than half the firms were forecast to have higher rates of RWA growth than last year. In aggregate, had RWAs grown as much as in the prior DFAST, capital ratios would have been 30–40 basis points lower.

CCAR and DFAST | the journey continues
14
Preparing for next year2017 planning. With only a year until the next CCAR exercise—as opposed to one year and a quarter last time—there is less time for remediation. Firms should prepare detailed remediation plans to improve communication with the Fed. They should also be prepared for exams that touch on the key issues of their past CCAR well before their capital plan submission.
Expect the unexpected yet again. With less stress on trading banks and more on traditional banks this year, next year the pendulum could swing the other way. Given the evolving Brexit consequences and greater uncertainty, the Fed may design a scenario that is more targeted at certain new potential vulnerabilities. As always, having a flexible CCAR program that can respond to a wide range of macro and idiosyncratic scenarios could be key to effectively navigating the next CCAR cycle.
Anticipate head winds. While the Fed postponed the introduction of the supplementary leverage ratio (SLR) requirement for this year, it will apply in CCAR 2017. The SLR applies to systemic and complex firms beginning in the first quarter of 2018, and therefore in the fifth quarter of next year’s CCAR forecast and beyond. These new requirements will likely pose a new constraint dynamic under stress that, of course, will be dependent on firm business models as well as the design of the Fed scenario. Over the longer term, the eight global systemically important banks (G-SIBs) will also potentially contend with the phase-in of the G-SIB surcharge as part of the post-stress minimum capital requirement.
Data, data, data. The Fed has been emphasizing the need for improved data quality for the last several years, and it has been at the core of some objection decisions. With the advent of formal CCAR report attestations this coming year end and the emphasis on end-to-end controls in the capital planning process, the Fed is likely to test whether attestations are backed by adequate data governance, controls, and infrastructure.
Be specific and deliver on time. To address outstanding weaknesses identified by the Fed, many firms will be asked to enhance current processes and develop remediation plans, inclusive of accountable parties, activities, and, milestones to be completed prior to the next CCAR cycle or beyond. Just like BHCs and IHCs, the Fed does not like surprises, so sticking to deadlines or providing updates on any slippage is important in making sure that firms and regulators are on the same page. Not delivering key remediation items on time or of the required quality can drive an objection decision. Moreover, being clear on items that have longer duration remediation, getting agreement, and defining a delivery date are also important to avoid objection.
Firms should prepare detailed remediation plans to improve communication with the Fed.
CCAR and DFAST | the journey continues
15
Sources of data utilized within this document from the Board of Governors of the Federal Reserve System are listed below.
1. Comprehensive Capital Analysis and Review 2016: Assessment and Framework and Results, Board of Governors of the Federal Reserve System, June 2016.
2. Comprehensive Capital Analysis and Review 2015: Assessment and Framework and Results, Board of Governors of the Federal Reserve System, March 2015.
3. Comprehensive Capital Analysis and Review 2014: Assessment and Framework and Results, Board of Governors of the Federal Reserve System, March 2014.
4. Comprehensive Capital Analysis and Review 2013: Assessment and Framework and Results, Board of Governors of the Federal Reserve System, March 2013.
5. Dodd-Frank Act Stress Test 2016: Supervisory Stress Test Methodology and Results, Board of Governors of the Federal Reserve System, June 2016.
6. Dodd-Frank Act Stress Test 2015: Supervisory Stress Test Methodology and Results, Board of Governors of the Federal Reserve System, March 2015.
7. Dodd-Frank Act Stress Test 2014: Supervisory Stress Test Methodology and Results, Board of Governors of the Federal Reserve System, March 2014.
8. Dodd-Frank Act Stress Test 2013: Supervisory Stress Test Methodology and Results, Board of Governors of the Federal Reserve System, March 2013.
9. Supervisory Scenarios for Annual Stress Tests Required under the Dodd-Frank Act Stress Testing Rules and the Capital Plan Rule, Board of Governors of the Federal Reserve System, 2016.
ContactsAlexandre BradyPrincipal Deloitte AdvisoryDeloitte & Touche LLP+1 415 783 [email protected]
Craig BrownManaging Director Deloitte AdvisoryDeloitte & Touche LLP+1 347 334 [email protected]
Edward T. Hida II, CFAPartner Deloitte AdvisoryGlobal Leader - Risk & Capital ManagementDeloitte & Touche LLP+1 212 436 [email protected]
Dilip KrishnaManaging Director Deloitte AdvisoryDeloitte & Touche LLP+1 212 436 [email protected]
Alok SinhaManaging Principal Deloitte AdvisoryUS Banking and Securities LeaderDeloitte & Touche LLP+1 415 [email protected]
David WrightManaging Director Deloitte AdvisoryDeloitte & Touche LLP+1 415 783 [email protected]
CENTER forREGULATORY STRATEGYAMERICAS
About the Deloitte Center for Regulatory StrategiesThe Deloitte Center for Regulatory Strategies provides valuable insight to help organizations in the financial services, health care, life sciences, and energy industries keep abreast of emerging regulatory and compliance requirements, regulatory implementation leading practices, and other regulatory trends. Home to a team of experienced executives, former regulators, and Deloitte professionals with extensive experience solving complex regulatory issues, the Center exists to bring relevant information and specialized perspectives to our clients through a range of media including thought leadership, research, forums, webcasts, and events. www.deloitte.com/us/centerregulatorystrategies This publication contains general information only and Deloitte is not, by means of this publication, rendering accounting, business, financial, investment, legal, tax, or other professional advice or services. This publication is not a substitute for such professional advice or services, nor should it be used as a basis for any decision or action that may affect your business. Before making any decision or taking any action that may affect your business, you should consult a qualified professional advisor.Deloitte shall not be responsible for any loss sustained by any person who relies on this publication. As used in this document, “Deloitte” means Deloitte & Touche LLP, a subsidiary of Deloitte LLP. Please seewww.deloitte.com/us/about for a detailed description of the legal structure of Deloitte LLP and its subsidiaries.Certain services may not be available to attest clients under the rules and regulations of public accounting. Copyright © 2016 Deloitte Development LLC. All rights reserved.
This publication contains general information only and Deloitte is not, by means of this publication, rendering accounting, business, financial, investment, legal, tax, or other professional advice or services. This publication is not a substitute for such professional advice or services, nor should it be used as a basis for any decision or action that may affect your business. Before making any decision or taking any action that may affect your business, you should consult a qualified professional advisor.
Deloitte shall not be responsible for any loss sustained by any person who relies on this publication.
About DeloitteDeloitte refers to one or more of Deloitte Touche Tohmatsu Limited, a UK private company limited by guarantee (“DTTL”), its network of member firms, and their related entities. DTTL and each of its member firms are legally separate and independent entities. DTTL (also referred to as “Deloitte Global”) does not provide services to clients. Please see www.deloitte.com/about for a detailed description of DTTL and its member firms. Please see www.deloitte.com/us/about for a detailed description of the legal structure of Deloitte LLP and its subsidiaries. Certain services may not be available to attest clients under the rules and regulations of public accounting.
Copyright © 2016 Deloitte Development LLC. All rights reserved.