cbd · forests are in larger blocks such as amazon and congo; some worrying levels of...
TRANSCRIPT

In order to minimize the environmental impacts of the Secretariat’s processes, and to contribute to the Secretary-General’s initiative for a C-Neutral UN, this document is printed in limited numbers. Delegates are kindly requested to bring their copies to meetings and not to request additional copies.
CBD
Distr. GENERAL UNEP/CBD/SBSTTA/18/INF/13 22 April 2014 ENGLISH ONLY
SUBSIDIARY BODY ON SCIENTIFIC, TECHNICAL AND TECHNOLOGICAL ADVICE
Eighteenth meeting Montreal, 23-28 June 2014 Item 3 of the provisional agenda*
A CASE STUDY OF CONSERVATION MONITORING RELATED TO AICHI TARGETS: EXPERIENCES AND LESSONS FROM WWF
Note by the Executive Secretary
1. The Executive Secretary is circulating herewith, for the information of participants in the eighteenth meeting of the Subsidiary Body on Scientific, Technical and Technological Advice, a report on a monitoring and reporting system to track the performance, outcomes and impacts of the global priority conservation programmes of the World Wide Fund for Nature (WWF) and the delivery of its global goals.
2. The report was produced by WWF- World Wide Fund for Nature. It describes WWF’s monitoring system and provides information on over 20 indicators including indicators used in the context of the Convention to assess progress towards the achievement of the Aichi Biodiversity Targets, lists some lessons learned from the process and makes recommendations for enhancing the effectiveness of actions aimed to achieve conservation outcomes.
3. The report is presented in the form and language in which it was received by the Secretariat.
* UNEP/CBD/SBSTTA/18/1.

A CASE STUDY OF CONSERVATION MONITORING RELATED TO AICHI TARGETS: Experiences and lessons from WWF
P.J. Stephenson & Sheila O’Connor
REPORT
2014
Published in March 2014 by WWF - World Wide Fund for Nature formerly World Wildlife Fund),CH-1196, Gland, Switzerland
Any reproduction in full or in part of this publication must mention the title and credit the above-mentioned publisher as the copyright owner.
No photographs from this publication may be reproduced on the internet without prior authori-zation from WWF.The material and the geographical designations in this report do not imply the expression of anyopinion whatsoever on the part of WWF concerning the legal status of any country, territory, or area,or concerning the delimitation of its frontiers or boundaries.© text 2014 WWF All rights reserved
Proposed citation: P.J. Stephenson & S. O’Connor (2014). A Case Study of Conservation MonitoringRelated to Aichi Targets: Experiences and lessons from WWF. WWF International, Gland,Switzerland.
Front cover photo: Iguaçu Falls, Atlantic Forests, Brazil © PJ Stephenson
Authors:
Dr P.J. StephensonConservation Strategy & Performance UnitWWF International1196 [email protected]
Dr Sheila O’ConnorConservation Strategy & Performance UnitWWF International1196 [email protected]

A Case Study of Conservation Monitoring: WWF 1
Table of Contents
Executive Summary ...................................................................................................................... 2
Acronyms ....................................................................................................................................... 6
Acknowledgements ....................................................................................................................... 6
1 Introduction ................................................................................................................................ 7
2 WWF’s Monitoring and Reporting System ............................................................................... 7
2.1 Key elements of WWF’s monitoring and reporting system ............................................... 7
2.2 Comparison between WWF and CBD goals and indicators ............................................ 11
2.3 Key actions and resources required to implement the WWF monitoring and reporting system ...................................................................................................................................... 12
2.4 Key outputs of the WWF monitoring and reporting system ........................................... 14
3 Indicators and Data Analysis – examples from the WWF Global Conservation Programme Report relevant to Aichi Targets ................................................................................................. 15
3.1 What is being achieved against WWF’s global biodiversity goals? ................................. 16
3.1.1 Forest cover / deforestation (Aichi Target 5, WWF indicators S1, S2 & P1) ............ 16
3.1.2 Species populations (Aichi Target 12, WWF indicator S3) ....................................... 16
3.1.3 Protected area coverage (Aichi Target 11, WWF indicator R1) ................................. 17
3.1.4 Protected area management effectiveness (Aichi Target 11, WWF indicator R2) ... 18
3.1.5 Sustainable management and certification (Aichi Targets 6 & 7, WWF indicator R4) ....................................................................................................................................... 19
3.2 What is being achieved against WWF’s global footprint goal? ....................................... 19
3.3 Is WWF delivering on its 2020 global goals? .................................................................. 19
3.3.1 Are global priority places protected and well managed? ......................................... 20
3.3.2 Are flagship species thriving? ................................................................................... 20
3.3.3 Is the Ecological Footprint reduced to 2000 levels? ................................................ 22
3.4 Improvements needed in the WWF monitoring and reporting system .......................... 23
4 Lessons Learnt on Monitoring Global Goals .......................................................................... 23
5 Recommendations ................................................................................................................... 25
6. References ............................................................................................................................... 27
Annex 1: WWF Goals ..................................................................................................................29
Annex 2: WWF Impact and Outcome Dashboards ................................................................... 30
Summary of Common Indicators and Data Sources in Dashboards ................................... 30
Place-based Programmes Dashboard, FY13 .......................................................................... 32
Flagship Species Programmes Dashboard, FY13 ................................................................... 37
Commodity Footprint Programmes Dashboard, FY13 .......................................................... 39

A Case Study of Conservation Monitoring: WWF 2
Executive Summary
WWF monitoring and the Aichi Targets
In 2013 WWF started implementing an improved monitoring and reporting system to trackthe performance, outcomes and impacts of more than 60 global priority conservationprogrammes and the delivery of its global goals. The improved system involves global priorityprogrammes following existing best practices by establishing measurable goals andobjectives, measuring outcome and impact indicators, and tracking annual results.
In addition, a set of more than 20 indicators common to programmes applying the sameconservation strategies was identified to support meaningful aggregation and analysis ofoutcomes and impacts at the portfolio level. Eleven of these pressure-state-response-benefitindicators were used in reporting for 2013; the remainder will be finalized in 2014-15.
Several of the WWF common programme indicators are the same or similar to those beingused by the Convention on Biological Diversity (CBD) to track delivery of seven of the 20Aichi Targets. There are 11 indicators common to both systems using the same or similarmeasures for habitat cover and loss, environmental flows, river fragmentation, state of theoceans, protected areas coverage, protected areas management effectiveness, speciespopulations, Ecological Footprint, certified fisheries and certified forests. Several datasources are also the same (e.g. ZSL/WWF Living Planet Index for species populations,UNEP-WCMC protected area management effectiveness database, Ecological FootprintNetwork for Ecological Footprint).
Elements of the WWF monitoring system
Monitoring is an integral and long-standing component of project cycle management but itdoes not happen without an injection of effort and resources. In order to enable its improvedmonitoring system, WWF had to mobilize staff and resources internally, and in partneragencies.
Key actions and resources that created an enabling environment for impact monitoring inWWF revolved around having a policy in place with high-level management support, well-established standards for planning and monitoring and reporting, dedicated capacity in keyprogrammes, and a dedicated central team to set standards and collate and analyze data.
Key outputs of the WWF monitoring system include an annual report with dashboards thatsummarize impact and outcome data from common indicators alongside programmeprogress updates.
Some highlights from indicator analyses in 2013
This report demonstrates some of the highlights shown by the WWF indicator dashboards in2013 for indicators that overlap with those being used to measure Aichi Targets for forestcover/deforestation, protected area coverage, protected area management effectiveness,species populations, Ecological Footprint, and the sustainable production of fish and timber.
Forest loss and fragmentation: Deforestation rates have generally declined in WWF priorityplaces in the last five years, but places with increased deforestation include Choco Darien,Congo Basin, Eastern Himalayas, Mekong, Southwest Australia and the Yangtze Basin, andthere has been a recent upsurge in the Brazilian Amazon. The least fragmented and degradedforests are in larger blocks such as Amazon and Congo; some worrying levels of fragmen-tation are occurring in places such as Amur Heilong, Atlantic Forests, Borneo, Cerrado-Pantanal, Choco-Darien, New Guinea, Southern Chile, Western Ghats and Yangtze.

A Case Study of Conservation Monitoring: WWF 3
Species populations: Worrying declines were seen in species such as Sumatran rhino and Yangtze finless porpoise, as well as some populations of tiger, polar bear, Asian elephant, turtle and chimpanzee. However, law enforcement and protection measures can, in many places, be associated with an increase in target species, such as:
Tiger populations in Nepal and Russia Asian one-horned rhino in Kaziranga, India and across Nepal African rhinos in Kwazulu Natal and some conservancies in Zimbabwe Far eastern leopards (or Amur leopards) in the Russian Far East, Amur Heilong Nesting hawksbill and green turtle populations in Malaysia Bison and black-footed ferrets in the Northern Great Plains, western USA Argali sheep in Gulzat Local Protected Area in the Altai-Sayan ecoregion.
Protected area coverage: In WWF priority places there has been an increase in protected area coverage of nearly 229 million hectares since 2008. Some of the largest protected areas established recently include:
Kavango-Zambezi Transfrontier Conservation Area in Angola, Botswana, Namibia, Zambia and Zimbabwe (44 million ha).
Prince Edward Islands marine protected area, South Africa (18 million ha) Moxos Plains Ramsar site, Bolivia (6.95 million ha).
Protected area management effectiveness: Whilst there are data gaps in many WWF priority places that need to be filled, analysis of existing data showed strongest ratings for protected areas in Western Ghats and Choco-Darien and the lowest ratings in the Caucasus, Coastal East Africa and West African Marine. Sustainable commodity production: More forest continues to come under sustainable management and certification schemes in many WWF programme sites, and some of the areas certified in FY13 included:
1 million ha in Cameroon 146,000 ha in southern Chile 100,000 ha of cork oak forest in Portugal 60,000 ha of community forests in southern Tanzania.
Market share of certified commodities: Commodities that saw an increase in market share from sustainable sources included pulp and paper (up 6.6 per cent) and timber (up more than 4 per cent). There was also progress on palm oil and cotton but little headway on soy and biomaterials. Lessons learnt WWF, as an international conservation organization with global goals, needs to track progress to see if it is realizing its ambitions, just as CBD Parties are tracking their Aichi Targets. Some key lessons learnt by WWF that are applicable to CBD include: Lesson 1: Harmonization of conservation measures used by governments and NGOs will facilitate improved monitoring of the impact of programmes and the delivery of global goals such as the Aichi Targets; it will also help ensure shared data collection and use and increase cost efficiencies. Lesson 2: NGOs like WWF which have similar indicators to CBD and are actively collecting and analyzing data can help governments monitor their contributions to Aichi Targets; NGO projects are often well placed to collect new data and fill gaps of mutual interest to CBD Parties.

A Case Study of Conservation Monitoring: WWF 4
Lesson 3: Partnerships between governments and civil society groups, NGOs and academiaare essential for the future development and use of monitoring systems, as well as therealization of global conservation goals.
Lesson 4: Even incomplete indicator sets and datasets can provide insight into progressagainst biodiversity conservation goals.
Lesson 5: Renewed efforts need to be made to fill data gaps, especially for indicatorsrelating to protected area management effectiveness and key species populations.
Lesson 6: Enabling conditions for large-scale monitoring systems to work and for data to becollected, analyzed and acted upon include a clear policy framework, established projectmanagement standards, and dedicated resources and capacity; appropriate databases arealso required to facilitate data management and analysis.
Lesson 7: Ownership of monitoring systems and motivation to collect data are enhanced ifindicators are chosen in a bottom up manner and reflect the needs of individual projects,programmes or countries as well as global goals.
Lesson 8: Putting monitoring into practice demonstrates the value of data over anecdotalreporting; a graph can tell a story better than a thousand words.
Lesson 9: Tracking of indicators should not only measure delivery of global goals but alsoform the basis for informed decision-making, policy development and adaptive management,to increase the use and multiplication of successful strategies and the review andimprovement of less successful ones.
Recommendations
Based on WWF’s experiences and lessons learnt, we would propose the followingrecommendations which might be useful for CBD Parties and their partners.
Recommendation 1: CBD Parties should continue to form partnerships with keystakeholders, such as NGOs, civil society groups and academic institutions, to collect andanalyze monitoring data relevant for Aichi Targets.
Recommendation 2: CBD Parties and their partners should put in place appropriatepolicies and standards that provide the resources and the enabling environment forconservation monitoring and the collection and sharing of data for measuring progressagainst Aichi Targets.
Recommendation 3: CBD Parties and their partners should work towards harmonizingmonitoring and reporting systems and, wherever possible, use the same indicators to allowcost effective data collection and sharing.
Recommendation 4: Renewed efforts are needed to fill data gaps, especially for indicatorsrelating to protected area management effectiveness and species populations.
Recommendation 5: Data on Aichi indicators should be analyzed regularly, even whenindicator sets and datasets are incomplete, to help assess progress and act to improvedelivery of the CBD strategic plan for biodiversity.
Recommendation 6: CBD Parties and their partners should use conservation measuresnot only to assess performance against Aichi Targets but also to form the basis for informeddecision-making, policy development and adaptive management, to increase the use and
A Case Study of Conservation Monitoring: WWF 5
multiplication of successful strategies and the review and improvement of less successfulones.
Recommendation 7: CBD Parties and their partners should develop any new indicatorswith a bottom up approach that helps ensure data collection is relevant to national or localproject monitoring as well as global monitoring.
Recommendation 8: CBD Parties and their partners should identify and document goodexamples of monitoring in action, with case studies of what works well and what works lesswell, so as to share, learn and improve.
We hope that NGOs and CBD Parties and their partners can continue to work together toensure improved and harmonized monitoring. This collaboration should lead to moreadaptive management of conservation programmes and to improved delivery of our mutualbiodiversity goals.

A Case Study of Conservation Monitoring: WWF 6
AcronymsASC Aquaculture Stewardship CouncilBCI Better Cotton InitiativeCAKPI Conservation Achievement Key Performance IndicatorCBD Convention on Biological DiversityCBO Community-based organisationCBRC China Banking Regulatory CommissionCITES Convention on International Trade in Endangered Species of Wild Fauna and
FloraCMP Conservation Measures PartnershipCSO Civil society organizationFSC Forest Stewardship CouncilFY financial yearGEO-BON Group on Earth Observations – Biodiversity Observation Networkha hectares (100 hectares = 1 square kilometre)IUCN International Union for Conservation of Naturekg KilogramKPI Key Performance IndicatorLPI Living Planet IndexLPR Living Planet ReportMSC Marine Stewardship CouncilMTI Market Transformation InitiativeNGO Non-governmental OrganizationNP National ParkNR Nature ReservePA Protected AreaPAME Protected Area Management EffectivenessRSB Roundtable on Sustainable BiomaterialsRSPO Roundtable on Sustainable Palm OilRTRS Roundtable on Responsible SoyUNEP-WCMC United Nations Environment Programme World Conservation Monitoring
CentreWWF Worldwide Fund for NatureZSL Zoological Society of London
Acknowledgements
We would like to thank all the WWF programme teams who submitted reports for 2013, andTom McShane for help with the review and analysis of those reports. We are very grateful tothose who led the collection and analysis of indicator data: Neil Burgess, Tabaré A. Currás,Jonathan Loh, Laura Jungmann, Will Reidhead and Aurelie Shapiro. Florin Feraru wasinvaluable in creating the dashboards. Useful feedback on earlier drafts of this paper camefrom Dao Nguyen, Guenter Mitlacher and Stephanie Mansourian. Finally, our thanks go toLasse Gustavsson for being such a great champion for monitoring in WWF.

A Case Study of Conservation Monitoring: WWF 7
1 Introduction
The world’s biodiversity continues to decline (UNEP 2012; WWF 2012). In 2008, WWFestablished new and ambitious global goals for the organization to conserve biodiversity andreduce humanity’s Ecological Footprint (WWF 2008; Annex 1). This renewed effort fromWWF reflects the commitments made by many of the world’s governments, through theConvention on Biological Diversity (CBD), to reverse current trends by implementing theStrategic Plan for Biodiversity 2011-2020 and the Aichi Targets. The challenge for theworld’s conservation community is not only to deliver these ambitious goals but to measureprogress on their delivery, and provide evidence of positive change.
WWF made a major advance towards evidence-based conservation in 2006 by establishing aset of guidelines and tools for project cycle management, the WWF Standards forConservation Project and Programme Management (or Programme Standards), WWF’sversion of the Open Standards for the Practice of Conservation (CMP 2007, 2013). In thelast two years WWF made a concerted push to improve the quality of its monitoring andreporting and put more emphasis on tracking conservation impacts and outcomes. Part of theWWF monitoring system involves measuring indicators common to programmes applyingsimilar strategies on similar biodiversity targets, and many of these common indicators arethe same as, or linked to, those being used by CBD Parties to track the implementation of theAichi Targets.
This paper presents some of WWF’s experiences in impact and outcome monitoring andprovides lessons and recommendations which might be useful for CBD Parties and theirpartners.
2 WWF’s Monitoring and Reporting System
2.1 Key elements of WWF’s monitoring and reporting system
In 2013 WWF started implementing an improved monitoring and reporting system to trackthe performance, outcomes and impacts of more than 60 global priority conservationprogrammes and their contributing projects. The improved system involves global priorityprogrammes following existing best practices by:
Establishing measurable goals and objectives using the WWF Programme StandardsMeasuring outcomes and impacts through the use of indicators to track delivery ofobjectives as well as long-term (often 2020) goals.Tracking delivery of annual results (interim objectives) through a conservationachievement key performance indicator (KPI).
In addition, a set of more than 20 indicators common to programmes applying the sameconservation strategies was identified to support meaningful aggregation and analysis ofoutcomes and impacts at the portfolio level (Table 1). These indicators measure state (habitatcover and fragmentation; flagship species populations; ocean health; species diversity;environmental flows), pressures (habitat loss and degradation; river fragmentation; speciesofftake and over-exploitation, carbon dioxide emissions; energy consumption), responses(protected areas size and management effectiveness; sustainable production of commodities,energy and water; wildlife trade) and benefits (beneficiaries, partnerships). Eleven of WWF’scommon indicators were active in 2013 (i.e. data were collected and used in reporting forfinancial year 2013); the remainder (marked in italics in Table 1) will be finalized in 2014-15.

A Case Study of Conservation Monitoring: WWF 8
Table 1: WWF global goals and indicators in relation to Aichi Targets and indicators. Indicators common or very similar for both systems are highlighted in green. WWF indicators in italics are in development (and may be adapted) and do not appear in the data analyses presented in this paper. WWF global goals WWF indicators Aichi indicators Aichi targets Biodiversity goal - places By 2020, biodiversity is protected and well managed in the world’s most outstanding natural places
S1. Habitat cover Number of hectares of intact natural habitat cover, disaggregated by forest, coral reef, wetlands, rivers, etc S2. Habitat fragmentation Score on habitat fragmentation index P1. Habitat loss and degradation Number of hectares of habitat cover lost, disaggregated by forest, coral reef, wetlands, river length, etc S4. Environmental flows Draft: Number of kilometres of river system with improved environmental flows P4. River fragmentation Draft: Dam status in priority rivers and kilometres of length affected
Extent of forests and forest types River fragmentation and flow regulation Global wild bird index
Aichi Target 5: Loss of habitats By 2020, the rate of loss of all natural habitats, including forests, is at least halved and where feasible brought close to zero, and degradation and fragmentation is significantly reduced.
S5. State of the ocean (to be determined) A relevant measure of the state of the oceans and marine habitats
Ocean Health Index Climatic impacts on European birds Cumulative human impact on marine ecosystems
Aichi Target 10: Vulnerable ecosystems By 2015, the multiple anthropogenic pressures on coral reefs, and other vulnerable ecosystems impacted by climate change or ocean acid-ification are minimized, so as to maintain their integrity and functioning.
R1. Size of protected areas Number of hectares of habitat under formal protection, disaggregated by forest, marine, and freshwater. R2. Protected area management effectiveness Weighted average rating of management effectiveness for all existing protected areas within a priority programme.
Coverage of protected areas Management effectiveness of protected areas Protected area overlays with biodiversity
Aichi Target 11: Protected Areas By 2020, at least 17% of terrestrial and inland water, and 10% of coastal and marine areas, especially areas of particular importance for biodiversity and ecosystem services, are conserved through effectively and equitably managed, ecologically representative and well connected systems of protected areas and other effective area-based conservation measures, and integrated into the wider land.

A Case Study of Conservation Monitoring: WWF 9
WWF global goals WWF indicators Aichi indicators Aichi targets S6. Species diversity index Numbers and relative abundance of species
Biodiversity goal - species By 2020, populations of the most ecologically, economically and culturally important species are restored and thriving in the wild
S3. Flagship species populations. Population numbers of flagship species (from sources such as Living Planet Index) and species populations or indices in priority places P2. Offtake of flagship species. Draft: Number of WWF flagship species killed by poaching, retaliation, and bycatch P3. Over-exploitation of footprint species. Draft: Number of selected footprint species populations exceeding sustainable yields R3. Wildlife trade Draft: Number and percentage of selected species of concern appearing in local markets
Living Planet Index IUCN Red List Index Wildlife Picture Index
Aichi Target 12: Preventing extinctions By 2020 the extinction of known threatened species has been prevented and their conservation status, particularly of those most in decline, has been improved and sustained.
Footprint goal By 2020, humanity’s global footprint falls below its 2000 level and continues its downward trend, specifically in the areas of: - Energy/ carbon footprint - Commodities (crops, meat,
fish and wood) footprint - Water footprint
Global indicator: Ecological Footprint
Ecological Footprint (Red List) status of species in trade
Aichi Target 4 – Use of natural resources By 2020, at the latest, Governments, business and stakeholders at all levels have taken steps to achieve or have implemented plans for sustainable production and consumption and have kept the impacts of use of natural resources well within safe ecological limits.
R4a. Sustainable production of commodities Number of: - hectares certified (timber, pulp & paper) - metric tonnes certified (fish, seafood, crops such as soy, cotton, sugar, etc) R4b. Sustainable production of commodities -Percentage market share (uptake) for key commodities (i.e. % of total production certified)
Number of MSC certified fisheries Marine trophic index
Aichi Target 6: Sustainable fisheries By 2020 all fish and invertebrate stocks and aquatic plants are managed and harvested sustainably, legally and applying ecosystem based approaches, so that over-fishing is avoided, recovery plans and measures are in place for all depleted species, fisheries have no significant adverse impacts on threatened species and vulnerable ecosystems and the impacts of fisheries on stocks, species and ecosystems are within safe biological limits.

A Case Study of Conservation Monitoring: WWF 10
WWF global goals WWF indicators Aichi indicators Aichi targets Proportion of fish stocks in safe biological limits The Red List Index for seabirds. Area of forest under sustainable management: certification Wild bird index for farmland birds
Aichi Target 7: Areas under sustainable management Target 7: By 2020 areas under agriculture, aquaculture and forestry are managed sustainably, ensuring conservation of biodiversity.
P5. CO2 gas emissions. Energy-related CO2 emissions (gigatonnes) regionally and in focus countries and target sectors
P6. Energy consumption. Total (and renewable) energy consumption (million tonnes of oil equivalent) in focus countries
R5. Sustainable production of energy. Total RES (renewable energy sources) global installed electric power capacity (terawatts), and its market share, disaggregated by key technology and in focus countries.
R6. Sustainable production of water Draft: Number of cubic km (water) benefitting from ‘sustainable production’ within the boundaries of the Priority Programme
Cross-cutting (biodiversity and footprint) indicators:
B1. Number of beneficiaries. Draft: Number of households better off as a result of conservation interventions I1. Partnerships Draft: Number of programme-level partnerships formalised in support of strategic conservation outcomes
A Case Study of Conservation Monitoring: WWF 11
Note that the WWF common indicators were largely derived from the programmes’ strategies; this bottom-up approach means that the indicator set is largely owned already by the programme staff concerned. WWF has also identified a small set of global indicators that help measure the delivery of its meta-goals (a higher level set of 2050 biodiversity and footprint goals). These include global-level aggregations of some of the common indicators (e.g. species populations, habitat loss, sustainable commodity production), as well as Ecological Footprint. The WWF monitoring system uses programme reports, evaluations and external data to provide information to a range of audiences, including programme management teams, oversight and governance bodies (such as the WWF International Board and Conservation Committee), as well as donors and other stakeholders. This information has multiple uses including: information sharing, increasing knowledge, exploring effectiveness and impact, measuring compliance and, perhaps most importantly, for adaptive management – responding to data by replicating what works well and changing what works less well. The main emphasis, however, remains on programme teams monitoring for their own adaptive management needs, and securing impact and outcome data that help them measure progress towards their goals. WWF applies a system of peer review to annual programme reports which provides teams with feedback as well as opportunities for cross-learning. In 2013 all programme reports were reviewed by at least two colleagues. 2.2 Comparison between WWF and CBD goals and indicators Several of the WWF common programme indicators are the same or similar to those being used by the CBD (Chenery et al. 2013) to track delivery of the Aichi Targets (Table 1). WWF indicators overlap with those identified for seven of the 20 Aichi targets: 4, 5, 6, 7, 10, 11 and 12, which tackle CBD strategic goal A on underlying causes of biodiversity loss (Target 4), strategic goal B on reducing direct pressures (Targets 5, 6 and 7) and strategic goal C on improving biodiversity status (Targets 11 and 12). Clustering WWF common indicators according to the pressure-state-response-benefit model (see, e.g., Butchart et al. 2010; Sparks et al. 2011) was done explicitly to reflect how they relate to each other and to allow WWF to compare its work with CBD indicators. Indicators common to CBD are also used by a number of other organizations often through consortia and partnerships (e.g. the Biodiversity Indicators Partnership http://www.bipindicators.net/, GEO-BON https://www.earthobservations.org/geobon.shtml , and the Conservation Measures Partnership www.conservationmeasures.org). The main similarities between WWF and Aichi Target indicators are:
There are eleven indicators common to both systems using the same or similar measures for habitat cover and loss, environmental flows, river fragmentation, state of the oceans, protected areas coverage, protected areas management effectiveness, species populations, Ecological Footprint, certified fisheries and certified forests.
Several data sources are the same (e.g. ZSL/WWF Living Planet Index for species populations, UNEP-WCMC/University of Queensland protected area management effectiveness database, Ecological Footprint Network for Ecological Footprint).
The main differences between the WWF and Aichi Target indicators are:
WWF goals tend to be broader than Aichi Targets; Aichi Targets tend to be more focused on threat reduction.
CBD indicators are collected at the national level, whereas many of WWF’s indicators are required at the ecoregion level or landscape level.

A Case Study of Conservation Monitoring: WWF 12
WWF has indicators linked to footprint as well as biodiversity goals (though the Aichi Target indicators on sustainable production overlap with some of WWF footprint indicators).
WWF does not have equivalent goals or indicators relating to 13 of the Aichi Targets (1-3, 8, 9, 13-20).
There are no Aichi Target indicators that are equivalent to nine WWF indicators (see Table 1).
2.3 Key actions and resources required to implement the WWF monitoring and reporting system Monitoring is an integral and long-standing component of project cycle management (e.g. Margoluis & Salafsky 1998), but it does not happen without an injection of effort and resources. In order to enable its improved monitoring system in 2013, WWF had to mobilize staff and resources internally, and in partner agencies. The following actions and resources were required and will continue to be required by WWF and its partners to implement the system.
a) Having standards in place Action taken: The WWF Programme Standards were developed and in place
since 2006; a community of practice of Programme Standards practitioners has been active since 2008 and WWF has been actively engaged in key partnerships (e.g. the Conservation Measures Partnership) to implement the standards.
Future action needed: The Programme Standards need to be kept updated fresh and relevant, especially with good examples.
Resources: WWF staff time. Examples: Development of clear, measurable goals and the collection of data for
a key set of indicators has helped several WWF programmes monitor progress effectively, examples including the LIFE Programme in Namibia working on communal conservancies, and the Market Transformation Initiative working globally on sustainable commodity production.
b) Adopting a policy
Action taken: Key WWF governance bodies (e.g. International Board, Conservation Committee) approved the system – the reporting and the common indicators - and in doing so provided a mandate for its application. Without this policy in place it would have been difficult to make as much progress as we have.
Future action needed: WWF is developing a planning, monitoring and evaluation policy to create the enabling conditions for improved transparency and adaptive management, and to make expectations clearer.
Resources: WWF staff time. Example: The WWF International Board and Conservation Committee approved
the improved system for impact monitoring in 2012 and discussed the results of the 2013 report.
c) Allocating resources
Action taken: Since 2007 WWF International has employed a team – the Conservation Strategy & Performance Unit – that is dedicated to improving the adoption of the Programme Standards and improving results-based management (management focused on measurable results) across the organization; since 2012, governance bodies asked priority programmes to allocate at least 5 per cent of their budgets to monitoring.
Future action needed: Programmes will need to set aside adequate staff time and resources for monitoring to ensure strategic plans and indicators are perfected and data are collected and analyzed.

A Case Study of Conservation Monitoring: WWF 13
Resources: Core team for development of common standards and central analysis of data; a minimum of 5 per cent of programme budgets.
Examples: The creation of the Conservation Strategy & Performance Unit enabled a significant increase in support for projects for training in, and application of, the Programme Standards as well as the development of improved global monitoring and reporting systems across WWF. Several of WWF’s larger-scale programmes have also assigned dedicated staff for planning and/or monitoring (e.g. Coastal East Africa Initiative, Green Heart of Africa Programme in the Congo Basin).
d) Improving programme goals and indicators
Action taken: In the last two years, WWF priority programmes underwent strategy revisions to make goals more measurable and develop appropriate indicators.
Future action needed: Those programmes that do not yet have appropriate indicators at the right scale to measure progress against their goals and objectives will develop them in the context of robust strategic plans, and ensure that relevant common indicators are integrated into programme plans.
Resources: Staff time (WWF and implementing partners). Examples: The WWF Tigers Alive Initiative set a clear measurable goal around
doubling tiger population numbers; the team found this provided a clear anchor to the strategic plan; other programmes, such as the WWF Smart Fishing Initiative, reduced the number of programme objectives to allow more focus on transformational and measurable strategies.
e) Collecting data to measure indicators
Action taken: In 2012-13, existing global datasets were used to provide data on eleven WWF common indicators, and several programmes collected their own data locally.
Future action needed: Future data collection will be done at a range of levels. For example, programmes and their partners will need to collect some data “on site”; WWF International and other WWF teams and their partners will access internal and external datasets.
Resources: Staff time (WWF and partners); training costs; field equipment; consultancy fees; data acquisition.
Examples: For 2013 reporting, most impact and outcome data came from external sources including the Ecological Footprint Network, the Forest and Marine Stewardship Councils, IUCN, UNEP World Conservation Monitoring Centre, the Universities of Maryland and Queensland, the Zoological Society of London, etc. (see Annex 2 for complete list). Several field programmes also collected outcome and impact data (e.g. the Asian Rhino and Elephant Programme, the Amur-Heilong Programme, the Altai-Sayan Programme).
f) Reporting
Action taken: A standard technical progress report format was established, which includes a tabular monitoring report; projects and programmes submit an end of year report in July-August each year. Peer reviews that engage the WWF network are undertaken of both the narrative report and the monitoring tables.
Future action needed: Programme staff will need to ensure technical progress reports include data on impacts and outcomes. Improved guidance and training on report completion and use will be valuable.
Resources: WWF staff time. Example: In 2013, reports were submitted by 56 out of 66 programmes and used
in the compilation of a global overview report – the WWF Global Conservation Programme Report FY13 (Stephenson, O’Connor & McShane 2013).

A Case Study of Conservation Monitoring: WWF 14
g) Maintaining databases Action taken: A database was established centrally at WWF International to
collate data on common indicators. Future action needed: The WWF knowledge management system - Insight –
will be updated to allow the direct upload of monitoring data along with other information from project and programme reports. Insight will be the primary repository for monitoring data and allow easier access and analysis for programme staff and improved generation of dashboards and consolidated reports.
Resources: WWF staff time; consultancies for information technology contractors and software developers.
Example: From this year onwards it is planned that all elements of the WWF annual technical progress report will be loaded directly by programme staff into a central database online.
h) Building capacity
Action taken: Physical and online training sessions have been run for staff on planning and monitoring, and virtual conferences were held to explain annual reporting; a WWF capacity building plan for results-based management has been developed.
Future action needed: Training and direct technical support will continue to be provided to programme staff in planning, monitoring and evaluation.
Resources: Core team dedicated to results based management (Conservation Strategy & Performance Unit); network of coaches/facilitators and practitioners able to conduct training and offer technical advice; membership fees for key partnerships (e.g. Conservation Measures Partnership).
Example: Each year two online training courses are offered to WWF staff in the define and design steps of the Programme Standards. Each course trains around 30-40 people.
In summary, key actions and resources that created an enabling environment for impact monitoring in WWF revolved around having a policy in place with high-level support, well-established standards for planning and monitoring and reporting, capacity in key pro-grammes (a critical mass that allowed reporting), and a dedicated central team to set standards and collate and analyze data. 2.4 Key outputs of the WWF monitoring and reporting system WWF collects data from programme monitoring systems and global datasets and presents them in three types of reports, which are used by different audiences for a variety of purposes but most importantly for adaptive management. Programme annual technical progress reports (with full monitoring tables showing measurement of indicators) are produced by each global priority programme team, taking account of reports from any projects contributing directly to the programme’s objectives.
Primary audience: Priority programme managers, their teams and their governance bodies Key questions answered: Have we seen tangible outcomes or impacts? How did the programme do against its expected results for the year? Has the programme made any major achievements or had any major setbacks? What are the challenges identified and lessons learnt? Which strategies are working well and which are working less well? What adaptive management is the programme applying to make necessary changes? Potential adaptive management responses: Replicate or multiply successful strategies; adapt strategies that are less effective or tackle the blockages to their success; share key lessons.

A Case Study of Conservation Monitoring: WWF 15
Global conservation programme reports are produced annually by WWF International with support from network staff. These include an assessment of progress for more than 65 WWF priority programmes (including place-based ecoregion programmes, species programmes, and footprint or driver-based programmes) and hundreds of projects that contribute to delivery of WWF’s global goals and priorities (WWF 2008, Annex 1). The information compiled for this report comes from year-end technical progress reports from priority programmes and from data collected and compiled against the common indicators (Table 1). All programme reports are reviewed to provide input and analysis for the report. In addition, most reports are peer reviewed to provide feedback to programme teams. From 2013, it includes dashboards using common indicators to track impacts and outcomes across the portfolio.
Primary audience: Programme leaders (to compare with other programmes and identify common issues, challenges, trends and lessons); governance bodies (to be able to track progress across the portfolio and identify lessons and necessary management actions). Key questions answered: Are we meeting our programmes’ goals and objectives and having an impact? (i.e. are biodiversity and footprint targets in the scope of the programme changing over time?). What technical and operational factors are influencing programmes’ performance? What challenges and strengths exist in the portfolio? What are the lessons learnt and adaptive management being applied within and between programmes? Potential adaptive management responses: Adapt strategies to take account of lessons; adapt the programme portfolio to harness our strengths or meet new challenges.
Evaluation reports are produced by internal and external evaluation teams. Evaluations assess efficiency of delivery of outputs, effectiveness of delivery of intermediate results and outcomes, and impact on our conservation targets. Evaluations are key to enhancing the effectiveness of programmes by developing recommendations to improve design or implementation, enhance WWF's accountability, credibility, and transparency with respect to investment, and improve WWF’s overall impact by drawing key lessons for broader organizational learning.
Primary audience: Programme leaders, programme and network governance bodies, donors. Key questions answered: What impact is the programme having? Is the programme being implemented well? Is the programme designed and managed in a manner that aligns to WWF’s best practices and policies? How can the programme be managed better and implemented to improve outcomes, impacts, and efficiency, and demonstrate more credibly the evidence for results? What can we learn from this programme that can benefit WWF? Potential adaptive management responses: Responses are numerous, but include adapting strategies, improving plans and systems, changing human resources, etc; learning from evaluations also shapes future programmes and the programme portfolio.
3 Indicators and Data Analysis – examples from the WWF Global Conservation Programme Report relevant to Aichi Targets In December 2013, WWF produced its Global Conservation Programme Report FY13 (Stephenson, O’Connor & McShane 2013) showing the organization’s progress in financial year 2013 (FY13: July 2012 to July 2013) against its global goals.
A Case Study of Conservation Monitoring: WWF 16
Impact and outcome dashboards summarized delivery by global priority place-based pro-grammes, flagship species programmes and commodity footprint programmes (Annex 2), as well as for energy and climate (not discussed here). Each dashboard showed:
The Conservation Achievement Key Performance Indicator, calculated from the programme’s monitoring table in its annual report, to provide a measure of progress against expected results (planned intermediary results) for the year;
A summary of key achievements and challenges extracted directly from pro-gramme reports, especially if there are direct links (and sometimes attribution) to outcomes and impacts; and
Available data on 11 of the proposed 21 common impact and outcome indicators, sourced primarily from external datasets.
Examples of information and data in WWF’s annual report that are of relevance to the monitoring of Aichi Targets are presented below. Note that the results reported here were not achieved by WWF alone, but through partnerships with a range of governmental and non-governmental organizations. The data are taken from global datasets (see Annex 2) or directly from technical progress reports completed by WWF programme staff. 3.1 What is being achieved against WWF’s global biodiversity goals?
WWF’s biodiversity goals relate to places (linked to Aichi Targets 5, 10 and 11) and species (linked to Aichi Target 12) (Table 1). 3.1.1 Forest cover / deforestation (Aichi Target 5, WWF indicators S1, S2 & P1) Analysis of habitat cover data (see Place-based Programmes Dashboard, Annex 2) demon-strates that deforestation rates have generally declined in WWF priority places in the last five years, but places with increased deforestation include Choco Darien, Congo Basin, Eastern Himalayas, Mekong, Southwest Australia and the Yangtze Basin. Whilst the Amazon has seen a decline in deforestation in recent years, in November 2013 the Brazilian government announced a 28 per cent increase in deforestation in the Brazilian Amazon in the period August 2012 to July 2013. As expected most of the least fragmented and degraded forest is in the larger blocks such as Amazon and Congo; some worrying levels of fragmentation are occurring in places such as Amur Heilong, Atlantic Forests, Borneo, Cerrado-Pantanal, Choco-Darien, New Guinea, Southern Chile, Western Ghats and Yangtze. This highlights the need to ensure programmes factor into their planning and monitoring not only the protection of the forest but also the quality of the forest. 3.1.2 Species populations (Aichi Target 12, WWF indicator S3) Law enforcement and protection measures supported by WWF can, in many places, be asso-ciated with an increase in some flagship (i.e. WWF target) species populations. Examples include:
Since 2009, tiger populations in Nepal have increased by 64 per to 198 animals, with major increases in Bardia National Park (NP) (tripled), Suklaphanta Wildlife Reserve (doubled) and Chitwan (up more than 30 per cent); in Russia tigers are stable in most areas and with an increase of 30 per cent in Anuiskiy National Park (t0 17).
Asian one-horned rhino numbers are rising, especially in Kaziranga, India and across Nepal (key sites supported by the WWF Asian Rhino and Elephant Programme), driven by a reduction in poaching as a result of improved law enforcement.
African rhinos in some WWF projects sites increased (e.g. 8% in Kwazulu Natal, 3% and 5% for black and white rhino in lowveld conservancies, Zimbabwe) or stabilized (e.g. in Save Valley, Zimbabwe), growth in well protected populations countering poaching – though the threat does not appear to be abating.

A Case Study of Conservation Monitoring: WWF 17
A census of far eastern leopards (or Amur leopards) in the Russian Far East of Amur Heilong found 48-50 adults and 4-5 cubs, 1.5 times the number five years ago; leopard range is expanding towards the coast and an animal was found on the border with North Korea – the first such case since the last century.
Hawksbill and green turtle populations in Malaysia saw egg production rise 83 per cent and 126 per cent respectively.
Some success stories with species of importance in WWF priority places are also worth noting, such as:
Jaguars stabilized within the Atlantic Forest in Argentina, though at low densities (c. 1 individual/10,000 ha)
Oriental storks in Amur Heilong ecoregion (Russia, China and Mongolia) are stable at key sites (e.g. Amurskya province and Khanka Lake Nature Reserve)
Bison and black-footed ferrets are increasing slowly in the Northern Great Plains ecoregion in the western United States
Argali sheep numbers have risen from 161 in 2003 to 891 in 2011 in Gulzat Local Protected Area in the Altai-Sayan ecoregion in Russia and Mongolia.
Some flagship species populations are showing worrying declines. Sumatran rhino numbers halved in the last three years to around 80 animals and no reproduction is reported in pop-ulations outside Sumatra. WWF co-organized a conference of key stakeholders, which led to agreement on the goals of a recovery programme. Yangtze finless porpoises are decreasing by 14 per cent per annum and now stand at around 1,040 animals; this population trend seems to be going in the same direction as the now extinct Yangtze river dolphin! Some tiger, polar bear, Asian elephant, turtle and chimpanzee populations are also declining. In some cases data are absent or out of date on the populations of key species or sub-species. For example, population data on African elephants are only consolidated up to 2007 (Blanc et al. 2007) yet recent sub-population surveys show some dramatic declines (Maisels et al. 2013). Marine species pose additional technical challenges to monitoring. More effort needs to be made to track the populations of species of conservation concern and to share data so we can see if conservation responses are having an impact. 3.1.3 Protected area coverage (Aichi Target 11, WWF indicator R1) Protected areas remain an important WWF strategy for conserving priority places and species. Some important examples that WWF has helped support include:
The South African government declared the Prince Edward Islands a marine pro-tected area, covering 18 million ha.
In Bolivia, Moxos Plains, 6,947,933 ha of Amazon floodplains, became the largest Ramsar Site in the world.
In Namibia communal conservancies now cover 16,043,000 ha, while total land under some form of conservation management has increased to 43 per cent of the nation’s surface area. Thirty-two of the communal conservancies are located immediately adjacent to or in key corridors between national parks, strongly enhancing the viability of Namibia’s protected areas network.
The commencement in 2012 of the 44 million ha Kavango-Zambezi Transfrontier Conservation Area, KAZA, by the governments of Angola, Botswana, Namibia, Zambia and Zimbabwe is providing increasing opportunity for multiplication of the successes of Namibia’s community-based natural resource management programme.
Overall in WWF priority places there has been an increase in protected area coverage of nearly 229 million hectares since 2008, with major additions to the networks in places such as the Amazon (largely through the Amazon Regional Protected Areas Programme), Arctic, Congo Basin, Namib-Karoo and Yangtze Basin. However, globally half of the important sites
A Case Study of Conservation Monitoring: WWF 18
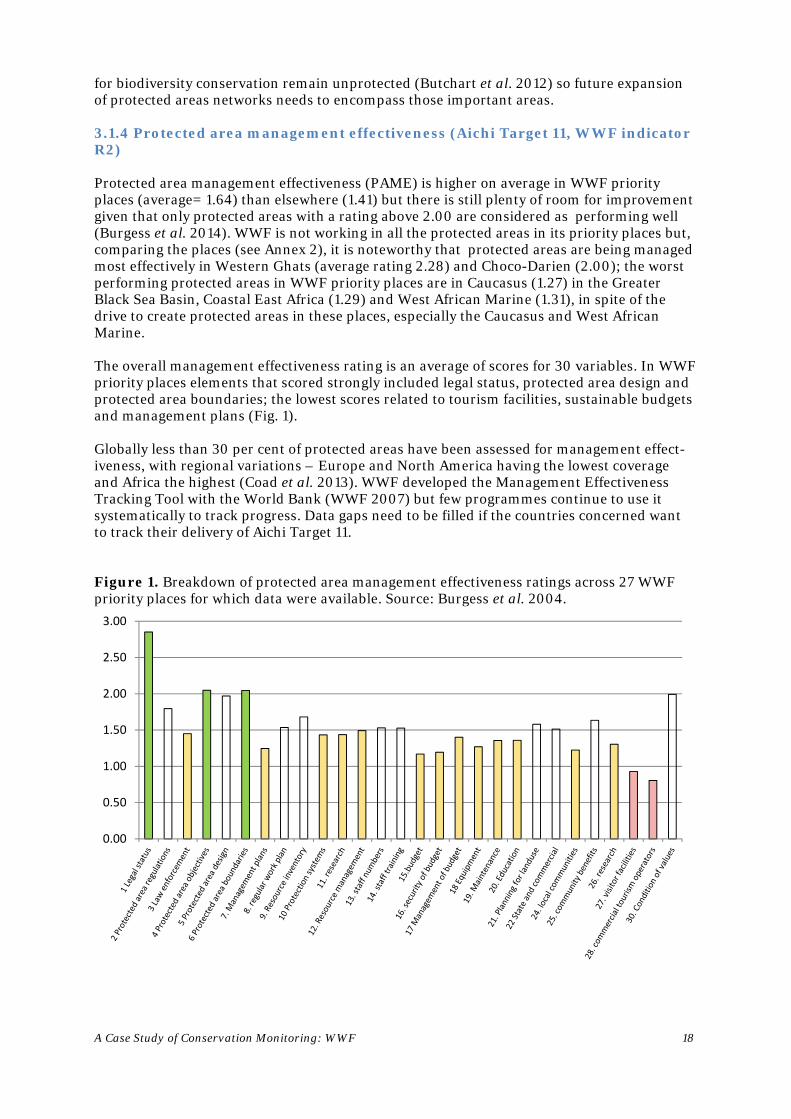
for biodiversity conservation remain unprotected (Butchart et al. 2012) so future expansion of protected areas networks needs to encompass those important areas. 3.1.4 Protected area management effectiveness (Aichi Target 11, WWF indicator R2) Protected area management effectiveness (PAME) is higher on average in WWF priority places (average= 1.64) than elsewhere (1.41) but there is still plenty of room for improvement given that only protected areas with a rating above 2.00 are considered as performing well (Burgess et al. 2014). WWF is not working in all the protected areas in its priority places but, comparing the places (see Annex 2), it is noteworthy that protected areas are being managed most effectively in Western Ghats (average rating 2.28) and Choco-Darien (2.00); the worst performing protected areas in WWF priority places are in Caucasus (1.27) in the Greater Black Sea Basin, Coastal East Africa (1.29) and West African Marine (1.31), in spite of the drive to create protected areas in these places, especially the Caucasus and West African Marine. The overall management effectiveness rating is an average of scores for 30 variables. In WWF priority places elements that scored strongly included legal status, protected area design and protected area boundaries; the lowest scores related to tourism facilities, sustainable budgets and management plans (Fig. 1). Globally less than 30 per cent of protected areas have been assessed for management effect-iveness, with regional variations – Europe and North America having the lowest coverage and Africa the highest (Coad et al. 2013). WWF developed the Management Effectiveness Tracking Tool with the World Bank (WWF 2007) but few programmes continue to use it systematically to track progress. Data gaps need to be filled if the countries concerned want to track their delivery of Aichi Target 11. Figure 1. Breakdown of protected area management effectiveness ratings across 27 WWF priority places for which data were available. Source: Burgess et al. 2004.
0.00
0.50
1.00
1.50
2.00
2.50
3.00

A Case Study of Conservation Monitoring: WWF 19
3.1.5 Sustainable management and certification (Aichi Targets 6 & 7, WWF indicator R4) More forest continues to come under sustainable management and certification schemes in many WWF programme sites, and some of the areas certified in FY13 included:
Certified forest in the Congo Basin is up to 5,316,000 ha due to 1 million ha of newly certified forest in Cameroon
146,000 ha of natural forests were FSC (Forest Stewardship Council) certified in southern Chile
In the Mediterranean, 100,000 ha of cork oak forest in Portugal (15 per cent) is now FSC certified
60,000 ha of community forests were certified and are being sustainably managed in southern Tanzania, making a total of 82,737 ha
In Choco-Darien, the Emberá-Wounaan comarca indigenous reserve in Panama (43,000 ha) was FSC certified (345 families - 1,792 people - participate in forest management).
Other land is being certified for commodity production. For example, the Bonsucro standard for agricultural best practices is being well adopted in Brazil, reaching 658,631 ha (7.8 per cent of the total area), partly in the Atlantic Forests. In Cerrado-Pantanal, 30,000 ha of land was certified for production of organic beef, reaching approximately 140,000 ha in total. 3.2 What is being achieved against WWF’s global footprint goal? WWF’s footprint goal relates to Aichi Targets 4, 6 and 7 (Table 1). The percentage market share of a range of key certified commodities increased in 2013 (Commodity Footprint Programmes Dashboard, Annex 2), most notably pulp and paper (up 6.6 per cent) and timber (up more than 4 per cent). There was also progress on palm oil and cotton but little headway was made on soy and biomaterials. Setbacks this year included certification of Mozambican shrimp fisheries being hindered by signs the fishery is collapsing. 3.3 Is WWF delivering on its 2020 global goals?
As per its long-term goals (Annex 1), by 2020 WWF is aiming to ensure:
Biodiversity is protected and well managed in the world’s most outstanding natural places
Populations of the most ecologically, economically and culturally important species are restored and thriving in the wild
Humanity’s global footprint falls below its 2000 level and continues its downward trend, specifically in the areas of energy/carbon footprint, commodities (crops, meat, fish and wood) footprint and water footprint.
In other words, WWF goals state that, by 2020, global priority places will be protected and well managed (which links to Aichi Targets 5, 10 and 11), flagship species will be thriving (which links to Aichi Target 12), and the Ecological Footprint will be reduced (which links to Aichi Targets 4, 6 and 7). WWF acknowledges that it is not the only body responsible for conservation of its global priority places and species, or for reducing footprint, and success depends also on its partner governments and agencies, other NGOs, local people and community-based organizations. As a result, progress cannot always be attributed directly to WWF; however, it is still important to analyze data and assess progress against the institutional goals and to adapt strategies accordingly. It is noteworthy that WWF is developing an indicator on partnerships with the specific aim of measuring and more clearly tracking contributions of other agencies and people to WWF goals.
A Case Study of Conservation Monitoring: WWF 20
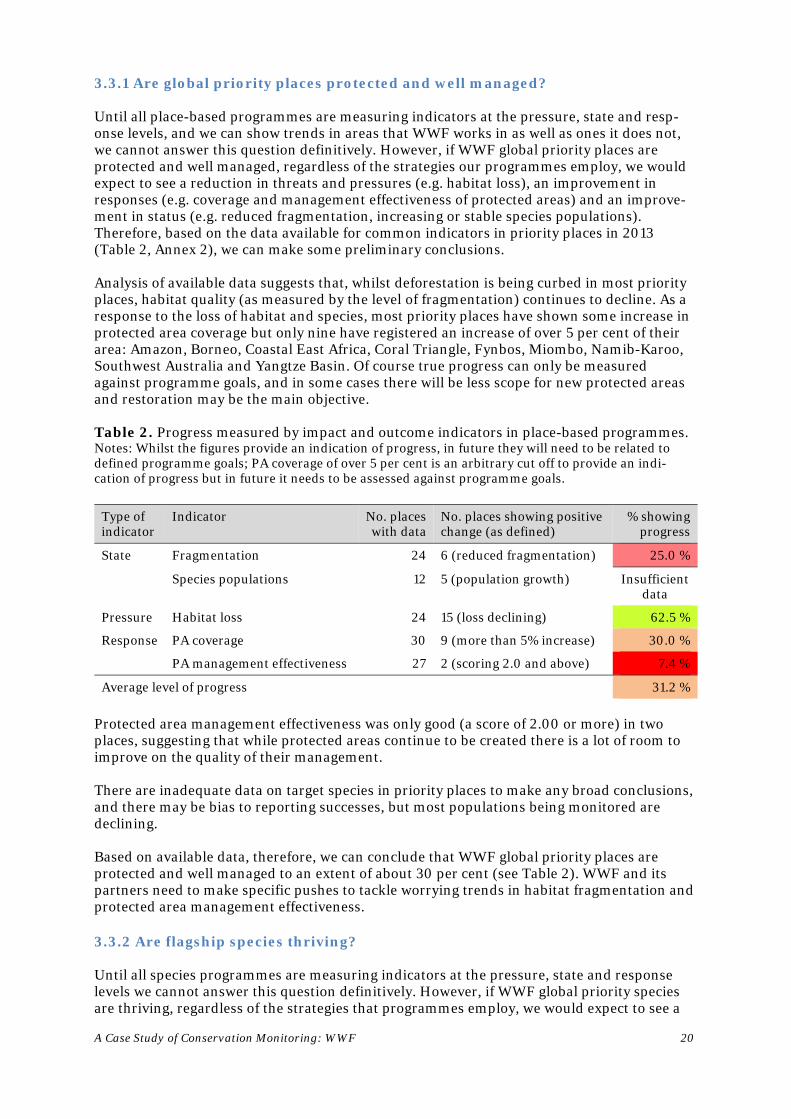
3.3.1 Are global priority places protected and well managed? Until all place-based programmes are measuring indicators at the pressure, state and resp-onse levels, and we can show trends in areas that WWF works in as well as ones it does not, we cannot answer this question definitively. However, if WWF global priority places are protected and well managed, regardless of the strategies our programmes employ, we would expect to see a reduction in threats and pressures (e.g. habitat loss), an improvement in responses (e.g. coverage and management effectiveness of protected areas) and an improve-ment in status (e.g. reduced fragmentation, increasing or stable species populations). Therefore, based on the data available for common indicators in priority places in 2013 (Table 2, Annex 2), we can make some preliminary conclusions. Analysis of available data suggests that, whilst deforestation is being curbed in most priority places, habitat quality (as measured by the level of fragmentation) continues to decline. As a response to the loss of habitat and species, most priority places have shown some increase in protected area coverage but only nine have registered an increase of over 5 per cent of their area: Amazon, Borneo, Coastal East Africa, Coral Triangle, Fynbos, Miombo, Namib-Karoo, Southwest Australia and Yangtze Basin. Of course true progress can only be measured against programme goals, and in some cases there will be less scope for new protected areas and restoration may be the main objective. Table 2. Progress measured by impact and outcome indicators in place-based programmes. Notes: Whilst the figures provide an indication of progress, in future they will need to be related to defined programme goals; PA coverage of over 5 per cent is an arbitrary cut off to provide an indi-cation of progress but in future it needs to be assessed against programme goals.
Type of indicator
Indicator No. places with data
No. places showing positive change (as defined)
% showing progress
State Fragmentation 24 6 (reduced fragmentation) 25.0 %
Species populations 12 5 (population growth) Insufficient data
Pressure Habitat loss 24 15 (loss declining) 62.5 %
Response PA coverage 30 9 (more than 5% increase) 30.0 %
PA management effectiveness 27 2 (scoring 2.0 and above) 7.4 %
Average level of progress 31.2 %
Protected area management effectiveness was only good (a score of 2.00 or more) in two places, suggesting that while protected areas continue to be created there is a lot of room to improve on the quality of their management. There are inadequate data on target species in priority places to make any broad conclusions, and there may be bias to reporting successes, but most populations being monitored are declining. Based on available data, therefore, we can conclude that WWF global priority places are protected and well managed to an extent of about 30 per cent (see Table 2). WWF and its partners need to make specific pushes to tackle worrying trends in habitat fragmentation and protected area management effectiveness. 3.3.2 Are flagship species thriving? Until all species programmes are measuring indicators at the pressure, state and response levels we cannot answer this question definitively. However, if WWF global priority species are thriving, regardless of the strategies that programmes employ, we would expect to see a

A Case Study of Conservation Monitoring: WWF 21
reduction in threats and pressures (e.g. habitat loss, species offtake), an improvement in responses (e.g. coverage and management effectiveness of protected areas, wildlife trade controls) and an improvement in status (e.g. increasing or stable species populations). Based on the population data available for WWF flagship species this year (Table 3) it appears that most species are declining, and only species or subspecies in three flagship groups are stable or increasing. Overall, of 62 species or sub-species for which enough information exists, only eleven (17.7 per cent) are likely to be stable or increasing. Globally 52 per cent of all mammal species for which population trends are known are declining (Schipper et al. 2008). Of the WWF target mammals species and subspecies (i.e. excluding turtles), 84 per cent are declining. This suggests that the declines in flagship species WWF focuses on – mostly larger mammals - are disproportionately high, probably reflecting the general trend for larger mammals to be threatened by hunting more than smaller ones (Schipper et al. 2008). We therefore conclude that less than 18 per cent of the species and subspecies in WWF flagship groups are thriving. Comparing across flagship species groups (which gives equal weighting to groups with one species or groups with tens of species), on average 34.6 per cent of species or subspecies are thriving, with only three groups (30.1 per cent) showing an overall positive trend. Therefore, WWF is between one fifth and one third of the way to achieving its GPF 2020 species goal. Given that many populations are not being monitored well or at all, and the status of many marine cetaceans is completely unknown, the level of success may be even lower. And even the species that are stable or increasing to some degree – African rhinos, Asian elephant and giant panda– still remain of serious conservation concern given the threats they continue to face. Table 3. Population trends in WWF flagship species. Analysis based on estimates using available information (on either population trends or threats). Data sources: IUCN Red List (IUCN 2013), Living Planet Index, IUCN Species Survival Commission. Figures marked with an asterisk (*) diverge from the IUCN Red List based on data presented in the Flagship Species Programmes Dashboard (Annex 3). Note: Whilst the figures provide an indication of progress, in future they will need to be related to defined programme goals. Flagship species No. species or
subspecies with trend information
No. species or subspecies estimated to be stable or increasing
% of species or subspecies stable
or increasing
African elephant 2 1 50.0% African great apes 9 1 11.1% African rhinos 2 2 100.0% Asian big cats (including tigers)
10 1 10.0%
Asian elephant 1 1* 100.0% Asian rhinos 3 1 33.3% Cetaceans – freshwater 6 0 0% Cetaceans – marine 16 2 12.5% Giant panda 1 1* 100% Marine turtles 6 0 0% Orangutans 2 0 0% Polar bear 1 0 0% Threatened macropods 3 1 33.3% Total for all species/subspecies
62 11 17.7%
Average across groups 34.6%
A Case Study of Conservation Monitoring: WWF 22
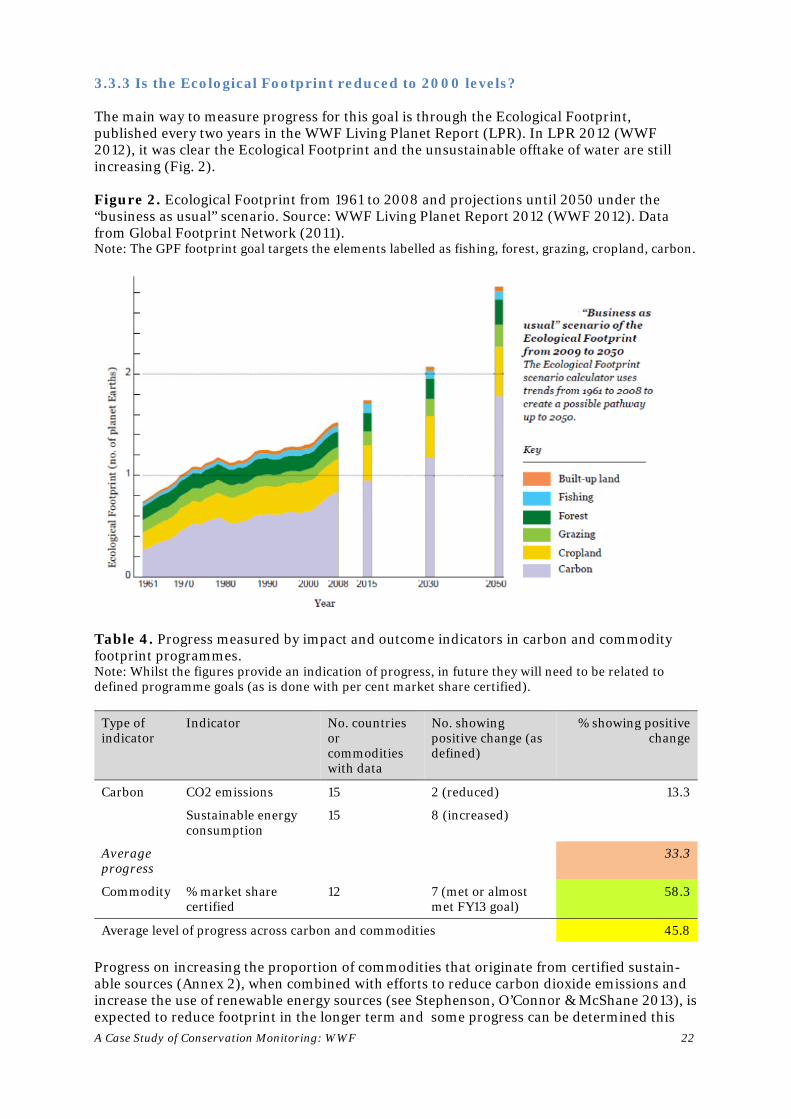
3.3.3 Is the Ecological Footprint reduced to 2000 levels? The main way to measure progress for this goal is through the Ecological Footprint, published every two years in the WWF Living Planet Report (LPR). In LPR 2012 (WWF 2012), it was clear the Ecological Footprint and the unsustainable offtake of water are still increasing (Fig. 2). Figure 2. Ecological Footprint from 1961 to 2008 and projections until 2050 under the “business as usual” scenario. Source: WWF Living Planet Report 2012 (WWF 2012). Data from Global Footprint Network (2011). Note: The GPF footprint goal targets the elements labelled as fishing, forest, grazing, cropland, carbon.
Table 4. Progress measured by impact and outcome indicators in carbon and commodity footprint programmes. Note: Whilst the figures provide an indication of progress, in future they will need to be related to defined programme goals (as is done with per cent market share certified).
Type of indicator
Indicator No. countries or commodities with data
No. showing positive change (as defined)
% showing positive change
Carbon CO2 emissions 15 2 (reduced) 13.3
Sustainable energy consumption
15 8 (increased)
Average progress
33.3
Commodity % market share certified
12 7 (met or almost met FY13 goal)
58.3
Average level of progress across carbon and commodities 45.8
Progress on increasing the proportion of commodities that originate from certified sustain-able sources (Annex 2), when combined with efforts to reduce carbon dioxide emissions and increase the use of renewable energy sources (see Stephenson, O’Connor & McShane 2013), is expected to reduce footprint in the longer term and some progress can be determined this
A Case Study of Conservation Monitoring: WWF 23
year (Table 4). However this is obviously only part of the picture for footprint and only a reduction in Ecological Footprint will demonstrate the impact we are aiming for. 3.4 Improvements needed in the WWF monitoring and reporting system There is still work to be done to continue to improve the monitoring and reporting system within WWF with a particular emphasis on the impact and outcome dashboards. For example:
WWF needs to finalize those common indicators that are not yet fully developed. Programmes need to collect more data to measure indicators (both common and
programme specific) that track their goals and objectives, and in reporting provide more explanation of the context of the data (e.g. why did some indicators change over time).
WWF programmes and offices will need to set aside appropriate capacity for monitoring, probably at least 5 per cent of their total budget. Monitoring is not just for dedicated experts; all technical staff will have some role to play.
In order to mainstream monitoring and reporting, and to make collection and analysis of performance and impact data easier and more accessible to staff and partners, WWF will build report templates and dashboards into its information management system, Insight.
As WWF continues to develop its impact monitoring system and integrate it into Insight, in coming years, monitoring and reporting will evolve further such that:
Data will always be set alongside goals, as the data on commodities were this year (see the Commodities Footprint Programmes Dashboard, Annex 2).
Data will be more complete and up to date; there will be no blanks in dashboards due to absence of data. Most impact indicators are only measured every few years, but no indicator data should be older than three to four years.
There will be comparisons in a given place between data in sites and landscapes where WWF works and in sites and landscapes where it does not work, allowing a clearer attribution of change to WWF and its partners.
By coding data in Insight by geographic location, analysis at national levels will also be possible, allowing us to share results more easily with partner governments, especially when jointly tracking indicators relevant to Aichi Targets; this is also a potential lobbying tool to demonstrate how policies impact nature.
4 Lessons Learnt on Monitoring Global Goals WWF, as an international conservation organization with global goals, needs to track progress to see if it is realizing its ambitions, just as CBD Parties are tracking their progress towards the Aichi Targets. In 2013 WWF was able to assess progress against its 2020 global goals using a suite of indicators common to its programmes. In 2013, data were used for seven indicators that overlap with those being used to measure Aichi Targets: forest cover, protected area coverage, protected area management effectiveness, species populations, Ecological Footprint, and the sustainable production of fish and timber. Given the synchrony between the indicators and the timeframe of WWF and CBD goals, data collected by WWF can help measure not only WWF programme performance and impact but also help CBD Parties measure their contribution to Aichi Targets; in turn, data collected by national agencies or NGOs or academic institutions can also help WWF. This reflects a growing trend for mutual support and collaboration on indicator development and data collection in the conservation community, as witnessed, for example, by key partnerships and collaborative efforts like the Biodiversity Indicators Partnership, GEO-BON , and the Conservation Measures Partnership. Increasing collaboration on the development and

A Case Study of Conservation Monitoring: WWF 24
harmonization of indicators relevant to monitoring Aichi Targets (see, e.g., Pereira et al., 2013) will further aid this process.
Lesson 1: Harmonization of conservation measures used by governments and NGOs will facilitate improved monitoring of the impact of programmes and the delivery of global goals such as the Aichi Targets; it will also help ensure shared data collection and use and increase cost efficiencies. Lesson 2: NGOs like WWF which have similar indicators to CBD and are actively collecting and analyzing data can help governments monitor their contributions to Aichi Targets; NGO projects are often well placed to collect new data and fill gaps of mutual interest to CBD Parties. Lesson 3: Partnerships between governments and civil society groups, NGOs and academia are essential for the future development and use of monitoring systems, as well as the realization of global conservation goals.
About half of WWF’s common indicators are still in development, and four of the 20 Aichi Targets do not yet have indicators. Of the active indicators, data are missing for some key areas (e.g. up to date data on some key species populations, management effectiveness data for many protected areas; data linking commodities work to biodiversity status). Even though datasets are incomplete – for all indicators or for all priorities - the partial dataset pulled together by WWF provided enough information to make preliminary assessments against progress.
Lesson 4: Even incomplete indicator sets and datasets can provide insight into progress against biodiversity conservation goals.
Lesson 5: Renewed efforts need to be made to fill data gaps, especially for indicators relating to protected area management effectiveness and key species populations.
In order to establish a WWF global impact monitoring system that worked and had buy-in among the staff that will ultimately need to collect much of the data, it was important that the system was simple, easily understood and had its origins within programmes (i.e. with indicators of local as well as global relevance). Key actions required at the outset included putting in place appropriate policies (approved and driven by senior managers) and dedicated resources, finalizing indicators, collecting data and developing appropriate capacity. It was also vital that WWF already had in place a well-established set of Programme Standards for planning, monitoring and reporting and dedicated staff available to provide training and mentoring. In WWF’s 2013 report, a number of steps were identified for further development of the common indicator set including the need for more programmes to finalize appropriate plans and indicators and allocate adequate resources to collect data at the local level, as well as the finalization of a centralized data collection system.
Lesson 6: Enabling conditions for large-scale monitoring systems to work and for data to be collected, analyzed and acted upon include a clear policy framework, established project management standards, and dedicated resources and capacity; appropriate databases are also required to facilitate data management and analysis.
Lesson 7: Ownership of monitoring systems and motivation to collect data are enhanced if indicators are chosen in a bottom up manner and reflect the needs of individual projects, programmes or countries, as well as global goals.

A Case Study of Conservation Monitoring: WWF 25
Lesson 8: Putting monitoring into practice demonstrates the value of data over anecdotal reporting; a graph can tell a story better than a thousand words.
The impact dashboards make an enormous difference to WWFs ability to apply results-based management. They allow us:
to compare programme performance and impact, and ensure we do not continue to focus only on reporting activities and outputs
to highlight which places or species or components of Ecological Footprint are showing positive trends, thereby allowing us to identify conservation strategies that are working well and should be replicated
to highlight which places or species or components of Ecological Footprint are showing negative trends, thereby allowing us to identify strategies that are working less well and should be adapted or changed
to identify data gaps to fill in coming years.
A range of adaptive management responses might be expected from WWF programmes in 2014 in response to the 2013 dashboards. Examples include (but are not restricted to) continued or increased efforts:
to plan and monitor programmes conserving Sumatran rhinos due to the sharp decline in populations
to assess the management effectiveness of a larger number of protected areas in which WWF is working, and to improve protected area management in the Caucasus, Coastal East Africa and West Africa Marine
to push for the certification (and therefore greater sustainability of production) of commodities such as soy and salmon, building on successes with commodities like timber, whitefish and tuna
to learn lessons from Nepal and India where tiger and rhino numbers have been increasing, in spite of negative trends in most neighbouring countries.
For governments, solid monitoring can allow adaptive management by shaping policy that encourages successful strategies.
Lesson 9: Tracking of indicators should not only measure delivery of global goals but also form the basis for informed decision-making, policy development and adaptive management, to increase the use and multiplication of successful strategies and the review and improvement of less successful ones.
5 Recommendations Based on WWF’s experiences and lessons learnt, we would propose the following recommendations which might be useful for CBD Parties and their partners.
Recommendation 1: CBD Parties should continue to form partnerships with key stakeholders, such as NGOs, civil society groups and academic institutions, to collect and analyze monitoring data relevant for Aichi Targets.
Recommendation 2: CBD Parties and their partners should put in place appropriate policies and standards that provide the resources and the enabling environment for conservation monitoring and the collection and sharing of data for measuring progress against Aichi Targets. Recommendation 3: CBD Parties and their partners should work towards harmonizing monitoring and reporting systems and, wherever possible, use the same indicators to allow cost effective data collection and sharing.
A Case Study of Conservation Monitoring: WWF 26
Recommendation 4: Renewed efforts are needed to fill data gaps, especially for indicators relating to protected area management effectiveness and species populations. Recommendation 5: Data on Aichi indicators should be analyzed regularly, even when indicator sets and datasets are incomplete, to help assess progress and act to improve delivery of the CBD strategic plan for biodiversity. Recommendation 6: CBD Parties and their partners should use conservation measures not only to assess performance against Aichi Targets but also to form the basis for informed decision-making, policy development and adaptive management, to increase the use and multiplication of successful strategies and the review and improvement of less successful ones.
Recommendation 7: CBD Parties and their partners should develop any new indicators with a bottom up approach that helps ensure data collection is relevant to national or local project monitoring as well as global monitoring. Recommendation 8: CBD Parties and their partners should identify and document good examples of monitoring in action, with case studies of what works well and what works less well, so as to share, learn and improve.
We hope that NGOs and CBD Parties and their partners can continue to work together to ensure improved and harmonized monitoring. This collaboration should lead to more adaptive management of conservation programmes and to improved delivery of our mutual biodiversity goals.

A Case Study of Conservation Monitoring: WWF 27
6. References Blanc, J.J., Barnes, R.F.W., Craig, G.C., Dublin, H.T., Thouless, C.R., Douglas-Hamilton, I., & Hart,
J.A. (2007) African Elephant Status Report 2007: An Update from the African Elephant Database. IUCN/SSC African Elephant Specialist Group. IUCN, Gland, Switzerland and Cambridge, UK.
Burgess, N., Gonçalves de Lima, M., Kingston, N., Blythe, S. Tompkins, I., Coad, L., Leverington, F., Cuadros, I., Zamora, C. & Hockings, M. (2014). Protected Area Management Effectiveness in WWF Global Priority Places. Report to WWF by the United Nations Environment Programme, Cambridge, UK.
Butchart, S. H. M., Walpole, M., Collen, B., van Strien, A., Scharlemann, J. P. W., Almond, R.E.A., Baillie, J. E. M., Bomhard, B., Brown, C., Bruno, J., Carpenter, K.E., Carr, G.M., Chanson, J., Chenery, A. M., Csirke, J., Davidson, N. C., Dentener, F., Foster, M., Galli, A., Galloway, J.N., Genovesi, P., Gregory, R.D., Hockings, M., Kapos, V., Lamarque, J-F., Leverington, F., Loh, J., McGeoch, M.A., McRae, L., Minasyan, A., Hernández Morcillo, M., Oldfield, T. E. E., Pauly, D., Quader, S., Revenga, C., Sauer, J.R., Skolnik, B., Spear, D., Stanwell-Smith, D., Stuart, S. N., Symes, A., Tierney, M., Tyrrell, T.D., Vié, J-C., & Watson, R. (2010). Global biodiversity: indicators of recent declines. Science, 328: 1164-1168.
Butchart, S.H.M., Scharlemann, J.P.W., Evans, M.I., Quader, S., Aricò, S., Arinaitwe, J., Balman, M., Bennun, L.A., Bertzky, B., Besançon, C., Boucher, T.M., Brooks, T.M., Burfield, I.J., Burgess, N.D., Chan, S., Clay, R.P., Crosby, M.J., Davidson, N.C., De Silva, N., Devenish, C., Dutson, G.C.L., Fernández, D.F.D., Fishpool, L.D.C., Fitzgerald, C., Foster, M., Heath, M.F., Hockings, M., Hoffmann, M., Knox, D., Larsen, F.W., Lamoreux, J.F., Loucks, C., May, I., Millett, J., Molloy, D., Morling, P., Parr, M., Ricketts, T.H., Seddon, N., Skolnik, B., Stuart, S.N., Upgren, A., & Woodley, S. (2012). Protecting important sites for biodiversity contributes to meeting global conservation targets. PLoS ONE, 7 (3): e32529. doi:10.1371/journal.pone.0032529
Chenery,A., Plumpton, H., Brown, C. & Walpole, M. (2013). Aichi Targets Passport. UNEP WCMC, Cambridge, UK.
CMP (2007). Open Standards for the Practice of Conservation. Conservation Measures Partnership, Bethesda, USA.
CMP (2013). Open Standards for the Practice of Conservation, Version 3. Conservation Measures Partnership, Bethesda, USA.
Coad, L., Leverington, F., Burgess, N.D., Cuadros, I.C., Geldmann, J., Marthews, T.R., Mee, J., Nolte, C., Stoll-Kleemann, S., Vansteelant, N., Zamora, C., Zimsky, M. & Hockings, M. (2013). Progress towards the CBD protected area management effectiveness targets. Parks, 19 (1).
Global Footprint Network (2011). The National Footprint Accounts. Global Footprint Network, San Francisco, California, USA.
IUCN (2013). The IUCN Red List of Threatened Species. IUCN, Gland, Switzerland. Margoluis, R., & Salafsky, N. (1998). Measures of success: Designing, managing, and monitoring
conservation and development projects. Island Press, Washington DC, USA. Maisels, F., Strindberg, S., Blake, S., Wittemyer, G., Hart, J., Williamson, E.A., Aba'a, R., Abitsi, G.,
Ambahe, R.D., Amsini, F., Bakabana, P.C., Hicks, T.C., Bayogo, R.E., Bechem, M.,; Beyers, R.L., Bezangoye, A.N., Boundja, P., Bout, N., Akou, M.E., Bene, L.B., Fosso, B., Greengrass, E., Grossmann, F., Ikamba-Nkulu, C., Ilambu, O., Inogwabini, B-I., Iyenguet, F., Kiminou, F., Kokangoye, M., Kujirakwinja, D., Latour, S., Liengola, I., Mackaya, Q., Madidi, J., Madzoke, B., Makoumbou, C., Malanda, G.-A., Malonga, R., Mbani, O., Mbendzo, V.A., Ambassa, E., Ekinde, A., Mihindou, Y., Morgan, B.J., Motsaba, P., Moukala, G., Mounguengui, A., Mowawa, B. S., Ndzai, C., Nixon, S., Nkumu, P., Nzolani, F., Pintea, L., Plumptre, A., Rainey, H., Bokoto de Semboli, B., Serckx, A., Stokes, E., Turkalo, A., Vanleeuwe, H., Vosper, A., & Ymke, W. (2013). Devastating decline of forest elephants in central Africa. PLoS ONE, 8(3): e59469. doi:10.1371/journal.pone.0059469
Pereira, H.M., Ferrier, S., Walters, M., Geller, G.N., Jongman, R.H.G., Scholes, R.J., Bruford, M.W., Brummitt, N., Butchart, S.H.M., Cardoso, A.C., Coops, N.C., Dulloo, E., Faith, D.P., Freyhof, J., Gregory, R.D., Heip, C., Höft, R., Hurtt, G., Jetz, W., Karp, D.S., McGeoch, M.A., Obura, D., Onoda, Y., Pettorelli, N., Reyers, B., Sayre, R., Scharlemann, J.P.W., Stuart, S.N., Turak, E., Walpole, M., & Wegmann, M. (2013). Essential biodiversity variables. Science, 339: 277-278.
Schipper, J., Chanson, J.S., Chiozza, F., Cox, N.A., Hoffmann, M., Katariya, V., Lamoreux, J., Rodrigues, A.S.L., Stuart, S.N., Temple, H.J., Baillie, J., Boitani, L., Lacher, T.E., Mittermeier, R.A., Smith, A.T., Absolon, D., Aguiar, J.M., Amori, G., Bakkour, N., Baldi, R., Berridge, R.J., Bielby, J., Black, P.A., Blanc, J.J., Brooks, T.M., Burton, J.A., Butynski, T.M., Catullo, G., Chapman, R., Cokeliss, Z., Collen, B., Conroy, J., Cooke, J.G., Da Fonseca, G.A.B., Derocher, A.E., Dublin, H.T., Duckworth, J.W., Emmons, L., Emslie, R.H., Festa-Bianchet, M., Foster, M., Foster, S., Garshelis,

A Case Study of Conservation Monitoring: WWF 28
D.L., Gates, C., Gimenez-Dixon, M., Gonzalez, S., Gonzalez-Maya, J.F., Good, T.C., Hammerson, G., Hammond, P.S., Happold, D., Happold, M., Hare, J., Harris, R.B., Hawkins, C.E., Haywood, M., Heaney, L.R., Hedges, S., Helgen, K.M., Hilton-Taylor, C., Hussain, S.A., Ishii, N., Jefferson, T.A., Jenkins, R.K.B., Johnston, C.H., Keith, M., Kingdon, J., Knox, D.H., Kovacs, K.M., Langhammer, P., Leus, K., Lewison, R., Lichtenstein, G., Lowry, L.F., Macavoy, Z., Mace, G.M., Mallon, D.P., Masi, M., Mcknight, M.W., Medellin, R.A., Medici, P., Mills, G., Moehlman, P.D., Molur, S., Mora, A., Nowell, K., Oates, J.F., Olech, W., Oliver, W.R.L., Oprea, M., Patterson, B.D., Perrin, W.F., Polidoro, B.A., Pollock, C., Powel, A., Protas, Y., Racey, P., Ragle, J., Ramani, P., Rathbun, G., Reeves, R.R., Reilly, S.B., Reynolds Iii, J.E., Rondinini, C., Rosell-Ambal, R.G., Rulli, M., Rylands, A.B., Savini, S., Schank, C..J., Sechrest, W., Self-Sullivan, C., Shoemaker, A., Sillero-Zubiri, C., De Silva, N., Smith, D.E., Srinivasulu, C., Stephenson, P.J., Van Strien, N., Talukdar, B.K., Taylor, B.L., Timmins, R., Tirira, D.G., Tognelli, M.F., Tsytsulina, K., Veiga, L.M., Vié, J.-C., Williamson, E.A., Wyatt, S.A., Xie, Y., & Young, B.E. (2008). The status of the world’s land and marine mammals: diversity, threat, and knowledge. Science, 322: 225-230.
Sparks, T.H., Butchart, S.H.M., Balmford, A., Bennun, L., Stanwell-Smith, D., Walpole, M., Bates, N.R., Bomhard, B., Buchanan, G.M., Chenery, A.M., Collen, B., Csirke, J., Diaz, R.J., Dulvy, N.K., Fitzgerald, C., Kapos, V., Mayaux, P., Tierney, M., Waycott, M., Wood, L., & Green, R.E. (2011). Linked indicator sets for addressing biodiversity loss. Oryx, 45: 411-419.
Stephenson, P.J., O’Connor, S. & McShane, T.O. (2013). WWF Global Conservation Programme Report, FY13. WWF International, Gland, Switzerland.
UNEP (2012). Global Environment Outlook 5: Environment for the future we want. United Nations Environment Programme, Nairobi, Kenya.
WWF (2007). Management Effectiveness Tracking Tool: Reporting Progress at Protected Area Sites. Second Edition. WWF International, Gland, Switzerland.
WWF (2008). WWF Global Programme Framework, 2008-2020. WWF International, Gland, Switzerland.
WWF (2012). The Living Planet Report 2012. WWF International, Gland, Switzerland.
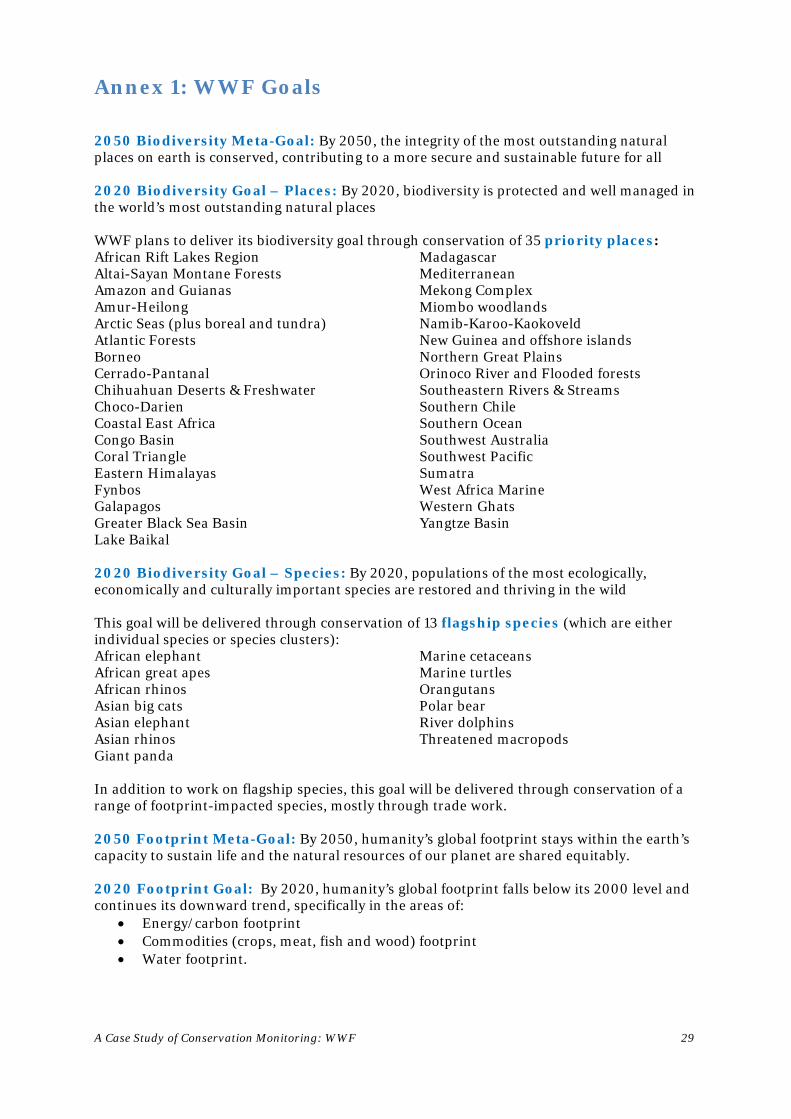
A Case Study of Conservation Monitoring: WWF 29
Annex 1: WWF Goals 2050 Biodiversity Meta-Goal: By 2050, the integrity of the most outstanding natural places on earth is conserved, contributing to a more secure and sustainable future for all 2020 Biodiversity Goal – Places: By 2020, biodiversity is protected and well managed in the world’s most outstanding natural places WWF plans to deliver its biodiversity goal through conservation of 35 priority places: African Rift Lakes Region Altai-Sayan Montane Forests Amazon and Guianas Amur-Heilong Arctic Seas (plus boreal and tundra) Atlantic Forests Borneo Cerrado-Pantanal Chihuahuan Deserts & Freshwater Choco-Darien Coastal East Africa Congo Basin Coral Triangle Eastern Himalayas Fynbos Galapagos Greater Black Sea Basin Lake Baikal
Madagascar Mediterranean Mekong Complex Miombo woodlands Namib-Karoo-Kaokoveld New Guinea and offshore islands Northern Great Plains Orinoco River and Flooded forests Southeastern Rivers & Streams Southern Chile Southern Ocean Southwest Australia Southwest Pacific Sumatra West Africa Marine Western Ghats Yangtze Basin
2020 Biodiversity Goal – Species: By 2020, populations of the most ecologically, economically and culturally important species are restored and thriving in the wild This goal will be delivered through conservation of 13 flagship species (which are either individual species or species clusters): African elephant African great apes African rhinos Asian big cats Asian elephant Asian rhinos Giant panda
Marine cetaceans Marine turtles Orangutans Polar bear River dolphins Threatened macropods
In addition to work on flagship species, this goal will be delivered through conservation of a range of footprint-impacted species, mostly through trade work. 2050 Footprint Meta-Goal: By 2050, humanity’s global footprint stays within the earth’s capacity to sustain life and the natural resources of our planet are shared equitably. 2020 Footprint Goal: By 2020, humanity’s global footprint falls below its 2000 level and continues its downward trend, specifically in the areas of:
Energy/carbon footprint Commodities (crops, meat, fish and wood) footprint Water footprint.

A Case Study of Conservation Monitoring: WWF 30
Annex 2: WWF Impact and Outcome Dashboards Summary of Common Indicators and Data Sources in Dashboards All dashboards Conservation Achievement KPI: A rating between 1 and 7 showing average performance against planned results for the year. 7: The planned results have been entirely met (or almost) and demonstrate clear progress towards the objectives, or the objectives have been achieved entirely; 4: There were moderate shortcomings in the achievement of the planned results this year; 1: The achievement of the planned results is very low. Programmes with no CAKPI rating either did not report or the rating was not possible to calculate from the report. Key achievements and Challenges: A summary (extracted from the programmes’ own annual reports) highlighting key stories, especially those related to impacts and outcomes. Dashboard: Place-based Programmes
Indicator Details Notes on Graphs Data Source PRESSURE (or Threat) P1. Rate of habitat loss
Number of hectares of habitat cover lost, disaggregated by forest, coral reef, wetlands, river length, etc
Forest as % of ecoregion area lost in 2000-5, 2005-10.
University of Maryland. WWF-Germany Remote Sensing Centre of Excellence.
STATE (or Biodiversity Condition) S2. Habitat fragmentation
% of ecoregion area with stable core and with fragmented forest
Pale green = fragmented forest; dark green = stable core forest.
University of Maryland. WWF-Germany Remote Sensing Centre of Excellence.
S3. Species populations
Population numbers of key species in the priority place
1-3 species populations over time, or an index of multiple species.
Living Planet Index, IUCN SSC Specialist Groups, Programme Reports.
RESPONSE (or Strategy) R1. Protected area coverage
Number of hectares of habitat under formal protection (and % of place protected), disaggregated by forest and marine
Bold line: total hectares Dotted line: % of place.
World Database on Protected Areas; WWF-Germany Remote Sensing Centre of Excellence.
R2. Protected area management effectiveness
Weighted average rating of management effectiveness for all existing protected areas within a priority place
Gauge showing mean rating: red (0-0.99) poor; orange (1-1.99) moderate; green (2-3) good performance.
IUCN, UNEP-WCMC, University of Queensland.
Dashboard: Flagship Species Programmes
Indicator Details Notes on Graphs Source STATE (or Biodiversity Condition) S3. Species populations
Population numbers of flagship species
Populations over time for species, sub-species or sub-populations (e.g. in one site). Note: no data were available for orang-utans or threatened macropods.
Living Planet Index, IUCN SSC Specialist Groups.
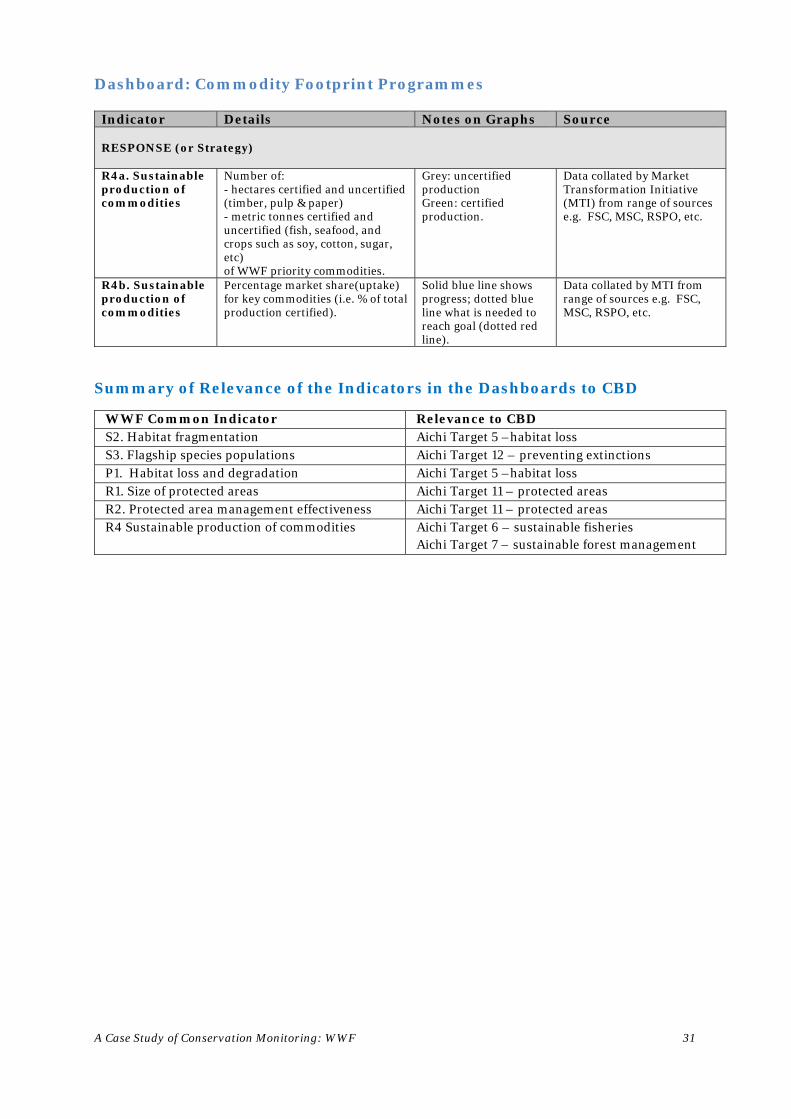
A Case Study of Conservation Monitoring: WWF 31
Dashboard: Commodity Footprint Programmes
Indicator Details Notes on Graphs Source RESPONSE (or Strategy) R4a. Sustainable production of commodities
Number of: - hectares certified and uncertified (timber, pulp & paper) - metric tonnes certified and uncertified (fish, seafood, and crops such as soy, cotton, sugar, etc) of WWF priority commodities.
Grey: uncertified production Green: certified production.
Data collated by Market Transformation Initiative (MTI) from range of sources e.g. FSC, MSC, RSPO, etc.
R4b. Sustainable production of commodities
Percentage market share(uptake) for key commodities (i.e. % of total production certified).
Solid blue line shows progress; dotted blue line what is needed to reach goal (dotted red line).
Data collated by MTI from range of sources e.g. FSC, MSC, RSPO, etc.
Summary of Relevance of the Indicators in the Dashboards to CBD
WWF Common Indicator Relevance to CBD S2. Habitat fragmentation Aichi Target 5 –habitat loss S3. Flagship species populations Aichi Target 12 – preventing extinctions P1. Habitat loss and degradation Aichi Target 5 –habitat loss R1. Size of protected areas Aichi Target 11 – protected areas R2. Protected area management effectiveness Aichi Target 11 – protected areas R4 Sustainable production of commodities Aichi Target 6 – sustainable fisheries
Aichi Target 7 – sustainable forest management
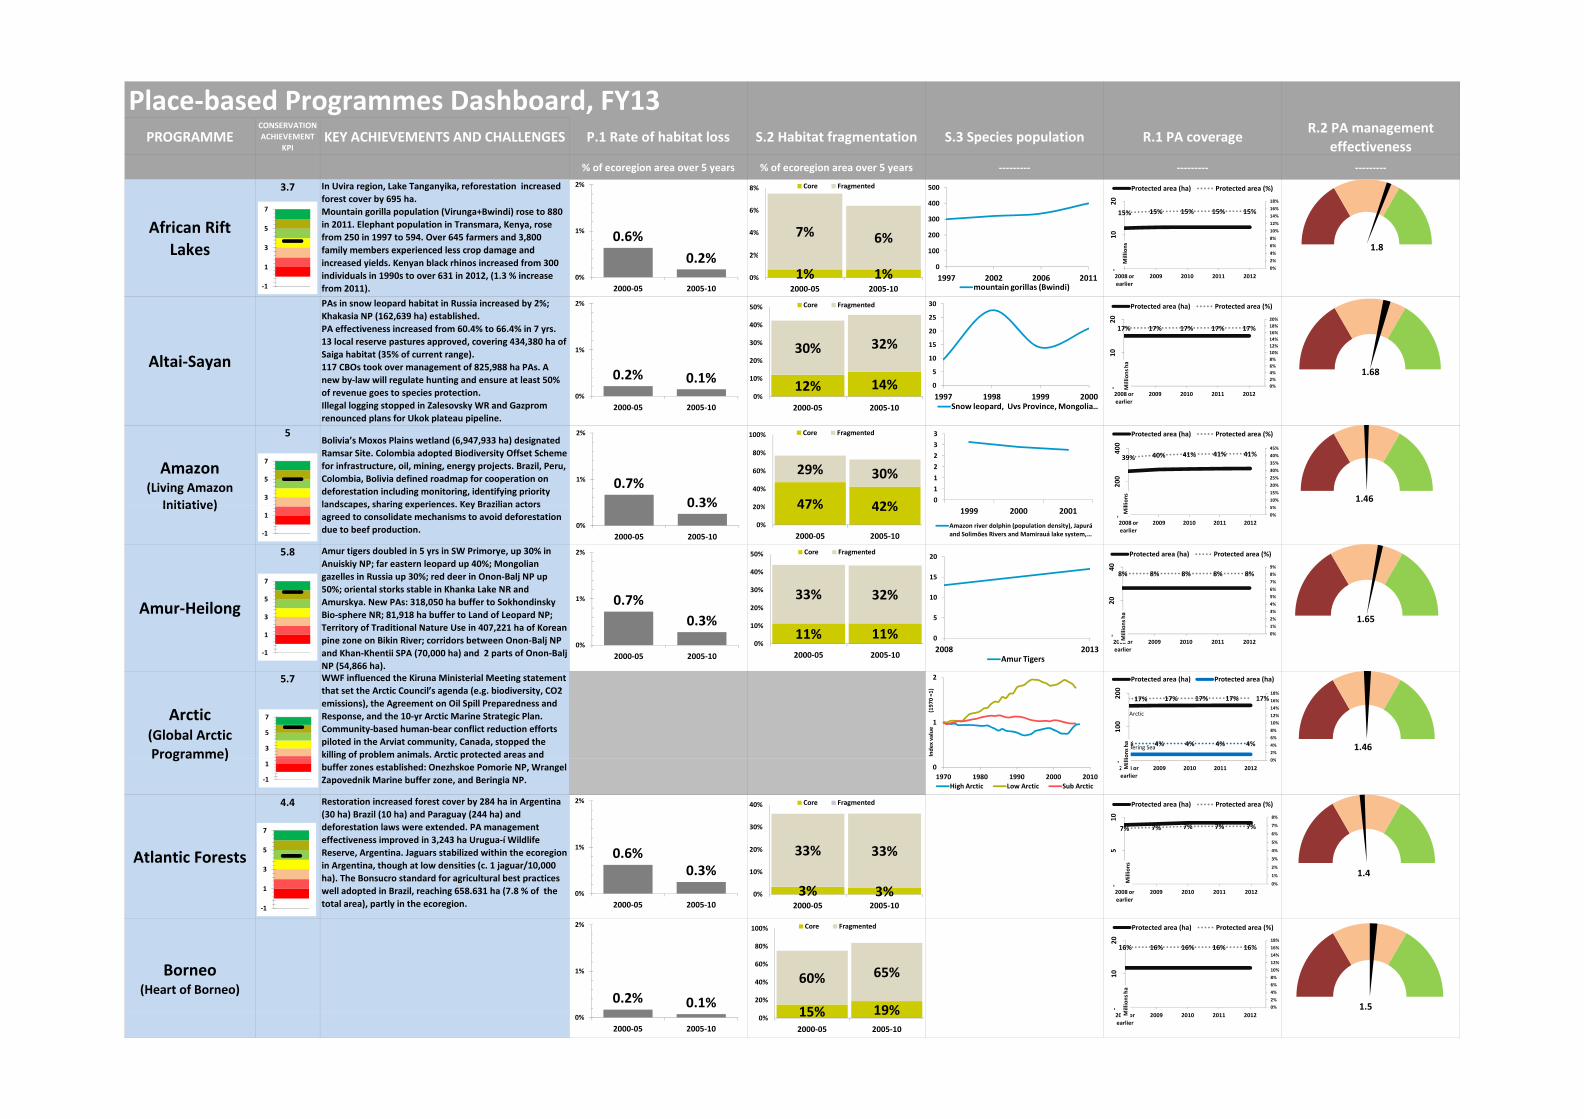
Place‐based Programmes Dashboard, FY13PROGRAMME
CONSERVATION ACHIEVEMENT
KPIKEY ACHIEVEMENTS AND CHALLENGES P.1 Rate of habitat loss S.2 Habitat fragmentation S.3 Species population R.1 PA coverage R.2 PA management
effectiveness% of ecoregion area over 5 years % of ecoregion area over 5 years ‐‐‐‐‐‐‐‐‐ ‐‐‐‐‐‐‐‐‐ ‐‐‐‐‐‐‐‐‐
African Rift Lakes
3.7 In Uvira region, Lake Tanganyika, reforestation increased forest cover by 695 ha. Mountain gorilla population (Virunga+Bwindi) rose to 880 in 2011. Elephant population in Transmara, Kenya, rose from 250 in 1997 to 594. Over 645 farmers and 3,800 family members experienced less crop damage and
0.6%0 2%
1%
2%
7% 6%2%
4%
6%
8% Core Fragmented
15% 15% 15% 15% 15%
4%6%8%10%12%14%16%18%
10
20
ions
Protected area (ha) Protected area (%)
1.83
5
7
100
200
300
400
500
Lakes family members experienced less crop damage and increased yields. Kenyan black rhinos increased from 300 individuals in 1990s to over 631 in 2012, (1.3 % increase from 2011).
Altai‐Sayan
PAs in snow leopard habitat in Russia increased by 2%; Khakasia NP (162,639 ha) established.PA effectiveness increased from 60.4% to 66.4% in 7 yrs. 13 local reserve pastures approved, covering 434,380 ha of Saiga habitat (35% of current range).117 CBOs took over management of 825,988 ha PAs. A new by‐law will regulate hunting and ensure at least 50% of revenue goes to species protection.Illegal logging stopped in Zalesovsky WR and Gazprom renounced plans for Ukok plateau pipeline.
Amazon(Living Amazon
Initiative)
5Bolivia’s Moxos Plains wetland (6,947,933 ha) designated Ramsar Site. Colombia adopted Biodiversity Offset Scheme for infrastructure, oil, mining, energy projects. Brazil, Peru, Colombia, Bolivia defined roadmap for cooperation on deforestation including monitoring, identifying priority landscapes sharing experiences. Key Brazilian actors
0.2%0%
2000‐05 2005‐10
0.2% 0.1%0%
1%
2%
2000‐05 2005‐10
0.7%0.3%
1%
2%
1% 1%0%
2%
2000‐05 2005‐10
12% 14%
30% 32%
0%
10%
20%
30%
40%
50%
2000‐05 2005‐10
Core Fragmented
47% 42%
29% 30%
20%
40%
60%
80%
100% Core Fragmented
0%2%4%
‐
2008 or earlier
2009 2010 2011 2012
Milli
17% 17% 17% 17% 17%
0%2%4%6%8%10%12%14%16%18%20%
‐10
20
2008 or earlier
2009 2010 2011 2012
Millions ha
Protected area (ha) Protected area (%)
39% 40% 41% 41% 41%
%10%15%20%25%30%35%40%45%
200
400
lions
Protected area (ha) Protected area (%)
1.68
1.46
‐1
1
3
5
7
0
5
10
15
20
25
30
1997 1998 1999 2000Snow leopard, Uvs Province, Mongolia …
0112233
0
100
1997 2002 2006 2011mountain gorillas (Bwindi)
Initiative) landscapes, sharing experiences. Key Brazilian actors agreed to consolidate mechanisms to avoid deforestation due to beef production.
Amur‐Heilong
5.8 Amur tigers doubled in 5 yrs in SW Primorye, up 30% in Anuiskiy NP; far eastern leopard up 40%; Mongolian gazelles in Russia up 30%; red deer in Onon‐Balj NP up 50%; oriental storks stable in Khanka Lake NR and Amurskya. New PAs: 318,050 ha buffer to Sokhondinsky Bio‐sphere NR; 81,918 ha buffer to Land of Leopard NP; Territory of Traditional Nature Use in 407,221 ha of Korean pine zone on Bikin River; corridors between Onon‐Balj NP and Khan‐Khentii SPA (70,000 ha) and 2 parts of Onon‐Balj NP (54,866 ha).
Arctic(Global Arctic Programme)
5.7 WWF influenced the Kiruna Ministerial Meeting statement that set the Arctic Council’s agenda (e.g. biodiversity, CO2 emissions), the Agreement on Oil Spill Preparedness and Response, and the 10‐yr Arctic Marine Strategic Plan. Community‐based human‐bear conflict reduction efforts piloted in the Arviat community, Canada, stopped the killing of problem animals. Arctic protected areas and
0.3%0%
2000‐05 2005‐10
0.7%0.3%
0%
1%
2%
2000‐05 2005‐10
47% 42%0%
20%
2000‐05 2005‐10
0%5%
‐
2008 or earlier
2009 2010 2011 2012
Mil
8% 8% 8% 8% 8%
0%1%2%3%4%5%6%7%8%9%
‐20
40
2008 or earlier
2009 2010 2011 2012Millions ha
Protected area (ha) Protected area (%)
11% 11%
33% 32%
0%
10%
20%
30%
40%
50%
2000‐05 2005‐10
Core Fragmented
1.65
1.46
Arctic
Bering Sea4% 4% 4% 4% 4%
17% 17% 17% 17% 17%
0%2%4%6%8%10%12%14%16%18%
100
200
ions ha
Protected area (ha) Protected area (ha)
‐1
1
‐1
1
3
5
7
3
5
7
1999 2000 2001
Amazon river dolphin (population density), Japurá and Solimões Rivers and Mamirauá lake system, …
0
5
10
15
20
2008 2013Amur Tigers
1
2
Inde
x value (197
0 =1)
g ) g p pbuffer zones established: Onezhskoe Pomorie NP, Wrangel Zapovednik Marine buffer zone, and Beringia NP.
Atlantic Forests
4.4 Restoration increased forest cover by 284 ha in Argentina (30 ha) Brazil (10 ha) and Paraguay (244 ha) and deforestation laws were extended. PA management effectiveness improved in 3,243 ha Urugua‐í Wildlife Reserve, Argentina. Jaguars stabilized within the ecoregion in Argentina, though at low densities (c. 1 jaguar/10,000 ha). The Bonsucro standard for agricultural best practices well adopted in Brazil, reaching 658.631 ha (7.8 % of the total area), partly in the ecoregion.
Borneo(Heart of Borneo)
0.6%0.3%
0%
1%
2%
2000‐05 2005‐10
0.2% 0.1%
1%
2%
7% 7% 7% 7% 7%
0%
1%
2%
3%
4%
5%
6%
7%
8%
‐5
10
2008 or earlier
2009 2010 2011 2012
Millions
Protected area (ha) Protected area (%)
16% 16% 16% 16% 16%
0%2%4%6%8%10%12%14%16%18%
‐10
20
Millions ha
Protected area (ha) Protected area (%)
3% 3%
33% 33%
0%
10%
20%
30%
40%
2000‐05 2005‐10
Core Fragmented
15% 19%
60% 65%
20%
40%
60%
80%
100% Core Fragmented
1.4
1.5
0%‐
2008 or earlier
2009 2010 2011 2012Mill
‐1
1
‐1
1
3
5
7
01970 1980 1990 2000 2010
High Arctic Low Arctic Sub Arctic
0%
2000‐05 2005‐10
2008 or earlier
2009 2010 2011 2012M15% 19%0%
2000‐05 2005‐10
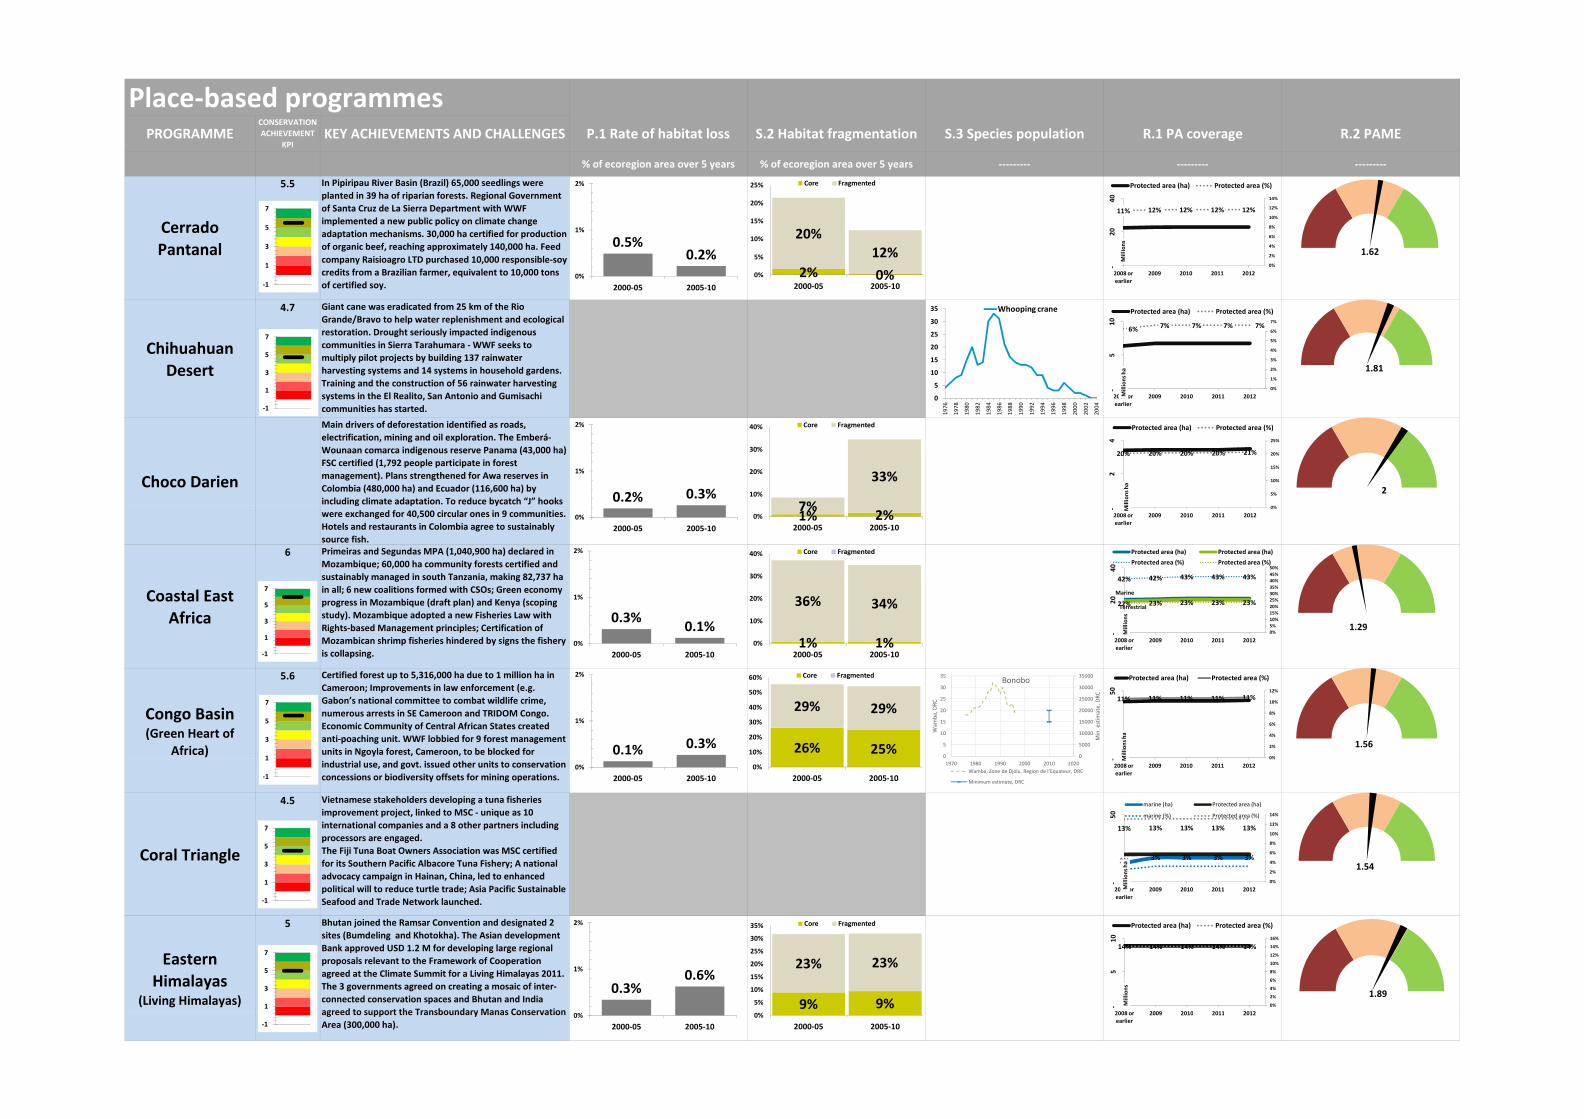
Place‐based programmesPROGRAMME
CONSERVATION ACHIEVEMENT
KPIKEY ACHIEVEMENTS AND CHALLENGES P.1 Rate of habitat loss S.2 Habitat fragmentation S.3 Species population R.1 PA coverage R.2 PAME
% of ecoregion area over 5 years % of ecoregion area over 5 years ‐‐‐‐‐‐‐‐‐ ‐‐‐‐‐‐‐‐‐ ‐‐‐‐‐‐‐‐‐
Cerrado Pantanal
5.5 In Pipiripau River Basin (Brazil) 65,000 seedlings were planted in 39 ha of riparian forests. Regional Government of Santa Cruz de La Sierra Department with WWF implemented a new public policy on climate change adaptation mechanisms. 30,000 ha certified for production of organic beef, reaching approximately 140,000 ha. Feed 0.5%
0 2%
1%
2%
11% 12% 12% 12% 12%
4%
6%
8%
10%
12%
14%
20
40
lions
Protected area (ha) Protected area (%)
20%12%
10%
15%
20%
25% Core Fragmented
1 623
5
7
Pantanalcompany Raisioagro LTD purchased 10,000 responsible‐soy credits from a Brazilian farmer, equivalent to 10,000 tons of certified soy.
Chihuahuan Desert
4.7 Giant cane was eradicated from 25 km of the Rio Grande/Bravo to help water replenishment and ecological restoration. Drought seriously impacted indigenous communities in Sierra Tarahumara ‐ WWF seeks to multiply pilot projects by building 137 rainwater harvesting systems and 14 systems in household gardens. Training and the construction of 56 rainwater harvesting systems in the El Realito, San Antonio and Gumisachi communities has started.
Choco Darien
Main drivers of deforestation identified as roads, electrification, mining and oil exploration. The Emberá‐Wounaan comarca indigenous reserve Panama (43,000 ha) FSC certified (1,792 people participate in forest management). Plans strengthened for Awa reserves in Colombia (480,000 ha) and Ecuador (116,600 ha) by including climate adaptation. To reduce bycatch “J” hooks
0.2%0%
2000‐05 2005‐10
0.2% 0.3%
1%
2%
0%
2%
‐
2008 or earlier
2009 2010 2011 2012
Mil
20% 20% 20% 20% 21%
0%
5%
10%
15%
20%
25%
2 4
illions ha
Protected area (ha) Protected area (%)
2% 0%12%
0%
5%
2000‐05 2005‐10
7%
33%10%
20%
30%
40% Core Fragmented
1.62
2
6% 7% 7% 7% 7%
0%
1%
2%
3%
4%
5%
6%
7%
‐5
10
2008 or earlier
2009 2010 2011 2012Millions ha
Protected area (ha) Protected area (%)
1.81
‐1
1
‐1
1
3
5
7
0
5
10
15
20
25
30
35
1976
1978
1980
1982
1984
1986
1988
1990
1992
1994
1996
1998
2000
2002
2004
Whooping crane
g p ywere exchanged for 40,500 circular ones in 9 communities. Hotels and restaurants in Colombia agree to sustainably source fish.
Coastal East Africa
6 Primeiras and Segundas MPA (1,040,900 ha) declared in Mozambique; 60,000 ha community forests certified and sustainably managed in south Tanzania, making 82,737 ha in all; 6 new coalitions formed with CSOs; Green economy progress in Mozambique (draft plan) and Kenya (scoping study). Mozambique adopted a new Fisheries Law with Rights‐based Management principles; Certification of Mozambican shrimp fisheries hindered by signs the fishery is collapsing.
Congo Basin (Green Heart of
Africa)
5.6 Certified forest up to 5,316,000 ha due to 1 million ha in Cameroon; Improvements in law enforcement (e.g. Gabon’s national committee to combat wildlife crime, numerous arrests in SE Cameroon and TRIDOM Congo. Economic Community of Central African States created anti‐poaching unit. WWF lobbied for 9 forest management units in Ngoyla forest, Cameroon, to be blocked for
0%2000‐05 2005‐10
0%‐
2008 or earlier
2009 2010 2011 2012
M
0.3% 0.1%0%
1%
2%
2000‐05 2005‐10
0.1% 0.3%
1%
2%
1% 2%7%0%
2000‐05 2005‐10
1% 1%
36% 34%
0%
10%
20%
30%
40%
2000‐05 2005‐10
Core Fragmented
26% 25%
29% 29%
10%
20%
30%
40%
50%
60% Core Fragmented
1.29
1.56
Marine
Terrestrial
42% 42% 43% 43% 43%
22% 23% 23% 23% 23%
0%5%10%15%20%25%30%35%40%45%50%
‐20
40
2008 or earlier
2009 2010 2011 2012
Millions
Protected area (ha) Protected area (ha)Protected area (%) Protected area (%)
11% 11% 11% 11% 11%
0%
2%
4%
6%
8%
10%
12%
‐50
Millions ha
Protected area (ha) Protected area (%)
‐1
1
3
5
7
1
3
5
7
0
5000
10000
15000
20000
25000
30000
35000
0
5
10
15
20
25
30
35
Min. estim
ate, DRC
Wam
ba, DRC
Bonobo
industrial use, and govt. issued other units to conservation concessions or biodiversity offsets for mining operations.
Coral Triangle
4.5 Vietnamese stakeholders developing a tuna fisheries improvement project, linked to MSC ‐ unique as 10 international companies and a 8 other partners including processors are engaged. The Fiji Tuna Boat Owners Association was MSC certified for its Southern Pacific Albacore Tuna Fishery; A national advocacy campaign in Hainan, China, led to enhanced political will to reduce turtle trade; Asia Pacific Sustainable Seafood and Trade Network launched.
Eastern Himalayas
(Living Himalayas)
5 Bhutan joined the Ramsar Convention and designated 2 sites (Bumdeling and Khotokha). The Asian development Bank approved USD 1.2 M for developing large regional proposals relevant to the Framework of Cooperation agreed at the Climate Summit for a Living Himalayas 2011. The 3 governments agreed on creating a mosaic of inter‐connected conservation spaces and Bhutan and India agreed to support the Transboundary Manas Conservation
0%2000‐05 2005‐10
0.3%0.6%1%
2%
0%2000‐05 2005‐10
9% 9%
23% 23%
5%
10%
15%
20%
25%
30%
35% Core Fragmented
1.89
0%‐
2008 or earlier
2009 2010 2011 2012
M
14% 14% 14% 14% 14%
0%
2%
4%
6%
8%
10%
12%
14%
16%
‐5
10
2008 2009 2010 2011 2012
Millions
Protected area (ha) Protected area (%)
2% 3% 3% 3% 3%
13% 13% 13% 13% 13%
0%
2%
4%
6%
8%
10%
12%
14%
‐50
2008 or earlier
2009 2010 2011 2012Millions ha
marine (ha) Protected area (ha)
marine (%) Protected area (%)
1.54
‐1
1
‐1
1
3
5
7
1
3
5
7
1970 1980 1990 2000 2010 2020
Wamba, Zone de Djolu, Region de l’Equateur, DRC
Minimum estimate, DRC
agreed to support the Transboundary Manas Conservation Area (300,000 ha).
0%2000‐05 2005‐10
0%2000‐05 2005‐10
2008 or earlier
2009 2010 2011 2012
‐1
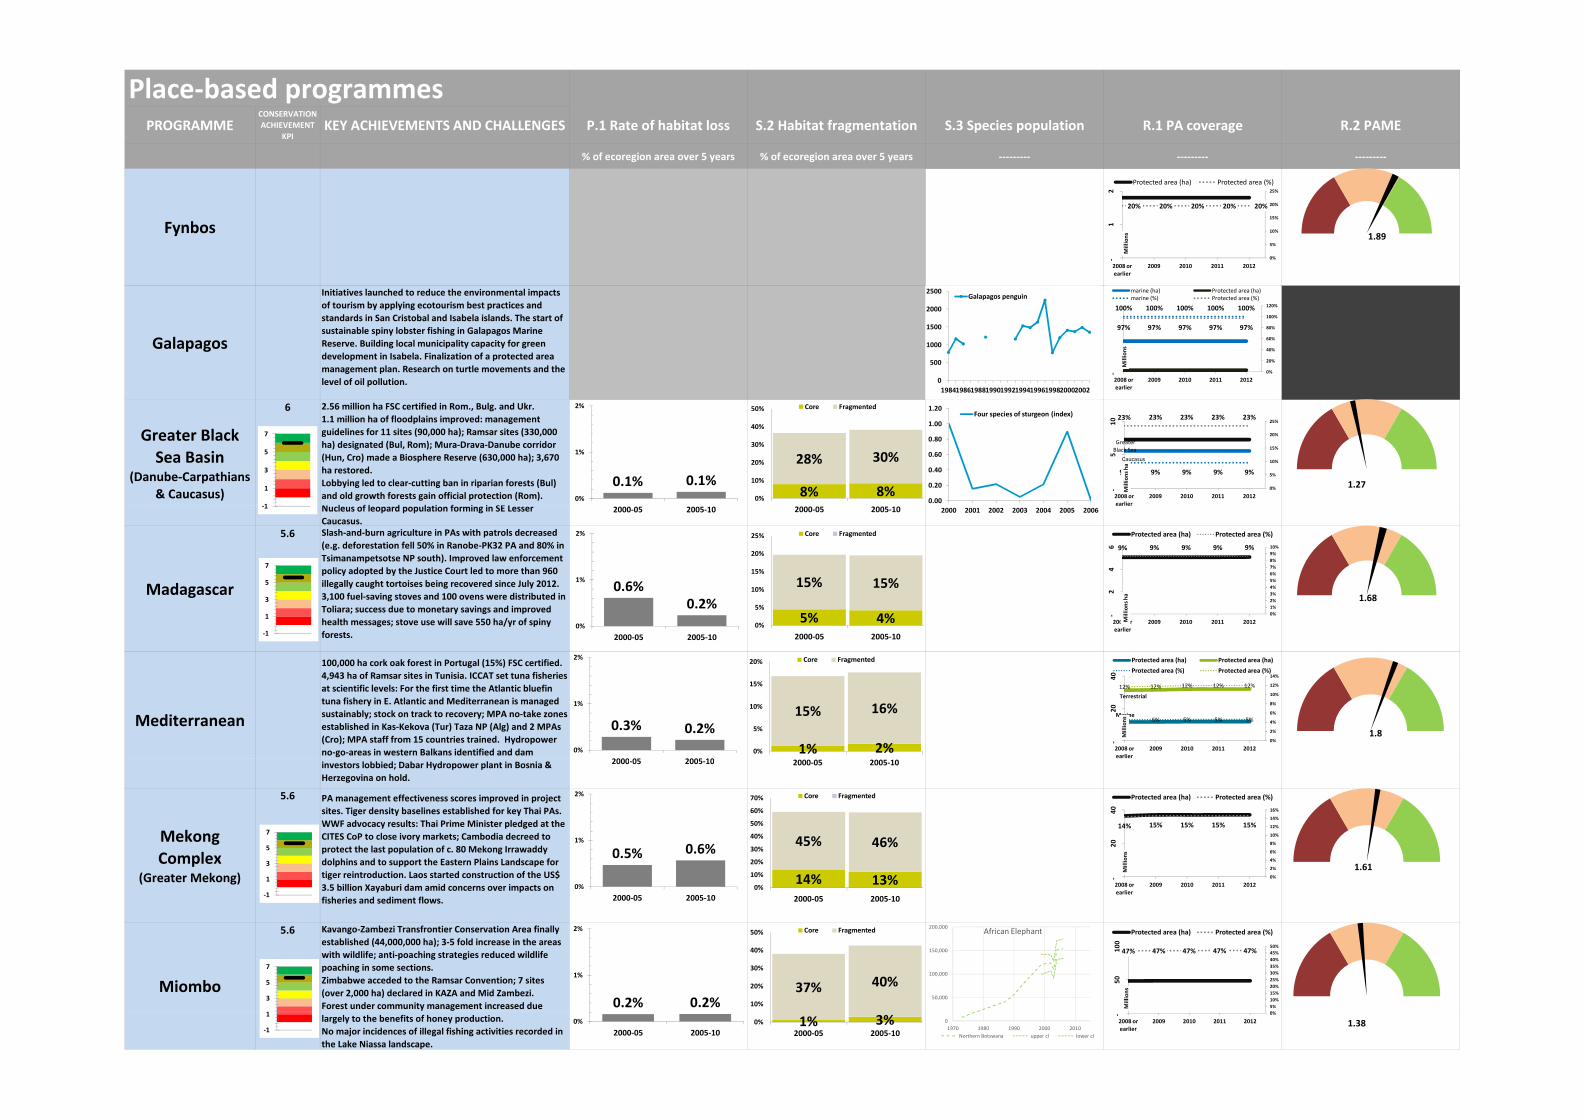
Place‐based programmesPROGRAMME
CONSERVATION ACHIEVEMENT
KPIKEY ACHIEVEMENTS AND CHALLENGES P.1 Rate of habitat loss S.2 Habitat fragmentation S.3 Species population R.1 PA coverage R.2 PAME
% of ecoregion area over 5 years % of ecoregion area over 5 years ‐‐‐‐‐‐‐‐‐ ‐‐‐‐‐‐‐‐‐ ‐‐‐‐‐‐‐‐‐
Fynbos20% 20% 20% 20% 20%
5%
10%
15%
20%
25%
1 2
Millions
Protected area (ha) Protected area (%)
1.89
Galapagos
Initiatives launched to reduce the environmental impacts of tourism by applying ecotourism best practices and standards in San Cristobal and Isabela islands. The start of sustainable spiny lobster fishing in Galapagos Marine Reserve. Building local municipality capacity for green development in Isabela. Finalization of a protected area management plan. Research on turtle movements and the level of oil pollution.
Greater Black Sea Basin
(Danube‐Carpathians & Caucasus)
6 2.56 million ha FSC certified in Rom., Bulg. and Ukr.1.1 million ha of floodplains improved: management guidelines for 11 sites (90,000 ha); Ramsar sites (330,000 ha) designated (Bul, Rom); Mura‐Drava‐Danube corridor (Hun, Cro) made a Biosphere Reserve (630,000 ha); 3,670 ha restored.Lobbying led to clear‐cutting ban in riparian forests (Bul) and old growth forests gain official protection (Rom). N l f l d l ti f i i SE L
0.1% 0.1%0%
1%
2%
8% 8%
28% 30%
0%
10%
20%
30%
40%
50% Core Fragmented
1.27
Greater Black Sea
Caucasus
23% 23% 23% 23% 23%
9% 9% 9% 9% 9%
0%
5%
10%
15%
20%
25%
‐5
10
2008 or earlier
2009 2010 2011 2012
Millions ha
0%‐
2008 or earlier
2009 2010 2011 2012
M
100% 100% 100% 100% 100%
97% 97% 97% 97% 97%
0%
20%
40%
60%
80%
100%
120%
‐
2008 or earlier
2009 2010 2011 2012
Millions
marine (ha) Protected area (ha)marine (%) Protected area (%)
1
1
3
5
7
0
500
1000
1500
2000
2500
1984198619881990199219941996199820002002
Galapagos penguin
0.00
0.20
0.40
0.60
0.80
1.00
1.20Four species of sturgeon (index)
Nucleus of leopard population forming in SE Lesser Caucasus.
Madagascar
5.6 Slash‐and‐burn agriculture in PAs with patrols decreased (e.g. deforestation fell 50% in Ranobe‐PK32 PA and 80% in Tsimanampetsotse NP south). Improved law enforcement policy adopted by the Justice Court led to more than 960 illegally caught tortoises being recovered since July 2012. 3,100 fuel‐saving stoves and 100 ovens were distributed in Toliara; success due to monetary savings and improved health messages; stove use will save 550 ha/yr of spiny forests.
Mediterranean
100,000 ha cork oak forest in Portugal (15%) FSC certified. 4,943 ha of Ramsar sites in Tunisia. ICCAT set tuna fisheries at scientific levels: For the first time the Atlantic bluefin tuna fishery in E. Atlantic and Mediterranean is managed sustainably; stock on track to recovery; MPA no‐take zones established in Kas‐Kekova (Tur) Taza NP (Alg) and 2 MPAs (Cro); MPA staff from 15 countries trained. Hydropower no‐go‐areas in western Balkans identified and dam
2000‐05 2005‐10
0.6%0.2%
0%
1%
2%
2000‐05 2005‐10
0.3% 0.2%0%
1%
2%
2000 05 2005 10
2000‐05 2005‐10
5% 4%
15% 15%
0%
5%
10%
15%
20%
25%
2000‐05 2005‐10
Core Fragmented
1% 2%
15% 16%
0%
5%
10%
15%
20% Core Fragmented
1.68
1.8
9% 9% 9% 9% 9%
0%1%2%3%4%5%6%7%8%9%10%
‐2
4 6
2008 or earlier
2009 2010 2011 2012Millions ha
Protected area (ha) Protected area (%)
Marine
Terrestrial
5% 5% 5% 5% 5%
12% 12% 12% 12% 12%
0%
2%
4%
6%
8%
10%
12%
14%
‐20
40
2008 or earlier
2009 2010 2011 2012
Millions
Protected area (ha) Protected area (ha)Protected area (%) Protected area (%)
‐1
‐1
1
3
5
7
2000 2001 2002 2003 2004 2005 2006
investors lobbied; Dabar Hydropower plant in Bosnia & Herzegovina on hold.
Mekong Complex
(Greater Mekong)
5.6 PA management effectiveness scores improved in project sites. Tiger density baselines established for key Thai PAs. WWF advocacy results: Thai Prime Minister pledged at the CITES CoP to close ivory markets; Cambodia decreed to protect the last population of c. 80 Mekong Irrawaddy dolphins and to support the Eastern Plains Landscape for tiger reintroduction. Laos started construction of the US$ 3.5 billion Xayaburi dam amid concerns over impacts on fisheries and sediment flows.
Miombo
5.6 Kavango‐Zambezi Transfrontier Conservation Area finally established (44,000,000 ha); 3‐5 fold increase in the areas with wildlife; anti‐poaching strategies reduced wildlife poaching in some sections.Zimbabwe acceded to the Ramsar Convention; 7 sites (over 2,000 ha) declared in KAZA and Mid Zambezi.Forest under community management increased due
2000‐05 2005‐10
0.5% 0.6%
0%
1%
2%
2000‐05 2005‐10
0.2% 0.2%
1%
2%
2000‐05 2005‐10
14% 13%
45% 46%
0%
10%
20%
30%
40%
50%
60%
70%
2000‐05 2005‐10
Core Fragmented
37% 40%10%
20%
30%
40%
50% Core Fragmented
1.61
14% 15% 15% 15% 15%
0%
2%
4%
6%
8%
10%
12%
14%
16%
‐20
40
2008 or earlier
2009 2010 2011 2012
Millions
Protected area (ha) Protected area (%)
47% 47% 47% 47% 47%
0%5%10%15%20%25%30%35%40%45%50%
50
100
Millions
Protected area (ha) Protected area (%)
‐1
1
3
5
7
1
3
5
7
50,000
100,000
150,000
200,000African Elephant
largely to the benefits of honey production.No major incidences of illegal fishing activities recorded in the Lake Niassa landscape.
0%
2000‐05 2005‐101% 3%0%
2000‐05 2005‐101.38
0%‐
2008 or earlier
2009 2010 2011 2012‐1
10
1970 1980 1990 2000 2010
Northern Botswana upper cl lower cl
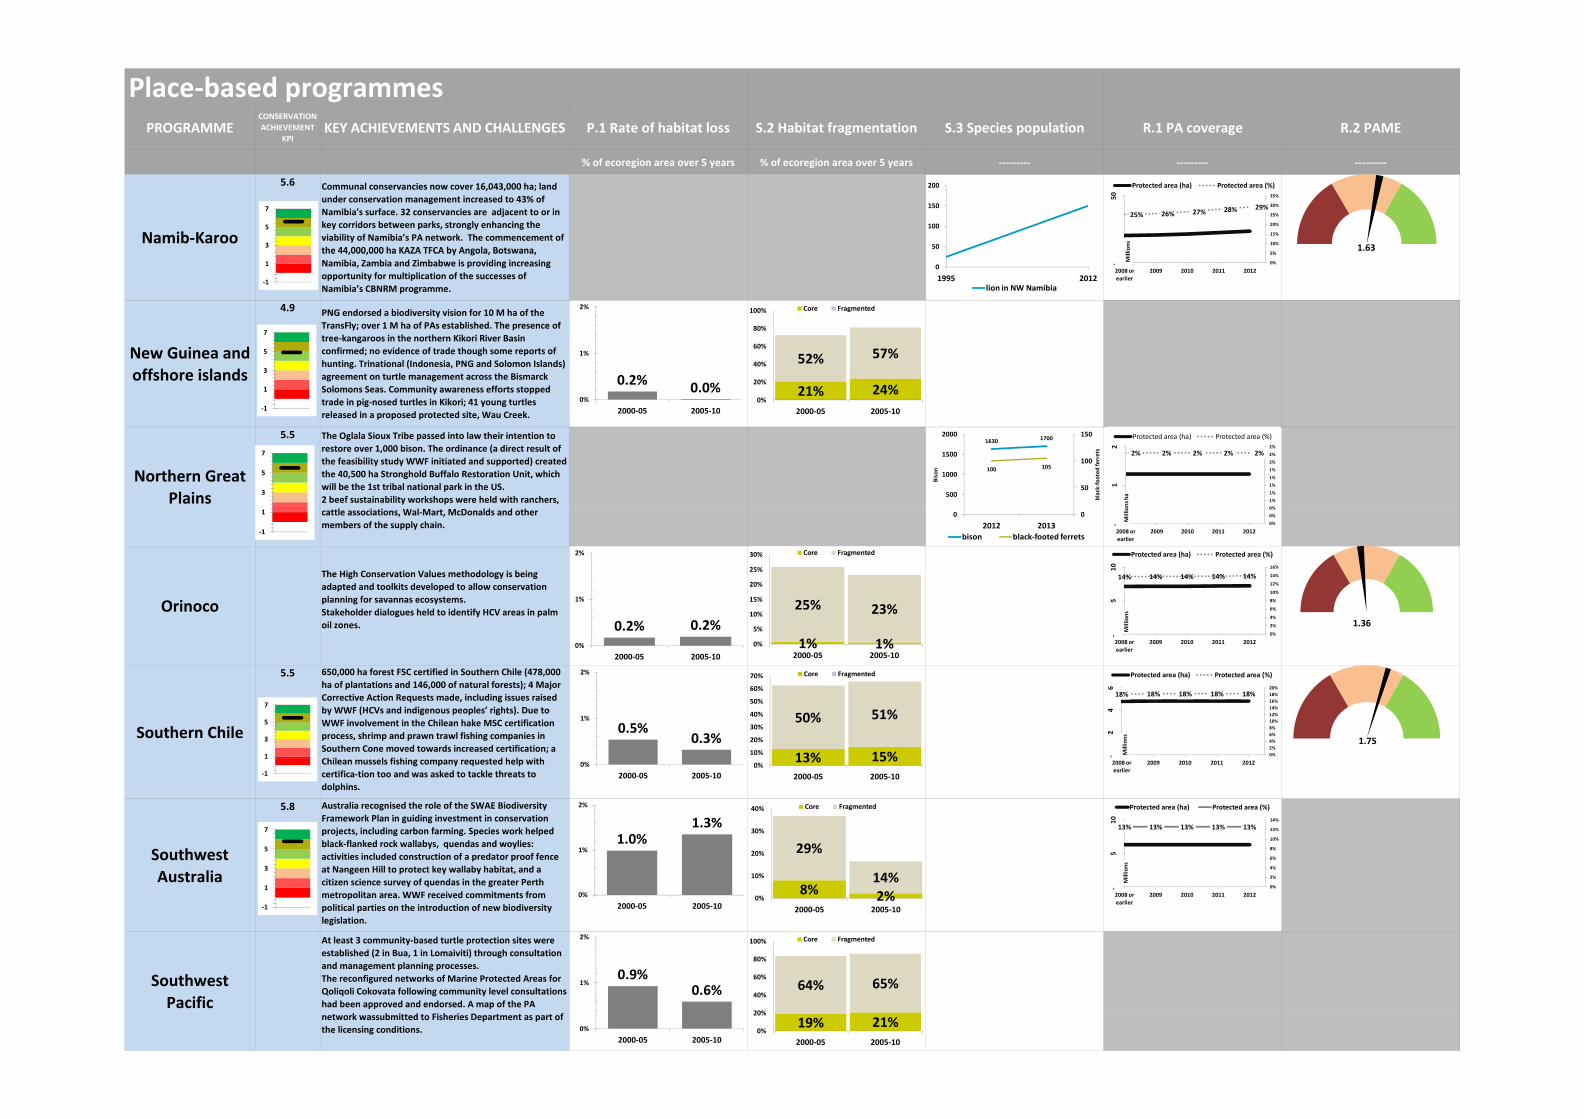
Place‐based programmesPROGRAMME
CONSERVATION ACHIEVEMENT
KPIKEY ACHIEVEMENTS AND CHALLENGES P.1 Rate of habitat loss S.2 Habitat fragmentation S.3 Species population R.1 PA coverage R.2 PAME
% of ecoregion area over 5 years % of ecoregion area over 5 years ‐‐‐‐‐‐‐‐‐ ‐‐‐‐‐‐‐‐‐ ‐‐‐‐‐‐‐‐‐
Namib‐Karoo
5.6 Communal conservancies now cover 16,043,000 ha; land under conservation management increased to 43% of Namibia's surface. 32 conservancies are adjacent to or in key corridors between parks, strongly enhancing the viability of Namibia’s PA network. The commencement of the 44,000,000 ha KAZA TFCA by Angola, Botswana,
25% 26% 27% 28% 29%
5%
10%
15%
20%
25%
30%
35%50
lions
Protected area (ha) Protected area (%)
1.633
5
7
50
100
150
200
the 44,000,000 ha KAZA TFCA by Angola, Botswana, Namibia, Zambia and Zimbabwe is providing increasing opportunity for multiplication of the successes of Namibia’s CBNRM programme.
New Guinea and offshore islands
4.9 PNG endorsed a biodiversity vision for 10 M ha of the TransFly; over 1 M ha of PAs established. The presence of tree‐kangaroos in the northern Kikori River Basin confirmed; no evidence of trade though some reports of hunting. Trinational (Indonesia, PNG and Solomon Islands) agreement on turtle management across the Bismarck Solomons Seas. Community awareness efforts stopped trade in pig‐nosed turtles in Kikori; 41 young turtles released in a proposed protected site, Wau Creek.
Northern Great Plains
5.5 The Oglala Sioux Tribe passed into law their intention to restore over 1,000 bison. The ordinance (a direct result of the feasibility study WWF initiated and supported) created the 40,500 ha Stronghold Buffalo Restoration Unit, which will be the 1st tribal national park in the US. 2 beef sustainability workshops were held with ranchers,
0.2% 0.0%0%
1%
2%
2000‐05 2005‐10
21% 24%
52% 57%
0%
20%
40%
60%
80%
100%
2000‐05 2005‐10
Core Fragmented
0%
5%
‐
2008 or earlier
2009 2010 2011 2012
Mill
2% 2% 2% 2% 2%
1%1%1%1%
1%2%2%2%
1 2
ns ha
Protected area (ha) Protected area (%)
‐1
1
‐1
1
3
5
7
3
5
7
1630 1700
100 105
50
100
150
500
1000
1500
2000
black‐footed
ferrets
Bison
0
1995 2012lion in NW Namibia
cattle associations, Wal‐Mart, McDonalds and other members of the supply chain.
Orinoco
The High Conservation Values methodology is being adapted and toolkits developed to allow conservation planning for savannas ecosystems.Stakeholder dialogues held to identify HCV areas in palm oil zones.
Southern Chile
5.5 650,000 ha forest FSC certified in Southern Chile (478,000 ha of plantations and 146,000 of natural forests); 4 Major Corrective Action Requests made, including issues raised by WWF (HCVs and indigenous peoples’ rights). Due to WWF involvement in the Chilean hake MSC certification process, shrimp and prawn trawl fishing companies in Southern Cone moved towards increased certification; a Chil l fi hi t d h l ith
0.2% 0.2%0%
1%
2%
2000‐05 2005‐10
0.5%0.3%
1%
2%
1% 1%
25% 23%
0%
5%
10%
15%
20%
25%
30%
2000‐05 2005‐10
Core Fragmented
13% 15%
50% 51%
10%
20%
30%
40%
50%
60%
70% Core Fragmented
1.36
1.75
14% 14% 14% 14% 14%
0%
2%
4%
6%
8%
10%
12%
14%
16%
‐5
10
2008 or earlier
2009 2010 2011 2012
Millions
Protected area (ha) Protected area (%)
18% 18% 18% 18% 18%
0%2%4%6%8%10%12%14%16%18%20%
‐2
4 6
Millions
Protected area (ha) Protected area (%)
0%0%0%
‐
2008 or earlier
2009 2010 2011 2012
Million
1
3
5
7
‐1
1 002012 2013
bison black‐footed ferrets
Chilean mussels fishing company requested help with certifica‐tion too and was asked to tackle threats to dolphins.
Southwest Australia
5.8 Australia recognised the role of the SWAE Biodiversity Framework Plan in guiding investment in conservation projects, including carbon farming. Species work helped black‐flanked rock wallabys, quendas and woylies: activities included construction of a predator proof fence at Nangeen Hill to protect key wallaby habitat, and a citizen science survey of quendas in the greater Perth metropolitan area. WWF received commitments from political parties on the introduction of new biodiversity legislation.
Southwest Pacific
At least 3 community‐based turtle protection sites were established (2 in Bua, 1 in Lomaiviti) through consultation and management planning processes. The reconfigured networks of Marine Protected Areas for Qoliqoli Cokovata following community level consultations had been approved and endorsed. A map of the PA
0%2000‐05 2005‐10
1.0%1.3%
0%
1%
2%
2000‐05 2005‐10
0.9%0.6%
1%
2%
13% 15%0%
2000‐05 2005‐10
8% 2%
29%
14%0%
10%
20%
30%
40%
2000‐05 2005‐10
Core Fragmented
64% 65%
20%
40%
60%
80%
100% Core Fragmented
2008 or earlier
2009 2010 2011 2012
13% 13% 13% 13% 13%
0%
2%
4%
6%
8%
10%
12%
14%
‐5
10
2008 or earlier
2009 2010 2011 2012
Millions
Protected area (ha) Protected area (%)
‐1
‐1
1
3
5
7
network wassubmitted to Fisheries Department as part of the licensing conditions. 0%
2000‐05 2005‐10
19% 21%0%
20%
2000‐05 2005‐10

Place‐based programmesPROGRAMME
CONSERVATION ACHIEVEMENT
KPIKEY ACHIEVEMENTS AND CHALLENGES P.1 Rate of habitat loss S.2 Habitat fragmentation S.3 Species population R.1 PA coverage R.2 PAME
% of ecoregion area over 5 years % of ecoregion area over 5 years ‐‐‐‐‐‐‐‐‐ ‐‐‐‐‐‐‐‐‐ ‐‐‐‐‐‐‐‐‐
Sumatra
6 A protected fishing area (Petite Côte) of 16,900 ha established in Senegal. 100 ha of mangrove habitat restored across 3 sites (Foundiougne Joal‐Fadhiouth and
0.1% 0.0%0.0%
1.0%
2.0%
2000‐05 2005‐10
3% 4%
11% 12%
0%
5%
10%
15%
20%
2000‐05 2005‐10
Core Fragmented
1.5
19% 19% 19% 19% 19%
0%
5%
10%
15%
20%
25%
‐5
10
2008 or earlier
2009 2010 2011 2012
Millions
Protected area (ha) Protected area (%)
11% 11% 11% 11% 11%10%
12%20
Protected area (ha) Protected area (%)
7
0
50
100
150
200
2010 2011 2012 2013
Sumatran Rhino Total
West Africa Marine
restored across 3 sites (Foundiougne, Joal‐Fadhiouth, and Abéné) with a recovery level of 95%. Numerous stakeholders benefitted from programme training (e.g. 271 artisinal fishers, including 69 women, received training to help them establish local fishing councils to manage their resources, and 34 trainers were trained in collecting and processing fisheries data for monitoring artisinal fisheries.
Western Ghats
6 The completion of Yunqiao pocket wetland (4 ha) and restoration of 71 ha of Gouxihe Wetland Park showcased conservation practices to local protection agencies. WWF
0.2% 0.1%0.0%
1.0%
2.0%
2000‐05 2005‐10
2.0%
3% 3%
31% 32%
0%
10%
20%
30%
40%
2000‐05 2005‐10
Core Fragmented
50%
60% Core Fragmented
2.28
7% 7% 7% 7%
9%
0%1%2%3%4%5%6%7%8%9%10%
‐1
2
2008 or earlier
2009 2010 2011 2012
Millions
Protected area (ha) Protected area (%)
16% 16% 16% 16% 16%14%16%18%40
Protected area (ha) Protected area (%)
0%
2%
4%
6%
8%
10%
‐
2008 or earlier
2009 2010 2011 2012
Millions ha
1.31
‐1
1
3
5
7
Yangtze
p p gcompleted desktop assessments of 13 commodities important to domestic agriculture in China. The Heping village, Guangyuan city was chosen as a pilot to explore the green food system and its environmental impacts. Communication activities on freshwater conservation and sustainable agriculture reached the project goal of communicating to over 2,000,000 people.
0.1%0.4%
0.0%
1.0%
2000‐05 2005‐105% 7%
39% 41%
0%
10%
20%
30%
40%
2000‐05 2005‐10
1.890%2%4%6%8%10%12%14%
‐20
2008 or earlier
2009 2010 2011 2012
Millions
‐1
1
3
5

Flagship Species Programmes Dashboard, FY13PROGRAMME
CONSERVATION ACHIEVEMENT
KPIKEY ACHIEVEMENTS AND CHALLENGES S.3 Species population
African Elephant
5 Elephants declined by 63‐82% in Minkebe NP, Gabon, from 29,147 in 2004 to 6,875.In Dzanga Sangha, CAR, Seleka rebels killed 26 elephants in Zanga Baï.There was a slight decline in elephant poaching in Selous Game Reserve, Tanzania, based on carcass counts. Land use plans were designed in 3 villages around Selous, 12 300 ha set aside for conservation4
5
6
7
200,000
400,000African Elephant Eastern Africa comparable
upper cl
lower cl
Southern Africa comparable
upper cl
lower cl
Northern Botswana200,000
300,000
400,000
500,000Total ‐ East ‐ Southern Population
30 000
60,000
90,000Total ‐West ‐ Central Population
African Elephant 12,300 ha set aside for conservation.Online advertisements for illegal trade in products from elephants and 3 other species in China declined by 84%.Increased law enforcement led to 35 poachers arrested in TRIDOM Congo and 19 poachers prosecuted in SE Cameroon (around 3 National Parks).
African Great Apes
4.7 Species counts: in Dzanga‐Sangha, CAR, 107‐534 chimpanzees and 1,312‐4,619 western gorillas (compared to 1,794‐4,063 gorillas in 2005); in Republic of Congo an estimated 6,280 gorillas and chimpanzees populate the 140,000 ha Messok Dja proposed PA. Anti‐poaching operations were conducted in e.g. Dzanga‐Sangha (8,581 patrol days confiscated 147,547 kg bushmeat), Gamba, Messok Dja, Boumba‐Bek, Nki, Lobeke. A new law enforcement programme, SALF, began in Senegal, building on one in Guinea, Conakry to tackle illegal trade.The Virunga Campaign actively discouraged oil prospectors
0
1
2
3
0
1
2
3
4
5
6
7
01970 1980 1990 2000 2010
upper cl
lower cl
Central Africa total
Eastern Africa total
Southern Africa total
West Africa total
‐4000
16000
‐200
800
1970 1980 1990 2000 2010 2020
Graue
r'gorilla
Cross R
iver and
Mou
ntain gorilla
Eastern (Mountain and Grauer's subspecies) and Western Gorilla (Cross River subspecies)
Mountain gorilla, Virunga Range, Uganda, Rwanda, DRCMountain gorilla, Bwindi Impenetrable Forest Park, UgandaMountain gorilla, Kahuzi‐Biega National Park, DRCMountain gorilla, Uganda, Rwanda, DRCCross River gorilla Nigeria and Cameroon
Insufficient data to estimate populaiton of western lowland
0
5000
10000
15000
20000
25000
30000
35000
0
5
10
15
20
25
30
35
1970 1980 1990 2000 2010 2020
Min. estim
ate, DRC
Wam
ba, D
RC
Bonobo
Wamba, Zone de Djolu, Region de l’Equateur, DRCMi i ti t DRC
0
50
100
150
0
50
100
150
1970 1975 1980 1985 1990 1995 2000 2005 2010 2015
Selected
protected
area po
pulatio
ns
Subspe
cies pop
ulations (tho
usan
d) Chimpanzee
Eastern subspecies Nigeria‐Cameroon subspeciesWestern subspecies Central subspeciesGombe, Tanzania Tai Forest, Cote d'IvoireB G i B d F t U d
0
100,000
1990 1995 2000 2005 2010Eastern Africa Definite Southern Africa Definite TOTAL Definite
Eastern Africa Probable Southern Africa Probable TOTAL Probable
0
30,000
1990 1995 2000 2005 2010
Central Africa Definite West Africa Definite Central Africa Probable West Africa Probable
from entering the park.
African Rhino
6 In key range states and WWF sites rhinos increased (e.g. 8% in Kwazulu Natal, 3% and 5% for black and white rhino in lowveld conservancies, Zimbabwe) or stabilized (e,g. in Save Valley, Zim), growth countering poaching.Strong CITES decisions on rhinos were made at CoP16. Positive legislation changes followed in Kenya and South Africa.Surveillance strengthened in Borana rhino sanctuary, Aberdare black rhino Intensive Protection Zone and Tsavo East National Park rhino sanctuary. Range expansion efforts established a new population of 13 black rhino in KwaZulu Game Reserve, South Africa.
4.2 Support for parks infrastructure, security, capacity building and law enforcement monitoring means greater one‐horned rhino poaching was less than 1% (30/yr); only 2 rhinos were lost in Nepal in FY13; marginal increase in
0
1
2
3
4
5
6
7
Cross River gorilla, Nigeria and Cameroon populaiton of western lowland Minimum estimate, DRC Boussou, Guinea Budongo Forest, Uganda
0
5000
10000
15000
20000
25000
1970 1975 1980 1985 1990 1995 2000 2005 2010 2015
African Rhinos
Southern white rhinoceros Northern white rhinoceros Black rhinoceros
120140160180200 Sumatran Rhino
1600
2000
2400
2012 total: 3224
Asian One‐horned Rhino
40000
50000
ulations
Asian ElephantWorld total
7
Asian Rhino and Elephant Action Strategy (AREAS)
India; downlisting from endangered to vulnerable shows progress.Sumatran rhino population halved to less than 100; no records of breeding outside of Sumatra. WWF helped organize the Sumatran Rhino Crisis Summit in Singapore – stakeholders rallied behind common goals. AREAS has ensured law enforcement monitoring is conducted in key elephant, rhino and tiger habitats.
Cetacean (freshwater)
5
1,040 Yangtze finless porpoises remain, decreasing by 13.7% pa. Bolivia declared the Bolivian Pink River Dolphin a Natural National Heritage.
1
2
3
4
5
6
7
020406080
100120
2010 2011 2012 2013Sub‐total SumatraSub‐total SabahTotal
0
400
800
1200
1965 1975 1985 1995 2005 2015
Kaziranga Nepal Jaldapara
Gourumara Pabitora Orang
500
1000
1500
2000
2500
3000
50100150200250300350400450
Finless P
orpo
ise
Yang
tze Dolph
in
Yangtze Dolphin (Baiji) and Finless Porpoise
0
200
400
600
800
1000
1200
1400Indus River Dolphin
0
50
100
150
200
250
300
0
1000
2000
3000
4000
5000
6000
Kulsi and
Brahm
aputra Rivers
Gan
ges R
iver
Ganges River Dolphin
0
10000
20000
30000
1980 1985 1990 1995 2000 2005 2010 2015
World and
Indian
pop
u
India
Other0
1
2
3
4
5
6
0 001970 1975 1980 1985 1990 1995 2000 2005 2010 2015
Yangtze Dolphin, Baiji Finless porpoise
1970 1975 1980 1985 1990 1995 2000 2005 2010 2015Jinnah to Chashma Barrage, Punjab Chashma to Taunsa Barrage, PunjabTaunsa to Guddu Barrage, Punjab Dolphin reserve, Guddu to Sukkur barrageGuddu to Sukkur Barrage, Sindh Sukkur to Kotri Barrage, Sindh
001970 1975 1980 1985 1990 1995 2000 2005 2010 2015
Ganges River Kulsi River Brahmaputra mainstream

Flagship species programmesPROGRAMME
CONSERVATION ACHIEVEMENT
KPIKEY ACHIEVEMENTS AND CHALLENGES S.3 Species population
Cetacean (marine)
as above
Mexico banned artisanal drift gillnets for shrimp in Upper Gulf of California to avoid vaquita bycatch, a huge lobbying win.Oil platform Sakhalin II, planned near a critically endangered western gray whale population, was postponed.Studies show coastal species in Pakistan (Indo‐Pacific
9
12
15
18
21
150
200
250
300
350
potted
by aerial su
rvey
North Atlantic Right Whale
1000
1500
2000
2500
Blue Whale
60
90
120
150
180
12000
18000
24000
30000
36000
Greece and China
New
Zealand
Dolphins
1500
2000
2500
3000
3500
4000
4500
Beluga and Narwhal
(marine) Studies show coastal species in Pakistan (Indo Pacific humpback dolphin, finless porpoise, bottlenose dolphin) most vulnerable to beaching due to interactions with fisheries and pollution; most mortality is due to enmeshment in fishing gears.
Giant Panda
6.2 6.7 ha of Huangtuliang Corridor, Minshan landscape, was restored, anti‐poaching patrols conducted and stakeholder zoning plan developed; habitat also restored in Qinling Landscape (bamboo restoration survival rate over 90%). 2 nature reserves in Qinling (Laoxiancheng and Guanyinshan) approved to upgrade to national NRs and secure more state funding.200 ha zone set up in collective forests of 6 households in Donghe village, Qinling corridor to demonstrate sustainable use and conservation; government support will allow multiplication next yr.Infrared camera monitoring started in 8 NRs and 5 forest farms in Qinling.
0
1
2
3
4
5
6
7
0200400600800
100012001400160018002000
1970 1975 1980 1985 1990 1995 2000 2005 2010
Giant Panda
The 3rd National Survey in 2006 estimated 1596 individuals. Previous, less extensive surveys in 1985 and 2000 estimated 1000 individuals, but there is no reason to believe the population has increased.
0
3
6
0
50
100
1970 1975 1980 1985 1990 1995 2000 2005 2010 2015
mean sp
Western North Atlantic, Canada Cape Cod Bay, mean spotted
0
500
1970 1975 1980 1985 1990 1995 2000 2005 2010 2015
California Current ecosystem Oregon‐Washington
0
30
0
6000
1970 1975 1980 1985 1990 1995 2000 2005 2010 2015
Hector's dolphin, New Zealand
Short‐beaked common dolphin, Eastern Ionian Sea, Greece
Indo‐pacific humpbacked dolphin, North Lantau, China
0
500
1000
1970 1975 1980 1985 1990 1995 2000 2005 2010
Beluga, Cook Inlet, Alaska Beluga, Eastern Chukchi Sea, Alaska
Beluga, St. Lawrence Estuary Beluga, Eastern Hudson Bay
Narwhal, Hudson Bay
Tiger (Tigers Alive)
4.5 Nepal population increased 64% to 198 (from 121 in 2009); major increases in Bardia NP (tripled), Suklaphanta Wildlife Reserve (doubled) and Chitwan (up >30%). Gunung Basor‐Stong Utara Forest reserve, Malaylsia, showed a decline from 2005 (0.98 to 0.37 tigers/10,000 ha).E‐commerce companies helped reduce online sale offers of tiger products by 65%.Enforcement capacity enhanced: more than 450 rangers trained in 7 countries.Global accreditation system for tiger PAs (Conservation Assured Tiger Standards) tested in India, Nepal and Malaysia.
3.6 Increases in Hawksbill (83% in Melaka), and Green Turtle (126%) egg production in Malaysia.Leatherback habitat protected in 150,000ha MPA in Kei Kecil, Indonesia; MPA will control turtle harvesting.A permanent ban on bottom trawling and search for
0
1
2
3
4
5
6
7
5
6
7
1500
2000
2500
femaies
Loggerhead Turtle
60000
80000
100000
nests
Green Turtle
4000
5000
6000
7000
nests
Leatherback Turtle
0
200
400
600
800
1000
1200
1400
1600
1800
1970 1975 1980 1985 1990 1995 2000 2005 2010 2015
Bengal and
Sum
atran Tigers
TigerMalayan Tiger, Malay Peninsula
Sumatran Tiger, Sumatra
Bengal Tiger, total of 15 locations in India
‐20
30
80
130
180
230
1970 1980 1990 2000 2010
Indo
‐Chine
se, M
alayan
, Sou
th China
an
d Sibe
rian Tigers
Siberian Tiger, Hunchun Nature Reserve, Jilin, ChinaIndo‐Chinese Tiger, Huai Kha Kaeng, Thailand
Bengal Tiger, Chitwan National Park, Nepal
Siberian Tiger, Sikhote Alin Zapovednik, Russia
Siberian Tiger, 16 locations in Russian Far East
Siberian Tiger, Heilongjiang Province, China
South China Tiger, Fujian province and adjacent areasNepal Total
Marine Turtlesalternatives on the Cuban shelf will reduce Hawksbill bycatch; illegal offtake of turtles almost halved on Cuban nesting beaches in MPAs (San Felipe NP and Jardines de la Reina NP) (76 in 2010; 40 in 2012).96% of green turtle nests in Samandag Beach (Hatay), Turkey, protected (24% increase).Green turtle nest surveillance in Kenya increased.
Polar Bear
WWF helped upgrade the 2013 polar bear range states meeting to a full Ministerial Polar Bear Forum and is encouraging Ministers to commit to funded conservation outcomes, including habitat protection and climate change mitigation.A community‐based human‐bear conflict reduction effort in Arviat, Canada led to a decrease in the killing of problem animals from a high of 5 to zero. This is significant for a subpopulation that experienced the earliest direct impacts from a warming Arctic, and for a community that was frustrated in managing an increased number of polar bears
0
1
2
3
4
0
500
1000
1980 1985 1990 1995 2000 2005 2010 2015
Nestin
g
Laganas Bay, Zakynthos Island, Greece
0
20000
40000
1970 1975 1980 1985 1990 1995 2000 2005 2010 2015No. of
Tortuguero Beac, Costa Rica
0
1000
2000
3000
1990 1995 2000 2005 2010 2015
No. of
Beaches at Jamursba‐Medi, Indonesia
500
1000
1500
2000
2500
3000Polar Bear Southern Beaufort Sea, Canada/USA
Northern Beaufort Sea, Canada
Viscount Melville, Canada
Lancaster Sound, Canada
Gulf of Boothia, Canada
Foxe basin, Canada
Western Hudson Bay, Canada
Southern Hudson Bay, Canada
Kane Basin, Canada/Greenland
Total Population: 20,000 ‐ 25,000
g g pin and around their community. 0
1975 1980 1985 1990 1995 2000 2005 2010 2015
Davis strait, Canada/Greenland
Baffin Bay, Canada/Greenlan

Commodity Footprint Programmes Dashboard, FY13PROGRAMME CONSERVATION
ACHIEVEMENT KPI Indicator R.4a sustainable production of commodities R.4b sustainable production of commodities
Commodity
Market Transformation
6.5 The market share of a range of key certified commodities increased, most notably timber (up more than 4% to more than 14% of market share), pulp and paper (up 1% to 6.6%), and more than half of whitefish fisheries are now MSC certified. There was also progress on palm oil, cotton and tuna but little headway was made on soy and biomaterials. For salmon and shrimp aquaculture, there is no certified production as the standards are not yet launched (launch expected end 2013). For salmon aquaculture, quick progress is expected as 75% of global salmon producers have already made commitments to ASC certification by 2020 via the Global Salmon Initiative.A recent scientific study conclusively showed that MSC certified fish stocks were healthier than non‐MSC certified fish stocks. 3
5
7
Transformation Initiative
Smart Fishing Initiative
Timber ed hectares
y yCommitments: The Marine Harvest Group committed to 100% Aquaculture Stewardship Council (ASC) certification of all its production by 2020; the China Sustainable Retail Roundtable was launched with more than 10 largest national and international retailers operating in China, including Carrefour China, Wal‐Mart China, Tesco China, Metro China, AEON China, IKEA China and P&G China; The Roundtable on Responsible Soy (RTRS) has reached 1 million tons of certified soy; the cooperation with Credit Swiss which contributed to the launch of AgVance in Africa, a USD500m private equity fund‐to‐funds for responsible agriculture in Africa.
Indian Ocean Tuna Commission states agreed to ensure MSC criteria are met in the Maldives for the 2nd largest tuna stock in the world. MSC tuna fishery certifications occurred in the Western Central Pacific Fisheries Commission jurisdictional area.Overarching seafood legislation tabled to radically improve US traceability rules.The Chilean fishing sector adopted a legal framework with a focus on sustainability (e.g. scientifically‐set catch quotas).A satellite tool was launched using an Automatic Identification System to send signals from vessels to monitor fishing and trans‐shipping operations; it was tested in tuna fishing vessels in Fiji and has already influenced sustainability commitments.Due to the Chilean hake MSC certification process, shrimp and prawn trawl fishing companies in Southern Cone took steps towards increased fisheries certification. The first FIRME (Financial Institution for the Recovery of Marine Ecosystems) ‘deal’ between fisheries, processors, and investors was agreed in the Grand Banks: processors committed to pay more for sustainably caught fish. This work could help increase fish stocks by 400% and industry profitability by 500% whilst helping improve management in the RFMO context.
10.1%
14.3%
14.6% 15.1%
20.4%
10%
15%
20%
25%% FSC certified hectares
17681000
1500
2000
2500
globally produced timber million Ha
‐1
1
TimberFSC certifi
% FSC
certified he
ctares
Pulp andPaper
8.4%10.1%
0%
5%
2009 2011 2013 2015 2017 2019 2021
Latest results Planned + Final resultsPlanned Intermediate Result, & Yr. Expected Final Result
8 1%10%
12%% FSC certified hectares virgin fibre
53.0% 53.4%
54.0% 55.0%60.0%
0%
20%
40%
60%
80%
100%
2009 2011 2013 2015 2017 2019 2021
% FSC certified hectares recycled
Latest results Planned + Final resultsPlanned Intermediate Result, & Yr. Expected Final Result
178 181
17681269
0
500
1000
2012 2013
FSC million Ha% FSC
certified he
ctares
Soy
RTRS
certified tons
5.6% 5.6%6.6%
6.7% 6.8%8.1%
0%
2%
4%
6%
8%
2009 2011 2013 2015 2017 2019 2021
Latest results Planned + Final resultsPlanned Intermediate Result, & Yr. Expected Final Result
0.0% 0.2% 0.4%
3.0%
7.0%
25.0%
0%
5%
10%
15%
20%
25%
30%
2009 2011 2013 2015 2017 2019 2021
% RTRS certified tons
Latest results Planned + Final results
440,000 1,004,558
261,578,498 267,583,000
‐
50,000,000
100,000,000
150,000,000
200,000,000
250,000,000
300,000,000
tons of global soy production
tons RTRS certified
Latest results Planned Final resultsPlanned Intermediate Result, & Yr. Expected Final Result
2012 2013

Commodity footprint programmesCommodity Indicator R.4a sustainable production of commodities R.4b sustainable production of commodities
Palm Oil
RSPO
certified tons
1.0%
13.9% 16.4%15.0%
35.0%
50.0%
0%
10%
20%
30%
40%
50%
60%% RSPO certified tons
57,200,957 64,826,662
10 000 000
20,000,000
30,000,000
40,000,000
50,000,000
60,000,000
70,000,000
80,000,000
metric tonnes of global PO and palm kernel production
metric tonnes of RSPO certifiedR
Cotton
BCI certified tons
fied tons
0%2009 2011 2013 2015 2017 2019 2021
Latest results Planned + Final resultsPlanned Intermediate Result, & Yr. Expected Final Result
0.0% 1.8%4.0%
1.3%
6.0%
25.0%
0%
5%
10%
15%
20%
25%
30%
2009 2011 2013 2015 2017 2019 2021
% BCI certified tons
Latest results Planned + Final resultsPlanned Intermediate Result, & Yr. Expected Final Result
20.0%
25.0%
15%
20%
25%
30%% Bonsucro certified tons
7,929,652 10,633,139 ‐
10,000,000
2012 2013
RSPO certified production
492,595 1,100,000
27,200,000 26,360,000
‐
5,000,000
10,000,000
15,000,000
20,000,000
25,000,000
30,000,000
2012 2013
metric tons global production
metric tonnes of BCI certified cotton
1 2001,4001,6001,8002,000
Millions
tonnes certified production
Sugar% Bon
sucro certif
Biomaterials
% RSB
, Bon
sucro, RTR
S, RSPO certified
biom
aterials
0.0% 1.5%2.6%
5.0%
0%
5%
10%
2009 2011 2013 2015 2017 2019 2021
Latest results Planned + Final resultsPlanned Intermediate Result, & Yr. Expected Final Result
0.0% 2.0%3.0%
5.0%
15.0%
25.0%
0%
5%
10%
15%
20%
25%
30%
2009 2011 2013 2015 2017 2019 2021
% RSB, Bonsucro, RTRS, RSPO certified biomaterials
Latest results Planned + Final resultsPlanned Intermediate Result, & Yr. Expected Final Result
30%%MSC tifi d t
43
1,774
0200400600800
1,0001,200
2012 2013
tonnes global sugarcane production
6 000 000
Tuna
MSC
certified tons
Whitefish
MSC
certified tons
0.0%
10.8%
12.7%
10.0%
15.0%
25.0%
0%
5%
10%
15%
20%
25%
2009 2011 2013 2015 2017 2019 2021
% MSC certified tons
Latest results Planned + Final resultsPlanned Intermediate Result, & Yr. Expected Final Result
19.0%
37.5%
52.9%
60.0%
75.0% 75.0%
0%
20%
40%
60%
80%
100%% MSC certified tons
465,722 543,817
4,300,000 4,300,000
0
1,000,000
2,000,000
3,000,000
4,000,000
5,000,000
6,000,000
2012 2013
tons of global tuna production
tons MSC certified production
2009 2011 2013 2015 2017 2019 2021
Latest results Planned + Final resultsPlanned Intermediate Result, & Yr. Expected Final Result
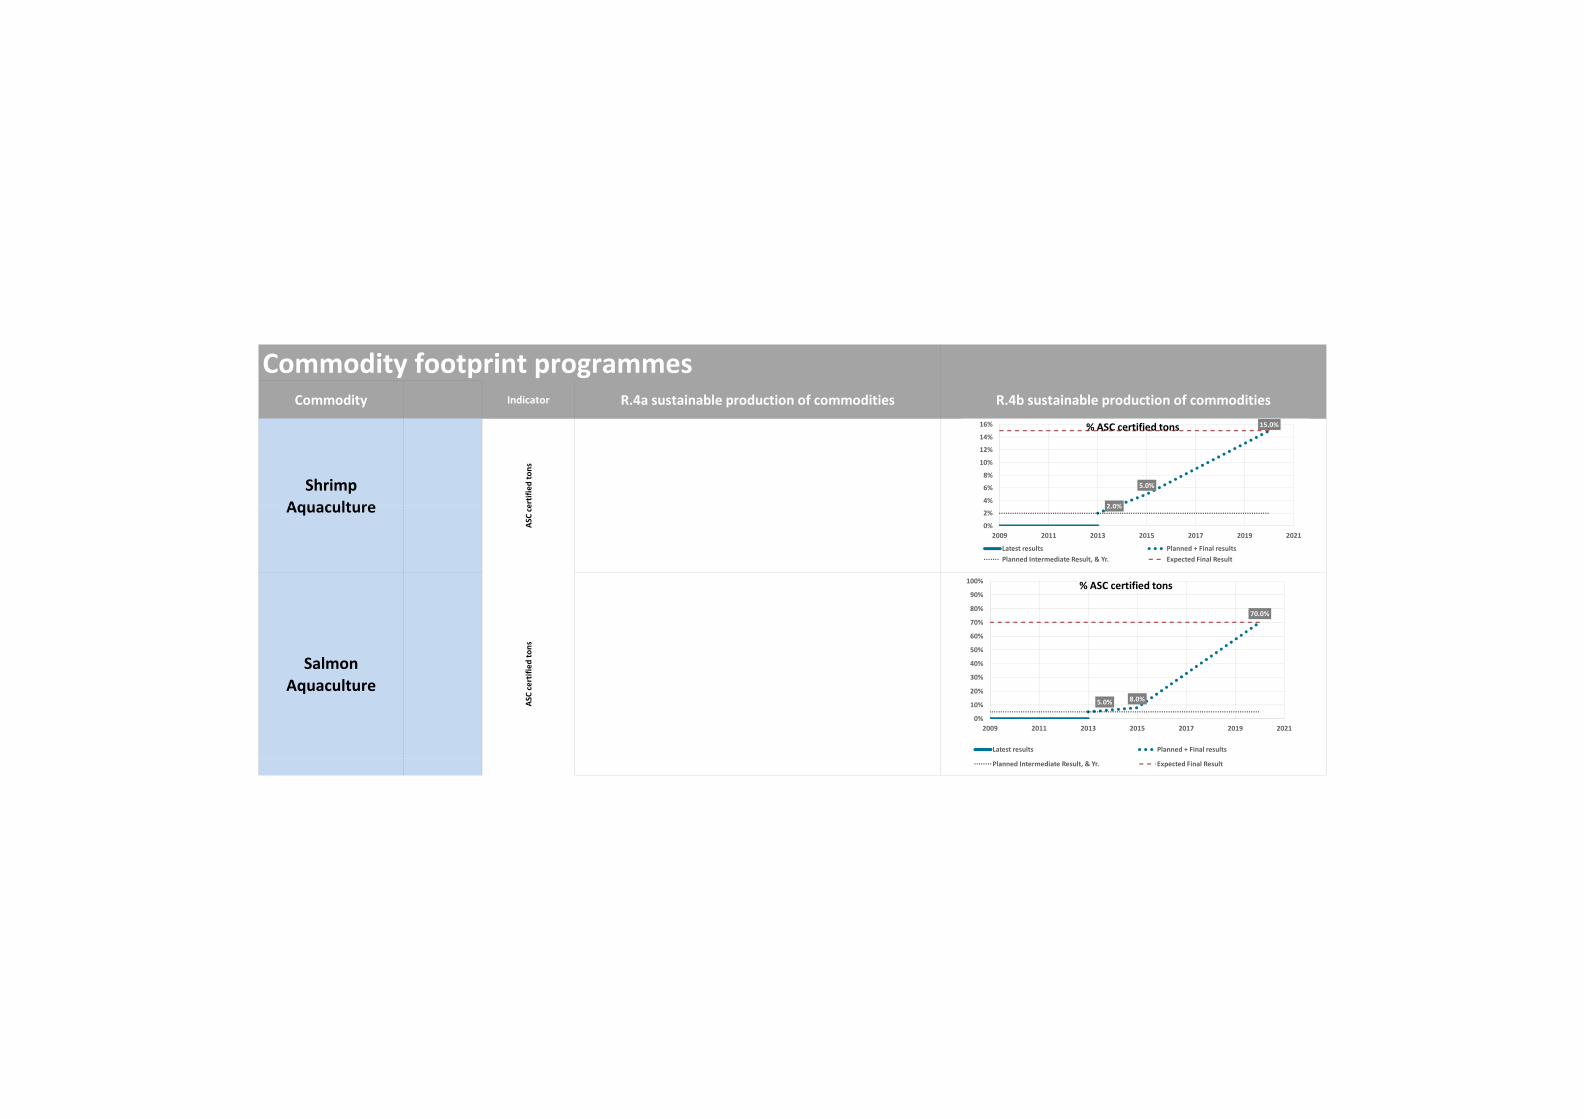
Commodity footprint programmesCommodity Indicator R.4a sustainable production of commodities R.4b sustainable production of commodities
Shrimp Aquaculture er
tified tons
2 0%
5.0%
15.0%
4%
6%
8%
10%
12%
14%
16% % ASC certified tons
AquacultureAS
C ce
Salmon Aquaculture
ASC certified
tons
5.0% 8.0%
70.0%
0%
10%
20%
30%
40%
50%
60%
70%
80%
90%
100%
2009 2011 2013 2015 2017 2019 2021
% ASC certified tons
Latest results Planned + Final results
2.0%
0%
2%
2009 2011 2013 2015 2017 2019 2021
Latest results Planned + Final resultsPlanned Intermediate Result, & Yr. Expected Final Result
Planned Intermediate Result, & Yr. Expected Final Result
