cb climate in the european metal sector at the light of macroeconomic and sectoral trends emf cb...
TRANSCRIPT
CB climate in the European metal sector at the light of macroeconomic and sectoral
trends
EMF CB Committee summer schoolCyprus 12-16 September 2009
Béla GalgócziBased on the macroeconomic chapter of the Eucoban report
prepared by Vera Glassner and Bela Galgoczi
[email protected]@etui.org
2
Structure of presentation
● The background of the crisis● Basic facts and prognoses on the downturn in Europe● Is the crisis over now?● The performance of the relevant manufacturing sub-
sectors (output, orders, employment, productivity)● Snapshot picture in crisis vs longer term trends● Some employment policy tools● The controversiality of the productivity based wage formula
at the time of the crisis● What does this mean for collective bargaining in the sector ● Conclusions
3
The nature of the crisis
The financial crisis developed into a full scale global economic crisis and in a wider sense a `systemic crisis`
● as the financial sector had become disconnected from economic fundamentals and developed instruments through financial innovations that started to function in a virtual reality
● The current crisis manifests itself as a severe `demand shock`
● The fundamentals underlying the spread of the crisis, however, were chronic imbalances in the world economy, within the Euro area and within the national economies of many member states.
4
Europe in full grip of the economic crisis
● The ‘hard landing’ that is visible in the next graph refers mostly to those economies with unsustainable past growth strategies, characterised as ‘bubble growth’ in the previous section.
● The most dramatic downturn is to be seen in Latvia, where above 10% GDP growth in 2007 is likely to turn into a decrease of 13 % by 2009. Previous high-growth economies, such as Estonia, Lithuania and Ireland, are also expected to be hit hard, with a projected drop in GDP of 9-11 % in 2009.
● Other major economies are expected to experience a downturn of around 4-5%, with the Euro area GDP set to fall by 4% and the EU27 by 4 % in 2009 (European Commission 2009). The 5.4% likely downturn in Germany is a huge drag on whole Europe.

5
Gross domestic product in 2008 and prognosis for 2009 (annual growth)
Data Source: European Commission (2009).
-15
-10
-5
0
5
10
LV EE IE DK IT LU SE
PT
HU FR U
K
EA FI
EU
27 BE
ES
DE
MT AT
NL
EL
LT CZ SI
CY
PL
BG
SK
RO
in % 2008
2009

6
Facts on the downturn in I.Q. 2009 – an even bleaker picture
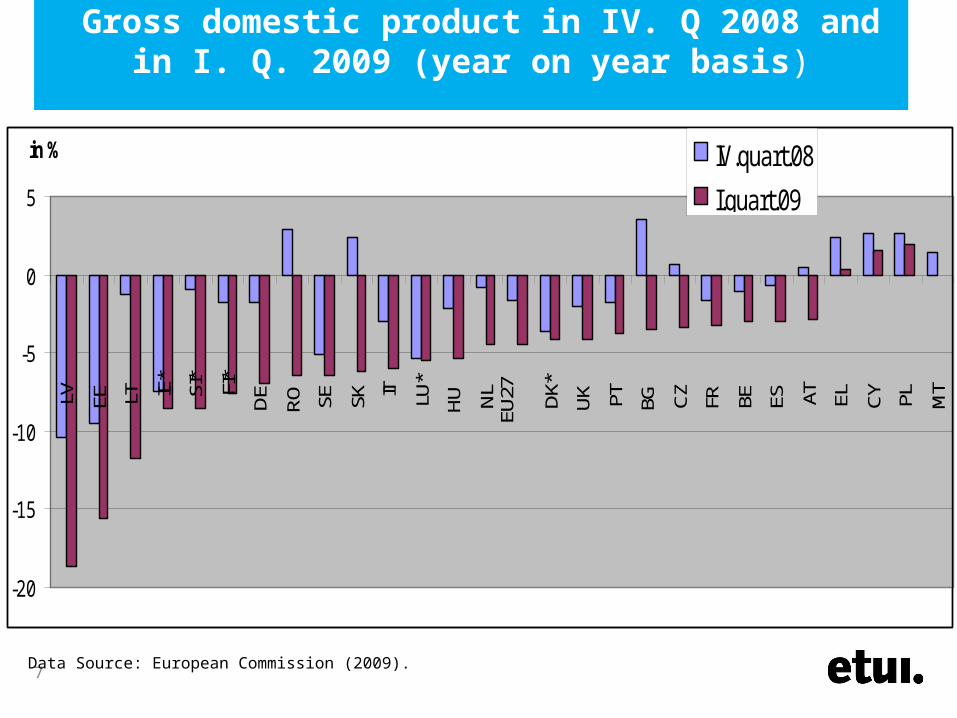
● The downturn in the first quarter of 2009 was 18.6 % in Latvia, Estonia suffered a 16% drop and Lithuania 11%.
● Only Poland has managed limited growth in the I.Q – showing also that the region is not equally effected
● Lithuania already published its II.Q. GDP figure: with a 22.4% drop (year-on-year) this is the largest GDP fall ever measured in peacetime Europe
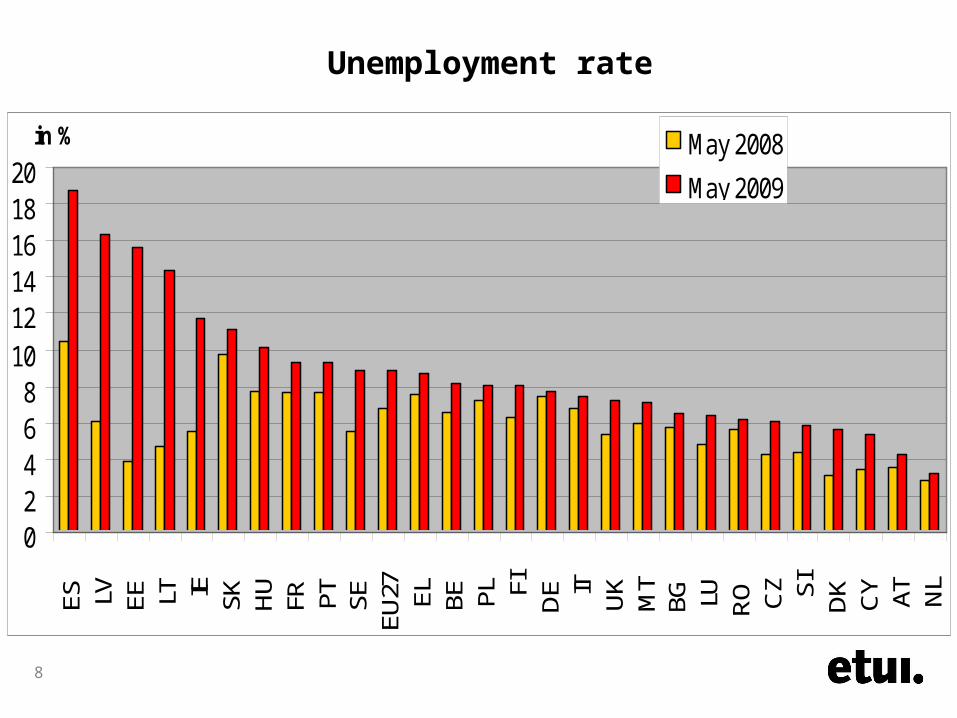
● Indeed a dramatic picture for the whole of Europe● Employment shows a mixed picture across countries,
dramatic deterioration in Spain and the Baltic states, relative stability in DE, NL, AT…
7
Gross domestic product in IV. Q 2008 and in I. Q. 2009 (year on year basis)
Data Source: European Commission (2009).
-20
-15
-10
-5
0
5
LV
EE
L
T
IE*
SI*
FI*
DE
RO
S
E
SK
IT
LU
* H
U
NL
EU
27
DK*
UK
PT
B
G
CZ
F
R
BE
E
S
AT
E
L
CY
P
L
MT
in % IV.quart.08
I.quart.09
8
Unemployment rate
02468
101214161820
ES
L
V
EE
L
T
IE
S
K
HU
F
R
PT
S
E
EU27
E
L
BE
P
L
FI
DE
I
T
UK
M
T
BG
L
U
RO
C
Z
SI
DK
C
Y
AT
N
L
in % May 2008
May 2009
9
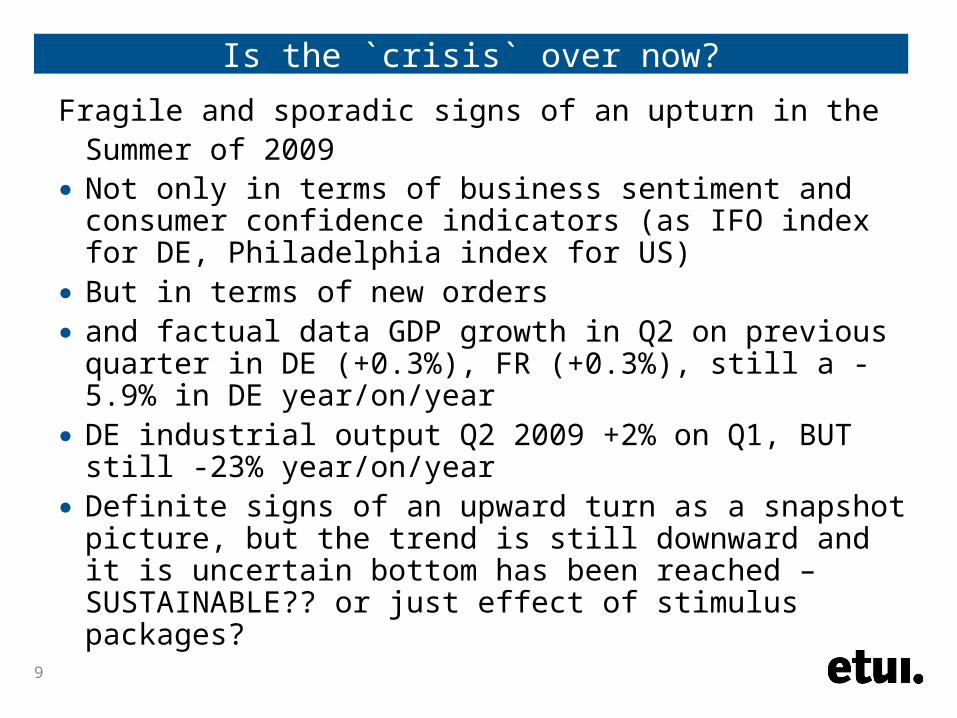
Is the `crisis` over now?
Fragile and sporadic signs of an upturn in the Summer of 2009
● Not only in terms of business sentiment and consumer confidence indicators (as IFO index for DE, Philadelphia index for US)
● But in terms of new orders● and factual data GDP growth in Q2 on previous quarter in
DE (+0.3%), FR (+0.3%), still a -5.9% in DE year/on/year● DE industrial output Q2 2009 +2% on Q1, BUT still -23%
year/on/year● Definite signs of an upward turn as a snapshot picture, but
the trend is still downward and it is uncertain bottom has been reached – SUSTAINABLE?? or just effect of stimulus packages?

10
Relative performance of the manufacturing sector to the whole economy under the current crisis
Manufacturing had been hit exceptionally hard, not just because it is cyclical but because of the nature of the current financial crisis
At the same time employees in manufacturing industry are better protected and have more tools than elswhere in economy (e.g services)
The result: productivity drop much beyond that of the whole economy
Still the longer term trend of the higher performance of the manufacturing industry remains
11
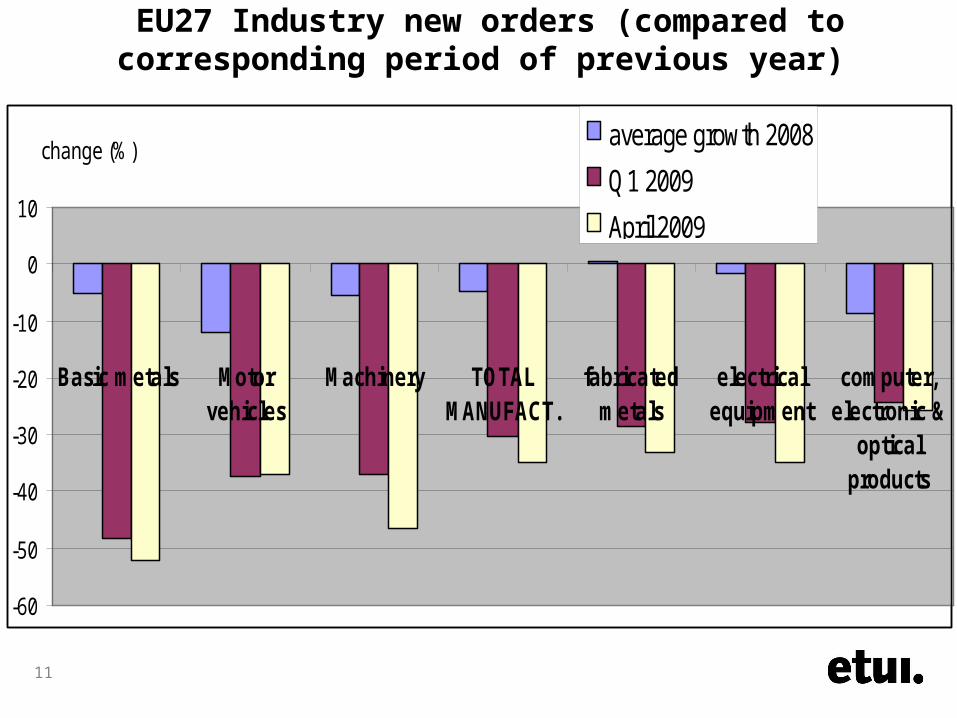
EU27 Industry new orders (compared to corresponding period of previous year)
-60
-50
-40
-30
-20
-10
0
10
Basic metals Motorvehicles
Machinery TOTALMANUFACT.
fabricatedmetals
electricalequipment
computer,electronic &
opticalproducts
change (%)average growth 2008
Q1 2009
April 2009

12
Output growth
-45
-40
-35
-30
-25
-20
-15
-10
-5
0
5
motorvehicles
basic metals fabricatedmetals
electricalequipment
machinery TOTALMANUFACT.
computer,electronic &
opticalproducts
changes (%) Average 2008Q1 2009May 2009

13
Output and employment: cushioning effect
While manufacturing output fell by 19% in the first Q of 2009, employment fell by 6%
In automobile industry output down by 40% in Q1, employment by 7.5%
This is a positive sign for employment protection, shows the effect of short working time schemes and labour hoarding practices of enterprises
At the same time shows a dramatic decrease of productivity
Important however, this is a short term trend (moment picture), longer term productivity trend still positive

14
Employment growth
-10
-8
-6
-4
-2
0
2
4
motorvehicles
computer,electronic &
opticalproducts
TOTALMANUFACT.
fabricatedmetals
electricalequipment
basic metals machinery
change (%) average growth 2008
March 2009

15
Longer term trend of productivity (before crisis)
0
1
2
3
4
5
6
7
2000 2001 2002 2003 2004 2005 2006 2007
annual change (%)
LP Total Economy
LP Total Industry
LP Total Manufacturing
16
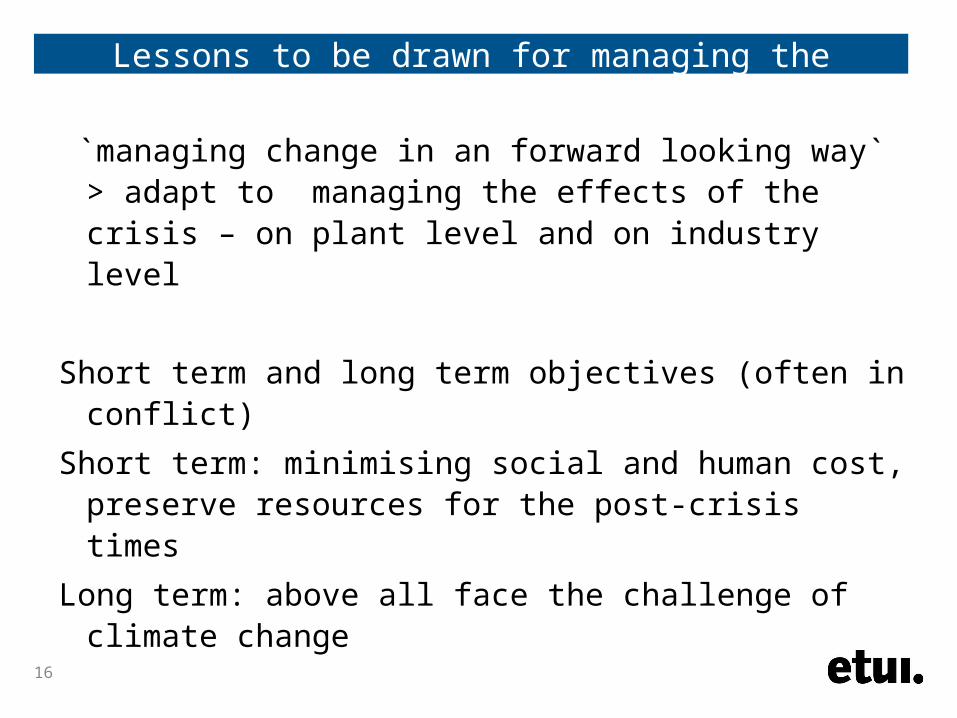
Lessons to be drawn for managing the current crisis
`managing change in an forward looking way` > adapt to managing the effects of the crisis – on plant level and on industry level
Short term and long term objectives (often in conflict)
Short term: minimising social and human cost, preserve resources for the post-crisis times
Long term: above all face the challenge of climate change

17
Labour market tools and CB for safeguarding employment during the crisis
Current context: aiming to diminish the employment impact of the recession for a temporary period (temporary production breakdown due to a collapse of demand) in contrast to
Dealing with employment impact of restructuring (relocation) at times of expanding global production networks
At he same time, Labour Law and the basic elements of the labour market policy instruments existed before (were only adjusted now)
These provide further on the background of dealing with lay-offs (EPL, regulation of mass dismissals, social plans)
Collective agreements have a supporting function to exploit internal flexibility of enterprises to avoid dismissals (WT accounts supplementary negotiated elements to LM policy)

18
European manufacturing industry
● Tools and practices may be similar, but purpose and scope are different (now we talk about WT reduction to minimise employment loss, earlier WT extension /at constant pay/ was applied to save cost and fend off relocation threat
● Attempts to maintain work-force while reducing production by using available instruments
● Available labour market measures are being prolonged and expanded
● Avoidance of plant closures?● Large-scale redundancies of temporary workers, workers
on fixed term contracts, migrant workers and commuters as well as workers with suppliers => vulnerable workers

19
European diversity by sector and country: institutions, strength of social partners
● Different responses in different settings● Country -> institutions● Sectors -> long-term needs and strategy
● Differences in workers participation structures and their scope of authority
● Relations/authority of works council/union differs by country – best option WC with union support
● Trend to avoid firing in order to maintain qualified and competent staff
● However SME and flexible workers are not visible and paying the price
20
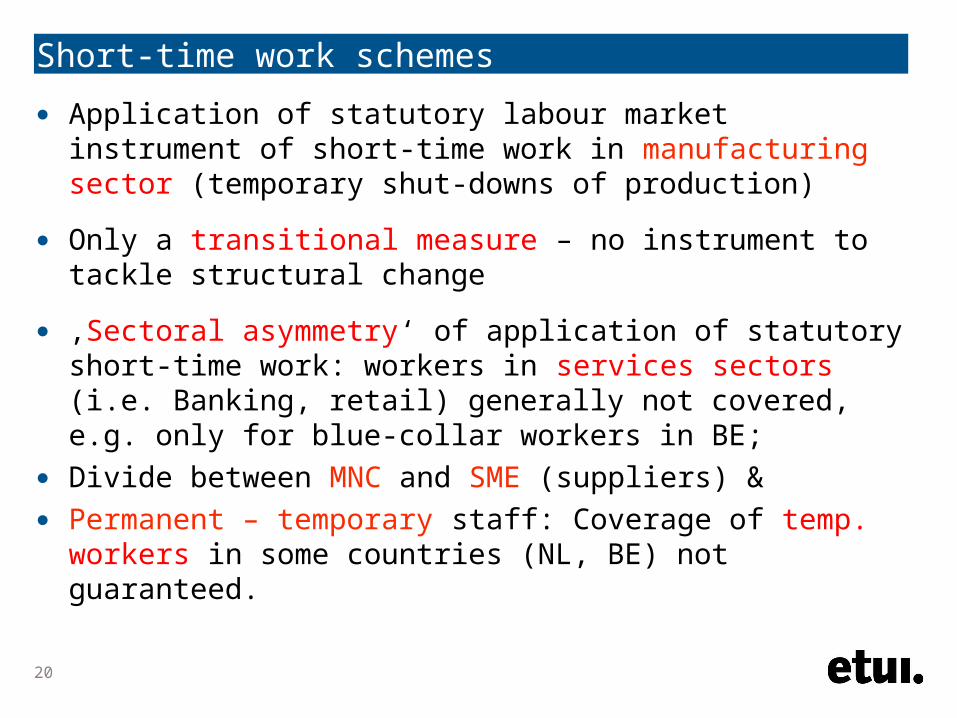
Short-time work schemes
● Application of statutory labour market instrument of short-time work in manufacturing sector (temporary shut-downs of production)
● Only a transitional measure – no instrument to tackle structural change
● ‚Sectoral asymmetry‘ of application of statutory short-time work: workers in services sectors (i.e. Banking, retail) generally not covered, e.g. only for blue-collar workers in BE;
● Divide between MNC and SME (suppliers) &● Permanent – temporary staff: Coverage of temp. workers
in some countries (NL, BE) not guaranteed.

Source: AMECO 200921
Nominal labour costs 2005-2008, 2009 forecast
0
0,5
1
1,5
2
2,5
3
3,5
4
2005 2006 2007 2008 2009
annual change (%)
EA16
EU27

Source: AMECO22
Inflation (HCPI), 2005-2008, 2009 forecast
0
0,5
1
1,5
2
2,5
3
3,5
4
2005 2006 2007 2008 2009
annual change (%)
EA16
EU27

Source: AMECO23
Productivity growth, total economy
-1
-0,5
0
0,5
1
1,5
2
2005 2006 2007 2008 2009
annual change (%)
EA16
EU27

24
What does this mean for collective bargaining
● We need to stress, thesee are short term trends and extraodinary times
● Still, this is the first year after a long period, when wages would grow more than inflation + productivity (with a substantial real wage increase)
● The productivity slump is the immediate consequence of the crisis and will remain temporary (hopefully not at the detriment of employment but through the fast recovery of output)
● Manufacturing (as shown before) has a larger drop in productivity then total economy – there the wage formula is even more `over-performed`
● We also showed the longer term trends (from 1999) and the higher productivity growth in manufacturing is still true for this time horizon

25
Conclusions on the bargaining climate
● Even if the sporadic signs of an upturn get manifested in the rest of the year, the whole year will still show a dramatic decrease of economic performance (GDP for the EA16 cca at -4%, in many countries however much deeper)
● Manufacturing is hit much more dramatically that the total economy (due to its cyclicat nature + the specifics of this crisis)
● The wage formula has lost its relevance in the short-term● All these make the CB climate very unfavourable● Efferts should be concentrated on stabilising employment
and maintaining the purchasing power of workers● This is also a precondition for recovery and the interest of
all players as consumer demand is key in overcoming the crisis!
26
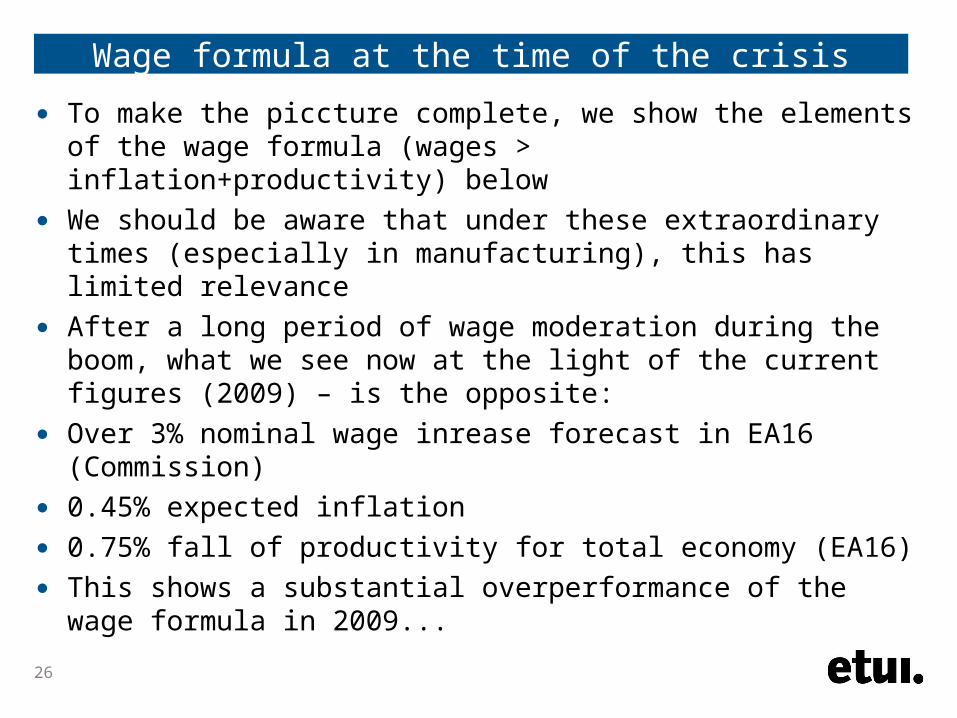
Wage formula at the time of the crisis
● To make the piccture complete, we show the elements of the wage formula (wages > inflation+productivity) below
● We should be aware that under these extraordinary times (especially in manufacturing), this has limited relevance
● After a long period of wage moderation during the boom, what we see now at the light of the current figures (2009) – is the opposite:
● Over 3% nominal wage inrease forecast in EA16 (Commission)
● 0.45% expected inflation● 0.75% fall of productivity for total economy (EA16)● This shows a substantial overperformance of the wage
formula in 2009...