causes of the great depression and the great financial crisis · 2010-11-22 · causes of the great...
TRANSCRIPT
SA
ŠO
KR
AN
ER
20
10
DIP
LO
MA
TH
ES
IS
UNIVERZA NA PRIMORSKEM FAKULTETA ZA MANAGEMENT KOPER
CAUSES OF THE GREAT DEPRESSION
AND THE GREAT FINANCIAL CRISIS
SAŠO KRANER
KOPER, 2010
DIPLOMA THESIS


Koper, 2010
UNIVERZA NA PRIMORSKEM FAKULTETA ZA MANAGEMENT KOPER
CAUSES OF THE GREAT DEPRESSION
AND THE GREAT FINANCIAL CRISIS
Sašo Kraner
Diploma thesis
Mentor: izr. prof. dr. Primož Dolenc

III
SUMMARY
This diploma thesis provides an overview of the causes of the Great Depression and the
Great Financial Crisis. The contraction phase of the first business cycle of the Great
Depression began in August 1929 and lasted until March 1933. A lack of aggregate
demand was the problem with the Great Depression, just as a lack of aggregate demand
is the problem today. It was the combination of causes (monetary and financial), not just
one cause, that led to such an extensive and protracted economic crisis in the 1930s. The
second cycle of the Great Depression began in May 1937. The Great Financial Crisis
was triggered in the first quarter of 2006, when the housing market in the U.S. reversed
and in 2007 became systemic. The Great Financial Crisis derived from a real estate
bubble, fuelled by a credit boom. Liberalization of markets and securitization, together
with speculation and moral hazard, played an important role in the subprime mortgage
crisis. The important roles that government-sponsored enterprises and rating agencies
played needs to be kept in mind.
Key words: banking system and panics, Gold Standard, Great Depression,
macroeconomics, 1937 Recession, securitization, speculation, Stock Market Crash
1929, subprime mortgage crisis, U.S. housing bubble.
POVZETEK
Diplomska naloga obravnava vzroke, ki so odločilno prispevali k izbruhu velike
depresije in velike finančne krize. Gospodarsko krčenje prvega cikla velike depresije se
je začelo avgusta 1929 in trajalo do marca 1933. Motnje na strani povpraševanja so bile
težava takrat, kot so motnje na strani povpraševanja in nezadostno trošenje težava
danes. Kombinacija monetarnih in finančnih vzrokov je pripeljala k tako obsežni in
dolgi krizi v tridesetih letih 20. stoletja. Gospodarsko krčenje drugega cikla se je začelo
maja 1937. Kriza drugorazrednih posojil je bila sprožena s pokom nepremičninskega
balona v ZDA leta 2006 in je v letu 2007 zajela globalni finančni sistem. Velika
finančna kriza je temeljila na nepremičninskem balonu in bila omogočena z
zadolževanjem, torej s krediti. Liberalizacija trgov, listninjenje, špekulacija in »moralni
hazard« so veliko prispevali k veliki finančni krizi. Državno financirana podjetja in
agencije, ki vrednotijo kredite, so igrale pomembno vlogo pri krizi drugorazrednih
posojil.
Ključne besede: bančni sistem in panika, sistem zlatega standarda, velika depresija,
makroekonomija, recesija leta 1937, listninjenje, špekulacija, borzni zlom leta 1929,
kriza drugorazrednih posojil, nepremičninski balon.
UDK: 338.124.4(100)"19:20"(043.2)

V
CONTENTS
1 Introduction ............................................................................................................... 1
1.1 Definition of the Problem Discussed and Theoretical Premises ........................ 1
1.2 Purposes and Aims.............................................................................................. 2
1.3 Envisaged Methods for Achieving the Aims ...................................................... 3
1.4 Envisaged Premises and Limitations .................................................................. 3
2 Great Depression....................................................................................................... 5
2.1 Decline in Spending............................................................................................ 6
2.2 Stock Market Crash 1929 ................................................................................... 9
2.3 Panic in the Banking System and Monetary Contraction................................. 13
2.3.1 Financial Collapse ................................................................................ 15
2.3.2 Monetary Contraction .......................................................................... 18
2.4 The Gold Standard............................................................................................ 20
2.5 The 1937 Recession.......................................................................................... 24
3 Great Financial Crisis............................................................................................. 27
3.1 Housing Bubble ................................................................................................ 27
3.1.1 Home Prices ......................................................................................... 29
3.1.2 Consumer Debt..................................................................................... 30
3.2 Mortgage Origination and Securitization ......................................................... 32
3.2.1 The Mortgage Origination Process ...................................................... 33
3.2.2 Mortgage Products (Mortgage Types).................................................. 34
3.2.3 Nonprime Mortgages............................................................................ 34
3.2.4 Securitization........................................................................................ 34
3.2.5 How Did Mortgage Origination and Securitization Contribute to the Crisis? ............................................................................................. 35
3.3 Central Banks and Financial Institutions.......................................................... 37
3.3.1 Banking Sistem and Shadow Banking System .................................... 38
3.3.2 Government-sponsored Enterprises ..................................................... 40
3.4 Rating Agencies ................................................................................................ 41
3.5 The Explosion of Debt and Lending Practices ................................................. 43
3.5.1 Subprime Lending ................................................................................ 46
3.5.2 Predatory Lending ................................................................................ 47
3.6 Speculation and Moral Hazard ......................................................................... 47
4 Conclusion................................................................................................................ 51
References...................................................................................................................... 57
Appendices..................................................................................................................... 61

VII
FIGURES
Figure 2.1 U.S. Real GNP (billions of 1929 dollars), 1919-39 ............................... 6
Figure 2.2 U.S. Wholesale Price Index (1926=100)................................................ 7
Figure 2.3 New York Stock Prices (1926=100), 1926-38 ..................................... 11
Figure 3.1 U.S Federal Funds Effective Rate, Bank Prime Loan and 1-year
Adjustable Rate Mortgage Average ..................................................... 28
Figure 3.2 U.S. Real Home Prices, together with Building Costs, Population and
Long-Term Government Bond Interest Rates, Annual 1880-2010...... 29
Figure 3.3 U.S. Home Ownership Index ............................................................... 32
Figure 3.4 Non-prime Holdings of GSEs (billions of USD) ................................. 41
Figure 3.5 U.S. Federal Debt, as Percentage of GDP, Fiscal Years 1980-2009.... 45
Figure 3.6 Quality of New Debt Issuance Rated B- or Below, 1993-2007 ........... 46
TABLES
Table 2.1 Percentage Changes in Wholesale Prices at Annual Rates of Change,
1929-33................................................................................................... 7
Table 2.2 New York Stock Prices (Standard Statistical Index) ........................... 11
Table 2.3 Selected Macroeconomic Data............................................................. 17
Table 2.4 Log-differences of Commercial Bank Deposit-Currency Ratios ......... 19
Table 2.5 Dates of Changes in Gold Standard Policies........................................ 21
Table 2.6 Indexes of Income, Production and Other Business Activity for the
U.S., 1937-39 (adjusted for seasonal variation, except as noted) ........ 25
Table 3.1 Outstanding Consumer Debt as a Percentage of Disposable Income (in
billions of dollars) ................................................................................ 31
Table 3.2 U.S. Mortgage Market Originations, 2001-06 ($ amounts in billions) 36
Table 3.3 Mortgage Originations and Subprime Securitization........................... 37
Table 3.4 FDIC Bank Failures ............................................................................. 40
Table 3.5 U.S. GDP and Total Credit Market Dept (billions of dollars) ............. 44
Table 3.6 Delinquency Rates (%)......................................................................... 47

VIII
ABBREVIATIONS
ABCP Asset-backed commercial paper
ABS Asset-backed security
ARM Adjustable rate mortgage
CDO Collateralized debt obligation
CDS Credit default swaps
CLO Collateralized loan obligation
CMO Collateralized mortgage obligation
FDIC Federal Deposit Insurance Corporation
Fed Federal Reserve
FHLB Federal Home Loan Bank
FMR Fixed rate mortgage
GDP Gross domestic product
GNP Gross national product
GSE Government-Sponsored Enterprise
HEL Home equity loan
HELOC Home equity line of credit
HOLC Home Owners' Loan Corporation
MBS Mortgage-backed security
NRSRO Nationally Recognized Statistical Rating Organization
PPM Prepayment penalty mortgage
RMBS Residental mortgage-backed security
SEC Securities and Exchange Commission
SIV Structural investment vehicle
1
1 INTRODUCTION
1.1 Definition of the Problem Discussed and Theoretical Premises
In this diploma thesis, entitled Causes of the Great Depression and the Great
Financial Crisis, the causes of the current financial crisis and of the Great Depression in
the 1930s, which strongly contributed to the onset and spread of both economic
(financial) crises, will be described, analysed and explained.
We encounter the term crisis on a daily basis nowadays. The term crisis is often
used to describe difficult and hazardous situations that are decisive for the future. It can
stand for a decisive moment in time or a decisive change, as well as a difficult situation
in the economy. A crisis often results in substantial damage.
The Great Depression was a worldwide economic downturn that began in 1929 and
lasted until 1939.1 »It was the longest and most severe depression ever experienced by
the industrialized Western world« (Romer 2003, 1). The consequences of the Great
Depression – which began in the United States of America2 – were visible and felt in
almost all countries of the world. Drastic unemployment and deflation and a massive
downturn in output are only some of the consequences of the Great Depression. Real
output and prices declined steeply. Between the top and the bottom of the economic
cycle, industrial production in the United States of America (hereinafter the U.S.) fell by
47%, real GDP by 30% and the wholesale price index3 by 33%. »Although there is
some debate about the reliability of the statistics, it is widely agreed that the
unemployment rate exceeded 20 percent at its highest point« (Romer 2003, 1).
The world economy is not in depression at this point. The current crisis, designated
simply the Great Financial Crisis by most economists, began with what was called the
subprime mortgage crisis in the U.S. in 2006 and engulfed the global financial system in
2007 and 2008. Financial turmoil was provoked by the growing number of defaults on
subprime mortgages. When two Bear Stearns hedge funds4 went bankrupt in 2007 and
when BNP Paribas suspended redemptions in August of the same year, the financial
crisis became systemic. Despite numerous attempts by different governments to contain
the crisis, it spread to various countries and caused panic. We must agree with Shiller,
who said: »The Great Financial Crisis, also called Subprime Mortgage Crisis is the
1 Recovery of the U.S. began in the spring of 1933. In 1937-38 there was another economic
downturn in the U.S. For that reason, most economists refer to the Great Depression as having been from 1929 to 1939 (see Charles P. Kindleberger, Ben S. Bernanke and Christina D. Romer).
2 For a different opinion see Charles P Kindleberger 1986, The World in Depression 1929-1939.
3 The Wholesale Price Index (WPI) was the name of the program from its inception in 1902 until 1978, when it was renamed the »Producer Price Index«.
4 Hedge or compensation or protection funds.
Introduction
2
name for what is a historic turning point in our economy and our culture« (2008, 1). The
effects of the subprime mortgage crisis on national economies and the financial markets
are similar and comparable to those of the crisis called the Great Depression. Even
though the depression itself did not return, depression economics5 surprisingly have
done. Again we are facing difficulties typical of most of the world in the 1930s. The
subprime mortgage crisis is very much like the crisis of the 1930s.
In the hope of preventing6 or minimizing the consequences of larger crises and thus
avoiding difficult situations in the economy and a lowering of the standard of living, the
causes of the Great Depression and those of the Great Financial Crisis need to be
studied. We need to determine whether there are similarities between the causes of the
Great Depression and the causes of the subprime mortgage crisis. Last but not least, we
should also learn from the comparison.
Various countries have undergone or are still undergoing painful/devastating
recessions. The world economy has once again proven to be more fragile than we
imagined. It looks as if the world, at least in the short term, is staggering from one crisis
to another. Those who devise economic policy will have to act; otherwise, as Keynes
picturesquely expressed it, we will all be dead in the long run.
1.2 Purposes and Aims
The purpose of this paper is to determine, analyze and compare the causes that led
to the Great Depression in the 1930s and to the subprime mortgage crisis in 2006 in the
U.S. and in 2007 spread to every country in the world.
The aims of the thesis are:
• to identify the causes of the Great Depression;
• to identify the causes of the Great Financial Crisis, or the subprime mortgage
crisis;
• to study and explain the causes of the Great Depression or the financial crisis of
the 1930s;
• to study and explain the causes of the current financial crisis, i.e., the Great
Financial Crisis;
• to compare the causes of the two financial (economic) crises and
5 »What does the return of depression economics mean? It means that demand-side
disturbances (insufficient private consumption for absorbing available production capacity) emerged for the first time since the Great Depression and became a barrier to the economic health of a large part of the world« (Krugman 2009, 182).
6 It is unrealistic to expect a complete absence of recessions (or economic downturns), because cyclic economies are known for their succession of ups and downs, or recession and expansion.
Introduction
3
• to describe the spread and the consequences of the Great Depression as well as
the subprime mortgage crisis.
1.3 Envisaged Methods for Achieving the Aims
The diploma thesis will be of an entirely theoretical nature. The historical method
will be used. A study of phenomena from the past will thus be performed. The
descriptive method will also be used in writing the diploma thesis. Reality will be
explained by disarticulation of complex economic phenomena into their simpler
elements. Within the framework of the descriptive method, the facts, causes and
processes of the two financial (economic) crises will be presented. Individual causes
will be classified and categorised, i.e., the procedure of defining causes will be applied.
The comparative method will also be used, with a comparison being made of the causes
that contributed to the outbreak of the economic (financial) crises. Finally, the method
of compilation will also be used, i.e., reviewing the results of foreign scientific research
work, conclusions and positions. The method of compilation will be carried out with the
aid of a wide selection of domestic and foreign professional and historical literature. An
appropriately broad and representative selection of literature will be considered. Various
databases will also be used in writing the thesis. Finally, the method of synthesis will be
used. The findings of the diploma thesis will be concentrated into a rounded whole.
1.4 Envisaged Premises and Limitations
The hypothesis or premise of the diploma thesis is that the Great Depression and
the current financial crisis (i.e., the subprime mortgage crisis) have specific similarities.
Put another way, the causes of the Great Depression are similar to the causes of the
Great Financial Crisis (subprime mortgage crisis).
The discussed theme is very demanding and requires detailed understanding of
economic laws and economic theory. I hope that I will succeed in the diploma thesis in
analysing, identifying and clearly presenting the causes of the two economic crises. It is
worth noting that the diploma thesis could not take into account all the explanations on
offer (to a certain extent because of a limitation of the diploma thesis by the faculty).
The causes will be dealt with separately by chapters for the sake of a better presentation,
with the awareness that their influence on the two economic crises is complex. It is
therefore necessary to analyse the interaction of the causes, bearing in mind that all the
causes together, not just one, led to both extensive economic crises.

5
2 GREAT DEPRESSION
The Great Depression was a worldwide economic downturn that began in 1929 and
lasted until 1939. Temin states (1976, 1):
Conventional dating of the downturn based on evidence from a variety of sources puts
it near the middle of the year. But in the popular consciousness – then and now – nothing
happened until the stock-market crash in the fall. Stock prices, which had increased at an
exciting rate in 1928 and 1929, collapsed suddenly in October; Black Thursday, October
24, 1929, has become the symbol of the Depression.
The Great Depression posed a particularly difficult situation in the economy and
caused significant economic loss. Most people think that the Great Depression was just
a single business cycle, but it needs to be said that, technically, it consisted of two
business cycles. The contraction phase of the first cycle began in August 1929 and
lasted until March 1933. This economic decline was the longest and most severe in the
history of the U.S. »It shattered people's faith in the ability of the economy to run
smoothly without interference - the liberal credo of the nineteenth century; the stage
was set for a major expansion of the role of government in the economy« (Temin 1976,
11).
It is worth mentioning that political change occurred in this period. U.S. President
Franklin Roosevelt was elected. He presented and implemented changes in the economy
of the U.S. Government consumption spending emerged. This policy was known as the
»New Deal« and its intention was to hire millions of unemployed workers. The second
cycle of the Great Depression began in May 1937 and the recovery began in June 1938.
In other words, the contraction phase lasted more than a year.
Bernanke is right when he claims that: »to understand the Great Depression is the
Holy Grail of macroeconomics. Not only did the Depression give birth to
macroeconomics as a distinct field of study, but also – to an extent that is not always
fully appreciated – the experience of the 1930s continues to influence macroeconomists'
beliefs, policy recommendations, and research agendas« (2000, 5).
Before turning to what we should be doing, it needs to be said that economists who
have studied the Great Depression have taken a huge step towards understanding both
the Great Depression and macroeconomics in general. However, it seems strange that,
more than 70 years since its outbreak, economists still do not agree on its causes. There
are fundamental differences in their views. Over the decades of study and debate, three
major views or explanations of the causes of the Great Depression have in general
developed. »For the most part, the debate has been conducted in terms of monetarism
versus Keynesianism, money versus spending: two unicauses ranged against one
another« (Kindleberger 1986, 5). The third view (explanation) is Kindleberger’s
internationalist (idiosyncratic) view of the causes and nature of the Great Depression.
Causes of the Great Depression and the Great Financial Crisis
6
Kindleberger’s idiosyncratic view suggests that the depression was rooted in a complex
systematic set of causes, international in scope and partly monetary or at least financial.
The (three) views are presented very briefly in order to show the main differences
between individual views (explanations) and will be explained in more detail later on,
when the (individual) major causes and events of the crisis are discussed.7
2.1 Decline in Spending
Most economists agree that a decline in aggregate demand (decline in spending)
was the main cause (factor) of the Great Depression.8 This premise is of course correct,
because the Great Depression (as was already mentioned in the first chapter), was
marked by a (huge) decline in output and prices.9
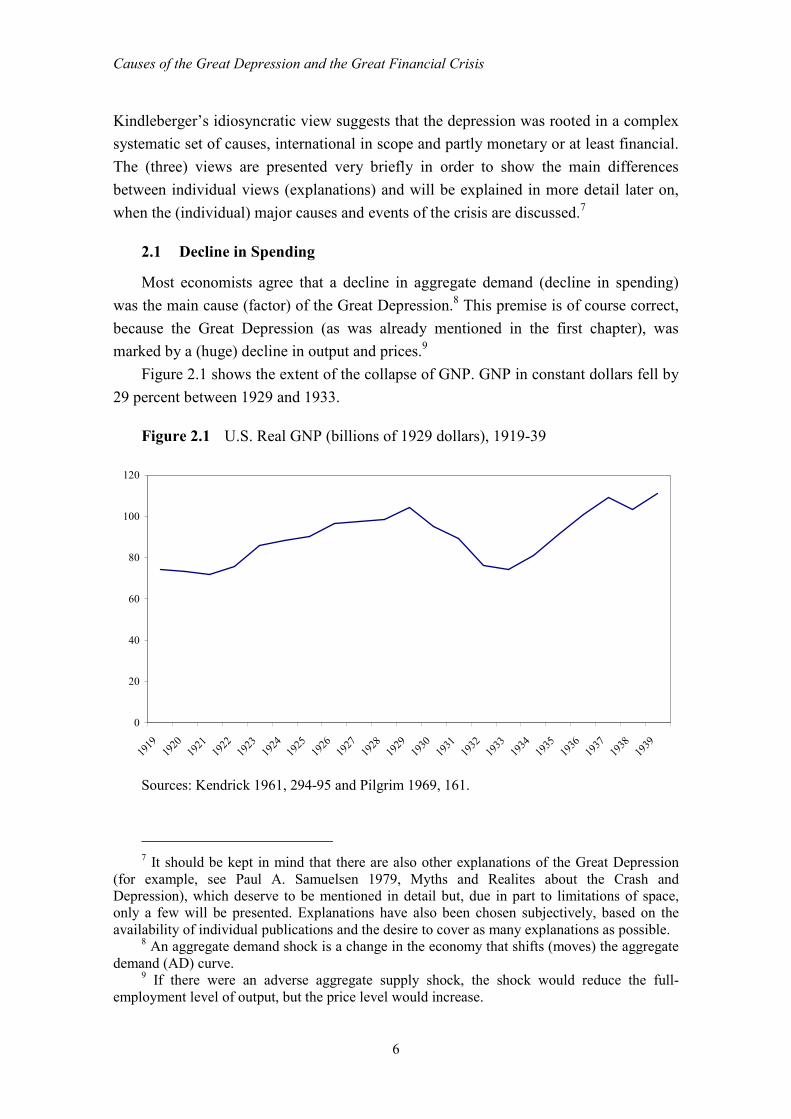
Figure 2.1 shows the extent of the collapse of GNP. GNP in constant dollars fell by
29 percent between 1929 and 1933.
Figure 2.1 U.S. Real GNP (billions of 1929 dollars), 1919-39
0
20
40
60
80
100
120
1919
1920
1921
1922
1923
1924
1925
1926
1927
1928
1929
1930
1931
1932
1933
1934
1935
1936
1937
1938
1939
Sources: Kendrick 1961, 294-95 and Pilgrim 1969, 161.
7 It should be kept in mind that there are also other explanations of the Great Depression
(for example, see Paul A. Samuelsen 1979, Myths and Realites about the Crash and Depression), which deserve to be mentioned in detail but, due in part to limitations of space, only a few will be presented. Explanations have also been chosen subjectively, based on the availability of individual publications and the desire to cover as many explanations as possible.
8 An aggregate demand shock is a change in the economy that shifts (moves) the aggregate demand (AD) curve.
9 If there were an adverse aggregate supply shock, the shock would reduce the full-employment level of output, but the price level would increase.

Causes of the Great Depression and the Great Financial Crisis
7
Figure 2.2 shows the wholesale price index in the U.S. This massive deflationary
movement is one of the key elements of the Great Depression.
Figure 2.2 U.S. Wholesale Price Index (1926=100)
0
20
40
60
80
100
120
1924 1925 1926 1927 1928 1929 1930 1931 1932 1933 1934 1935 1936 1937 1938 1939 1940
Source: U.S. Bureau of Census 1975, 200.
Table 2.1 shows the percentage changes in wholesale prices at annual rates for
U.S., 1929-33.
Table 2.1 Percentage Changes in Wholesale Prices at Annual Rates of Change,
1929-33
From To U.S.
Aug. 1929 Mar. 1933 - 13.1
Aug. 1929 Sept. 1930 - 12.1
Sept. 1930 Sept. 1931 - 17.0
Sept. 1931 June 1932 - 13.0
June 1932 Sept. 1932 + 6.5
Sept. 1932 Feb. 1933 - 17.6
Source: Adapted from Schwartz 1987, 128.
An adverse aggregate demand shock reduces the aggregate demand for goods and
services at a given price level. This shock is represented by a shift down and to the left
of the aggregate demand curve. In the short run, the economy moves away from the
Causes of the Great Depression and the Great Financial Crisis
8
full-employment level of output10 but the price level remains unchanged. This means
that, in consequence, the decline in aggregate demand causes a recession or a
depression. However, the economy will not stay at this level, because enterprises will
not be content to keep producing below their normal capacity. Eventually, firms will
respond to lower demand by reducing their prices, until the economy reaches its new
long-term equilibrium. At this level, output is at its full-employment level (its original
level) but the price level has fallen. In the classical view, prices adjust quite rapidly, so
that the economy quickly obtains its long-term equilibrium. Keynesian economists
argue that prices do not necessarily adjust quickly in response to shocks. The return of
the economy to its long-term equilibrium may therefore be slow.
As noted, there is almost universal agreement that a decline in aggregate demand
was the main cause of the Great Depression. The consensus ends here. In order to go
forward with the explanation, it must be underlined that there is almost universal
disagreement, at least between monetarism and Keynesianism, of what caused, or
rather, led to a decline in spending, thus depressing aggregate demand and leading in
turn to a decline in production as businesses and producers noted an unplanned rise in
inventories (consequently the occurrence of excess supply).11
John Maynard Keynes argued that lower aggregate expenditures12 in the economy
contributed to a massive decline in income and to unprecedentedly high rates of
unemployment (or to a decline in employment), which consequently led to a decline in
spending/production.13 If part of community income is not spent on consumption,
spending can only remain the same as income if the income is spent in another way. In
addition to consumption, another main element of spending is investment. If the missing
consumption14 is replaced by investment15, total spending is the same as if there would
be no savings. In other words, Keynes's proposed solution to high unemployment was to
have the government increase its purchases of goods and services, thus raising the
demand for output. This policy will reduce unemployment because, in order to meet the
10 The normal level of production for the economy as a whole is called the full-employment
of output. 11 It is imperative to keep this in mind in the following chapters. 12 For major categories of aggregate (total) expenditure (Y): consumption (C), investment
(I), governmet purchases (G) and net exports of goods and services (NX). Income Y, measured over a defined period (usually one year) by definition equals total expenditure, C+ I + G + NX.
13 See John Maynard Keynes 1936, The General Theory of Employment, Interest and Money. See also John Maynard Keynes 1930, The Great Slump of 1930.
14 What causes a decrease in consumption? Simplified, for example, a decline in disposable income; another factor often mentioned is decrease in wealth (a stock market crash reduces household wealth and, in addition, it is considered to reduce consumption); expectation (pessimism is considered to decrease consumption) and so on. For more, see Keynes: Propensity to Consume and the Consumption Fuction. See also Friedman's Permanent Income Hypothesis and Modigliani and Ando's Life-Cycle Hypothesis.
15 Bear in mind, that these are ex ante investments.
Causes of the Great Depression and the Great Financial Crisis
9
higher demand for their products, businesses will have to employ more workers. The
newly hired workers will have more income to spend, creating another source of
demand for output, which will additionally increase employment. Furthermore, due to
increased demand, company sales also rise and, consequently, profit; more profit
encourages companies to invest, which, in the long run, increases output (actual as well
potential output). »Thus, neither the restriction of output nor the reduction of wages
serves in itself to restore equilibrium« (Keynes 1930, I). »Moreover, even if we were to
succeed eventually in re-establishing output at the lower level of money-wages
appropriate to (say) the pre-war level of prices, our troubles would not be at an end.
Thus, every fall of prices increases the burden of this debt, because it increases the
value of the money in which it is fixed« (Keynes 1930, I). »In such a situation it must be
doubtful whether the necessary adjustments could be made in time to prevent a series of
bankruptcies, defaults and repudiations, which would shake the capitalist order to its
foundations« (Keynes 1930, I). To summarize, the Keynesian explanation is that an
independent, autonomous decline in spending led to a decrease in the money supply.16
According to the monetary explanation (Milton Friedman, Rose D. Friedman and
Ana J. Schwartz), the depression was caused by U.S. monetary policy. Monetarists
argue that the Great Depression originated in the United States and was mainly caused
by monetary contraction (in monetary rather than real factors), a consequence of poor
policymaking by the Federal Reserve. The failure of the money supply to grow thus led
to a decline in spending. In other words, »the main factor depressing aggregate demand
was a worldwide contraction in world money supplies« (Bernanke 2000, 8).
2.2 Stock Market Crash 1929
The market in the late 1920s had been becoming increasingly speculative. Stock
prices had become unstable. Let us stop for a moment to remind ourselves about the
behaviour of the stock market.
»What drives values to rise or fall on the stock market is still unclear, even in other
parts of the world«, wrote Mencinger (2009, 10). However, as usual, something can be
said.
»One thing is certain and that is that securities are goods with high income
elasticity and therefore the growth of income and trust in the efficiency of the capital
market suffice for the currency rising in the long run, which ensures an inflow of funds
into the market« (Mencinger 2009, 10).
16 Temin in his work argued for an autonomous decline in spending. See Peter Temin 1976,
Did Monetary Forces Cause the Great Depression?

Causes of the Great Depression and the Great Financial Crisis
10
In addressing the stock market crash, we need to begin with two important
characteristics of cyclical behaviour of macroeconomic variables.17 The first is the
direction in which a macroeconomic variable moves, relative to the direction of
aggregate economic activity. We thus distinguish procyclical, countercyclical and
acyclical movements of macroeconomic variables. The second characteristic is the
timing of the variable's turning points relative to the turning point of the business cycle.
Here, we distinguish a coincident variable, a lagging variable and a leading variable.
Stock prices (financial variables) are thus generally procyclical (stock prices rise in
good economic times) and leading (stock prices usually fall in advance of a recession).
After the stock market crash came the Great Depression. Until the autumn of 1929,
the economic downturn was limited. The recession was modest. Up to October
(November), it was possible to argue that not much of anything had happened. As
already mentioned, the economy had undergone similar recessions in 1924 and 1927.
However, unlike these other occasions (also 1924 and 1927), in 1929 the recession went
on and on and violently worsened (summarized from Galbraith 2009, 177). »Among the
problems involved in assessing the causes of depression none is more intractable than
the responsibility to be assigned to the stock market crash« (Galbraith 2009, 168-169).
»The 1920s had been a prosperous decade and there had been mild recessions in both
1924 and 1927. The one obvious area of excess was the stock market. Stock prices had
risen more than fourfold from the low in 1921 to the peak reached in 1929« (Romer
2003, 3). »At the time, the rise of the New York stock market seemed spectacular; The
Dow-Jones industrial average went from a low of 191 in early 1928 to a high of 300 in
December and a peak of 381 in September 1929, or doubled in two years«
(Kindleberger 1986, 95). Romer in 2003 stated (2003, 3):
By the fall of 1929, U.S. stock prices had reached levels that could not be justified by
reasonable anticipations of future earnings. As a result, when a variety of minor events led
to a gradual price decline in October 1929, investors lost confidence and the stock market
bubble burst. Panic selling began on »Black Thursday«, October 24, 1929. Many stocks
had been purchased on margin, that is, using loans secured by only a small fraction of the
stocks' value. As, a result, […] U.S. stock prices (measured using Cowles Index) declined
33 percent.
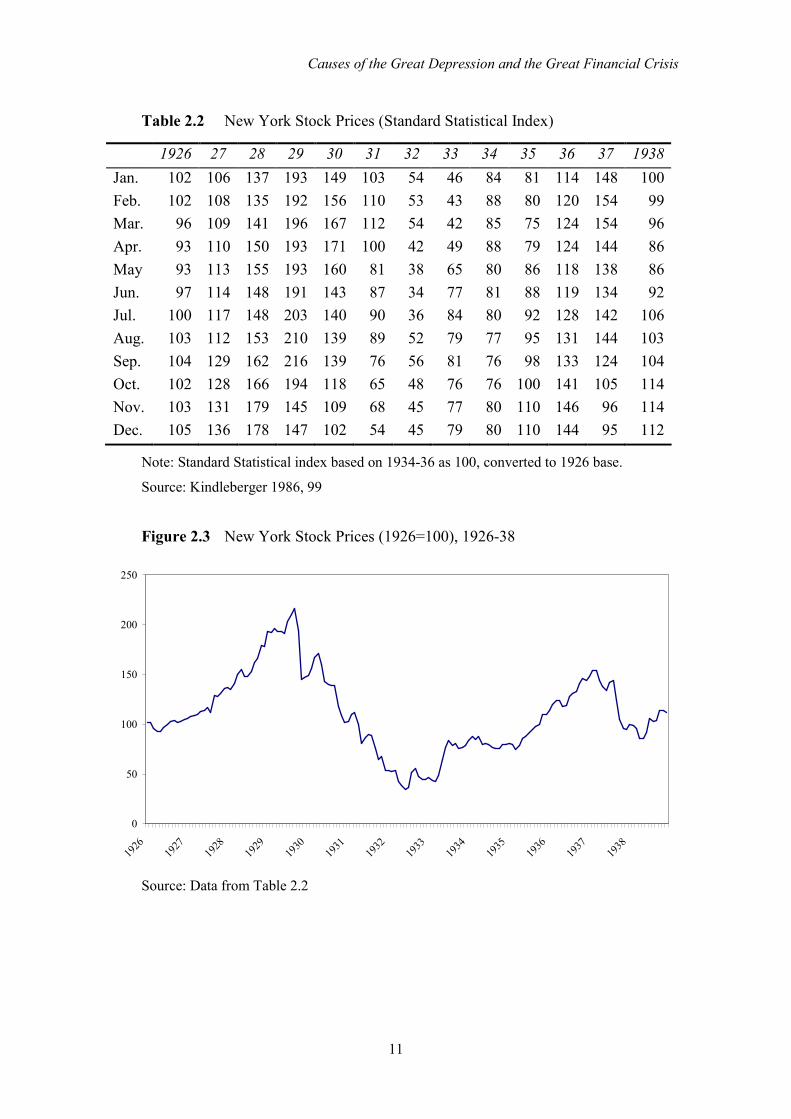
Table 2.2 shows the movements of stock prices on the New York stock market.
17 The following macroeconomic variables are recognised: production, expenditure,
employment and unemployment, money growth, inflation and financial variables.
Causes of the Great Depression and the Great Financial Crisis
11
Table 2.2 New York Stock Prices (Standard Statistical Index)
1926 27 28 29 30 31 32 33 34 35 36 37 1938
Jan. 102 106 137 193 149 103 54 46 84 81 114 148 100
Feb. 102 108 135 192 156 110 53 43 88 80 120 154 99
Mar. 96 109 141 196 167 112 54 42 85 75 124 154 96
Apr. 93 110 150 193 171 100 42 49 88 79 124 144 86
May 93 113 155 193 160 81 38 65 80 86 118 138 86
Jun. 97 114 148 191 143 87 34 77 81 88 119 134 92
Jul. 100 117 148 203 140 90 36 84 80 92 128 142 106
Aug. 103 112 153 210 139 89 52 79 77 95 131 144 103
Sep. 104 129 162 216 139 76 56 81 76 98 133 124 104
Oct. 102 128 166 194 118 65 48 76 76 100 141 105 114
Nov. 103 131 179 145 109 68 45 77 80 110 146 96 114
Dec. 105 136 178 147 102 54 45 79 80 110 144 95 112
Note: Standard Statistical index based on 1934-36 as 100, converted to 1926 base.
Source: Kindleberger 1986, 99
Figure 2.3 New York Stock Prices (1926=100), 1926-38
0
50
100
150
200
250
1926
1927
1928
1929
1930
1931
1932
1933
1934
1935
1936
1937
1938
Source: Data from Table 2.2

Causes of the Great Depression and the Great Financial Crisis
12
As is evident from Figure 2.3, the market (from 1926 to October 192918) was justly
described as an “orgy of speculation,” a “mania,” a “bubble” and other terms denoting a
loss of contact with reality.
In the words of Galbraith (2009, 169): »As already so often emphasized, the
collapse in the stock market in the autumn of 1929 was implicit in the speculation that
went before.« Moreover (Ibid., 169):
We do not know why a great speculative orgy occurred in 1928 and 1929. The long
accepted explanation that credit was easy and so people were impelled to borrow money to
buy common stocks on margin is obviously nonsense. […] Far more important than the
rate of interest and money supply of credit is the mood. Speculation on a large scale
requires a pervasive sense of confidence and optimism and a conviction that ordinary
people were meant to be rich.
If one looks squarely at the issues, it is clear that the combination of easy credit,
interest rates and mood (including the pervasive sense of confidence and optimism)
contributed to the speculation,19 which, in consequence, led to the stock market crash.
According to Romer: »The stock market crash reduced American aggregate
demand substantially. Consumer purchases of durable goods and business investment
fell sharply after the crash. A likely explanation is that the financial crisis generated
considerable uncertainty about future income, which in turn led consumers and firms to
put off purchases of durable goods« (2003, 3). She continues: »Although the loss of
wealth caused by the decline in stock prices was relatively small, the crash may also
have depressed spending by making people feel poorer. As a result of the drastic decline
in consumer and firm spending, real output in the U.S., which had been declining slowly
up to this point, fell rapidly in late 1929 and throughout 1930.«
The stock market crash in 1929, claims Friedman, »was a momentous event, but it
did not produce the Great Depression and it was not a major factor in the Depression's
severity. A sharp but not unprecedented contraction was converted into a catastrophe by
bad monetary policy […]. Whatever happens in a stock market, it cannot lead to a great
depression unless it produces or is accompanied by a monetary collapse« (1970, 78).
There are still puzzles, but we can conclude: »Thus, while the Great Crash of the
stock market and the Great Depression are two quite separate events, the decline in
stock prices was one factor causing the decline in production and employment in the
United States« (Romer 2003, 3). On the other hand, the stock market crash also reduced
household wealth, which reduced consumption and further depressed aggregate demand
18 As shown in Table 2.2, the market peak – in terms of the Standard Statistical Index – was
reached on September 19, 1929. 19 »Speculation, accordingly, is most likely to break out after a substantial period of
prosperity, rather than in the early phases of recovery from a depression« (Galbraith 2009, 170).

Causes of the Great Depression and the Great Financial Crisis
13
(aggregate expenditure, or aggregate spending).20 It must be added that pessimism, in
this respect, played an important role. In the words of Keynes: »At this moment, the
slump is probably a little overdone for psychological reasons« (1930, II).
2.3 Panic in the Banking System and Monetary Contraction
»The next blow to aggregate demand occurred in the fall of 1930, when the first of
four waves of banking panics gripped the United States« (Romer 2003, 3). »During
1930-33, the U.S. financial system experienced conditions that were among the most
difficult and chaotic in its history. Waves of bank failures culminated in the shutdown
of the banking system (and of a number of other intermediaries) in March 1933«
(Bernanke 2000, 41). Bernanke is right when he states that »on the other side of the
ledger, exceptionally high rates of default and bankruptcy affected every class of
borrower except the federal government« (2000, 41).
»A banking panic arises when many depositors lose confidence in the solvency of
banks and simultaneously demand their deposits be paid to them in cash. Banks, which
typically hold only a fraction of deposits as cash reserves, must liquidate loans in order
to raise the required cash« (Romer 2003, 3).
As stated by some authors21, the era between 1929 (1930) and 1933 was not
uniform from the point of view of contraction, or it was not all of one piece, there were
distinct stages of the contraction.
The stages that Friedman and Schwartz noted included (Schwartz 1987, 111):
(1) The period prior to the first banking panic - that is, August 1929 to October 1930.
This period encompassed the stock market crash in October 1929, to which the Federal
Reserve responded by a short-lived increase in the quantity of money. Subsequently, an
earlier decline in the quantity of money was resumed, but there was no attempt by banks to
liquidate loans or by depositors to shift from deposits to currency. During this interval, the
contraction would have been defined as severe relative to earlier ones. (2) The first banking
panic, covering the final quarter of 1930, when the real economy markedly worsened. (3)
The first quarter of 1931, when signs of revival were nipped upon the onset of a second
banking crisis in March 1931. (4) The last half of 1931, when the response of the Federal
Reserve to Britain's departure from gold was accompanied by another outbreak of banking
panic and a substantial deepening of the real decline that persisted through the first quarter
of 1932. (5) The second quarter of 1932, when the Federal Reserve undertook open-market
purchases, following which there was a widespread revival in the real economy in the
summer and fall. (6) The final six months of the contraction, when problems with the banks
20 According to some estimates, because consumers worried that the stock market crash
would lead to a recession, they reduced consumption further. 21 See, for example, Schwartz, Bernanke, Mitchell and Burns.
Causes of the Great Depression and the Great Financial Crisis
14
spread, the real economy turned downward again, and the contraction ended with a
collapse of financial markets.
After the 1929 peak, stock prices thus reached their peak on September 7, when
Standard and Poor’s composite price index of 90 common stocks stood at 254, followed
by the stock market crash. The U.S. experienced four negative shocks and four episodes
of banking panic: in the fall of 1930 (November - December 1930), in the spring of
1931 (from March to June 1931), in the last half of 1931 and in the last quarter of 1932.
»The final wave of panics continued through the winter of 1933 and culminated with the
national “bank holiday” declared by President Franklin Roosevelt on March 6, 1933.
The bank holiday closed all banks, permitting them to reopen only after being deemed
solvent by government inspectors« (Romer 2003, 3). The four episodes of banking
panic, Romer noted, caused serious damage and ravaged the American banking system.
»By 1933, one-fifth of the banks in existence at the start of 1930 had failed« (2003, 3).
An apparent attempt at recovery from the 1929-30 recession was stalled at the time
of the first banking crisis (summarized from Bernanke 2000, 41). What were therefore
the causes of the initial 1929-30 downturn?22 »Friedman and Schwartz (1963) have
stressed the importance of the Federal Reserve's “anti-speculative” monetary tightening.
Others, such as Temin (1976), have pointed out autonomous expenditure effects«
Bernanke said (2000, 41). Galbraith, inter alia, blames the bad banking structure for the
initial 1929-30 downturn. »Although the bankers were not unusually foolish in 1929,
the banking structure was inherently weak. The weakness was implicit in the large
number of independent units. When one bank failed, the assets of others were frozen,
while depositors elsewhere had a pregnant warning to go and ask for their money. Thus,
one failure led to other failures, and these spread with a domino effect« (Galbraith 2009,
179). In the first six months of 1929, according to Galbraith, »346 banks failed in
various parts of the country, with aggregate deposits of nearly $115 million« (Ibid.,
179).
The next period in which the U.S. financial system encountered numerous
difficulties is therefore the aforementioned four episodes of banking panic – from
October (November) 1930 until March 1933. »An interesting aspect of the general
financial crises – most clearly, of the bank failures – was their coincidence in timing
with adverse developments in the macroeconomy« (Bernanke 2003, 41). As Bernanke
goes on to say: »A possible explanation of these synchronous movements is that the
financial system simply responded, without feedback, to the declines in aggregate
output« (Ibid., 41). Obviously, this contradicts what was said earlier, when talking about
the cyclical charateristics of macroeconomic variables. In other words: »This is
contradicted by the fact that problems of the financial system tended to lead to output
22 See also Chapter 2.2 Stock Market Crash 1929.

Causes of the Great Depression and the Great Financial Crisis
15
declines, and that sources of financial panics unconnected with the fall in U.S. output
have been documented by many writers« (Bernanke 2003, 41). How can this be,
though? Friedman and Schwartz – by trying to emphasize the opposite direction of
causality – indicated two ways in which the difficulties of the banks worsened the
general economic contraction: first, by reducing the wealth of bank shareholders;
second, by leading to a rapid fall in the supply of money (summarized from Bernanke
2000, 41-42). We should be clear: »There is much support for the monetary view.23
However, it is not a complete explanation of the link between the financial sector and
aggregate output in the 1930's« (Bernanke 2000, 42). This is because, as Bernanke
emphasized: »One problem is that there is no theory of monetary effects on the real
economy that can explain protracted non-neutraility. Another is that the reduction of the
money supply in this period seems quantitatively insufficient to explain the subsequent
falls in output« (Ibid., 42). In his explanation of the 1930-33 financial crisis, Bernanke
advocates a third way in which the financial crises may have affected output.
Bernanke’s basic premise is that (Ibid., 42):
Because markets for financial claims are incomplete, intermediation between some
classes of borrowers and lenders requires non-trivial market-making and information-
gathering services. As the real costs of intermediation increased, some borrowers
(especially households, farmers, and small firms) found credit to be expensive and difficult
to obtain. The effects of this credit squeeze on aggregate demand helped convert the severe
but not unprecedented downturn of 1920-30 into a protracted depression.
The main downside of Bernanke's work is that his explanation does not offer a
complete explanation of the Great Depression. Nothing is said about the period, or
events, before the stock crash and the recession of 1929-30, i.e. about the period prior to
the first banking panic, from August 1929 to October 1930.
Several authors have focused on the inherent instability of the financial system, but
in doing so have had to depart from the assumption of rational economic behaviour
(summarized from Bernanke 2000, 43). This is understandable, since banking panics, by
their nature, are largely irrational.
It has to be admitted that there is a lot of merit to both theories.
2.3.1 Financial Collapse
The two major components of the financial crisis between November 1930 and
March 1933, according to Bernanke, »were the loss of confidence in financial
institutions, primarily commercial banks, and the widespread insolvency of debtors«
(2000, 43).
23 Thus, the view of Friedman and Schwartz.
Causes of the Great Depression and the Great Financial Crisis
16
Many financal institutions at that time found themselves in trouble. Insurance
companies, mutual savings banks, building-and-loans societies are only a few of the
financial institutions that fought for survival. »Of most importance, however, were the
problems of the commercial banks« (Bernanke 2000, 44). According to Goldsmith
(1958, ibid.), »commercial banks – in 1929 – held 39.6 percent of the assets of all
financial intermediaries«. As stated above, the U.S. banking system was (mostly)
comprised of smaller, independent banks. »The dominance of small banks in the U.S.
was due in large part to a regulatory environment which reflected popular fears of large
banks and “trusts”« (Bernanke 2000, 44). According to Bernanke (Ibid., 44):
Besides the simple lack of economic viability of some marginal banks, however, the
U.S. system historically suffered also from a more malign source of bank failures; namely,
financial panics. The fact that liabilities of banks were principally in the form of fixed-
price, callable debt (i.e., demand deposits), while many assets were highly illiquid, created
the possibility of the perverse expectational equilibrium know as a “run” on the banks.
In addition, the consequence of this was that almost the entire banking system
became adversely affected, not just the system (or that) of marginal banks.
As already emphasized, the second major component of the financial crisis between
November 1930 and March 1933 was the widespread insolvency of debtors. »Given that
debt contracts were written in nominal terms, the protracted fall in prices and money
incomes greatly increased debt burdens« (Bernanke 2000, 46). »According to Evans
Clark (1933), the ratio of debt service to national income went from 9 percent in 1929 to
19.8 percent in 1932-33. »The resulting high rates of default caused problems for both
borrowers and lenders, noted Bernanke« (Ibid., 46). »Because of the long spell of low
food prices, farmers were in more difficulty than homeowners. At the beginning of
1933, owners of 45 percent of all U.S. farms, holding 52 percent of the value of farm
mortgage debt, were delinquent in payments« (Hart 1938, 138). The financial crisis also
touched homeowners (Hart 1938, 164):
The proportion of mortgage owner-occupied houses with some interest of principal in
default was in none of the twenty-two cities [surveyed] less than 21 percent (the figure for
Richmond, Virginia); in half it was above 38 percent; in two (Indianapolis and
Birmingham, Alabama) between 50 percent and 60 percent; and in one (Cleveland), 62
percent. For rented properties, percentages in default ran slightly higher.
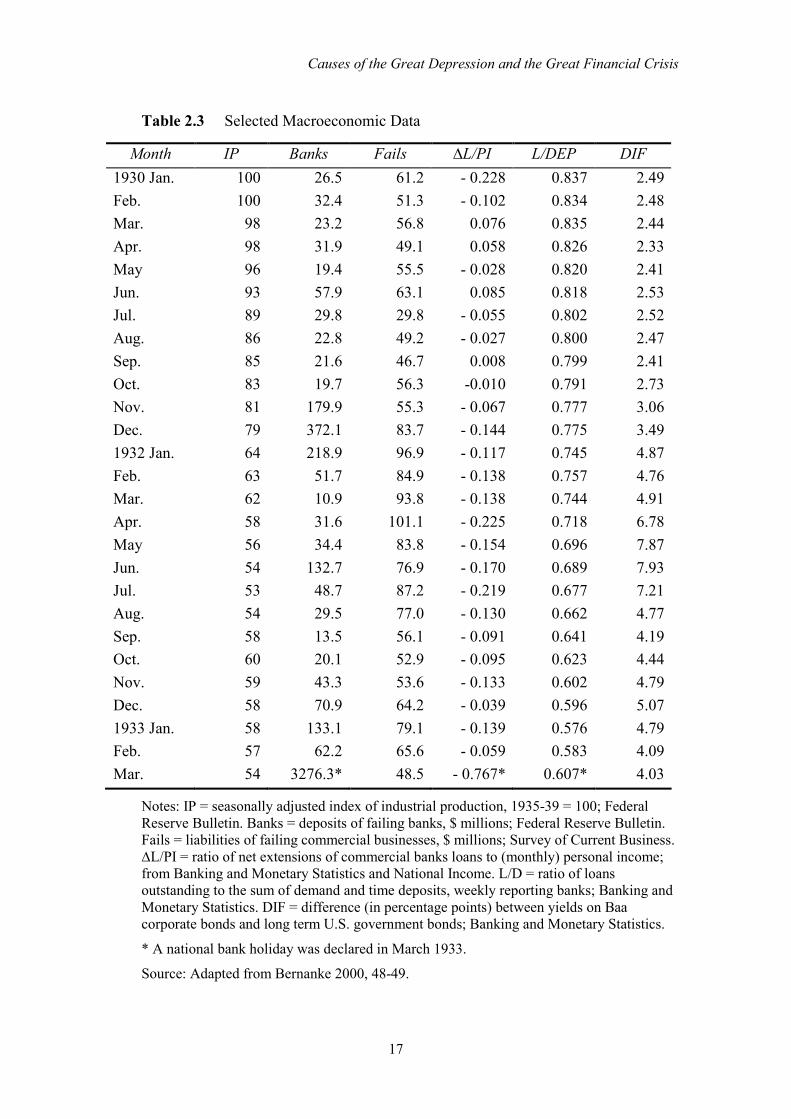
As already pointed out, the connection between the stages of the financial crisis
(especially the bank failures) and changes in real output has been noted by many
writers.
Table 2.3 shows the correlation of the financial crisis – from January 1930 to
December 1930 and January 1932 to March 1933 – with macroeconomic activity.
Causes of the Great Depression and the Great Financial Crisis
17
Table 2.3 Selected Macroeconomic Data
Month IP Banks Fails ∆L/PI L/DEP DIF
1930 Jan. 100 26.5 61.2 - 0.228 0.837 2.49
Feb. 100 32.4 51.3 - 0.102 0.834 2.48
Mar. 98 23.2 56.8 0.076 0.835 2.44
Apr. 98 31.9 49.1 0.058 0.826 2.33
May 96 19.4 55.5 - 0.028 0.820 2.41
Jun. 93 57.9 63.1 0.085 0.818 2.53
Jul. 89 29.8 29.8 - 0.055 0.802 2.52
Aug. 86 22.8 49.2 - 0.027 0.800 2.47
Sep. 85 21.6 46.7 0.008 0.799 2.41
Oct. 83 19.7 56.3 -0.010 0.791 2.73
Nov. 81 179.9 55.3 - 0.067 0.777 3.06
Dec. 79 372.1 83.7 - 0.144 0.775 3.49
1932 Jan. 64 218.9 96.9 - 0.117 0.745 4.87
Feb. 63 51.7 84.9 - 0.138 0.757 4.76
Mar. 62 10.9 93.8 - 0.138 0.744 4.91
Apr. 58 31.6 101.1 - 0.225 0.718 6.78
May 56 34.4 83.8 - 0.154 0.696 7.87
Jun. 54 132.7 76.9 - 0.170 0.689 7.93
Jul. 53 48.7 87.2 - 0.219 0.677 7.21
Aug. 54 29.5 77.0 - 0.130 0.662 4.77
Sep. 58 13.5 56.1 - 0.091 0.641 4.19
Oct. 60 20.1 52.9 - 0.095 0.623 4.44
Nov. 59 43.3 53.6 - 0.133 0.602 4.79
Dec. 58 70.9 64.2 - 0.039 0.596 5.07
1933 Jan. 58 133.1 79.1 - 0.139 0.576 4.79
Feb. 57 62.2 65.6 - 0.059 0.583 4.09
Mar. 54 3276.3* 48.5 - 0.767* 0.607* 4.03
Notes: IP = seasonally adjusted index of industrial production, 1935-39 = 100; Federal Reserve Bulletin. Banks = deposits of failing banks, $ millions; Federal Reserve Bulletin. Fails = liabilities of failing commercial businesses, $ millions; Survey of Current Business. ∆L/PI = ratio of net extensions of commercial banks loans to (monthly) personal income; from Banking and Monetary Statistics and National Income. L/D = ratio of loans outstanding to the sum of demand and time deposits, weekly reporting banks; Banking and Monetary Statistics. DIF = difference (in percentage points) between yields on Baa corporate bonds and long term U.S. government bonds; Banking and Monetary Statistics.
* A national bank holiday was declared in March 1933.
Source: Adapted from Bernanke 2000, 48-49.
Causes of the Great Depression and the Great Financial Crisis
18
Bank panics thus interfere with normal flows of credit; they may affect the
performance of the real economy (recapitulated from Bernanke and James 2000, 71). As
in the United States, banking panics further depressed output and prices in various
countries around the world.
2.3.2 Monetary Contraction
»The Federal Reserve did little to try to stem the banking panics« (Romer 2003, 4).
Scholars believe that different and realizable actions by the monetary authorities could
have prevented the decline in the money supply.24 From the cyclical peak in (August)
September 1929 to the cyclical trough25 in March 1933, the money supply fell by over a
third. »Prevention or moderation of the decline in the stock of money, let alone the
substitution of monetary expansion, would have reduced the contraction’s severity and
almost as certainly its duration« (Friedman and Schwartz 2008, 14). Such a decline in
the stock of money caused by the Fed thus had a severe contractionary effect on output.
The decline in the stock of money depressed spending in a number of ways.
»Money income declined by 15 percent from 1929 to 1930, 20 percent the next
year, and 27 percent in the next, and then by a further 5 percent from 1932 to 1933,
even though the cyclical trough is dated March 1933« (Friedman and Schwartz 2008,
15). »All told, money income fell 53 per cent and real income 36 per cent, or at
continuous annual rates of 19 per cent and 11 per cent, respectively, over the four-year
period« (Ibid., 15). The (four) banking panics caused a rise in the amount of currency
people wished to hold relative to their bank deposits. Velocity – from 1929 to 1933 –
fell by nearly one-third. A statistical indicator of banking problems emphasized by
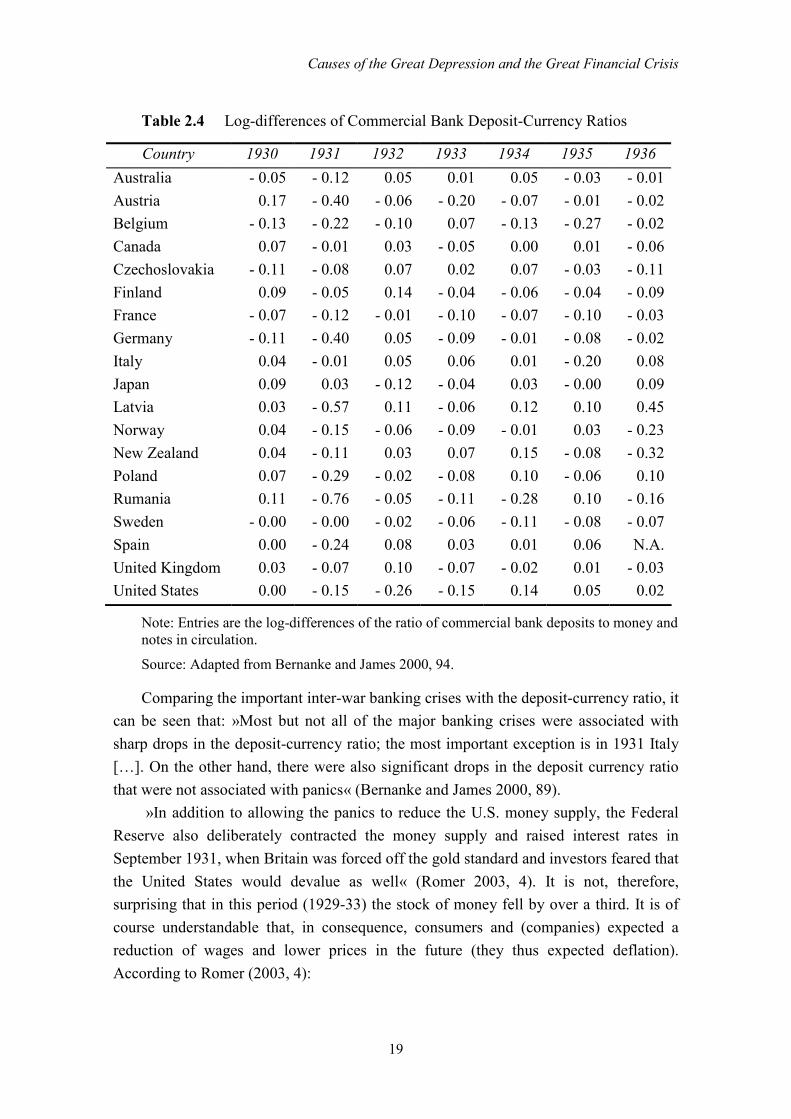
Friedman and Schwartz (1963), is the deposit-currency ratio.
Table 2.4 shows data on changes in the commercial bank deposit-currency ratio for
various countries.
24 See Friedman and Schwartz, Bernanke, Romer. 25 Cyclical trough: the stage of the cycle that marks the end of a period of declining activity
and the transition to expansion.
Causes of the Great Depression and the Great Financial Crisis
19
Table 2.4 Log-differences of Commercial Bank Deposit-Currency Ratios
Country 1930 1931 1932 1933 1934 1935 1936
Australia - 0.05 - 0.12 0.05 0.01 0.05 - 0.03 - 0.01
Austria 0.17 - 0.40 - 0.06 - 0.20 - 0.07 - 0.01 - 0.02
Belgium - 0.13 - 0.22 - 0.10 0.07 - 0.13 - 0.27 - 0.02
Canada 0.07 - 0.01 0.03 - 0.05 0.00 0.01 - 0.06
Czechoslovakia - 0.11 - 0.08 0.07 0.02 0.07 - 0.03 - 0.11
Finland 0.09 - 0.05 0.14 - 0.04 - 0.06 - 0.04 - 0.09
France - 0.07 - 0.12 - 0.01 - 0.10 - 0.07 - 0.10 - 0.03
Germany - 0.11 - 0.40 0.05 - 0.09 - 0.01 - 0.08 - 0.02
Italy 0.04 - 0.01 0.05 0.06 0.01 - 0.20 0.08
Japan 0.09 0.03 - 0.12 - 0.04 0.03 - 0.00 0.09
Latvia 0.03 - 0.57 0.11 - 0.06 0.12 0.10 0.45
Norway 0.04 - 0.15 - 0.06 - 0.09 - 0.01 0.03 - 0.23
New Zealand 0.04 - 0.11 0.03 0.07 0.15 - 0.08 - 0.32
Poland 0.07 - 0.29 - 0.02 - 0.08 0.10 - 0.06 0.10
Rumania 0.11 - 0.76 - 0.05 - 0.11 - 0.28 0.10 - 0.16
Sweden - 0.00 - 0.00 - 0.02 - 0.06 - 0.11 - 0.08 - 0.07
Spain 0.00 - 0.24 0.08 0.03 0.01 0.06 N.A.
United Kingdom 0.03 - 0.07 0.10 - 0.07 - 0.02 0.01 - 0.03
United States 0.00 - 0.15 - 0.26 - 0.15 0.14 0.05 0.02
Note: Entries are the log-differences of the ratio of commercial bank deposits to money and notes in circulation.
Source: Adapted from Bernanke and James 2000, 94.
Comparing the important inter-war banking crises with the deposit-currency ratio, it
can be seen that: »Most but not all of the major banking crises were associated with
sharp drops in the deposit-currency ratio; the most important exception is in 1931 Italy
[…]. On the other hand, there were also significant drops in the deposit currency ratio
that were not associated with panics« (Bernanke and James 2000, 89).
»In addition to allowing the panics to reduce the U.S. money supply, the Federal
Reserve also deliberately contracted the money supply and raised interest rates in
September 1931, when Britain was forced off the gold standard and investors feared that
the United States would devalue as well« (Romer 2003, 4). It is not, therefore,
surprising that in this period (1929-33) the stock of money fell by over a third. It is of
course understandable that, in consequence, consumers and (companies) expected a
reduction of wages and lower prices in the future (they thus expected deflation).
According to Romer (2003, 4):

Causes of the Great Depression and the Great Financial Crisis
20
As a result, even though nominal interest rates were very low, people did not want to
borrow because they feared that future wages and profits would be inadequate to cover the
loan payments. This hesitancy, in turn, led to severe reductions in both consumer spending
and business investment spending. The panics certainly exacerbated the decline in spending
by generating pessimism and a loss of confidence. Furthermore, the failure of so many
banks disrupted lending, thereby reducing the funds available to finance investment.
More broadly, the risks that frighten lenders frighten borrowers, too.
2.4 The Gold Standard
Before turning to the gold standard puzzle, it is necessary to underscore two things.
First, there is a flexible-exchange-rate system (or floating-exchange-rate system) and a
fixed-exchange-rate system. In the former, exchange rates are not officially fixed but are
determined by conditions of supply and demand in the foreign exchange market. In the
latter, exchange rates are set at officially determined levels. Second, maintaining the
value of currency in terms of gold by agreeing to buy or sell gold in exchange for
currency at a fixed rate of exchange is called the gold standard (or “gold exchange”
standard). The gold standard is therefore a fixed-exchange-rate system. Turning to the
gold standard puzzle, the question is: was a mismanaged interwar gold standard
responsible for the worldwide deflation in the 1930s? In other words: Did the
mismanaged interwar gold standard cause deflation? Deflation was inter alia an
important cause of banking panics in the 1930s26 and, consequently, “debt deflation”27
effected the financial sector.
According to Bernanke and James: »Recent research on the causes of the Great
Depression has laid much of the blame for that catastrophe on the doorstep of the
international gold standard« (2000, 70).
»Temin (1989) argues that structural flaws of the interwar gold standard, in
conjunction with policy responses dictated by the gold standards “rules of the game,”
made an international monetary contraction and deflation almost inevitable« (Ibid., 70).
Some (Eichengreen and Sachs) have argued, or have presented evidence, that »countries
which abandoned the gold standard and the associated contractionary monetary policies
recovered from the Depression more quickly than countries that remained on gold«
(Ibid., 70).
26 »Falling prices lowered the nominal value of bank assets but not the nominal value of
bank liabilities« (Bernanke and James 2000, 93). 27 »By increasing the real value of nominal debts and promoting insolvency of borrowers,
deflation creates an environment of financial distress in which the incentives of borrowers are distorted and in which it is difficult to extend new credit« (Bernanke and James 2000, 71). In other words: »The increase in the real value of nominal debt obligations was brought about by falling prices« (Ibid., 89).
Causes of the Great Depression and the Great Financial Crisis
21
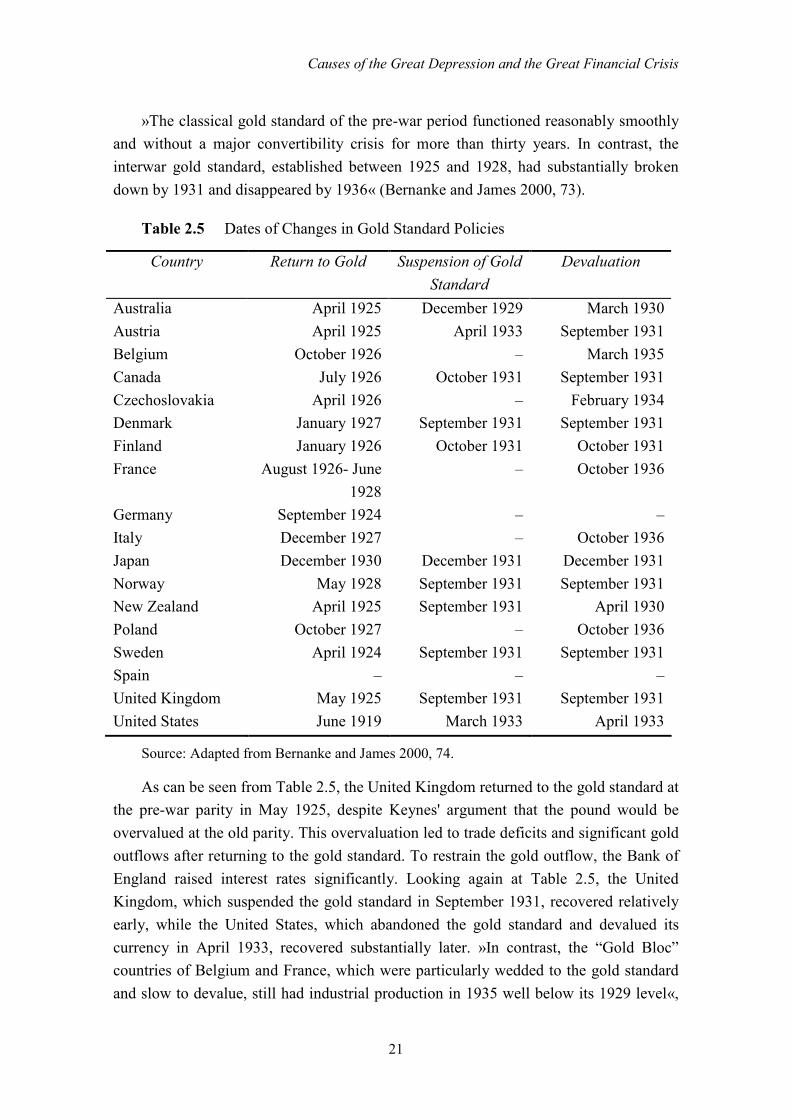
»The classical gold standard of the pre-war period functioned reasonably smoothly
and without a major convertibility crisis for more than thirty years. In contrast, the
interwar gold standard, established between 1925 and 1928, had substantially broken
down by 1931 and disappeared by 1936« (Bernanke and James 2000, 73).
Table 2.5 Dates of Changes in Gold Standard Policies
Country Return to Gold Suspension of Gold
Standard
Devaluation
Australia April 1925 December 1929 March 1930
Austria April 1925 April 1933 September 1931
Belgium October 1926 – March 1935
Canada July 1926 October 1931 September 1931
Czechoslovakia April 1926 – February 1934
Denmark January 1927 September 1931 September 1931
Finland January 1926 October 1931 October 1931
France August 1926- June
1928
– October 1936
Germany September 1924 – –
Italy December 1927 – October 1936
Japan December 1930 December 1931 December 1931
Norway May 1928 September 1931 September 1931
New Zealand April 1925 September 1931 April 1930
Poland October 1927 – October 1936
Sweden April 1924 September 1931 September 1931
Spain – – –
United Kingdom May 1925 September 1931 September 1931
United States June 1919 March 1933 April 1933
Source: Adapted from Bernanke and James 2000, 74.
As can be seen from Table 2.5, the United Kingdom returned to the gold standard at
the pre-war parity in May 1925, despite Keynes' argument that the pound would be
overvalued at the old parity. This overvaluation led to trade deficits and significant gold
outflows after returning to the gold standard. To restrain the gold outflow, the Bank of
England raised interest rates significantly. Looking again at Table 2.5, the United
Kingdom, which suspended the gold standard in September 1931, recovered relatively
early, while the United States, which abandoned the gold standard and devalued its
currency in April 1933, recovered substantially later. »In contrast, the “Gold Bloc”
countries of Belgium and France, which were particularly wedded to the gold standard
and slow to devalue, still had industrial production in 1935 well below its 1929 level«,

Causes of the Great Depression and the Great Financial Crisis
22
stated Romer (2003, 6). It is time to recognize that there is a notable connection – as
shown by Eichengreen and Sachs (1985) – between abandoning the gold standard and
recovery from the Depression (thus, a connection between the time countries abandoned
the gold standard and a growth in their output).
The technical problems of the interwar gold standard included the following three
(summarized from Bernanke and James 2000, 74-76): (1) Asymmetry between surplus
and deficit countries in the required monetary response to gold flows. As mentioned
above, Temin suggests, correctly it is believed, that this was the most important
structural flaw of the gold standard. In theory, under the “rules of the game”, central
banks of countries experiencing gold inflows were supposed to assist the price-specific
flow mechanism by expanding domestic money supplies and inflating, while deficit
countries were supposed to reduce money supplies and deflate. In practice, the need to
avoid a complete loss of reserves and an end to convertibility forced deficit countries to
comply with this rule but, in contrast, no sanction prevented surplus countries from
sterilizing gold inflows and accumulating reserves indefinitely, if domestic objectives
made that desirable, so there was a potential deflationary bias in the gold standard's
operation. (2) The pyramiding of reserves. Under the interwar gold-exchange standard,
countries other than those with reserve currencies were encouraged to hold convertible
exchange reserves as a partial substitute for gold. However, these convertible reserves
were in turn usually fraction-backed by gold. So, just as a shift by the public from
fraction-backed deposits to currency would lower the total domestic supply, the gold-
exchange system opened up the possibility that a shift of central banks from foreign
exchange reserves to gold might lower the world money supply, adding another
deflationary bias to the system. (3) Insufficient powers of central banks. An important
institutional feature of the interwar gold standard was that, for the majority of the
important continental European central banks, open market operations were not
permitted or were severely restricted. This forced the central banks to rely on a discount
policy (the terms at which they would make loans to commercial banks) as the principal
means of affecting the domestic money supply. However, in a number of countries,
banks borrowed very infrequently from the central banks, implying that, except in a
crisis period, the central bank's control over the money supply might be quite weak.
»Given both the fundamental economic problems of the international economy and
the structural flaws of the gold standard system, even a relatively minor deflationary
impulse might have had significant repercussions« (Bernanke and James 2000, 77).
According to Bernanke and James (also Hamilton 1987): »As it happened, both of the
two major gold surplus countries, France and the U.S., who at the time together held
close to 60% of the world's monetary gold – took deflationary paths in 1928-29« (Ibid.,
77). »Once the deflationary process had begun, central banks engaged in competitive
deflation and a scramble for gold, hoping by raising cover ratios to protect their
Causes of the Great Depression and the Great Financial Crisis
23
currencies against speculative attack« (Bernanke and James 2000, 78). »Attempts by
any individual central bank to deflate were met by immediate gold outflows, which
forced the central bank to raise its discount rate and deflate again« (Ibid., 78).
What precisely were the channels linking deflation (falling prices) and depression
(falling output)? Bernanke and James emphasized three channels (summarized from
Bernanke and James 2000, 84-89): (1) Real wages. If wages possess some degree of
nominal rigidity, then falling output prices will raise real wages and lower labour
demand. Downward stickiness of wages (or of other input costs) will also lower
profitability, potentially reducing investment.28 (2) Real interest rates. In a standard IS-
LM model, a monetary contraction depresses output by shifting the LM curve leftwards,
raising real interest rates and thus reducing spending. However, as Temin (1976)
pointed out in his original critique of Friedman and Schwartz, it is real rather than
nominal monetary balances that affect the LM curve; and since prices were falling
sharply, real money balances fell little or even rose during the contraction. (3) Financial
crisis, the third mechanism by which deflation can induce depression. The source of the
non-neutrality is simply that dept instruments (including deposits) are typically set in
monetary terms. Deflation thus weakens the financial positions of borrowers, both non-
financial firms and intermediaries.29 »Although the problems of the banks were perhaps
the more dramatic in the Depression, the same type of non-neutrality potentially affects
non-financial firms and other borrowers. The process of “debt deflation,” erodes the net
worth position of borrowers« (Bernanke and James 2000, 88). As a result, »the
“financial distress” (such as that induced by debt deflation) can in principle impose
deadweight losses on an economy, even if firms do not undergo liquidation« (Ibid., 89).
Some have argued that deflation in the United States made American goods
particularly desirable to foreigners, while low income reduced American demand for
foreign products. As consequence, the U.S. economy began to contract severely and the
tendency for gold to flow out of other countries and toward the United States intensified
(summarized from Romer 2003, 5). According to Romer: »To counteract the resulting
tendency toward an American trade surplus and foreign gold outflows, central banks
throughout the world raised interest rates. Maintaining the international gold standard,
in essence, required a massive monetary contraction throughout the world to match the
one occurring in the United States« (2003, 5). »The result was a decline in output and
28 Looked at from another point of view: »In the Great Depression, wages fell by about one
third. How can anyone say that wages are rigid when they are falling, and by that amount? The problem that Keynes recognized was that wages can be too flexibe. Indeed, when wages fall, people’s income falls as well« (Stiglitz 2009, 14).
29 »Deflation and adherence to the gold standard were necessary conditions for banking panics, they were not sufficient; a number of countries made it through the interwar period without significant bank runs or failures, despite being subject to deflatonary shocks similar to those experienced by the countries with banking problems« (Bernanke and James 2000, 94).

Causes of the Great Depression and the Great Financial Crisis
24
prices in countries throughout the world that also nearly matched the downturn in the
United States«, Romer wrote (Ibid., 5).
In summary, »data […] support the view that there was a strong link between
adherence to the gold standard and the severity of both deflation and depression«
(Bernanke and James 2000, 84).30
2.5 The 1937 Recession
»Production and prices, which had been rising evenly in 1934 and 1935, turned
sharply upward in the second half of 1936« (Kindleberger 1987, 261). Industrial
common stocks – see Table 2.2 – rose from 114 in January 1936 to 154 in March 1937.
Monetary expansion began in the US in early 1933. »The American money supply
increased nearly 42 percent between 1933 and 1937. This monetary expansion stemmed
largely from a substantial gold inflow to the United States, caused in part by the rising
political tensions in Europe that eventually led to World War II« (Romer 2003, 6). Gold
thus continued to move to the United States. »In the autumn of 1936, the gold flow to
the U.S. represented a movement of European money into American securities«
(Kindleberger 1987, 266). »In December 1936, the Treasury undertook a program of
gold sterilization to prevent further inflows of gold from adding to excess reserves,
which had reached 50 percent of the total« (Kindleberger 1987, 264). According to
Kindleberger, »the evident burden of gold imports into Britain and the United States
gave rise to concern that the price of gold might be reduced; this led to more
dishoarding« (Ibid., 265). Kindleberger goes on: »At the height of the gold scare in
April 1937, gold arbitrageurs were so certain of a cut in price that they were unwilling
to risk their money for the five days it took, on average, to complete the transaction of
buying in London and selling in New York« (Ibid., 265).31
It then happened again; the market had moved sideways from March to August
1937 but in August it started downwards. As Kindleberber noted, »in September trading
increased and prices fell precipitously« (1987, 270). Kindleberger also noted that »from
141 on August 25, the Standard Statistics industrial index (based on 1926 as 100) went
to 125 in two weeks. By the end of the month it was 30 percent below the March highs«
(Ibid., 270). The stock market declined still further, Kindleberger emphasized »with a
Black Tuesday on October 19, bringing the industrial share average to 102« (Ibid., 270).
»Commodity prices fell sharply, as did industrial production. The Federal Reserve index
of industrial production slipped from 116 of the 1923-25 average in the first eight
months to August, to 106 in September, 99 in October, 86 in November and 83 in
30 Covered in more detail in Bernanke and James 2000, 70-107. 31 »President Roosevelt stated on April 9, 1937 that the U.S. had no plans to reduce the
price of gold. This failed to calm the market« (Kindleberger 1987, 267).
Causes of the Great Depression and the Great Financial Crisis
25
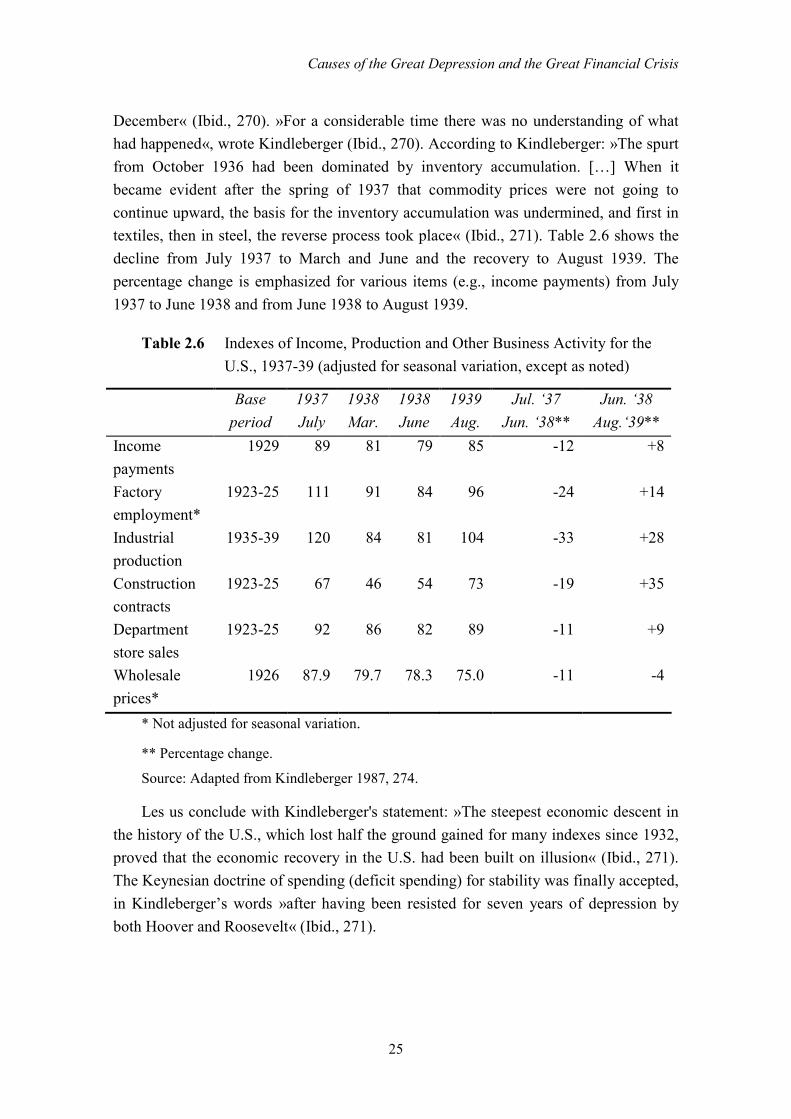
December« (Ibid., 270). »For a considerable time there was no understanding of what
had happened«, wrote Kindleberger (Ibid., 270). According to Kindleberger: »The spurt
from October 1936 had been dominated by inventory accumulation. […] When it
became evident after the spring of 1937 that commodity prices were not going to
continue upward, the basis for the inventory accumulation was undermined, and first in
textiles, then in steel, the reverse process took place« (Ibid., 271). Table 2.6 shows the
decline from July 1937 to March and June and the recovery to August 1939. The
percentage change is emphasized for various items (e.g., income payments) from July
1937 to June 1938 and from June 1938 to August 1939.
Table 2.6 Indexes of Income, Production and Other Business Activity for the
U.S., 1937-39 (adjusted for seasonal variation, except as noted)
Base
period
1937
July
1938
Mar.
1938
June
1939
Aug.
Jul. ‘37
Jun. ‘38**
Jun. ‘38
Aug.‘39**
Income
payments
1929 89 81 79 85 -12 +8
Factory
employment*
1923-25 111 91 84 96 -24 +14
Industrial
production
1935-39 120 84 81 104 -33 +28
Construction
contracts
1923-25 67 46 54 73 -19 +35
Department
store sales
1923-25 92 86 82 89 -11 +9
Wholesale
prices*
1926 87.9 79.7 78.3 75.0 -11 -4
* Not adjusted for seasonal variation.
** Percentage change.
Source: Adapted from Kindleberger 1987, 274.
Les us conclude with Kindleberger's statement: »The steepest economic descent in
the history of the U.S., which lost half the ground gained for many indexes since 1932,
proved that the economic recovery in the U.S. had been built on illusion« (Ibid., 271).
The Keynesian doctrine of spending (deficit spending) for stability was finally accepted,
in Kindleberger’s words »after having been resisted for seven years of depression by
both Hoover and Roosevelt« (Ibid., 271).


27
3 GREAT FINANCIAL CRISIS
The Great Financial Crisis, also called the subprime mortgage crisis, according to
Shiller is »the name for what is a historic turning point in our economy and our culture«
(2008, 1). Although many economists said (believed) that the problem of preventing a
recession is solved and that the problem of the economic cycle is therefore solved,
demand disruption appeared for the first time since the Great Depression.32 Regrettably,
depression economics has returned.33 Many economists believe that macroeconomics
began as a response to the Great Depression (for example Bernanke, Lucas). Now,
much the same can be said after the outbreak of the Great Financial Crisis:
macroeconomics has changed; a lot of views have changed.34
The financial crisis was triggered in the first quarter of 2006, when the housing
market in the U.S. turned downwards. The financial turmoil was provoked by the rising
numbers of defaults on subprime mortgages, a type of mortgage used by borrowers with
low credit ratings. When, in 2007, two Bear Stearns hedge funds collapsed and in
August BNP Paribas suspended redemptions, the financial crisis became systemic.
Despite numerous attempts by different governments to halt its progress, the crisis
spread across various countries and caused panic.35 What, though, was the chain of
events in the Great Financial Crisis?
3.1 Housing Bubble
The prevailing view is that the housing bubble was a fundamental cause of the sub-
prime crisis.36 For nearly a decade, house prices in the U.S. had risen and there was a
common belief that prices could only continue upwards. »This perception established an
atmosphere that invited lenders and financial institutions to loosen their standards and
risk default« (Shiller 2008, 29). Consumers, too, were willing to take part in this process
and to play this game. General enthusiasm and optimism was present on the market.
Then the unthinkable happened. Real-estate prices began to fall, defaults began to
increase, people began to lose their homes and panic spread. Why did the housing
bubble happen? Some scholars argue that the onset of the housing bubble must be
sought in 2000. In other words: the onset of the housing bubble was largely created with
the response of the Fed to the stock market implosion in 2000. According to Foster and
Magdoff (2009, 50):
32 For more see Krugman 2009, 20-38. 33 For more see Krugman 2009, 182. 34 The current status of economic science is covered in more detail in Štiblar 2009, 47-90. 35 More about the crisis in Slovenia in Štiblar 2008, Svetovna kriza in Slovenci: kako jo
preživeti? 36 See Shiller 2008, 29; Acharya et al. 2009, 12; and Foster and Magdoff 2009, 27-38.

Causes of the Great Depression and the Great Financial Crisis
28
When the Fed reduced interest rates to historically low levels to keep the economy
from falling into a deep recession, households increased borrowing on homes, cars and
credit cards. […] As new people participated in the housing boom homes sold at
increasingly inflated prices to those with low credit ratings. This had the effect of shifting
the stock price bubble to a bubble of home prices. This stimulated the economy, with
investment in private housing increasing to 36 percent of total private investment in 2005 –
a level not seen since 1958 during the great suburban housing boom resulting from the
second wave of automobilization.
Figure 3.1 shows the federal funds effective rate, bank prime loan and 1-year
adjustable rate mortgage average
Figure 3.1 U.S Federal Funds Effective Rate, Bank Prime Loan and 1-year
Adjustable Rate Mortgage Average
Bank Prime Loan
Federal Funds Effective Rate
1-Year Adjustable Rate Mortgage Average
0,00
1,00
2,00
3,00
4,00
5,00
6,00
7,00
8,00
9,00
10,00
1991 1992 1993 1994 1995 1996 1997 1998 1999 2000 2001 2002 2003 2004 2005 2006 2007 2008 2009
Inte
rest
Rat
e
Source: Data from Federal Reserve Statistical Release, Selected Interest Rates (http://www.federalreserve.gov/releases/h15/data.htm) and the Federal Reserve Bank of St. Louis, Economic Research (http://research.stlouisfed.org/fred2/).
As noted above, in order to prevent a deep recession, in early 2000 the Fed reduced
interest rates. The federal funds effective rate fell by nearly five percentage points from
2000 to 2004. On the other hand, as is evident from Figure 3.1, the federal funds
effective rate rose from 1.35 percent in 2004 to 5.02 percent in 2007 and then began to
fall. The 1-year adjustable rate mortgage average fell from 6.93 percent in 2000 to 3.2
percent in 2003 and then rose to 5.51 percent in 2007. Rising interest rates additionally
increased the cost of mortgages, as holders of adjustable rate mortgages found
themselves faced with higher payments. In other words: rising interest rates before the
outbreak of the crisis caused an increase in annuities and this in consequence caused
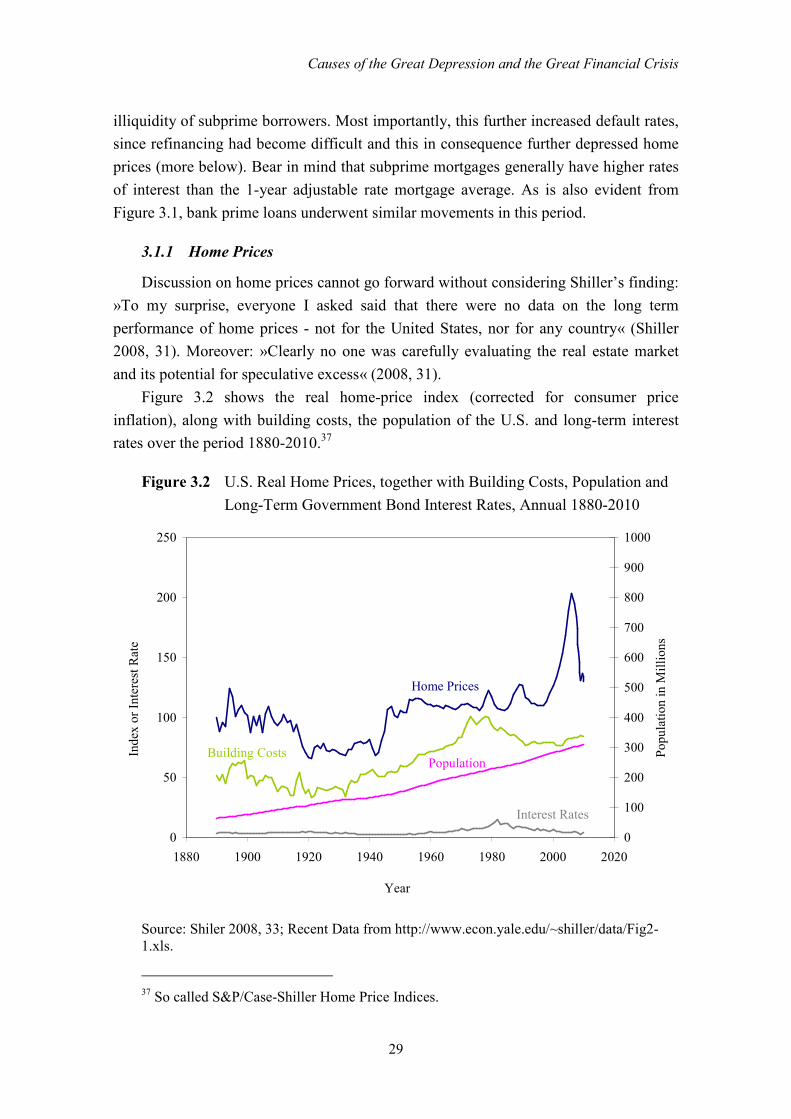
Causes of the Great Depression and the Great Financial Crisis
29
illiquidity of subprime borrowers. Most importantly, this further increased default rates,
since refinancing had become difficult and this in consequence further depressed home
prices (more below). Bear in mind that subprime mortgages generally have higher rates
of interest than the 1-year adjustable rate mortgage average. As is also evident from
Figure 3.1, bank prime loans underwent similar movements in this period.
3.1.1 Home Prices
Discussion on home prices cannot go forward without considering Shiller’s finding:
»To my surprise, everyone I asked said that there were no data on the long term
performance of home prices - not for the United States, nor for any country« (Shiller
2008, 31). Moreover: »Clearly no one was carefully evaluating the real estate market
and its potential for speculative excess« (2008, 31).
Figure 3.2 shows the real home-price index (corrected for consumer price
inflation), along with building costs, the population of the U.S. and long-term interest
rates over the period 1880-2010.37
Figure 3.2 U.S. Real Home Prices, together with Building Costs, Population and
Long-Term Government Bond Interest Rates, Annual 1880-2010
0
50
100
150
200
250
1880 1900 1920 1940 1960 1980 2000 2020
Year
Inde
x or
Int
eres
t Rat
e
0
100
200
300
400
500
600
700
800
900
1000
Pop
ulat
ion
in M
illi
ons
Home Prices
Building CostsPopulation
Interest Rates
Source: Shiler 2008, 33; Recent Data from http://www.econ.yale.edu/~shiller/data/Fig2-1.xls.
37 So called S&P/Case-Shiller Home Price Indices.

Causes of the Great Depression and the Great Financial Crisis
30
Figure 3.2 shows that real-home prices rose moderately until 2000. From 2000
onwards, prices began to rise rapidly (a boom occurred) until the downturn in 2006.
»Real home prices for the U.S. as a whole increased 85 percent between 1997 and the
peak in 2006« (Shiller 2008, 32). Why did prices rise so much in this period, thus
causing a housing bubble, considering that there were no fundamental changes in the
costs of building real-estate, changes of population or long-term interest rates?38
According to Shiller, »social contagion of boom thinking, mediated by the common
observation of rapidly rising prices, was the most important single element in the
housing bubble« (2008, 41). »Speculative price increases encourage genuine economic
optimism, hence more spending, hence greater economic growth, hence yet more
optimism, hence further bidding up of prices« (Shiller 2008, 46).
3.1.2 Consumer Debt
»It is an inescapable truth of the capitalist economy that the uneven, class based
distribution of income is a determining factor of consumption and investment« (Foster
and Magdoff 2009, 27). In the past, or in the previous decade, real wages in the U.S.
stagnated, with the exception of a small increase in the late 1990s. In the period of
2004Q4-2005Q4 real wages even decreased by 0.8%.39 In the light of this, consumption
could be expected to decrease. However, Foster and Magdoff found that in the period
from 1994-2004, consumption increased faster than national income. These two authors
continue to question how to explain this paradox: »declining real wages and soaring
consumption« (Ibid., 28)? Consumers lived beyond their income capacities and financed
their consumption with credit.
Table 3.1 shows the ratio of outstanding consumer debt to consumer disposable
income.
38 For more see Shiller 2008, 39-68. 39 More on this subject in Foster and Magdoff 2009, 28

Causes of the Great Depression and the Great Financial Crisis
31
Table 3.1 Outstanding Consumer Debt as a Percentage of Disposable Income (in
billions of dollars)
Year Consumer Debt Consumer
Disposable Income
Debt as % of
Disposable Income
1975 736.3 1187.4 62.0
1980 1397.1 2009.0 69.5
1985 2272.5 3109.3 73.0
1990 3592.9 4285.8 83.8
1995 4858.1 5408.2 89.8
2000 6960.6 7194.0 96.8
2005 11496.6 9039.5 127.2
2006 12892.7 9915.7 130.0
2007 13754.0 10403.1 132.2
2008 13795.9 10806.4 127.7
Note: Disposable income after tax.
Source: Data from Foster and Magdoff 2009, 29 and the Board of Governors of the Federal Reserve System, Flow of Funds Accounts of the United States, Historical Series and Annual Flows and Outstandings, Third Quater 2009 (December 10, 2009).
Looking at Table 3.1, it is quite clear that the ratio of outstanding consumer debt to
consumer disposable income more than doubled in the period from 1975 to 2006. In
1975, the ratio of outstanding consumer debt to consumer disposable income was 62.0
percent, in 2006 already more than 130.0 percent. In the period from 2007-08, the ratio
of outstanding consumer debt to consumer disposable income declined by less than 5
percent.
What guided (drove) consumers into such indebtedness?40 It is probably that they
wished by such behaviour to improve their standard of living. The conviction that
housing prices would continue to grow in the future probably encouraged many
consumers to try and increase their assets by speculative buying and selling (more about
speculation below).41
We must now examine for what consumers took loans and incurred debts.
Consumers incurred debts for real-estate, despite the fact that real-estate prices
constantly increased. This is clearly shown in the home ownership rate. The home
ownership index increased steeply in this period and reached its maximum value of 68.9
40 By lenders and financial institutions the answer is: profit. 41 Also called flipping.
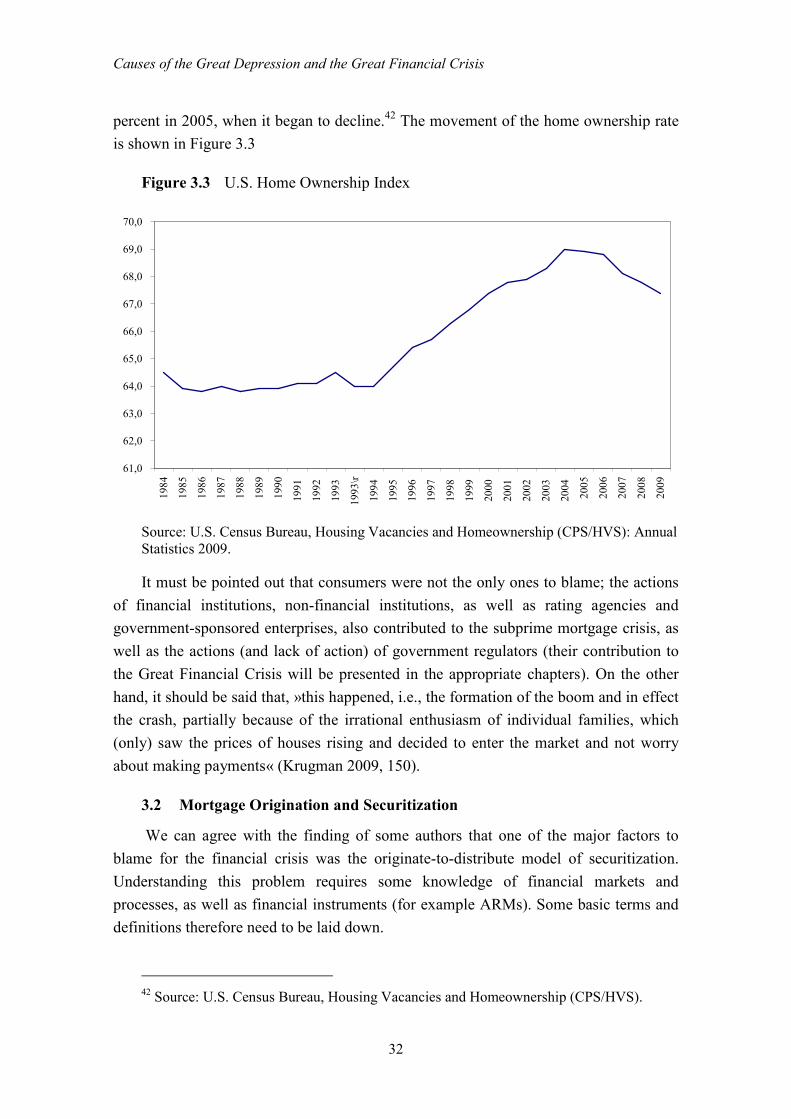
Causes of the Great Depression and the Great Financial Crisis
32
percent in 2005, when it began to decline.42 The movement of the home ownership rate
is shown in Figure 3.3
Figure 3.3 U.S. Home Ownership Index
61,0
62,0
63,0
64,0
65,0
66,0
67,0
68,0
69,0
70,0
1984
1985
1986
1987
1988
1989
1990
1991
1992
1993
1993
\r
1994
1995
1996
1997
1998
1999
2000
2001
2002
2003
2004
2005
2006
2007
2008
2009
Source: U.S. Census Bureau, Housing Vacancies and Homeownership (CPS/HVS): Annual Statistics 2009.
It must be pointed out that consumers were not the only ones to blame; the actions
of financial institutions, non-financial institutions, as well as rating agencies and
government-sponsored enterprises, also contributed to the subprime mortgage crisis, as
well as the actions (and lack of action) of government regulators (their contribution to
the Great Financial Crisis will be presented in the appropriate chapters). On the other
hand, it should be said that, »this happened, i.e., the formation of the boom and in effect
the crash, partially because of the irrational enthusiasm of individual families, which
(only) saw the prices of houses rising and decided to enter the market and not worry
about making payments« (Krugman 2009, 150).
3.2 Mortgage Origination and Securitization
We can agree with the finding of some authors that one of the major factors to
blame for the financial crisis was the originate-to-distribute model of securitization.
Understanding this problem requires some knowledge of financial markets and
processes, as well as financial instruments (for example ARMs). Some basic terms and
definitions therefore need to be laid down.
42 Source: U.S. Census Bureau, Housing Vacancies and Homeownership (CPS/HVS).
Causes of the Great Depression and the Great Financial Crisis
33
»The mortgage market is a collection of markets, which includes a primary (or
origination) market and a secondary market where mortgages trade« (Fabozzi et al.
2002, 422). »By definition, a mortgage is a pledge of property to secure payment of a
debt. Typically, property refers to real estate, which is often in the form of a house; the
debt is the loan given to the buyer of the house by the lender« (Ibid., 423). According to
Fabozzi, »the original lender is called the mortgage originator« (Ibid., 423). The term
securitization can be used in two ways, in broader and narrow senses. In the narrow
sense, asset securitization, the term securitization is used to describe the process of
pooling loans and issuing securities backed by these loans.43
3.2.1 The Mortgage Origination Process
Anyone who wants to borrow funds to purchase a home will apply for a loan from a
mortgage originator. The potential homeowner completes an application form, which
provides financial information about the applicant, and pays an application fee; the
mortgage originator then performs a credit evaluation of the applicant. The two primary
factors in determining whether or not the funds will be lent are (1) the payment-to-
income (PTI) ratio,44 and (2) the loan-to-value (LTV) ratio.45 If the lender decides to
lend the funds, it sends a letter of commitment to the applicant. At the time the
application is submitted, the mortgage originator will give the applicant a choice of
various types of mortgages (summarized from Fabozzi et al. 424-425).
Mortgage originators can either (1) hold the mortgage in their portfolio; (2) sell the
mortgage to an investor that wishes to hold the mortgage in its portfolio or that will
place the mortgage in a pool of mortgages to be used as collateral for the issuance of a
security; or (3) use the mortgages themselves as collateral for the issuance of a security.
When a mortgage is used as collateral for the issuance of a security, the mortgage is said
to be securitized. When a mortgage originator intends to sell the mortgage, it will obtain
a commitment from the potential investor. Two federally sponsored agencies and
several private companies buy mortgages. As the agencies and private companies pool
these mortgages and sell them to investors, they are called conduits (summarized from
Fabozzi et al. 424-425).
43 For more see Fabozzi et al. 2002, Chapter 2. 44 »The PTI is the ratio of monthly payments to monthly income, which measures the
ability of the applicant to make monthly payments (both mortgage and real estate tax payments). The lower this ratio, the greater the likelihood that the applicant will be able to meet the required payments« (Fabozzi et al. 2002, 424). 45 »The LTV is the ratio of the amount of the loan to the market (or appraised) value of the property. The lower this ratio, the greater the protection for the lender if the applicant defaults on the payments and the lender must repossess and sell the property« (Ibid., 424).
Causes of the Great Depression and the Great Financial Crisis
34
3.2.2 Mortgage Products (Mortgage Types)
There are three main types of mortgages: »fixed rate mortgages (FMRs), adjustable
rate mortgages (ARMs) and hybrids« (Jaffe et al. 2009, 61 in Acharya et al. 2009).
»With FMRs, the borrower pays interest and repays principal in equal instalments over
an agreed period of time, called the maturity or term of the mortgage« (Fabozzi et al.
2002, 427). »ARMs calls for the resetting of the interest rate periodically, in accordance
with some appropriately chosen index reflecting short-term market rates« (Ibid., 430).
»Hybrids contain both fixed- and adjustable-rate features. Mortgage loans fall into two
categories, prime and non-prime« (Jaffe et al. 2009, 61 in Acharya et al. 2009).
3.2.3 Nonprime Mortgages
There are three main types of non-prime mortgages (summarized from Jaffe et al.
2009, 62 in Acharya et al. 2009): (1) Subprime loans are usually classified in the United
States as those in which the borrower has a credit (FICO) score below a particular level
and rate for which is much higher than that for prime loans; (2) Alt-A loans46 are
considered riskier than prime loans but less risky than subprime loans; (3) A home
equity loan (HEL) or home equity of credit (HELOC) is typically a second-lien loan.
Most subprime mortgages are adjustable-rate mortgages (ARMs) with a variation of
a hybrid structure known as a “2/28”47 or “3/27.” These mortgages are known as
“hybrids.” “Subprime mortgages” compared to “prime mortgages” involve a bigger risk
for the lender. Borrowers can always prepay48 and they can always default.
3.2.4 Securitization
»Securitization in the mortgage market involves the pooling of mortgages into
mortgage-backed securities (MBSs) in which the holder of the securities is entitled to
some fraction of all the interest and principal paid out by the portfolio49 of loans« (Jaffe
et al., 62 in Acharya et al. 2009). »Some of these securities are straight pass-through,
while others are collateralized mortgage obligations (CMOs)50 or collateralized debt
46 »Alt-A loans are loans made to borrowers whose qualifying mortgage characteristics do
not meet the conforming underwriting criteria established by government sponsored enterprises« (Fabozzi et al. 2002, 629).
47 »The “2” represents the number of initial years over which the mortgage rate remains fixed, while the “28” represents the number of years the interest rate paid on the mortgage will be floating« (Gorton 2008, 12).
48 Lenders, sometimes additionally charge a penalty when the borrower prepays any part or all of the outstanding mortgage balance.
49 Portfolio: a group of financial assets or securities. 50 »A mortgage-backed security with multiple bond classes that is backed by one or more
pools of pass-through securities or mortgages« (Fabozzi et al. 2002, 631).
Causes of the Great Depression and the Great Financial Crisis
35
obligations (CDOs), in which the pools are trenched and cash flows get paid out
according to some priority structure« (Ibid., 62).
3.2.5 How Did Mortgage Origination and Securitization Contribute to the
Crisis?
Let us begin with a basic fact: the outbreak of the crisis was (largely) caused by the
“subprime mortgage design” in connection with securitization.
According to Stiglitz (2010, 22-23):
The securitization actually created a series of new problems in information
asymmetries: the mortgages were bought by investment banks, repackaged, with parts sold
off to other investment banks and to pension funds and others; and parts retained on their
own balance sheet. In retrospect, it was clear that not even those creating the products were
fully aware of the risks. But the complexity of the products made it increasingly difficult
for those at each successive stage of the processing and reprocessing to evaluate what was
going on. Securitization poses two further problems. It may make renegotiation more
difficult when problems arise. […] This problem should have been anticipated: it was far
harder to renegotiate the securitized debt in the 1997–8 crisis than to renegotiate the bank
debt in the Latin American debt crisis of the 1980s. The second is that the new securities
that were created were highly nontransparent. Indeed, their complexity may have been one
of the reasons that they were so “successful.”
The decline of the “quality of mortgages” from year to year had an important role
in this respect. In other words: a huge non-prime mortgage origination took place.
Subprime mortgages were designed in such a way that they were extremely sensitive to
the movements of house prices. Similarly Gorton: »The defining feature of the subprime
mortgage is the idea that the borrower and lender can benefit from house price
appreciation over short horizons« (2008, 12). The appreciation of a house’s value can
thus become the basis for refinancing every two or three year. Along with this, it can be
concluded that subprime mortgages (especially the “hybrids” mentioned above) were
designed in such a way that the holders were eventually forced to refinance after two or
three years. The initial monthly payment with hybrids is based on a “teaser” interest rate
that is fixed for the first two years (for 2/28) or three years (for 3/27). After the initial
period, comes the rate “reset” (or step-up date), which is a higher interest rate. The
higher payment for the borrower at the reset date comes from the significantly higher
monthly mortgage payment that occurs at reset. Borrowers, thus, have an incentive to
refinance their mortgage before the reset date (summarized from Gorton 2008, 12-13).
Such a “design” is at root risky. To be concrete: this risk appears when house prices
begin to decline; refinancing of the mortgage is possible only if the house has
appreciated in value. Eventually, this risk – called reality – in the end manifested itself.
House prices began to decline, borrowers could not refinance, defaults and insolvencies
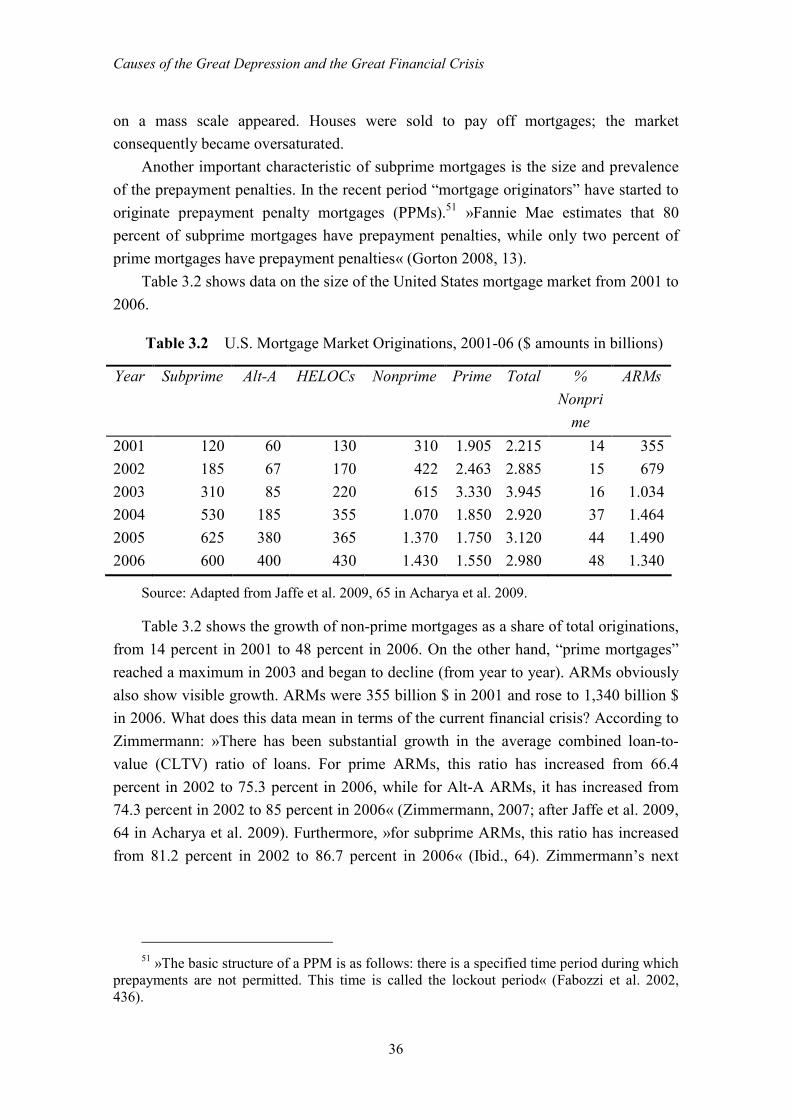
Causes of the Great Depression and the Great Financial Crisis
36
on a mass scale appeared. Houses were sold to pay off mortgages; the market
consequently became oversaturated.
Another important characteristic of subprime mortgages is the size and prevalence
of the prepayment penalties. In the recent period “mortgage originators” have started to
originate prepayment penalty mortgages (PPMs).51 »Fannie Mae estimates that 80
percent of subprime mortgages have prepayment penalties, while only two percent of
prime mortgages have prepayment penalties« (Gorton 2008, 13).
Table 3.2 shows data on the size of the United States mortgage market from 2001 to
2006.
Table 3.2 U.S. Mortgage Market Originations, 2001-06 ($ amounts in billions)
Year Subprime Alt-A HELOCs Nonprime Prime Total %
Nonpri
me
ARMs
2001 120 60 130 310 1.905 2.215 14 355
2002 185 67 170 422 2.463 2.885 15 679
2003 310 85 220 615 3.330 3.945 16 1.034
2004 530 185 355 1.070 1.850 2.920 37 1.464
2005 625 380 365 1.370 1.750 3.120 44 1.490
2006 600 400 430 1.430 1.550 2.980 48 1.340
Source: Adapted from Jaffe et al. 2009, 65 in Acharya et al. 2009.
Table 3.2 shows the growth of non-prime mortgages as a share of total originations,
from 14 percent in 2001 to 48 percent in 2006. On the other hand, “prime mortgages”
reached a maximum in 2003 and began to decline (from year to year). ARMs obviously
also show visible growth. ARMs were 355 billion $ in 2001 and rose to 1,340 billion $
in 2006. What does this data mean in terms of the current financial crisis? According to
Zimmermann: »There has been substantial growth in the average combined loan-to-
value (CLTV) ratio of loans. For prime ARMs, this ratio has increased from 66.4
percent in 2002 to 75.3 percent in 2006, while for Alt-A ARMs, it has increased from
74.3 percent in 2002 to 85 percent in 2006« (Zimmermann, 2007; after Jaffe et al. 2009,
64 in Acharya et al. 2009). Furthermore, »for subprime ARMs, this ratio has increased
from 81.2 percent in 2002 to 86.7 percent in 2006« (Ibid., 64). Zimmermann’s next
51 »The basic structure of a PPM is as follows: there is a specified time period during which
prepayments are not permitted. This time is called the lockout period« (Fabozzi et al. 2002, 436).
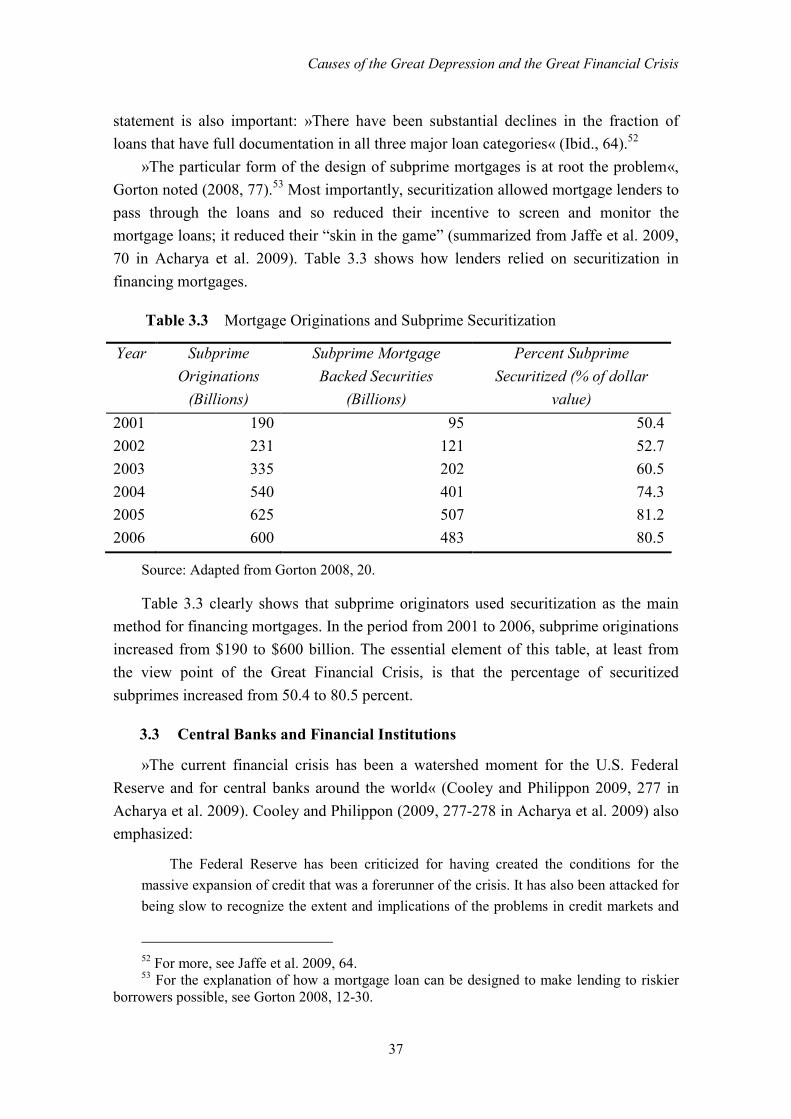
Causes of the Great Depression and the Great Financial Crisis
37
statement is also important: »There have been substantial declines in the fraction of
loans that have full documentation in all three major loan categories« (Ibid., 64).52
»The particular form of the design of subprime mortgages is at root the problem«,
Gorton noted (2008, 77).53 Most importantly, securitization allowed mortgage lenders to
pass through the loans and so reduced their incentive to screen and monitor the
mortgage loans; it reduced their “skin in the game” (summarized from Jaffe et al. 2009,
70 in Acharya et al. 2009). Table 3.3 shows how lenders relied on securitization in
financing mortgages.
Table 3.3 Mortgage Originations and Subprime Securitization
Year Subprime
Originations
(Billions)
Subprime Mortgage
Backed Securities
(Billions)
Percent Subprime
Securitized (% of dollar
value)
2001 190 95 50.4
2002 231 121 52.7
2003 335 202 60.5
2004 540 401 74.3
2005 625 507 81.2
2006 600 483 80.5
Source: Adapted from Gorton 2008, 20.
Table 3.3 clearly shows that subprime originators used securitization as the main
method for financing mortgages. In the period from 2001 to 2006, subprime originations
increased from $190 to $600 billion. The essential element of this table, at least from
the view point of the Great Financial Crisis, is that the percentage of securitized
subprimes increased from 50.4 to 80.5 percent.
3.3 Central Banks and Financial Institutions
»The current financial crisis has been a watershed moment for the U.S. Federal
Reserve and for central banks around the world« (Cooley and Philippon 2009, 277 in
Acharya et al. 2009). Cooley and Philippon (2009, 277-278 in Acharya et al. 2009) also
emphasized:
The Federal Reserve has been criticized for having created the conditions for the
massive expansion of credit that was a forerunner of the crisis. It has also been attacked for
being slow to recognize the extent and implications of the problems in credit markets and
52 For more, see Jaffe et al. 2009, 64. 53 For the explanation of how a mortgage loan can be designed to make lending to riskier
borrowers possible, see Gorton 2008, 12-30.
Causes of the Great Depression and the Great Financial Crisis
38
for being excessively improvisational or inconsistent in its responses to faltering financial
firms. […] In the current crisis, the Fed took its role as lender of the last resort and
expanded it into a systemic-risk lending facility. Hence, the balance sheet of the Fed has
become a powerful and critical tool; it has expanded from $ 900 billion to more than $ 2
trillion at the end of 2008.
Some economists and economic commentators attribute the credit bubble and the
ensuing financial crisis to the Fed’s excessively easy monetary policy in the past
(especially under Greenspan).54
Financial institutions provide services related to one or more of the following
(summarized from Fabozzi et al. 2002, 15): (1) Transforming financial assets acquired
through the market and constituting them into a different, and more widely preferable,
type of asset – which becomes their liability. This is the function performed by financial
intermediaries, the most important type of financial institution. (2) Exchanging financial
assets on behalf of customers. (3) Exchanging financial assets for their own accounts.
(4) Providing investment advice to other market participants. Financial intermediaries
include savings banks, commercial banks, savings and loan associations, credit unions,
investment companies, insurance companies and pension funds.55
At this point, we will try to answer two questions. First, how did the financial
institutions contribute to the crisis? Second, in what way did they do so and still manage
to avoid regulation? There is, of course, the question of why so many financial
institutions took such a great gamble on real estate; this subject will be addressed in the
chapter Moral Hazard.
3.3.1 Banking Sistem and Shadow Banking System
A significant change in the banking system occurred in 1999, when the legislation
was changed, including legislation from the Great Depression (the Glass-Steagall Act,
which created a strict separation between investment banks and commercial banks).56
54 See Roubini, Wachtel and Krugman. 55 Covered in more detail in Fabozzi et al. 2002, Chapters 2, 4, 7 and 9. 56 The importance of the legislative framework – (inter alia) to prevent abuse, bending of
the law (fraus legi facta) and vagueness and also to ensure legal equality, security, predictibility and specificity (lex certa) – can be shown with an example from Roman law: »SC Macedonianum aimed at preventing money borrowers from lending money to sons in power. Yet, by expressly mentioning only money, the Senatus consultum did not achieve its objective. Creditors could easily bypass the law by lending fungible things or even money if lending took place indirectly, e.g. by means of a so called contractus mohatrae« (Kranjc 2008, 1046). As stated concisely by Kranjc: »Modern lawyers (legislators) can benefit from this case since it demonstrates the importance of precise drafting of laws envisaging all possible interpretations and possibilities. Previewing all the (im)possibilities is essential for drafting good legal regulations« (Ibid., 1046).
Causes of the Great Depression and the Great Financial Crisis
39
Commercial banks were hence allowed to encroach on investment banks' territory. This
spurred investment banks to take on even more leverage and risk.
The Great Financial Crisis has been a crisis not only of traditional banks but also of
the shadow banking system. It needs to be highlighted that »a considerable amount of
financial intermediation is now performed by the so-called shadow banking system«
(Richardson 2009, 117 in Acharya et al. 2009). »This shadow banking system includes
investment banks, insurance companies and managed funds, such as hedge funds,
money market funds, structured investment vehicles (SIVs), asset-backed commercial
paper (ABCP) and so forth« (Richardson 2009, 117 in Acharya et al. 2009).
Banks used credit risk transfer mechanisms to get round regulatory requirements.
According to Archarya and Schnabl (2009, 83 in Archarya et al. 2009):
Credit risk transfer mechanisms are supposed to transfer assets off bank balance sheets
onto another investor in the economy but, instead, banks exploited credit transfer
mechanisms for regulatory arbitrage and increased their effective leverage and exposure to
aggregate risk by availing themselves of such mechanisms. In the process, they exposed
themselves to the risk that a significant economy-wide shock would be sufficient rapidly to
wipe out their capital base.
The regulatory arbitrage undertaken by banks took two principal forms (Archarya
and Schnabl 2009, 83 in Acharya et al. 2009):
First, banks set up off-balance-sheet asset-backed commercial paper (ABCP) conduits,
and sister concerns such as structured investment vehicles (SIVs). ABCP conduits held
assets the banks would have otherwise held on their books, and banks provided liquidity
enhancements and credit enhancements to these conduits.57 Second, banks exploited the
fact that they could also get capital relief by simply switching away from loans into
investments in the form of AAA-rated tranches of CDOs and CLOs […]. As a result, about
50 percent of al AAA asset-backed securities remained within the banking system.
»This “shadow” financial institutions borrowed liquid and short-term, leveraged a
lot, and lent and invested in longer-term and illiquid ways, but, unlike banks, did not
have access to the safety nets (deposit insurance) that prevent runs on banks until 2008«
(Richardson 2009, 119-120 in Acharya et al. 2009).
It is for this reason that, in the period 2007- 201058, many banks and bank-like
institutions (shadow banking system) failed and, in consequence, the majority of this
system disappeared. Table 3.4 shows the number of failed banks in individual years.
57 Asset were de iure off-balance-sheet vehicles of such banks. 58 For example: Lehman Brothers, Washington Mutual, Continental Illinois National Bank
and Trust, First Republic Bank, IndyMac, Colonial Bank, Bank of New England, Guaranty Bank, AmTrust Bank, United Commercial Bank, Affinity Bank, Alliance Bank, America West Bank, American Southern Bank, American United Bank, Bank USA, N.A., and so forth.
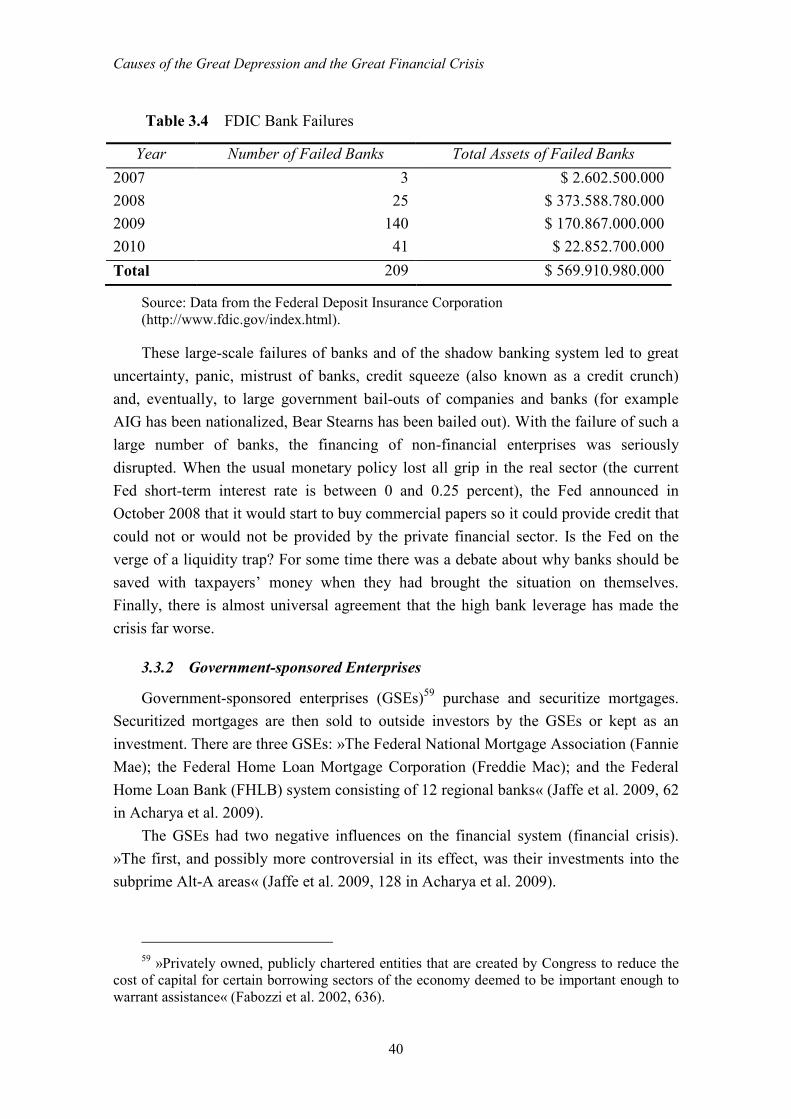
Causes of the Great Depression and the Great Financial Crisis
40
Table 3.4 FDIC Bank Failures
Year Number of Failed Banks Total Assets of Failed Banks
2007 3 $ 2.602.500.000
2008 25 $ 373.588.780.000
2009 140 $ 170.867.000.000
2010 41 $ 22.852.700.000
Total 209 $ 569.910.980.000
Source: Data from the Federal Deposit Insurance Corporation (http://www.fdic.gov/index.html).
These large-scale failures of banks and of the shadow banking system led to great
uncertainty, panic, mistrust of banks, credit squeeze (also known as a credit crunch)
and, eventually, to large government bail-outs of companies and banks (for example
AIG has been nationalized, Bear Stearns has been bailed out). With the failure of such a
large number of banks, the financing of non-financial enterprises was seriously
disrupted. When the usual monetary policy lost all grip in the real sector (the current
Fed short-term interest rate is between 0 and 0.25 percent), the Fed announced in
October 2008 that it would start to buy commercial papers so it could provide credit that
could not or would not be provided by the private financial sector. Is the Fed on the
verge of a liquidity trap? For some time there was a debate about why banks should be
saved with taxpayers’ money when they had brought the situation on themselves.
Finally, there is almost universal agreement that the high bank leverage has made the
crisis far worse.
3.3.2 Government-sponsored Enterprises
Government-sponsored enterprises (GSEs)59 purchase and securitize mortgages.
Securitized mortgages are then sold to outside investors by the GSEs or kept as an
investment. There are three GSEs: »The Federal National Mortgage Association (Fannie
Mae); the Federal Home Loan Mortgage Corporation (Freddie Mac); and the Federal
Home Loan Bank (FHLB) system consisting of 12 regional banks« (Jaffe et al. 2009, 62
in Acharya et al. 2009).
The GSEs had two negative influences on the financial system (financial crisis).
»The first, and possibly more controversial in its effect, was their investments into the
subprime Alt-A areas« (Jaffe et al. 2009, 128 in Acharya et al. 2009).
59 »Privately owned, publicly chartered entities that are created by Congress to reduce the
cost of capital for certain borrowing sectors of the economy deemed to be important enough to warrant assistance« (Fabozzi et al. 2002, 636).
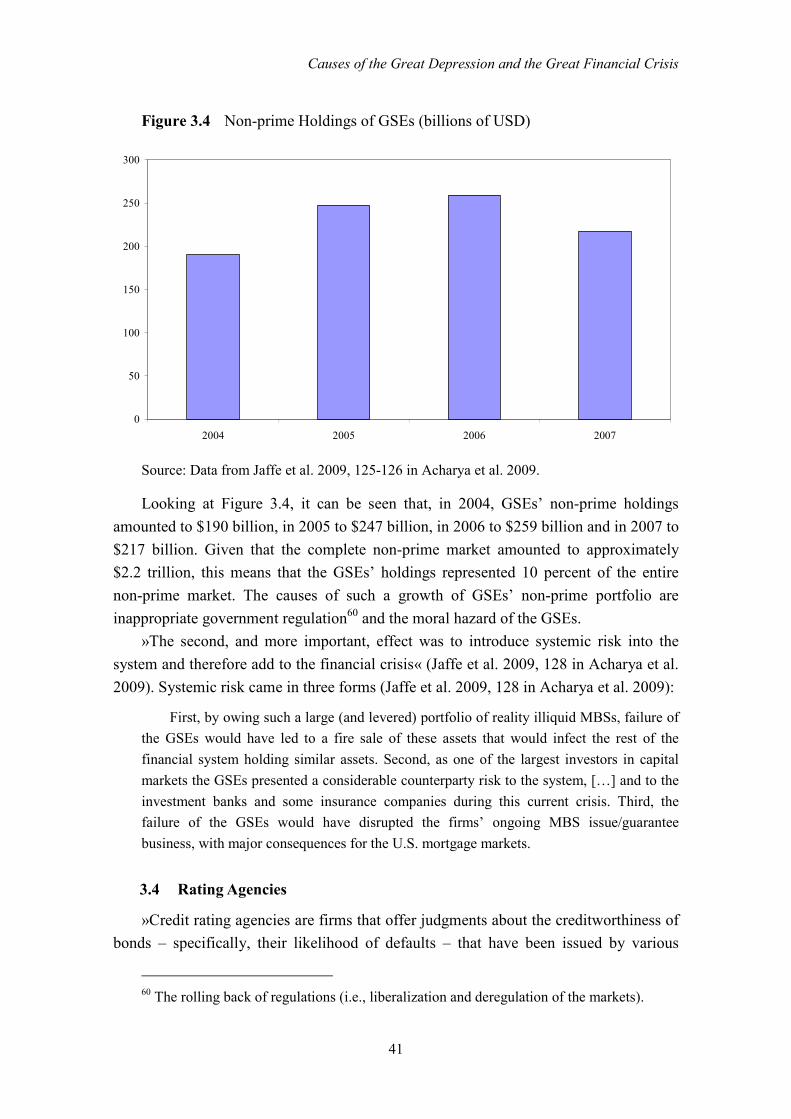
Causes of the Great Depression and the Great Financial Crisis
41
Figure 3.4 Non-prime Holdings of GSEs (billions of USD)
0
50
100
150
200
250
300
2004 2005 2006 2007
Source: Data from Jaffe et al. 2009, 125-126 in Acharya et al. 2009.
Looking at Figure 3.4, it can be seen that, in 2004, GSEs’ non-prime holdings
amounted to $190 billion, in 2005 to $247 billion, in 2006 to $259 billion and in 2007 to
$217 billion. Given that the complete non-prime market amounted to approximately
$2.2 trillion, this means that the GSEs’ holdings represented 10 percent of the entire
non-prime market. The causes of such a growth of GSEs’ non-prime portfolio are
inappropriate government regulation60 and the moral hazard of the GSEs.
»The second, and more important, effect was to introduce systemic risk into the
system and therefore add to the financial crisis« (Jaffe et al. 2009, 128 in Acharya et al.
2009). Systemic risk came in three forms (Jaffe et al. 2009, 128 in Acharya et al. 2009):
First, by owing such a large (and levered) portfolio of reality illiquid MBSs, failure of
the GSEs would have led to a fire sale of these assets that would infect the rest of the
financial system holding similar assets. Second, as one of the largest investors in capital
markets the GSEs presented a considerable counterparty risk to the system, […] and to the
investment banks and some insurance companies during this current crisis. Third, the
failure of the GSEs would have disrupted the firms’ ongoing MBS issue/guarantee
business, with major consequences for the U.S. mortgage markets.
3.4 Rating Agencies
»Credit rating agencies are firms that offer judgments about the creditworthiness of
bonds – specifically, their likelihood of defaults – that have been issued by various
60 The rolling back of regulations (i.e., liberalization and deregulation of the markets).
Causes of the Great Depression and the Great Financial Crisis
42
kinds of entities, such as corporations, governments and (most recently) securitizers of
mortgages and other debt obligations« (Richardson in White 2009, 101 in Acharya et al.
2009). Credit rating judgments come in the form of ratings-scales: AAA, AA, A, BBB,
BB and so forth (also with pluses and minuses).61
The credit rating business is dominated by three agencies - Standard & Poor's,
Moody's Investors Service and Fitch Ratings. The aforementioned agencies have the
official permission (clearance) of the SEC to carry out activities and are appointed as
nationally recognised statistical-rating organisations, or NRSROs.62
According to Richardson and White: »The successful sale of the mortgage-related
debt securities that had subprime residential mortgages and other debt obligations as
their underlying collateral depends crucially on these agencies’ initial ratings on these
securities« (2009, 101 in Acharya et al. 2009).
It should be stated that the credit rating agencies made a major contribution to the
current financial crisis. How?
Difficulties began when the credit rating market converted from the business model
“investor pays” into the business model “issuer pays.” Issuers of complex securities
started to buy, or buying for ratings began, which – in terms of credit transparency – led
to competition to the bottom.
This is supported by the finding of Richardson and White (2009, 104 in Acharya et
al. 2009):
The potential conflict of interest in the “issuer pays” model typically arises whenever
an issuer has alternative NRSROs to which it can turn. Thus, if a bond issuer believes that
rating agency X is going to give its bonds a less favourable rating than will rating agency Y
[...], then the issuer will bring its bond rating business to the latter rating firm; in turn, the
former rating firm will have an incentive to loosen its standards so as to re-attract issuers.
In short, the subprime mortgage crisis escalated to such dimensions, inter alia,
because of this behaviour of the credit rating agencies. »When house prices ceased
rising and began to decline, the initial ratings proved to be excessively optimistic–
especially for the mortgages that were originated in 2005 and 2006 – and the mortgage
bonds collapsed, bringing the rest of the U.S. financial sector crashing down as well«
(Richardson and White 2009, 101 in Acharya et al. 2009). Indeed the rating agencies are
an important cause of the “housing bubble” and, consequently, of the current financial
crisis. It is not therefore surprising that credit rating agencies were the subject of an SEC
61 This scale is used by Standard & Poor’s and some other rating agencies. 62 Other NRSROs are (Annual Report on Nationally Recognized Statistical Rating
Organizations 2009, 8): Egan-Jones Rating Company, A.M. Best Company, Inc., DBRS Ltd., Japan Credit Rating Agency, Ltd., Rating and Investment Information, Inc., LACE Financial Corp., Realpoint LLC.
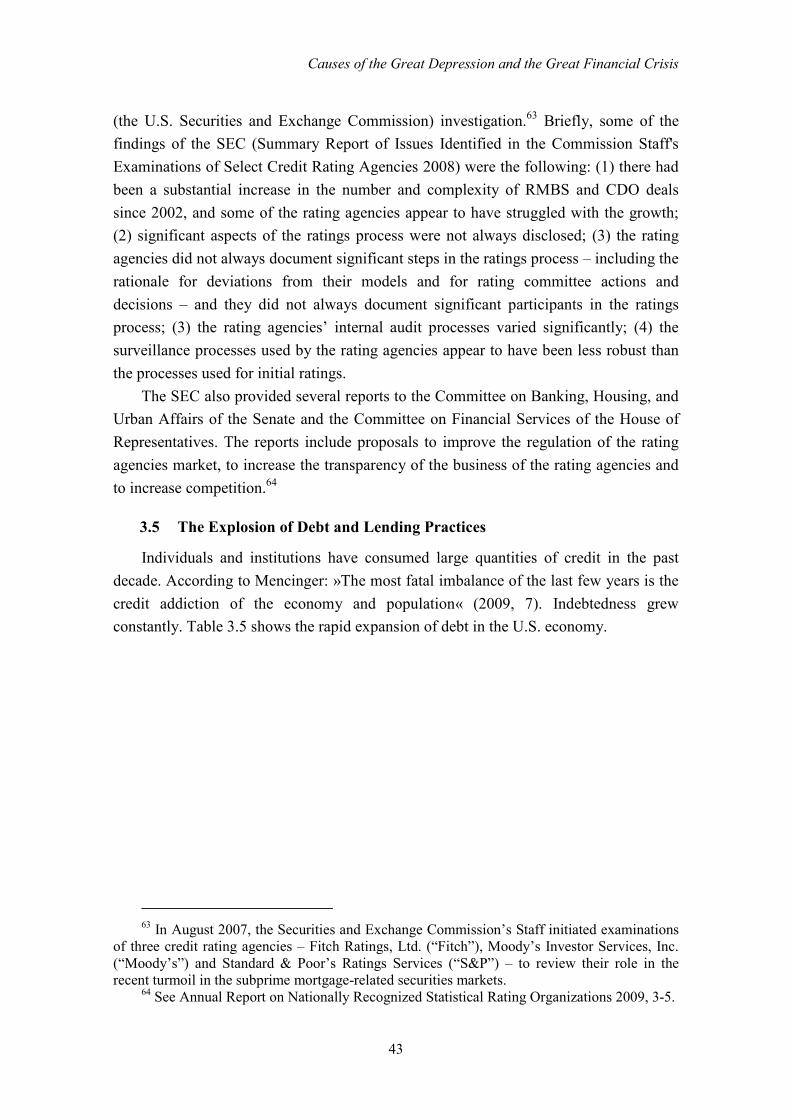
Causes of the Great Depression and the Great Financial Crisis
43
(the U.S. Securities and Exchange Commission) investigation.63 Briefly, some of the
findings of the SEC (Summary Report of Issues Identified in the Commission Staff's
Examinations of Select Credit Rating Agencies 2008) were the following: (1) there had
been a substantial increase in the number and complexity of RMBS and CDO deals
since 2002, and some of the rating agencies appear to have struggled with the growth;
(2) significant aspects of the ratings process were not always disclosed; (3) the rating
agencies did not always document significant steps in the ratings process – including the
rationale for deviations from their models and for rating committee actions and
decisions – and they did not always document significant participants in the ratings
process; (3) the rating agencies’ internal audit processes varied significantly; (4) the
surveillance processes used by the rating agencies appear to have been less robust than
the processes used for initial ratings.
The SEC also provided several reports to the Committee on Banking, Housing, and
Urban Affairs of the Senate and the Committee on Financial Services of the House of
Representatives. The reports include proposals to improve the regulation of the rating
agencies market, to increase the transparency of the business of the rating agencies and
to increase competition.64
3.5 The Explosion of Debt and Lending Practices
Individuals and institutions have consumed large quantities of credit in the past
decade. According to Mencinger: »The most fatal imbalance of the last few years is the
credit addiction of the economy and population« (2009, 7). Indebtedness grew
constantly. Table 3.5 shows the rapid expansion of debt in the U.S. economy.
63 In August 2007, the Securities and Exchange Commission’s Staff initiated examinations
of three credit rating agencies – Fitch Ratings, Ltd. (“Fitch”), Moody’s Investor Services, Inc. (“Moody’s”) and Standard & Poor’s Ratings Services (“S&P”) – to review their role in the recent turmoil in the subprime mortgage-related securities markets.
64 See Annual Report on Nationally Recognized Statistical Rating Organizations 2009, 3-5.
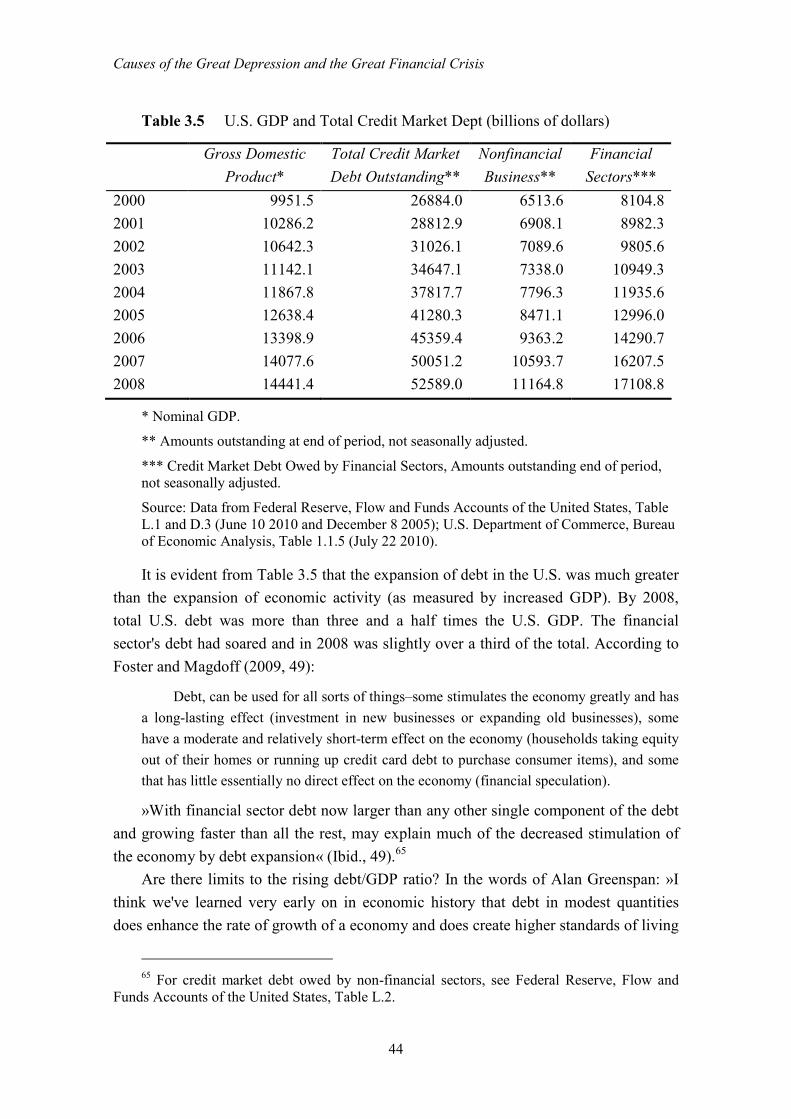
Causes of the Great Depression and the Great Financial Crisis
44
Table 3.5 U.S. GDP and Total Credit Market Dept (billions of dollars)
Gross Domestic
Product*
Total Credit Market
Debt Outstanding**
Nonfinancial
Business**
Financial
Sectors***
2000 9951.5 26884.0 6513.6 8104.8
2001 10286.2 28812.9 6908.1 8982.3
2002 10642.3 31026.1 7089.6 9805.6
2003 11142.1 34647.1 7338.0 10949.3
2004 11867.8 37817.7 7796.3 11935.6
2005 12638.4 41280.3 8471.1 12996.0
2006 13398.9 45359.4 9363.2 14290.7
2007 14077.6 50051.2 10593.7 16207.5
2008 14441.4 52589.0 11164.8 17108.8
* Nominal GDP.
** Amounts outstanding at end of period, not seasonally adjusted.
*** Credit Market Debt Owed by Financial Sectors, Amounts outstanding end of period, not seasonally adjusted.
Source: Data from Federal Reserve, Flow and Funds Accounts of the United States, Table L.1 and D.3 (June 10 2010 and December 8 2005); U.S. Department of Commerce, Bureau of Economic Analysis, Table 1.1.5 (July 22 2010).
It is evident from Table 3.5 that the expansion of debt in the U.S. was much greater
than the expansion of economic activity (as measured by increased GDP). By 2008,
total U.S. debt was more than three and a half times the U.S. GDP. The financial
sector's debt had soared and in 2008 was slightly over a third of the total. According to
Foster and Magdoff (2009, 49):
Debt, can be used for all sorts of things–some stimulates the economy greatly and has
a long-lasting effect (investment in new businesses or expanding old businesses), some
have a moderate and relatively short-term effect on the economy (households taking equity
out of their homes or running up credit card debt to purchase consumer items), and some
that has little essentially no direct effect on the economy (financial speculation).
»With financial sector debt now larger than any other single component of the debt
and growing faster than all the rest, may explain much of the decreased stimulation of
the economy by debt expansion« (Ibid., 49).65
Are there limits to the rising debt/GDP ratio? In the words of Alan Greenspan: »I
think we've learned very early on in economic history that debt in modest quantities
does enhance the rate of growth of a economy and does create higher standards of living
65 For credit market debt owed by non-financial sectors, see Federal Reserve, Flow and
Funds Accounts of the United States, Table L.2.
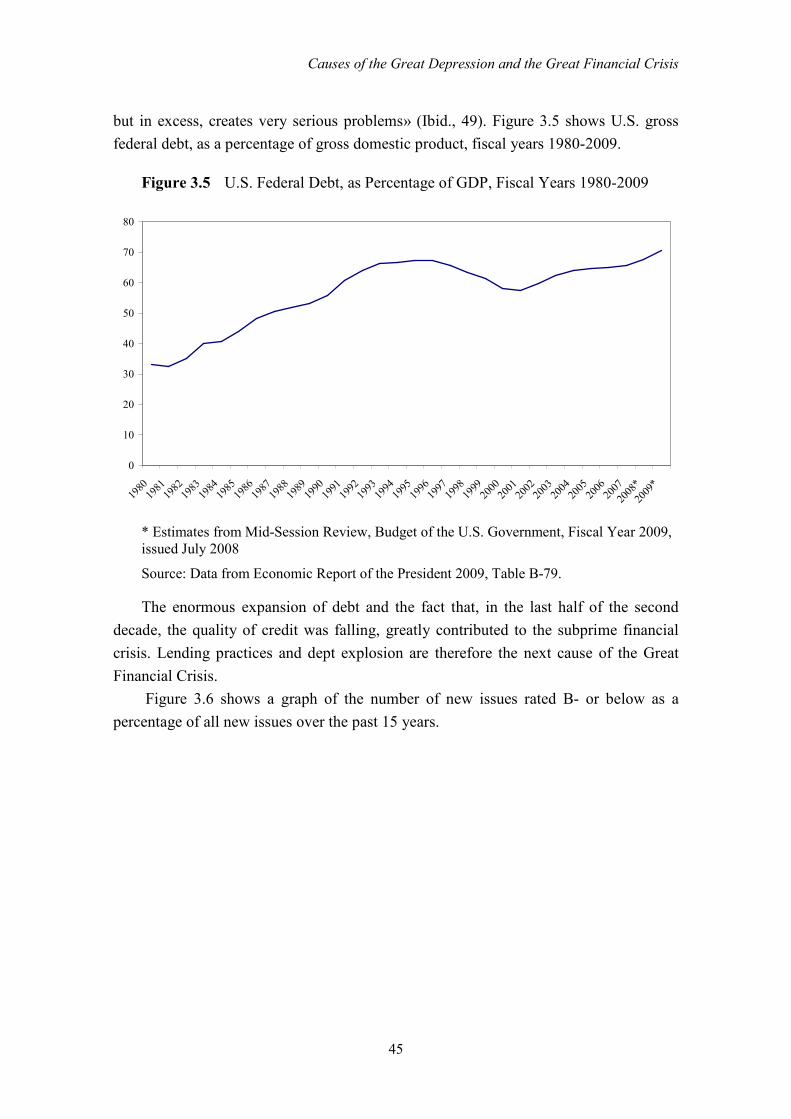
Causes of the Great Depression and the Great Financial Crisis
45
but in excess, creates very serious problems» (Ibid., 49). Figure 3.5 shows U.S. gross
federal debt, as a percentage of gross domestic product, fiscal years 1980-2009.
Figure 3.5 U.S. Federal Debt, as Percentage of GDP, Fiscal Years 1980-2009
0
10
20
30
40
50
60
70
80
1980
1981
1982
1983
1984
1985
1986
1987
1988
1989
1990
1991
1992
1993
1994
1995
1996
1997
1998
1999
2000
2001
2002
2003
2004
2005
2006
2007
2008
*
2009
*
* Estimates from Mid-Session Review, Budget of the U.S. Government, Fiscal Year 2009, issued July 2008
Source: Data from Economic Report of the President 2009, Table B-79.
The enormous expansion of debt and the fact that, in the last half of the second
decade, the quality of credit was falling, greatly contributed to the subprime financial
crisis. Lending practices and dept explosion are therefore the next cause of the Great
Financial Crisis.
Figure 3.6 shows a graph of the number of new issues rated B- or below as a
percentage of all new issues over the past 15 years.
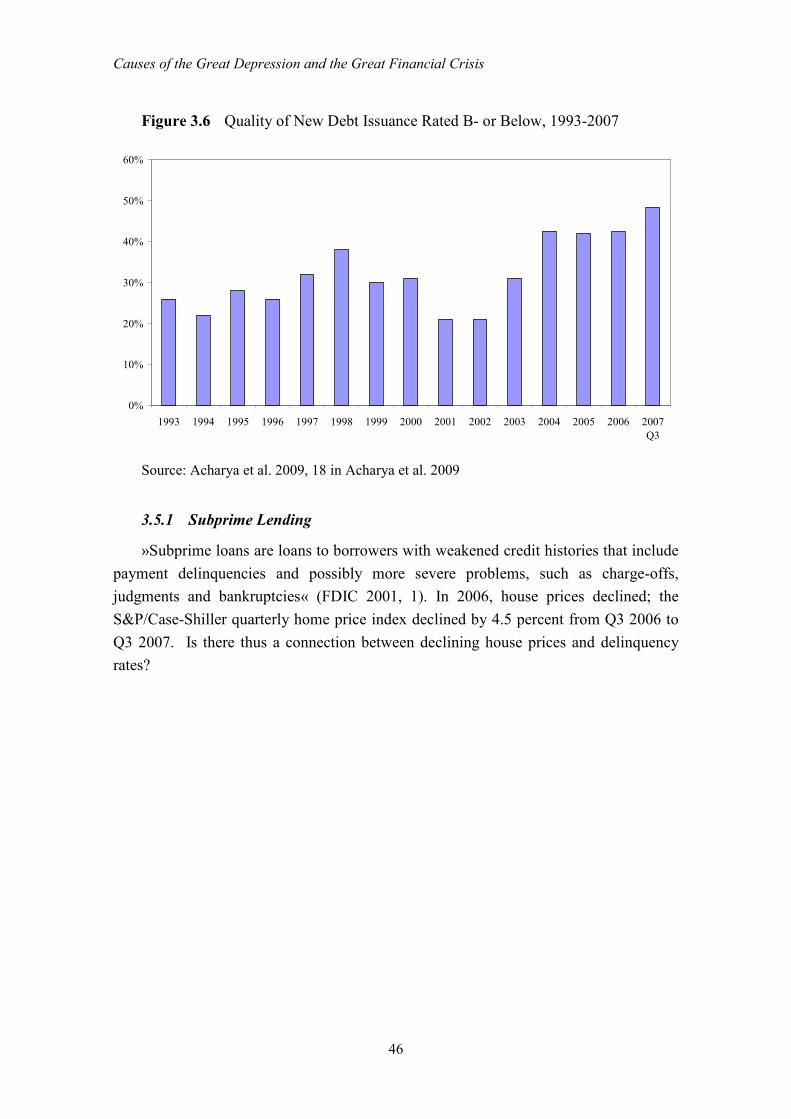
Causes of the Great Depression and the Great Financial Crisis
46
Figure 3.6 Quality of New Debt Issuance Rated B- or Below, 1993-2007
0%
10%
20%
30%
40%
50%
60%
1993 1994 1995 1996 1997 1998 1999 2000 2001 2002 2003 2004 2005 2006 2007Q3
Source: Acharya et al. 2009, 18 in Acharya et al. 2009
3.5.1 Subprime Lending
»Subprime loans are loans to borrowers with weakened credit histories that include
payment delinquencies and possibly more severe problems, such as charge-offs,
judgments and bankruptcies« (FDIC 2001, 1). In 2006, house prices declined; the
S&P/Case-Shiller quarterly home price index declined by 4.5 percent from Q3 2006 to
Q3 2007. Is there thus a connection between declining house prices and delinquency
rates?
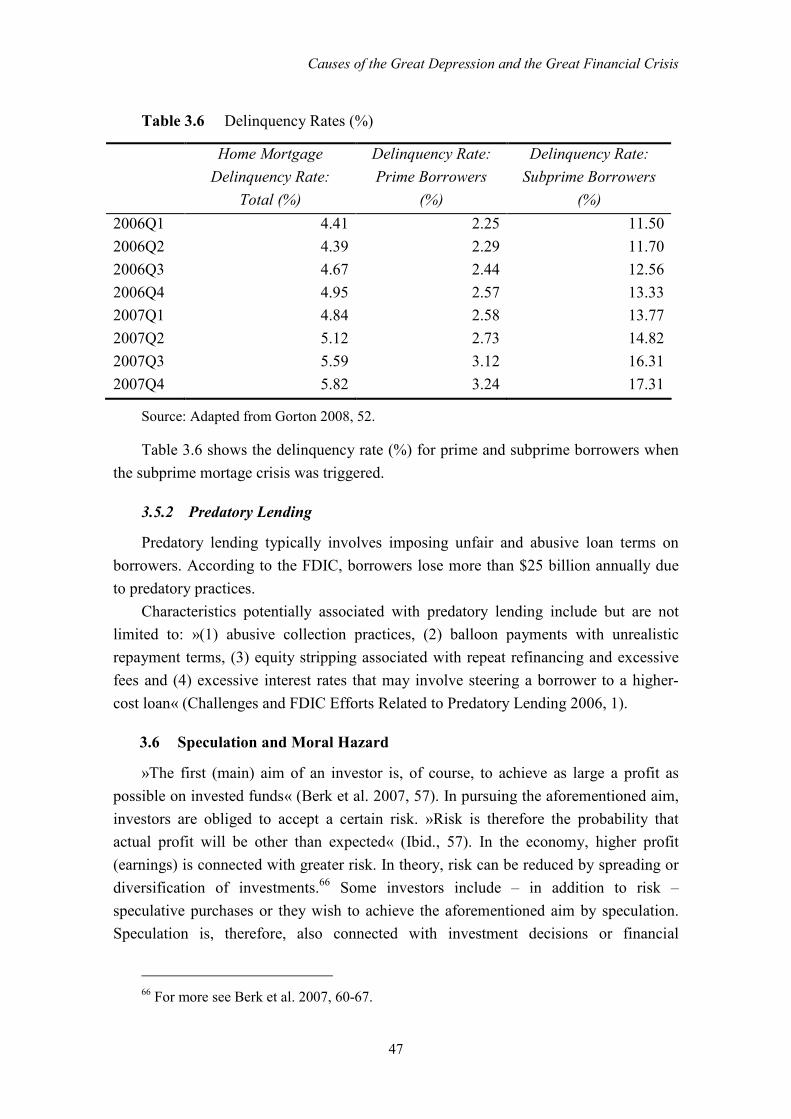
Causes of the Great Depression and the Great Financial Crisis
47
Table 3.6 Delinquency Rates (%)
Home Mortgage
Delinquency Rate:
Total (%)
Delinquency Rate:
Prime Borrowers
(%)
Delinquency Rate:
Subprime Borrowers
(%)
2006Q1 4.41 2.25 11.50
2006Q2 4.39 2.29 11.70
2006Q3 4.67 2.44 12.56
2006Q4 4.95 2.57 13.33
2007Q1 4.84 2.58 13.77
2007Q2 5.12 2.73 14.82
2007Q3 5.59 3.12 16.31
2007Q4 5.82 3.24 17.31
Source: Adapted from Gorton 2008, 52.
Table 3.6 shows the delinquency rate (%) for prime and subprime borrowers when
the subprime mortage crisis was triggered.
3.5.2 Predatory Lending
Predatory lending typically involves imposing unfair and abusive loan terms on
borrowers. According to the FDIC, borrowers lose more than $25 billion annually due
to predatory practices.
Characteristics potentially associated with predatory lending include but are not
limited to: »(1) abusive collection practices, (2) balloon payments with unrealistic
repayment terms, (3) equity stripping associated with repeat refinancing and excessive
fees and (4) excessive interest rates that may involve steering a borrower to a higher-
cost loan« (Challenges and FDIC Efforts Related to Predatory Lending 2006, 1).
3.6 Speculation and Moral Hazard
»The first (main) aim of an investor is, of course, to achieve as large a profit as
possible on invested funds« (Berk et al. 2007, 57). In pursuing the aforementioned aim,
investors are obliged to accept a certain risk. »Risk is therefore the probability that
actual profit will be other than expected« (Ibid., 57). In the economy, higher profit
(earnings) is connected with greater risk. In theory, risk can be reduced by spreading or
diversification of investments.66 Some investors include – in addition to risk –
speculative purchases or they wish to achieve the aforementioned aim by speculation.
Speculation is, therefore, also connected with investment decisions or financial
66 For more see Berk et al. 2007, 60-67.
Causes of the Great Depression and the Great Financial Crisis
48
instruments. Graham and Dodd define speculation as (1951, ibid.): » a financial action
that does not promise safety of the initial investment along with the return on the
principal sum«.
Moral hazard can generally be defined as the lack of any incentive to guard against
a risk when you are protected. Some say that »moral hazard is the result of asymmetric
expectation, as when the market expects central banks to bail out the financial sector
during a crisis« (Munchau 2007; after Mah-Hui Lim 2008, 22). »Moral hazard occurs
when banks and other institutions are rescued from their imprudent actions, either
directly through bail-outs or indirectly through rate cuts, because the consequences of
not coming to their rescue could result in bigger pain for depositors or for the whole
economy« (Mah-Hui Lim 2008, 23). »It is a form of what economists term
“externality,” i.e., the costs of one’s actions are passed on to the public« (Ibid., 23).
What is the differentia specifica between risk and speculation? Why did Wall Street
(ever) take such dangerous risks? Did the U.S. Federal Reserve and the federal
government helped create the moral hazard problem? Was the mistake that of taking too
much risk?
Financial speculation can involve the buying and short-selling of stocks, real estate,
derivatives or any valuable financial instrument. Foster and Magdoff have the following
to say about stock market and currency trading: »Stock markets and currency trading
have become little more than giant casinos where the number and values of transactions
have increased far out of proportion to the underlying economy« (2009, 56).
There are a lot of ways of playing “the market game”: »For example, one can bet
on the price of a particular stock going down (short selling) by selling borrowed stock
and agreeing to repurchase the stock and return it to its owner at a particular time in the
future« (Foster and Magdoff 2009, 57). On the other hand: »One can buy the right to
purchase a stock in the future at a particular price (a call option), or sell a stock in the
future (a put option) at a particular price« (Ibid., 57).67
Obviously, almost everbody participated in so-called market speculation. In other
words: market speculation touched companies, investors, banks, financial institutions,
GSEs, the rating agencies, individuals (unprofessional investors, ordinary citizens) and
entire families. It can thus be said that speculation took place all round. The
consequence was that speculative prices increased the general economic enthusiasm
(they caused euphoria), which, in effect, bid prices up further. “Speculative fever”
occurred and the foundation of the housing bubble was laid. There was a common
believe that one could make a lot of money with (all sorts of) investment. Was
67 »One of the more bizarre futures markets was created in 2003 by the U.S. government's
Department of Defense, along with a private company – betting on the likelihood of assassinations and terrorist attacks« (Foster and Magdoff 2009, 57). In short, the collapse of values reached astronomical dimensions.

Causes of the Great Depression and the Great Financial Crisis
49
speculation anything other than gambling? Some economists therefore talk about
“casino capitalism.”68
It is imperative to understand that the Great Financial Crisis illustrated (painfully)
two principles: first, the “too big to fail” doctrine; and second, it destroyed the “rules of
the game.” Let us see why. The Fed and the federal government held things together,
until Lehman Brother was allowed to fail. The result was that, after Lehman, panic
spread almost everywhere. Counterparty risk therefore soared. Why was Bear Stearns
“too big to fail” but Lehman Brothers was not?
»As we approach the problem of bailing out the banks, we should have begun by
asking, what kind of financial system do we want in the future« (Stiglitz 2009, 287)?
According to Shiller, »we have to bail out some people who have fared particularly
badly, and we also have to arrange bailouts in certain extreme cases to prevent failure of
our economic system. These bailouts must be done promptly and correctly, so that they
do not come across as unjust or unfair« (2008, 20). »While it is natural to emphasize the
unfairness of bailouts to those who do not receive them, judgments of what is fair and
unfair are far from clear-cut. There is an inherent unfairness in our economy, evidenced
by its sharp income inequalities« (Shiller 2008, 106). Before proceeding to a
conclusion, it is important to emphasize the following: we should be worried about
public perception of fairness69, which has been under a lot of pressure in the current
crisis (as it probably was in the 1930s). The perception of unfairness can produce
hostility between workers and management, between rich and poor and, when that
happens, prospects of growth can falter and standstill and (social) regression can occur.
Non omne quod licet honestum est.70 Positions have been adopted today for
understanding what success (reputation) in general mean. Instead of its main distinction
being scrupulousness in relation to how success was achieved, it seems today that
reputation (success) is reinforced above all by “courage” in denying the existence of
various traditional limitations. It probably is true today that, not infrequently, those who
have succeeded mainly in not being restricted by established ideas of acceptability,
honesty and fairness, enjoy the reputation of success (mutatis mutandis from Kranjc
2007, 6).
68 See Mencinger 2009, How have we come where we are? 69 There is no general answer, but nevertheless, what is fairness? Fairness is actualised by
those responsible for economic policy, businesspersons, managers and ordinary people, in each individual act that they perform if they strive to approach the ideal of fairness and thereby commit the least possible unfairnessness.
70 Not everything that is allowed is also honest (decent). See Janez Kranjc 2007, Non omne
quod licet honestum est.

51
4 CONCLUSION
The Great Financial Crisis is the first major crisis of the 21st century. Is it a crisis
that is in no way similar to any previous crisis? No!
It is imperative to bear in mind that explanations of the causes (roots) of the Great
Depression have settled into several different categories. A large part of the economics
profession has devoted its attention to the so called monetary hypothesis and Keynesian
hypothesis, another part to the so called gold standard hypothesis and some to a non-
monetary/financial approach. Economists and economic commentators (including crisis
observers) of the Great Depression have in the past to some extent argued past each
other, with monetarists stressing the monetary factors of the latter stages of the Great
Depression and Keynesians emphasizing the probable importance of non-monetary
factors in the initial downturn. Since the 1970s, the literature has moved towards a
comparative approach71, i.e., much of the research on the Depression is conducted by
studying two or more countries and, what is most important, comparing what can be
learnt from each.
Finally, the question arises of whether there are similarities between the Great
Depression and the Great Financial Crisis?
First of all, both the Great Depression and the Great Financial Crisis caused major
financial, economical and social damage. Both crises caused a great deal of suffering.
Once again, people are experiencing the effects of a recession as deep and painful as the
people of 1930s did. Jobs are being lost on a large scale. Unemployment, as during the
Great Depression, has reached record levels.72 People are losing their houses,
apartments and cars. They are once again witnessing growing poverty and the
pauperization of citizens. They are once again without hope for a better future.
Companies are once again fighting for survival, trying to get orders, trying to make
payments for employees' health insurance. Families are struggling to stay afloat,
struggling to pay their bills. Students view the future with uncertainty. Economists are
afraid that we could sink into a second great depression. Governments all over the world
are struggling with the crisis. Just as was tried at the time of the Great Depression, they
are trying with economic policy to revive the economy and to mitigate the consequences
of the current crisis. In the words of Keynes: We have magneto trouble. How, then, can
we start up again? The engine, that is the economy, will not start by itself and therefore
71 See for example Bernanke, Temin, Hamilton, Eichengreen, Mihov and Powel. 72 The unemployment rate in the Great Depression at its highest point was 25 percent. At
the moment (July 2010), the U.S. The unemployment rate is 9.5 percent; the highest point in the current crisis was 10.1 percent. In Slovenia, the level of registered unemployment in January 2010 was 10. 6 percent.

Conclusion
52
needs a kick start of the government.73 He also said: the engine that is the economy is
mostly in a good condition, but the main component, the financial system, is not
working. What could describe the present situation better? The Great Financial Crisis is
therefore by far the worst crisis to have befallen the world since the Great Depression.
For the first time since the Great Depression, with the subprime mortgage crisis, the
world has experienced a serious decline in aggregate demand (decline in spending).
This means that, for the first time since the Great Depression, there are (serious)
insufficiences in aggregate demand. While the consequences of the Great Financial
Crisis are global (as were the consequences of the Great Depression), the Great
Financial Crisis, as well as the Great Depression, originated in the U.S.74
The current crisis has been marked by a “housing bubble” or “housing crisis”. The
last similar major housing crisis in the U.S. took place in 1925-1933. In other words, a
decline in residential real home prices like that of the past three years has not been
experienced in the U.S. since the Great Depression, if then (see Figure 3.2). Some even
say that the crisis of the 1930s started before 1929 – in the housing market, meaning
with the bursting of the “housing bubble”; and it was not until later that it spread to the
stock market.75 Nevertheless, the asset bubble – then the “stock market bubble,” now
the “housing bubble” – is therefore the next common point. The stock market or market
in the 1930s was described as an “orgy of speculation,” a “mania,” a “bubble,” just like
the housing market now.76
Just as the Great Depression did back then, the Great Financial Crisis has once
again pointed out all the weaknesses of financial institutions and the entire financial
system. Financial markets are supposed to allocate capital and manage risk. To be blunt:
they did neither well. The asset/liability mismatch of financial institutions had an
important role in both crises.77 The loss of confidence in financial institutions during the
Great Depression and during the current financial crisis was and has been such that,
inter alia, government intervention was needed. The U.S. government, as well as
governments all over the world78, is once again trying to save the financial system. Both
73 However, as a lot of economists say: »nothing is free«; and Keynes already warned that
deficit spending also has its limits. 74 Footnote the same as 4. 75 See Shiller 2008, 102-103. 76 Compare, in terms of speculation, chapter 2.2 (Stock Market Crash 1929) with chapter
3.6 (Speculation and Moral Hazard). Did speculation become a national obsession during the 1920s and during 2000-08?
77 More on the asset/liability mismatch at the time of the Great Depression in Bernake 2000, Essays on the Great Depression; at the time of the Great Financial Crisis, Acharya and Richardson 2009, Restoring Financial Stability: How to Repair a Failed System.
78 How much space do fiscal policies have in EU member states for battling the current crisis on the assumption that they want to remain fiscally sustainable? See Dolenc and Stubelj 2010, Fiscal sustainability in EU and current financial/economic crisis.
Conclusion
53
crises were thus marked by government intervention, which is the next similarity. The
economic policy or policy response in the 1930s brought several institutional
innovations, in both private and public sectors. This does not refer only to the New Deal
but mainly the following reforms: a new home-loan banking system was created, i.e.,
the Federal Home Loan Bank System, which offered help to mortgage originators; the
American Institute of Real Estate Appraisers was established in 1932; the
Reconstruction Finance Corporation was established; U.S. Congress passed the Banking
Act of 1933 (Glass-Steagall Act): the Federal Deposit Insurance Corporation (FDIC) for
insuring bank deposits was created and separation of banking functions was instigated,
most notably commercial and investment banking; furthermore, U.S. Congress
approved a new bankruptcy law; in 1933 the Home Owners' Loan Corporation (HOLC)
was established, which lent to local home-financing institutions; in 1934 the Federal
Housing Administration was established, which promoted the purchase of real-estate for
those who could not afford it; in the same year, the Securities and Exchange
Commission was established; in 1938 the Federal National Mortgage Association (now
called Fannie Mae) and we could go on and on. How has the American government
responded to the current crisis (under both the Bush and the Obama administrations)?
Many economists (crisis observers) have claimed that, so far, the response by the
government has been disappointingly limited to that in the 1930s.79 Shiller wrote this in
2008 and it must be admitted that there have been few changes since then. Some say
that the U.S. financial reform, or Dodd-Frank Wall Street Reform and Consumer
Protection Act, passed by the Senate (July 15, 2010) and signed by President Barack
Obama (July 21, 2010) is the most sweeping set of financial reforms since the Great
Depression of the 1930s. It is worth pointing out some of the innovations that this
legislation brought: the Consumer Financial Protection Bureau has been established (the
bureau has inter alia authority to protect American consumers from unfair, deceptive
and abusive financial products and practices); the Financial Stability Oversight Council
has been established (this council will focus on identifying, monitoring and addressing
systemic risks posed by large, complex financial firms, as well as products and activities
that spread risk across firms); according to the Senate Committee on Banking, Housing,
and Urban Affairs, there is an end to the “too big to fail doctrine” and stricter regulation
of book-keeping and so on.80 Put more broadly, do the described changes, which are
without doubt the biggest changes in generations, achieve the scope of the 1930s
79 See, for example, Shiller 2008, 17-19. »None of the proposals represents a true
insitutional innovation that would create a better enviroment to support our real estate and financial markets. They are all merely quick fixes that fail to address the full scope of the problem« (2008, 19).
80 For more, see Dodd-Frank Wall Street Reform and Consumer Protection Act.
Conclusion
54
institutional innovations and banking rules?81 In short, in order to achieve a long term
solution we need something similar to that called for by the Great Depression. In
considering this similarity, we have stumbled on another resemblance. To put it another
way, in terms of law, the next similarity is the lag in legislation (regulation).
Turning now to banking panics, in the period from 2006-09, numerous banks and
bank-like institutions (the shadow banking system) failed (see Table 3.4), just as from
1930-33 (see Table 2.3). From 1930-33 and 2008-09, the U.S. financial (banking)
system experienced conditions that were among the most difficult and chaotic in its
history. During the Great Depression, collapsing stock prices caused margin loans to
become undercollateralized, which caused borrowers to default. In the Great Financial
Crisis, collapsing house prices have caused borrowers to default, which has exposed
banks, the shadow banking system and financial institutions. Depositors have lost
confidence in the solvency of banks and consequently a “run” on the banks occurred (in
the U.S. and in Europe).82 The banking system and, above all, the shadow banking
system, has thus contracted, similarly to the classical banking system from 1929-1933.83
Crediting of the market was seriously disrupted. Then, as today, the question arose of
whether the banks would be willing to lend money. The Fed’s chairman, Ben S.
Bernanke, is trying everything possible to restart the crediting process; even the balance
sheet structure of the Federal Reserve has been changed. The Fed has become the lender
of first and only resort. Banking panics are notably the next common point between the
Great Depression and the Great Financial Crisis.
A major problem then and today is household debt, or the credit boom. If we look
at the situation in terms of household debt as a percentage of GDP (see Credit-Suisse), it
can be seen that U.S. household debt has risen to levels not seen since the Great
Depression. U.S. household debt in 1929 and 2007 was 100 percent of GDP.84 More
broadly, people were living beyond their means.
All this and much more85 allows the conclusion that there are many similarities
between the Great Depression and the Great Financial Crisis.86 The problems typical of
81 It is beyond the scope of this thesis to indicate the lines of future policy. Stiglitz (2009,
284), in a brief discussion of what makes for a good stimulus, throws out some remarks well worth quoting: »It has to work quickly (we say, be timely), it should have a big bang for the buck, and it should help – and certainly not worsen – our long run problems«.
82 IKB Deutsche Industriebank AG and SachsenLB in Germany and the Northern Rock Building Society in the United Kingdom.
83 A comparable disaster, albeit not quite of the same magnitude. 84 See also credit market debt owed by financial sectors, in the late 1920s and early 1930s
and from 2000 onwards. 85 Cf. the economic doctrine (the situation of economic science) and market ideology then
(end of laissez-faire?) and now (end of mainstream economics?). Typical of that period and also of this one was the highly unequal income distribution. Thus, cf. the distribution of income and the ratio of debt service to national income, before, during and after the two crises. Lastly, cf.
Conclusion
55
the most of the world economy in the 1930s have returned. In many ways, the Great
Financial crisis looks like the Great Depression of the 1930s. The question is: How can
financial storms be made less likely in the future?
There is uncertainty and pessimism in the air; these are uncertain times. This crisis
will harm confidence and trust in our (financial) markets for years to come, just as the
Great Depression did. However, is there reason for hope? History shows that people
have recovered from all past crises, even from the Great Depression, with the help of
understanding and knowledge. Knowledge acquired in studying the Great Depression,
in particular, has helped that the situation is not (at least so far87) as bad as during the
Great Depression, because the mistakes made in the economic policy of the 1930s have
not been repeated.88 Every crisis offers a possibility for change, but we must not fool
ourselves, there is a considerable way to go before the economy will make a full
recovery.
transparency, or rather non-transparency, of companies, and especially financial institutions, then and now.
86 Bear in mind, each crisis has certain characteristics and each crisis is marked (accompanied) by causes (events) that distinguish it from other crises. For example, the Gold Standard during the Great Depression, or GSEs during the Great Financial Crisis.
87 Regrettably, the pace of the U.S. recovery in output and employment has slowed in the second quarter of 2010. More precisely, U.S. growth slowed in the second quarter of 2010 to a 2.4% annual rate, after a 3.7 percent first-quarter gain. »Household spending is increasing gradually, but remains constrained by high unemployment, modest income growth, lower housing wealth, and tight credit«, noted the Fed (FOMC statement from August 10, 2010). Furthermore, the gap between actual and potential output is increasing. Some economists, e.g., Shiller and Stiglitz, have pointed out that double-dip recession is possible.
88 The Federal Reserve deliberately contracted the money supply and raised interest rates in September 1931.


57
REFERENCES
Acharya, Viral V. and Matthew Richardson. 2009. Restoring Financial Stability: How
to Repair a Failed System. New York: Wiley.
Berk, Aleš, Ivan Lončarski, Peter Zajc, Edita Kuhelj Krajnović, Silva Deželan, Aljoša Valentinčič and Peter Groznik. 2006. Poslovne finance. 3. dopolnjena in popravljena izdaja. Ljubljana: Ekonomska fakulteta.
Bernanke, Ben S. 2000. Essays on the Great Depression. New Jersey: Princeton University Press.
Bethel, Jenifer E., Allen Ferrell and Gang Hu. 2008. Legal and Economic Issues in
Litigation Arising from the 2007–2008 Credit Crisis. Cambridge: Harvard Law School. Http://ssrn.com/abstract=1096582 (24. 5. 2010).
Blankenburg, Stephanie and Jose Gabriel Palma. 2009. Introduction: the global financial crisis. Cambridge Journal of Economics 33 (4): 531–538.
Board of Governors of the Federal Reserve System. 2009. Flow of Funds Accounts of
the United States: Flows and Outstandings, Third Quarter. Http://www.federalreserve.gov/releases/z1/20091210/z1r-1.pdf (22. 5. 2010).
Board of Governors of the Federal Reserve System. Federal Open Market Committee (FOMC). 2010. Minutes of the Federal Open Market Committee. Http://www.federalreserve.gov/monetarypolicy/files/fomcminutes20100810.pdf (15. 8. 2010).
Dodd-Frank Wall Street Reform and Consumer Protection Act. 2010. Http://thomas.loc.gov/cgi-bin/bdquery/z?d111:H.R.4173: (12. 8. 2010).
Dolenc, Primož and Igor Stubelj. 2010. Fiscal Sustainability in EU and Current Financial/Economic Crisis. International Journal of Sustainable Economy 2 (1): 80–91.
Economic Report of the President. 2009. Transmitted to the Congress January 2009. Http://www.gpoaccess.gov/eop/2009/2009_erp.pdf (24. 5. 2010).
Eichengreen, Barry and Kris Mitchener. 2003. The Great Depression as a Credit Boom Gone Wrong. Bank for International Settlements Press & Communications. Http://www.bis.org/publ/work137.pdf (12. 8. 2010).
Fabozzi, Frank J., Franco Modigliani, Frank J. Jones and Michael G. Ferri. 2002. Foundations of Financial Markets and Institutions. New Jersey: Prentice Hall.
Federal Deposit Insurance Corporation. 2001. Subprime Lending: Expanded Guidance
for Subprime Lending Programs. Http://www.fdic.gov/news/news/press/2001/pr0901a.html (22. 5. 2010).
Federal Deposit Insurance Corporation. 2010. FDIC Bank Failures. Http://www.fdic.gov/index.html (24. 5. 2010).
Federal Reserve Bank of St. Louis. 2010. Economic Research. Advancing Economic
Knowledge Trough Research & Data. Http://research.stlouisfed.org/fred2/ (20. 8. 2010).
Federal Reserve Statistical Release. 2010. Flow and Funds Accounts of the United
States. Table L.1, L.2 and D.3. June 10 2010 and December 8 2005. Http://www.federalreserve.gov/releases/z1/20100610/z1.pdf Http://www.federalreserve.gov/releases/z1/20051208/z1.pdf

References
58
Federal Reserve Statistical Release. 2010. Selected Interest Rates. Historical Data.
H.15. Http://www.federalreserve.gov/releases/h15/data.htm (20. 8. 2010).
Foster, John B. and Fred Magdoff. 2009. The Great Financial Crisis: Causes and
Consequences. New York: Monthly Review Press.
Friedman, Milton and Ana J. Schwartz. 2008. The Great Contraction, 1929-1933. New Jersey: Princeton University Press.
Gorton, Gary. 2008. The Panic of 2007. Http://ssrn.com/abstract=1255362 (24. 5. 2010).
Hart, A. G. 1938. Debts and Recovery, 1927-1937. New York: Twentieth Century Fund.
Hodgson, Geoffrey M. 2009. The great crash of 2008 and the reform of economics. Cambridge Journal of Economics 33 (6): 1205–1221.
Kenneth J. Galbraith. 2009. The Great Crash 1929. New York: Houghton Mifflin Harcourt.
Keynes, John Maynard. 2009. The General Theory of Employment, Interest and Money. London: Macmillan.
Keynes, John Maynard. 1930. The Great Slump of 1930.
Http://www.gutenberg.ca/ebooks/keynes-slump/keynes-slump-00-h.html (20. 7. 2010).
Kindleberger, Charles P. 1986. The World in Depression 1929-1939. Revised and enlarged ed. Berkeley: University of California Press.
Kranjc, Janez. 2007. Non omne quod licet honestum est: (Paul. D. 50, 17, 144 pr.). In Zbornik znanstvenih razprav, 73–87. Ljubljana: Pravna fakulteta.
Kranjc, Janez. 2008. Rimsko pravo. Ljubljana: GV Založba.
Krohn, Gregory A. and William R. Gruver. 2008. The Complexities of the Financial
Turmoil of 2007 and 2008. Http://ssrn.com/abstract=1282250 (24. 5. 2010).
Krugman, Paul. 2008. Vrnitev ekonomike depresije in kriza leta 2008. Ljubljana: Ekonomska fakulteta v Ljubljani.
Lawson, Tony. 2009. The current economic crisis: its nature and the course of academic economics. Cambridge Journal of Economics 33 (4): 759–777.
Leijonhufvud, Axel. 2009. Out of the corridor: Keynes and the crisis. Cambridge
Journal of Economics 33 (4): 741–757.
Mah-Hui Lim, Michael. 2008. Old Wine in a New Bottle: Subprime Mortgage Crisis-
Causes and Consequences. Http://ssrn.com/abstract=1126274 (24. 5. 2010).
Mankiw, Gregory N. 2008. But Have We Learned Enough? Http://www.nytimes.com/2008/10/26/business/26view.html (20. 5. 2010).
Mencinger, Jože. 2009. Kako smo prišli, kjer smo (How have we come where we are)? Http://www.pf.uni-lj.si/media/mencinger.kdaj.smo.skrenili.pdf (20. 5. 2010).
Office of Inspector General. 2006. Challenges and FDIC Efforts Related to Predatory
Lending. Http://www.fdicoig.gov/reports06/06-011.pdf (24. 5. 2010).
Romer, Christina D. 2003. Great Depression (Forthcoming in the Encyclopaedia Britannica). Http://elsa.berkeley.edu/~cromer/great_depression.pdf (24. 5. 2010).
Schwartz, Anna J. 1987. Understanding 1929-1933. In Money and Historical
Perspective, ur. Anna J. Scwartz, 110–151. Chicago: University of Chicago Press.
References
59
Securities and Exchange Commission. 2008. Proposed Rules for Nationally Recognized
Statistical Rating Organizations. Http://www.sec.gov/rules/proposed/2008/34-57967.pdf (19. 5. 2010).
Securities and Exchange Commission. 2008. Summary Report of Issues Identified in the
Commission Staff’s Examinations of Select Credit Rating Agencies. Http://www.sec.gov/news/studies/2008/craexamination070808.pdf (14. 5. 2010).
Securities and Exchange Commission. 2009. Annual Report on Nationally Recognized
Statistical Rating Organizations 2009. Http://www.sec.gov/divisions/marketreg/ratingagency/nrsroannrep0909.pdf (24. 5. 2010).
Shiler, Robert J. 2010. Standard & Poor’s/ Case-Shiller Home Price Indices. Http://www.econ.yale.edu/~shiller/data/Fig2-1.xls. (20. 6. 2010).
Shiller, Robert J. 2008. The Subprime Solution. New Jersey: Princeton University Press.
Stiglitz, Joseph E. 2009a. The Current Economic Crisis and Lessons for Economic
Theory. Http://www2.gsb.columbia.edu/faculty/jstiglitz/download/papers/2009_Current_Economic_Crisis_EEA.pdf (20. 5. 2010).
Stiglitz, Joseph E. 2009b. The Global Crisis, Social Protection and Jobs. Http://www2.gsb.columbia.edu/faculty/jstiglitz/download/papers/2009_Global_Crisis_ILR.pdf (20. 5. 2010).
Stiglitz, Joseph E. 2010. The Financial Crisis of 2007–8 and its Macroeconomic
Consequences. Http://www2.gsb.columbia.edu/faculty/jstiglitz/download/papers/2010_Financial_Crisis.pdf (20. 7. 2010).
Štiblar, Franjo. 2008. Svetovna kriza in Slovenci: Kako jo preživeti? Ljubljana: ZRC SAZU.
Štiblar, Franjo. 2009. The Impact of the Global Crisis on Montenegro and the Western
Balkans. Podgorica: Central Bank of Montenegro.
U.S. Department of Commerce. Bureau of the Census, 2010. Housing Vacancies and
Homeownership (CPS/HVS). Annual Statistics: 2009. Http://www.census.gov/hhes/www/housing/hvs/annual09/ann09ind.html (20. 6. 2010).
U.S. Department of Commerce, Bureau of Economic Analysis, 2010. Table 1.1.5. Http://www.bea.gov/national/nipaweb/TableView.asp?SelectedTable=5&FirstYear=2009&LastYear=2010&Freq=Qtr (22. 7. 2010).
U.S. Department of Commerce. 1975. U.S. Bureau of the Census Catalog: January–
March. Http://www2.census.gov/prod2/decennial/documents/catalogues/CensusCatalog1975.pdf (14. 5. 2010).

61
APPENDICES
Appendix 1 Slovenian Summary

Appendix 1
APPENDIX 1. Slovenian Summary
Razširjeni povzetek v slovenskem jeziku
Diplomska naloga obravnava vzroke, ki so odločilno prispevali k izbruhu velike
depresije in velike finančne krize, tj. krize drugorazrednih posojil.
Hipoteza (predpostavka) diplomske naloge je: velika depresija in sedanja finančna
kriza (tj. kriza drugorazrednih posojil) imata določene podobnosti. Povedano z drugimi
besedami: vzroki, ki so pripeljali do velike depresije, so podobni vzrokom velike
finančne krize (krize drugorazrednih posojil).
Namen diplomske naloge je ugotoviti, analizirati in primerjati vzroke, ki so sprožili
veliko depresijo v tridesetih letih 20. stoletja, in krizo drugorazrednih posojil v
Združenih državah Amerike (v nadaljevanju ZDA) leta 2006.
Cilji diplomske naloge so:
• ugotoviti vzroke velike depresije;
• ugotoviti vzroke velike finančne krize oziroma krize drugorazrednih posojil;
• preučiti in pojasniti vzroke velike depresije oziroma finančne krize iz tridesetih
let prejšnjega stoletja;
• preučiti in pojasniti vzroke sedanje finančne krize, torej velike finančne krize;
• primerjati vzroke obeh finančnih (gospodarskih) kriz;
• predstaviti širjenje in posledice tako velike depresije kot tudi krize
drugorazrednih posojil.
Velika depresija je svetovno zniževanje gospodarske rasti, ki se je začelo leta 1929
in trajalo vse do leta 1939. Je najdaljša in najbolj neprizanesljiva depresija, ki jo je
doživel industrializirani zahodni svet. Posledice velike depresije – depresija se je začela
v ZDA – so bile vidne oziroma jih je bilo mogoče čutiti v skoraj vseh državah po svetu.
Drastična brezposelnost in deflacija, ogromni padci v outputu, so samo nekatere od
posledic velike depresije. Realni output in cene so strmo padle. Med vrhom in dnom
gospodarskega cikla je industrijska produkcija v ZDA padla za 47 %, realni BDP za
30 %, indeks trgovinskih cen pa za 33 %. Kljub temu, da se je veliko razpravljajo o
zanesljivosti statističnih podatkov, je vsesplošno sprejeto, da je stopnja brezposelnosti v
najvišji točki dosegla 25 %. Velika depresija je bila sestavljena iz dveh gospodarskih
ciklov. Ekonomsko krčenje prvega gospodarskega cikla se je začelo avgusta 1929 in
trajalo do marca 1933. Motnje na strani povpraševanja so bile težava takrat, kot so
motnje na strani povpraševanja in nezadostno trošenje težava danes. Ekonomisti se
strinjajo, da je bilo zmanjšanje trošenja glavni vzrok velike depresije. Obdobje od leta
1920 do leta 1929 je bilo uspešno kljub majhnim recesijam. Očiten eksces je bil na trgu
vrednostnih papirjev (na borzi). Cene vrednostnih papirjev so v tem obdobju zrasle več
Appendix 1
kot štirikrat. Borzni balon je bil v nastajanju. V jeseni leta 1929 so cene vrednostnih
papirjev dosegle vrednosti, ki jih ni bilo mogoče opravičiti s pričakovanimi dobički
podjetij. Ko so začele vrednosti na trgu vrednostnih papirjev padati, so investitorji
izgubili optimizem in balon na trgu vrednostnih papirjev je počil. Borzni zlom leta
1929, torej padanje cen vrednostnih papirjev, je povzročilo zmanjšanje proizvodnje,
zaposlenosti ter posledično negativno vplivalo na trošenje. Na agregatno povpraševanje
je negativno vplivala tudi bančna kriza (panika) in monetarno krčenje. Velika depresija
je bila tako globoka in dolga zaradi neprimerne monetarne politike ameriške centralne
banke. Med leti 1930 in 1933 je ameriški finančni sistem preživljal čase, ki so bili
najbolj kaotični in težavni v njegovi zgodovini. Ogromna propadanja bank so vodila do
zaprtja celotnega bančnega sistem v marcu 1933. Razglašen je bil nacionalni bančni
praznik. Banke so lahko odprle svoje poslovalnice šele, ko so jih razglasili inšpektorji
za solventne. Sistem zlatega standarda, ki je bil fiksni devizni tečaj, je med drugim
soodgovoren za veliko depresijo. Novejše raziskave vzrokov velike depresije so
pokazale, da je potrebno sistemu zlatega standarda pripisati pomembno vlogo pri
deflaciji v tridesetih letih 20. stoletja. Ko se je začel deflacijski proces, so se centralne
banke spustile v konkurenčno deflacijo in v boj za zlato, v upanju pokritja valut pred
špekulativnimi napadi. Deflacijski poskusi individualnih bank so bili zaznamovani z
nemudnim izvozom zlata, kar je prisililo centralne banke, da so ponovno zvišale
diskontno stopnjo in deflacionirale. Pri preučevanju velike depresije se izkaže, da so
države, ki so prej zapustile (opustile) sistem zlatega standarda okrevale hitreje kot
države, ki so vztrajale pri njem. V letu 1933 se je v ZDA začela monetarna ekspanzija.
Ponudba denarja v ZDA se je med 1933 in 1937 zvišala za skoraj 42 %. In takrat se je
zgodba ponovila. Cene na trgu vrednostnih papirjev so izgubile večino vrednosti, ki so
jih pridobile do takrat. Prav tako so padle cene blaga in storitev. Indeks industrijske
produkcije je od julija 1937 do junija 1938 padel za 33 %. Gospodarsko krčenje drugega
cikla, ki se je začelo maja 1937, predstavlja najbolj strm gospodarski padec v zgodovini
ZDA. Drugi gospodarski cikel je dokazal, da je bilo okrevanje gospodarstva v ZDA, ki
se je začelo marca 1933, zgrajeno na iluziji. Okrevanje gospodarstva se je začelo junija
1938.
Svetovno gospodarstvo v tem trenutku ni v depresiji. Kriza drugorazrednih posojil,
ki jo večina ekonomistov imenuje enostavno velika finančna kriza, se je začela s pokom
nepremičninskega balona v ZDA leta 2006 in je v letih 2007 in 2008 zajela globalni
finančni sistem. Finančni nemir je bil izzvan z naraščanjem števila neplačevanja
drugorazrednega hipotekarnega dolga. Ko sta leta 2007 propadla dva Bear Stearns
hedge sklada in ko je avgusta istega lega BNP Paribas odložila ponoven nakup oziroma
ustavila dvige iz svojih skladov, je finančna kriza postala sistemska. Kljub številnim
poskusom različnih vlad, da bi ustavile širitev krize, se je kriza razširila v različne
države in povzročila paniko. Večina ekonomistov se strinja, da je kriza drugorazrednih

Appendix 1
posojil temeljila na nepremičninskem balonu in je bila omogočena z zadolževanjem,
torej s krediti. Liberalizacija (deregulacija) trgov v zadnjem poldrugem desetletju,
listninjenje ter špekulacija in »moralni hazard« so veliko prispevali k nepremičninskem
balonu, kar je posledično, v povezavi z ogromno rastjo zadolženosti, sprožilo veliko
finančno krizo. Povedano z drugimi besedami, finančni sistem je odpovedal v svojih
temeljih nalogah. Velja pritrditi ekonomistom, ki pravijo, da je eden izmed
pomembnejših dejavnikov in vzrokov velike finančne krize model listninjenja.
Listninjenje je ustvarilo serijo problemov v informacijski asimetriji. Pogled nazaj
razkriva, da se niti tisti, ki so ustvarjali nove finančne produkte, niso popolnoma
zavedali tveganja, ki ga povzroča listninjenje. Naslednji problem povezan z
listninjenjem je, da so novi vrednostni papirji bili ekstremno netransparentni. Verjetno
je v tej netransparentnosti potrebno iskati tudi vzrok njihove uspešnosti. Omeniti je
potrebno zasnovo drugorazrednih posojil, ki v sebi nosi nevarnost. Drugorazredna
posojila so bila oblikovana tako, da so bila skrajno občutljiva na gibanje cen
nepremičnin. Problem se je pojavil, ko so cene nepremičnin začele padati, kajti takrat je
postalo refinanciranje hipotek nemogoče. Refinanciranje hipoteke je mogoče samo, če
vrednost nepremične narašča. Cene nepremičnin so začele padati, kreditojemalci niso
mogli refinancirati, kar je začelo stopnjevati neplačila hipotek. Ker ljudje niso bili
sposobni izpolniti svojih pogodbenih obveznosti, so začeli prodajati svoje
nepremičnine, da ne bi banke (pravno) posegle nanje. Posledično je trg nepremičnin
postal zasičen. Velika finančna kriza je bila kriza bančnega sistema kot tudi bančnega
sistema v senci. Velika sprememba v bančnem sistemu se je zgodila leta 1999.
Spremenjena je bila zakonodaja iz časa velike depresije, ki je ustvarila striktno ločitev
med investicijskimi in komercialnimi bankami. Od leta 1999 je bilo komercialnim
bankam dovoljeno poseči na trg investicijskih bank, kar je posledično povzročilo, da so
investicijske banke tvegale še več in bile pripravljene sprejeti še večja tveganja.
Povedati velja, da si je bančni sistem v senci sredstva izposojal kratkoročno, na drugi
strani pa posojal dolgoročno, vendar v nasprotju z bankami ni imel varnostih mrež, tj.
obveznih rezerv, ki so preprečevale večji pohod na banke do leta 2008. Zaradi
napisanega in še zaradi marsičesa je v obdobju med 2007 in 2010 propadlo veliko bank
in izginilo še več bankam podobnih institucij, tj. bančni sistem v senci. Državno
financirana podjetja so imela dva negativna vpliva na finančni sistem. Prvi negativni
vpliv je nastal kot posledica investiranja v »subprime Alt-A« področje. Drugi in
pomembnejši vpliv je bil, da so državno financirana podjetja vpeljala sistemsko
tveganje v sistem in tako prispevala k veliki finančni krizi. Državno financirana podjetja
so kot eden izmed večjih investitorjev v kapitalski trg, vpeljale upoštevaje vredno
tveganje nasprotne stranke (angl. counterparty risk). Kriza drugorazrednih posojil je
dosegla takšne dimenzije med drugim tudi zaradi agencij, ki vrednotijo kredite. Problem
se je začel, ko je bil spremenjen poslovni model iz »investitor plača« v poslovni model
Appendix 1
»izdajatelj plača«. Začelo se je trgovanje za ocene, kar je vodilo, z vidika kreditne
transparentnosti, k tekmovanju k dnu. Pokazalo se je, da so bile prvotne ocene agencij
skrajno optimistične, še posebej za hipoteke, ki so bile ustvarjene v letih 2005 in 2006.
Izpostaviti je potrebno ogromno ekspanzijo zadolženosti; ekspanzijo tako privatnega kot
javnega dolga. Navedeno in dejstvo, da je kvaliteta posojil v zadnjem poldrugem
desetletju neprestano padala je omogočilo nepremičninski balon in posledično
prispevalo k izbruhu finančne krize in k dimenzijam, ki jih je le-ta dosegla. Pri
obravnavi špekulacije postane očitno, da so skoraj vsi sodelovali v t.i. tržni špekulaciji.
Špekulacija se je dotaknila podjetij, investitorjev, bank, državno financiranih podjetij,
posameznikov in celotnih družin. Posledica je bila, da so špekulativni cenovni poviški
dvignili splošno evforijo in navdušenje. Ljudje se niso zavedali tveganj, ki jih s seboj
prinaša investiranje, kajti uveljavilo se je splošno prepričanje, da je mogoče z različnimi
investicijami »lahko« zaslužiti. Pomembno je razumeti, da je velika finančna kriza
ilustrirala dva principa. Prvič, doktrino prevelikih podjetij za stečaj in drugič uničila je
»pravila igre«. Zakaj je bil Bear Stearns prevelik, da propade, Lehman Brothers pa ne?
V diplomski nalogi je ugotovljeno, da so le vsi vzroki skupaj, ne samo eden,
pripeljali k tako obsežni (resni) gospodarski krizi v tridesetih letih 20. stoletja in h krizi
drugorazrednih posojil. Učinki krize drugorazrednih posojil na narodna gospodarstva in
finančne trge so podobni in primerljivi s tistimi iz krize, ki jo imenujemo velika
depresija. Vrnile so se težave, ki so bile značilne za velik del svetovnega gospodarstva v
tridesetih letih 20. stoletja. Torej razkriva se, da je velika finančna kriza podobna veliki
depresiji. Podobnosti med veliko depresijo in veliko finančno krizo je nemogoče
spregledati. Povedano drugače, podobnosti z vidika vzrokov in okoliščin, ki so
spremljale obe krizi, so presenetljive.