causes of forbush decreases and other ... of forbush decreases and other cosmic ray variations ey e....
TRANSCRIPT

CAUSES OF FORBUSH DECREASES AND OTHER COSMIC RAY VARIATIONS
E. BAROUCH L. F. BURLAGA
II 74- 3 2 2 4 5
Unclas G 3 f 2 0 46710
JULY 1971
https://ntrs.nasa.gov/search.jsp?R=19740024132 2018-06-12T15:53:06+00:00Z


CAUSES OF FORBUSH DECREASES AND
OTHER COSMIC RAY VARIATIONS
EY
E. Barouch* L , F . Burlaga
Laboratory €or Extraterrestrial Physics NASA-Goddard Space Flight Center
Greenbelt , Maryland
- _.-- *On leave from Service d'Electronique Physique, C . E . N . Saclay and C.N.R.S.
CAUSES OF FORBUSH DECREASES AND OTHER COSMIC RAY VARIATIONS
Abstract
The re la t ionship between neutron monitor va r i a t ions and the i n t e n s i t y
var ia t ions of &e in te rp lane tary magnetic f i e l d is s tudied, using Deep
River data and IMP-series s a t e l l i t e data. In over 80% of the cases s tudied
i n 1968, i den t i f i ab le depressions of the cosmic ray i n t e n s i t y are associated
w i t h magnetic f i e l d enhancements of several hours durat ion and i n t e n s i t y
above 10 gama. Conversely, each magnetic f i e l d enhancement has an
ident i l i a b l e e f f e c t (though not necessar i ly a marked depression) on the
cosmic ray in tens i ty .
consequence of the successive ac t ion of several such features . An
explanation i s presented and discussed.
Long l a s t i n g Forbush decreasesare found t o be the
- 2 -
1. Introduction
Sharp temporary decreases of the ga l ac t i c cosmic r ad ia t ion of
durat ion several days and amplitude of a few percent have been observed
and s tudied f o r many years.
Sandstrom (1965) and Quenby (1967), and recent work has been sumnarized by
Cini-Castagnoli (1973). Although it i s general ly agreed t h a t these
Forbush decreases are caused by magnetic f i e l d va r i a t ions associated with
in te rp lane tary disturbances, t he re remains considerable disagreement as
t o t h e configuration responsible. For example, among those considered are
(1) Intense magnetic f i e l d s i n a b o t t l e conf igu ra t im (Gold, 1959),
(2) High magnetic f i e l d s created by a shock wave (Parker, 1963) (3) A
s ing le d iscont inui ty of la rge extent (Quenby, 1971; Barnden, 1973a)
(4) Irregularities i n t h e magnetic f i e l d (Morrison, 1956; Parker, 1963;
L a t e r , e t al., 1962) and ( 5 ) A series of d i r ec t iona l d i scon t inu i t i e s
(Barnden, 1973b). In most previous papers only a few events, usua l ly those
with very la rge i n t e n s i t y depressions, a r e considered.
consider A1 cosmic ray depressions with a scale of a day o r more and seek
a c0rmY)n c a w e t o a l l events, It is found t h a t f o r t h e period analysed
(1967-1968) each Forbush decrease r e s u l t s from the passage of a region i n
whlch the magnetic f i e l d i n t e n s i t y i s high - a magnetic blob, o r simply,
a blob. We advance the hypothesis t ha t each blob drags
cosmic ray i n t e n s i t y behind it. Conversely, every magnetic blob e i t h e r
depresses the cosm€c ray i n t e n s i t y or, i n the case of two successive
blobs, decreases the recovery rate. Most, but not a l l , high f i e l d regions
occur at the leading edge of high speed streams, and can be explained by
in te rp lane tary plasma dynamics.
The f i e l d has been reviewed by Lockwood (1971),
I n t h i s paper w e
a wake of low
Both coro ta t ing streams and f1a:e-associated
I','X%DING PAGE BLANK NOT FILMED

- 3 -
streaxrs give r i s e t o f i e l d configurat ions causing Forbush decreases, but
i t seems tha t the l a rges t F.D.'s a r e the r e s u l t of s t rong compressions
ahead of fast, f la re -assoc ia ted streams.
Although the r e l a t i o n described above between cosmic ray i n t e n s i t y
and magnetic blobs i s bas i ca l ly simple and very genei-al, a t times the
phenomena may present a complex appearance. For t h i s reason, av i n
order t o i l l u s t r a t e t he bas i c concepts involved, w e begin i n Sect ion 3
with a de t a i l ed discussion of a simple type of cosmic ray decrease.
Sect ion 4 discusses a l l C.R. depressions during 1968 and relates the- t o
the corresponding magnetic f i e l d i n t e n s i t y va r i a t ions poss ib le models f o r these
events. Sect ion 5 descr ibes and i n t e r p r e t s mor2 complicated types of Forbush
decreases.
was very dis turbed and recoveries were very sl. :. plasma da ta are a l s o used t o show t h e r e l a t ionsh ip between the primary
cause, the in te rp lane tary s o l a r wind va r i a t ions , i t s e f f e c t , t he magnetic
f i e l d va r i a t ions , and t h e cosmic ray e f f e c t caused by the magnetic f i e l d .
2. Data: Source and Treatment
Sect ion 6 dea ls with a period when the in t e rp l ane ta ry medium
F i n a l l y i n Sect ion 7
The r e s u l t s t o be presented in later sec t ions are der ived from daLa
from th ree sources; neutron monitors at ea r th , satell i te measurements
of the in te rp lane tary magnetic f i e l d , and s a t e l l i t e measurements of t he
in te rp lane tary plasma.
must be overcome before meaningful re la t ionships can be found.
problems are discussed below.
For each of these da t a sets c e r t a i n problems
These
Neutron Monitor Data. As we Fished t o include small amplitude
Forbush decreases i n our s tudy, we were l e d t o remove t h e d iurna l
va r i a t ion from t he neutron monitor time record. This can be done i n
two ways: e i t h e r one averages over a number of s t s t i o n s or one uses
numerical f i l t e r i n . xhniques over a s ing le s t a t ion . Each of these
methods presents i ts own p a r t i c u l a r advantages.
numerical f i l t e r i n g of t he da t a From a s i n g l e s t a t i o n was simpler and
We have found t h a t

- 4 -
more convenient f o r our purpose, while consen ing the e s s e n t i a l
cha rac t e r i s t i c s w e wished t o display.
been previously described (Barouch, 1965). The major disadvantage of
t h i s mechod is i t s dependence on the p a r t i c u l a r d i r ec t iona l proper t ies
of t he s t a t i o n , which combines with the an iso t ropic character of the
decrease t o g ive d i f f e ren t F.D. p r o f i l e s from d i f f e r e n t s t a t ions , as
discussed by Lockwood (1971), f o r instance. This e f f e c t must be kept
i n mind when comparing the de t a i l ed timd h i s t o r y of t h e magnetic f i e l d
and cosmic ray in t ens i ty , as it leads t o an uncer ta in ty of a few hours
on the onset t ime .
t o l i m i t the maximum rate of va r i a t ion of t he smoothed data. These
disadvantages are of secondary importance i n t h i s paper.
da t a used i n t h i s paper, then, w i l l be smoothed Deep River neutron monitor
data. The main fea tures we are in t e re s t ed i n are vaz ia t ions with a time
constant of the order of one day.
va r i a t ions are not always very prominent.
treatment one s t e p fu r the r , and performed a crude numerical d i f f e r e n t i a t i o n
of t he da t a by simply taking the d i f fe rence between consecutive da t a
po in t s of the smoothed data.
of t he r e su l t i ng time series, and normalised, sbtaining the logarithmic
der iva t ive by dividing t h i s quant i ty by the cor,l.esponding C . R . i n t ens i ty ,
so t h a t a p o s i t i v e der iva t ive corresponds t o a Forbush decrease.
The f i l t e r i n g technique used has
Another e f f e c t of t he smoothing technique used is
Most of t he
Even i n t h e smoothed da ta these
We have therefore ca r r i ed t h e
For e s t h e t i c reasons w e changed the s ign
Magnetic Field. To relate the cosmic-ray i n t e n s i t y time p r o f i l e ,
N ( t ) , with t h e magnetic f i e l d t i m e p r o f i l e B ( t ) , one
- 5 -
obviously needs continuous t i m e series f o r both B ( t ) and N ( t ) measured
at the same point . So as t o get a t i m e series f o r B ( t ) near ear th with as
few data gaps as possible da t a from GSFC instruments aboard Explorer 28,
33, 34 and 35 were combined. One hour averages are used fo r the magnetic
f i e l d it..rIIlputed from the averages of t he f i e l d components.
I n order t o determine the nature of a blob, i .e. whether it is
coro ta t ing o r not , i t is necessary t o have simultaneous measurements from
another spececraf t at some dis tance from the ear th .
averages, the coro ta t ion t i m e delay must be at least a few hours, say
ten hours, i f w e are t o resolve it. On the o ther hand, t he separat ion
must not be too grea t , f o r fea tures can evolve appreciably i n ten
hours, B e corotat ion rate is approximately 0.5 deglhr, corresponding t o
angular separat ions between 20' and 40'. Such da ta are ava i lab le from
the GSFC and GSFCIRome experiments aboard Pioneer 7 and 8 f o r January-
February 1967 and June-December 1968 respect ively,
These are times when w e have good coverage of B(t) both at Pioneer and a t
ear th .
Since w e use hourly
Plasma Data . To study the formation mechanism of the blobs w e need
plasma da ta giving at least the bulk speed, and preferably a l s o the proton
densi ty and temperature, i n addi t ion t o the da t a mentioned previously.
During the period June-December 1967, t h e GSFC instrument aboard Explorer
34 was monitoring the s o l a r wind almost continuously a t a t i m e when
measurements of B(t) were avai lable . This a l s o happens t o be a very

- 6 -
disturbed period with an except ional ly la rge number of streams.
used three hour averages f o r t he plasma parameters measured aboard
Explorer 34.
3. Simple Forbush Decreases
We have
By a simple C . R . decrease w e mean a smooth, defin+.Le decrease followed
by a smooth recovery t o the o r ig ina l i n t ens i ty .
rare . An event displaying some of these c h a r a c t e r i s t i c s i s the event of
February 3 - February 13, 1967, which i s shown i n Figure 1.
began on February 2nd, more o r less coincident with t h e a r r i v a l of an
extensive magnetic blob marked A. The passage of t h i s f ea tu re l a s t e d
approximately 7 days, and the C.R. i n t e n s i t y decreased throughout t h i s
in te rva l . As soon as it passed, die C.R. i n t e n s i t y began t o recover, and
the recovery l a s t ed f o r about 7 days, during which no l a rge magnetic
blobs were observed. This event was not associated with a shock o r a
large f l a r e .
Such events are r a t h e r
The decrease
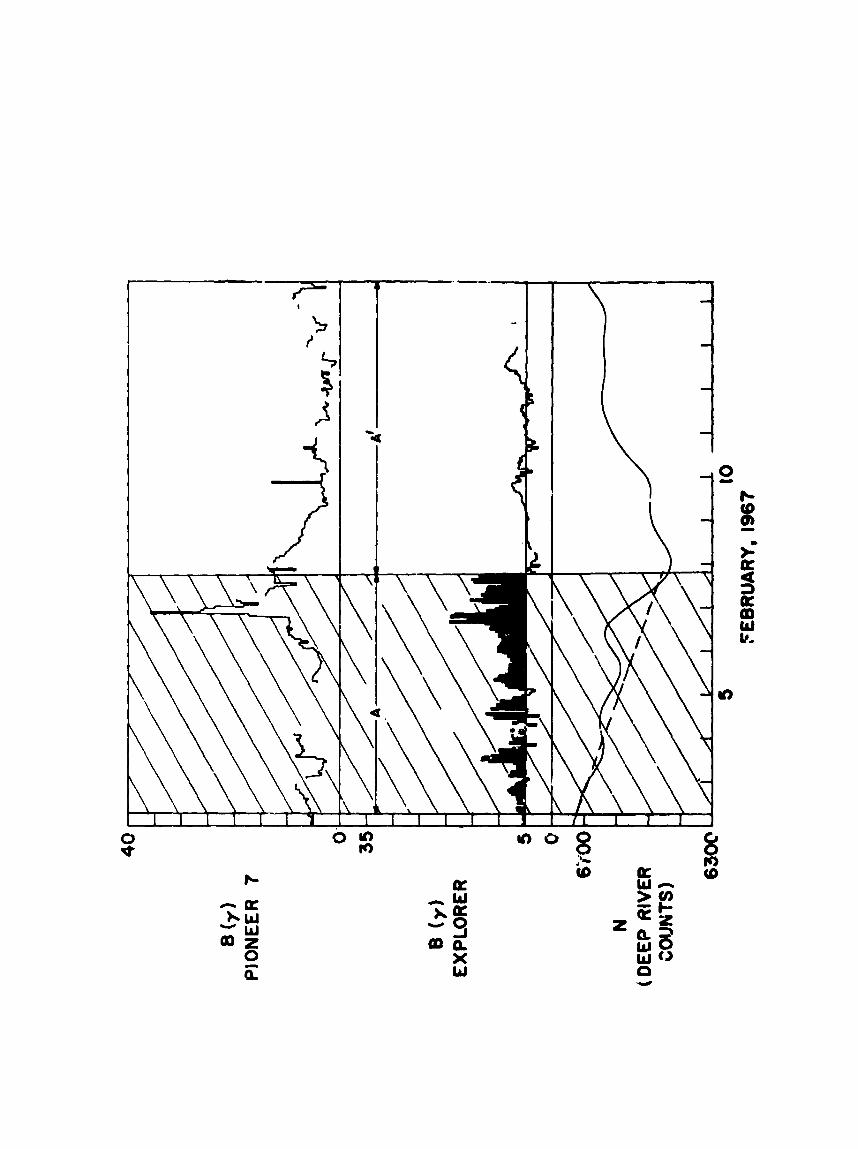
An example of a more c l a s s i c a l Forbush decrease i s shown i n
Figure 2. This the well-known event of February 15, 1.967 which nas
been extensively studied. Hirshberg e t al . (1970) showed :hat t t e high
f i e l d region followed a shock associated with a 3+ f l a r e a: E l l ' and
found t h a t it was followed by a region of high He/l' r a t i o , which they
considered t o be the f ron t of a p is ton , Pioneer 7 was monitoring the
magnetic f i e l d at 25'ahead of ea r th a t d . 1 A.U., but saw a broad region
of high f i e l d s r a the r than a spike (Fig. 2 ) . Scudder and Burlaga (1974)
showed tha t the geometry was probably such t h a t the f l a r e ejecta which
passed the ea r th a t 0' could have or iginated frDm t h e f l a r e s i t e a t 10%
but probably were not of su f f i c i en t angular ex ten t ( 30' at 1 A.U.) t o
- 7 -
reach Pioneer 7. A magnetic b o t t l e associated with t h i s event w i l l be
described i n a l a t e r publ icat ion (Barouch and Burlaga, t o be published).
Despite these differences from the event discussed i n the preceding
paragraph, one sees the same correspondence between the C.R. p r o f i l e
and the magnetic f i e l d in t ens i ty ; the decrease occurs during the passage
of an intense magnetic blob, marked A i n Figure 1. For 9 days a f t e r the
passage of t h i s fea ture , the magnetic f i e l d i n t e n s i t y i s r e l a t i v e l y low
and the C.R. i n t e n s i t y recovers. This recovery is not smooth, because
i t i s interrupted b r i e f l y by the passage of small blobs.
observations are cons is ten t with our model. The smoothed da ta shown here
smear out an important d e t a i l discussed by Barnden (1973a) G, t h a t the
decrease occurred i n two s t eps , t he f i r s t coincident with the passage
of a shock and the magnetic
t i m e t h a t the heliulll "piston" boundary passed, when the magnetic f i e l d
in t ens i ty decreased. This second decrease i s perhaps due t o en t ry i n t o
a magnetic b o t t l e , with closed f i e l d l i n e configurat ions, s ince B i s not
high i n the bo t t l e . These e f f e c t s are not resolved i n the da t a handling
technique w e use.
fo r decreasing cosmic ray in t ens i ty , but as we s h a l l show, magnetir blobs
are probably the major cause of most C.R. decreases.
Again, the
blob behind i t , and the second near t he
It may w e l l be t h a t there i s more than one mechanism
In the two examples above, there i s a rough coincidence between
the beginning of the cosmic ray decrease and t h e beginning of the increaFie
i n B; s imi l a r ly the mizimum flu:; i s reached approximately at the end of
the blob.
of almost a l l the cosmic ray events studied.
This w i l l be show t o be a general and important cha rac t e r i s t i c

- 8 -
The thickness, o r r ad ia l cross-seci ion, c 'he blot which cause
On February 7, 1967 the blob i s about 1 :osmic ray decreases var ies .
A.U. i n thickness, whereas on February 15 i t s thickness i s 0.2 A.U. There
appears t o be a corresponding va r i a t ion i n the in t e rva l over which the cosmic
ray in t ens i ty decreases, February 15, being very abrupt while February 3,
is much l e s s so. As has been noted i n t h e introduct ion, t he use o f a s ingle
neutron monitor may introduce some uncertainty i n the time sca les involved,
so tat care must be exercised i n carrying t h i s co r re l a t ion too f a r , but
the general e f f e c t is probably real.
4 . General Cause of Large C.R. I n t ens i ty Decreases
L e t us consider the r e l a t i o n between the in te rp lane tary magnetic
f i e l d i n t e n s i t y measured near ear th and C.R. ' in tensi ty measured by the
Deep River neutron monitor during 1968, a period of moderate ac t iv i ty .
In order t o iden t i fy with ob jec t iv i ty the C.R. i n t e n s i t y decreases, w e
use the logarithmic der iva t ive of t he smoothed neutron monitor datL, as
described i n Section 2.
der iva t ive , below 0.1 percent/hour, may be due t o s ta t is t ical f luc tua t ions
Very small f lur tua t ions i n the logarithmic
res idua l d a i l y var ia t ion ,or the round of f e r r o r s of our f i l t e r i t l g
technique, and w e consider only decreases ( i n our f igure , where the
negative of the logarithmic der iva t ive i s shown, peaks)above 0.1 percent/
hour.
The following conclusions can be deduced:
a). There we= 40 C.R. i n t ens i ty decreases i n 1968 s a t i s f y i n g the condition
( 1 /mdN/dt)? 0.1 percent/hour as recorded by the Deep River neutron monitor.
bj
ment of B. (B2 107). c). For s k events a comparison between B and N
Figure 3 has v e r t i c a l l i n e s drawn through these se lec ted peaks.
Only one of these 40 events was .- not associated wlth a large enharxe-
- 9 -
cannot be made because of da t a gaps in B.
events the depression i n cosmic ray f lux was associated with a region of
high magnetic f i e l d in t ens i ty .
f i e l d i n t e n s i t y regions i s general ly of the order of t he duration of the
in t e rva l during which the CR. i n t ens i ty decreases, and is much shor te r
than the recovery time, ind ica t ing tha t the lov i n t e n s i t i e s during the
recovery phase are not the consequence of immersion i n a blob, but seem
ra the r more l i k e the consequence of a Sake" of C.R. deplet ioa behind
the blob.
For 33 of t h e 34 remap-lfng
a ) . The width (duration) of t he magnetic
In view af the high cor re la t ion between the C.R. depressions and
the magnetic f i e l d enhancements, and because (aF w e s' ' show later)
it i s possible t o imagine a plaus ib le mechanism f o r .', depression by
high magnetic f i e l d s , w e conclude tha t the high f i e l d regions a r e the
cause of the C.R. decreases. Howes x, we cannot yet s t a t e t h a t it is
the high f i e l d i n t e n s i t y which causes the decrease r a the r than an
accompanying shock o r f luc tua t ions embedded i n he high f i e l d region.
Generally, the magnetic f luc tua t ions are high when B is high
(Hirshberg and Colburn, 1969; Davis et al., 1966, Sari , 1972) so t h a t it is
d i f f i c u l t t o separate the e f f e c t s of these tws fea tures , although an
inves t iga t ion i n t h i s d i r ec t ion is i n progress (Barouch and Sari, t o be
published).
The e f f e c t s of shocks can be exmined using SSC observations, s ince
an SSC is a good indica tor o f the passage of a shock (Hundhausen,
1972, Chao and Lepping, 1974). Sudden comencements during
1968 are indicated by arrows on the t i m e scale i n Figure 1.
SSC's were reported by J. Virgina Lincoln i n JGR f o r 1968. Sixteen
of these were associated w i t h C.R. decreases; four were not associated
Twenty
- 10 - with such a decrease, and only 18 of the 40 C.R. decreases could be
associated w'th an SSC.
with a C.R. dncrease, but only ha l f (-47%) of t he C.R. derreases were
associated with SSC's ,
(1960). (Some of the SSC's were not caused by shocks but t m g e n t i a l
d i scont inui t ies , as discussed i n the references) . On t h e other
hand, a l l the SSC's associated with C.R. decreases were a l so associated
with high magnetic f i e l d s . Ockam's Razor leads us t o conclude t h a t the
high magnetic f i e l d s themselves cause the C .R. ' s r a the r t h a t t he shocks.
Thus most (80%) of these "shocks" were associated
This confirms a dei;ailed study by Bachelet e t a l . ,
We now turn t o the problem of determining whether the C.R. decreases
a r e due t o corotat ing, stream-induced, blobs or t c i spher ica l ly expanding
she l l s . Observations from two widely separated spacecraf t can give clues
t o answering t h i s question.
Pioneer 8 was t o o c lose t o ear th f o r t h i s da ta t o be usefu l - t he coro ta t ion
time i s less than 15 hours. From Ju ly t o Do,cember 1968 the Lorotation
t i m e varied frcm 15 h r s t o 1.5 days. (Mariani e t - i . , l97L,present
a graph of the t r a j ec to ry and corotat ion time).
?ioneer 8 data for t h i s period shows t h a t indeed the magnetic f i e l d
in t ens i ty p r o f i l e s a t Pioneer 8 i s general ly similar i n form t o t h a t
obtained aboard Explcrer spacecraf t , but there are s ign i f i can t difzerences,
ind!.cating e i t h e r temporal evolution over times of 15-60 hours or s p n t i a l
inhomogcneities over dis tances of 6 mi l l ion t o 10 mi l l ion km.
a l so many da ta gaps which mi.ke unambiguous statements impossible, The
somew.iat subject ive r e s u l t i s as follows. There a r e 20 blobs i n t h i s
pcriod: s i x appear t o be corotat ing, s i x appear not t o be coro ta t ing ,
and i n 8 cases the data does not permit an unequivocal dctermination.
For the period Jan*JaLy thzsmgh June 196&,
A n exp I in i t i on of the
There are
Only one o f the coro ta t ing events was associated with a SSC. Thrzc of
- 11 -
the s i x non-rotating events were associated with an SSC.
tha t CR depressions a re caused by both coro ta t ing and non-corotating
magnetic blobs and only a s m a l l f rac t ion of the events are caused by
non-corotating, shock assaciated blobs.
We conclude
In other words, one does not require a shock-associated blob (as one might
expect from f lare-associated C. R. decreases) co produce a Forbush decrease,
4. A Model fo r C.R. Decreases
Our conclusion from the preceding sec t ion is t h a t a C.R. decrease is
general ly the r e s u l t of the passage of a region of h i + magnetic f i e l d
in tens i ty . Gater i t w i l l be shown t h a t most such regions are produced
i n the in te rp lane tary medium by the steepening of streams. Hmever the
presence of a stream is not a necessary condition, nor i s it necessary
tha t streams or blobs be long l ived.
a blob which has j u s t passed 1 A.U.
evolution beyond 1 A.U.
For s impl ic i ty w e s h a l l consider
”his avoids the problem of bloo
A s t he blob moves outward, i t “sweeps away the C.R. p a r t i c l e s ahe.nd
of it, by a mechanism ye t t o be elucidated. Since one only occasional ly
observes enhencements ber‘ore a Forbush decrease, it is poss ib le t h a t the
p a r t i c l e s are def lected out of the e c l i p t i c . One poss ib le def lec t ion
mechanism is a gradient d r i f t . Since the sca l e length of the cross sec t ion
of ii blob is La0.25 A.T. t o 0.5 A.U., p a r t i c l e s with r i g i d i t i e s t o up
W l O O G V can be deflected. Since the magnetic f i e l d i n t e n s i t y increases
from -5y - t o 4 0 y - t o 3@/ i n a blob, t he gradients are on the order of
10WJA.U. Such a gradient causes a d r i f t given by
3 v = ( d e ) u) /B (g x @)) - -- D I
(Northrop, 1963). Let L = ~ R where R i s the gyroradius. For a 1 Gev
proton i n a 20y f i e l d , e . 0 1 A . U . , and fo r LcO.25 A . U . , E s 5 . Noting

- 12 -
t h a t w
~ 1 2 5 .
blob advances (vO/vw=c/25 vu,
blobs w i l l e f f ec t ive ly sweep away p a r t i c l e s by gradient d r i f t s .
= eP and P = BR, where P i s the r i g i d i t y , one f inds t h a t v - This d r i f t ve loc i ty is much l a r g e r than the rate a t which the
0- I
30, where v. i s the s o l a r wind speedhso
Other
Y
mechanisms may, of course, be operating simultaneously.
One should study the number of p a r t i c l e s a f fec ted i n t h i s way. This
depends i n p a r t on the d i s t r ibu t ion of perpendicular ve loc i t i e s ,
previous t o the passage of t he blob, and on the p a r t i c u l a r configurat ion of
f i e l d gradients i n the blob.
analyze t h i s complex question.
blob moves r a c i a l l y outwards from t h e Sun it leaves a "wake" o r region
We have not attempted t o
Qual i ta t ive ly , w e can say t h a t as the
of depressed cqsmic ray in tens i ty . For the configurat ion shown i n
Figure 4 t h i s wake is confined t o the dis turbed region. One can
present arguments from two d i f f e r e n t viewpoints t o explain why the wake
f i l l s up slowly.
I f one takes t h e viewpoint t h a t there are numerous irregularities
along the f i e l d l i n e s then w e know t h a t the cosmic rays w i l l tend t o
while t he blob - - D / t D i f f 2 Diff c lose the wake at the d i f fus ion rate, v
advances a t speed vu.
corresponding t o a wake length of 1 A.U., and the azimuthal extent of
The recovery t i m e i s typ ica l ly a feu days,
the blob a t 1 A.U. i s a l so 1 A.U.; so the observed geometry implies
t Diff
c m sec a0 an order of
where t 2 tDi f f t = vw. Thus D
vu, x 1 W - 6x10
N D t h a t v
1 A.U./vW. ' h i s gives D
i.e. - 20 2 tDiff Diff Z' vu'
magnitude estimate fo r the d i f fus ion coef f ic ien t near 1 A.U. This agrees
reasonably well with the accepted value of t he d i f fus iop coe f f i c i en t obtained
- 13 -
from f l a r e events, magnetic power spec t ra ca lcu la t ions , etc.
I f one takes the opposite viewpoint of ad iaba t ic motion of cosmic
rays between l a rge angle sca t t e r ing in te rac t ions , the p i c tu re i s some-
what d i f f e ren t . In t h i s representat ion, the C.R. i n t e n s i t y at any point
A along a f i e l d l i n e is the sum of th ree par t s . One p a r t i s cosmic rays
coming from the anti-sunward d i rec t ion .
gone pas t the point A and mirrared i n the converging magnetic f i e l d , and
are now returning t o A.
have been sca t t e red on t o t h e f i e l d l i n e from other f i e l d l i n e s , c lose t o
the sun where the f i e l d s are too dis turbed f o r t he ad iaba t ic approximation
t o hold.
Another i s cosmic rays which have
The t h i r d p a r t cons i s t s of p a r t i c l e s which
From the moment of formation of the blob the C.R. i n t e n s i t y behind t h e
blob is sealed of f from fu r the r i n j ec t ion except f o r t h e p a r t s ca t t e r ed
across the s o l a r surface a t the foot of the f i e l d l i ne . Thus as the blob
m v e s outward the C.R. dens i ty behind it should continue t o decrease
indef in i te ly . "hat t h i s doas not happen indica tes t h a t presumably d i f fus ion
across the so l a r surface is f a i r l y important, o r t h a t the blob loses i t s
effect iveness as a b a r r i e r with the passage of time.
Fina l ly a word should be sa id about t he e f f e c t of successive blobs.
The p a r t i c l e s remaining a f t e r a blob has def lec ted some of t h e p a r t i c l e s
away are of higher than average r i g i d i t y , since It de f l ec t s the l a w r i g i d i t y
p a r t i c l e s more e f f i c i e n t l y . f i u s , a second, i den t i ca l i n a l l respec ts t o
the f i r s t should cause a much smaller i n t e n s i t y depression.
6 . Complex Events and Events with Long Recovery Times
Figure 5 shows a s ing le cosmic ray i n t e n s i t y depression l a s t i n g from
August 30 t o SeDtember 27, 1968. Close inspect ion of t h e f igu re shows
- 14 -
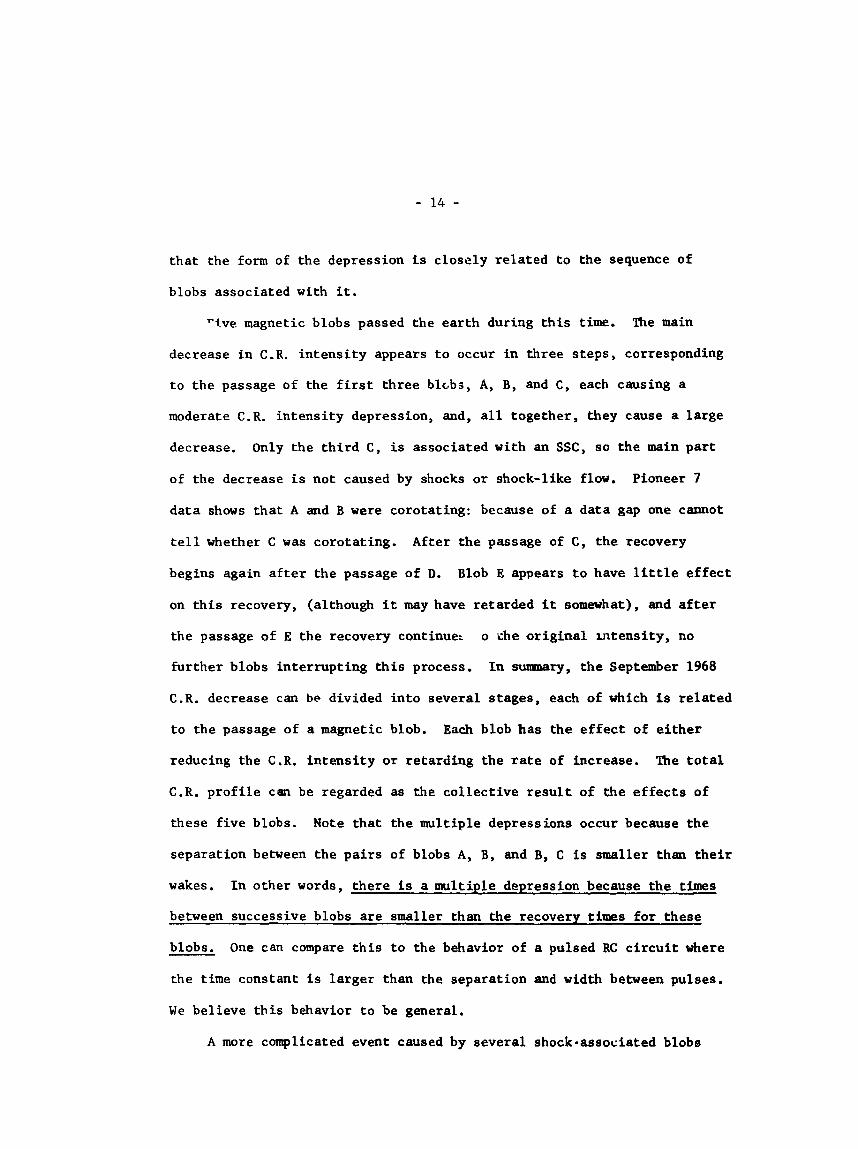
t h a t the form of the depression i s c lose ly r e l a t ed t o the sequence of
blobs associated with it.
Fi-ve magnetic blobs passed the ea r th during t h i s t i m e . The main
decrease i n C.R. i n t e n s i t y appears t o occur i n three s teps , corresponding
t o the passage o f the f i r s t t h ree blcbs, A, B, and C , each causing a
moderate C.R. i n t ens i ty depression, and, a l l together , they cause a la rge
decrease. Only the t h i r d C , i s associated with an SSC, so t he main p a r t
of the decrease i s not caused by shocks or shock-like flow.
da t a shows t h a t A and B were corotating: because of a da ta gap one cannot
Pioneer 7
t e l l whether C was corotat ing. After t h e passage of C, t he recovery
begins again a f t e r the passage of D.
on t h i s recovery, (although it may have retarded i t somewhat), and a f t e r
Blob E appears t o have l i t t l e e f f e c t
the passage of E t he recovery continue: o che o r i g i n a l i n t ens i ty , no
fu r the r blobs in te r rupt ing t h i s process. I n summary, t h e September 1968
C.R. decrease can be divided i n t o several s tages , each of which is r e l a t ed
t o the passage of a magnetic blob.
reducing the C.R. i n t e n s i t y o r re ta rd ing the rate of increase.
C.R. p r o f i l e can be regarded as the co l l ec t ive r e s u l t of the e f f e c t s of
Each blob has the e f f e c t of e i t h e r
The t o t a l
these f i v e blobs. Note t h a t the mult iple depressions occur because the
separat ion between the p a i r s of blobs A, B, and B, C i s smaller than t h e i r
wakes. I n other words, t he re i s a mult iple depression because the times
between successive blobs are smaller than the recovery times f o r these
blobs. One can compare t h i s t o the behavior of a pulsed RC c i r c u i t where
the t i m e constant i s l a rge r than the separat ion and width between pulses.
We bel ieve t h i s behavior t o be general.
A more complicated event caused by several shock-associated blobs

- 15 -
i s shown i n Figure 6. The sudden comnencements which w e assume are due
t o shocks, a r e indicated by arrows on the abscissa.
shows 8 l a rge decreases; a l l are associated v i t h blobs, and s i x follow
shocks, I n addi t ion, there a r e two blobs which do not cause CR decreases,
de tec tab le i n our da t a handling scheme, but these occur during the recovery
of the l a rges t depression.
described give a na tu ra l phenonenological descr ipt ion of t h i s complex
event.
The der iva t ive of N
Again, the basic concepts which w e have
Long Recovery Times. Lockwocd (1971) i n h i s review paper s t rcoaes
the pa r t i cu la r d i f f i c u l t y of explaining Forbush decreases with very long
recovery times (210 days). Here w e show how such C .R. decreases are a
na tura l consequence of our model, f o r ce r t a in in te rp lane tary magnetic
f i e l d configurations.
A cosmic ray decrease with a recovery time of 23 days, between
November 21, 1967 and December 15, 1967, i s shown i n Figure 7 , where
the Deep River neutron monitor da ta are shown together with the
Explorer magnetic f i e l d data.
at once evident: t he re i s a steady succession of blobs throughout most
of t h i s time in t e rva l , and these blobs follow c lose ly on the hee l s of
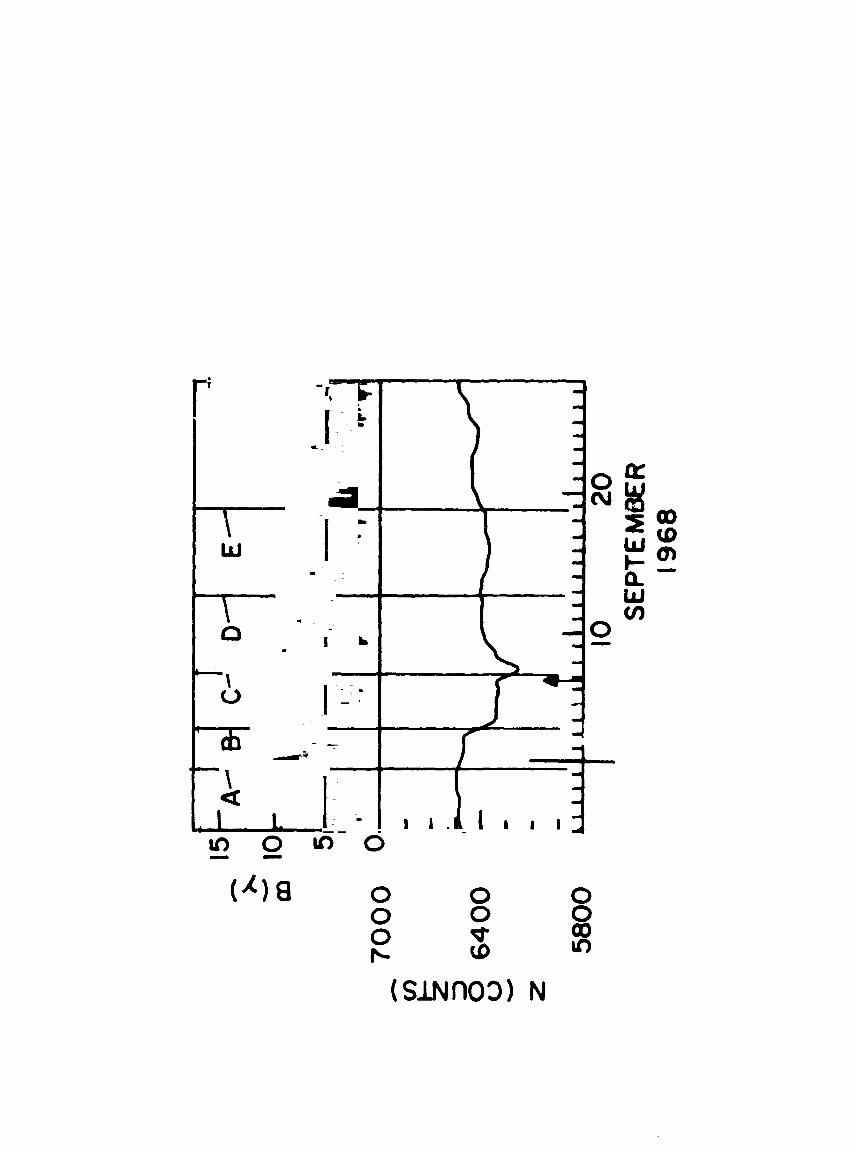
one another. Further i n s igh t i s gained by examining the p r o f i l e s i n more
d e t a i l . Five regions a re iden t i f i ed i n Figure 8 l abe l led A, B, C , D, and
E.
i s unfortunstely a da ta gap.
A , B a r r ives and causes a small decrease. This i s followed i m e d i a t e l y
by a la rge , irregular blob which again prevents a recovery, even causing
the in t ens i ty t o decrease somewhat fur ther .
l%e reason fo r t he long recovery t i m e is
The C.R. decrease begins abrupt ly with the a r r i v a l of A, where there
Before the C.R. i n t e n s i t y can recover from
- 16 -
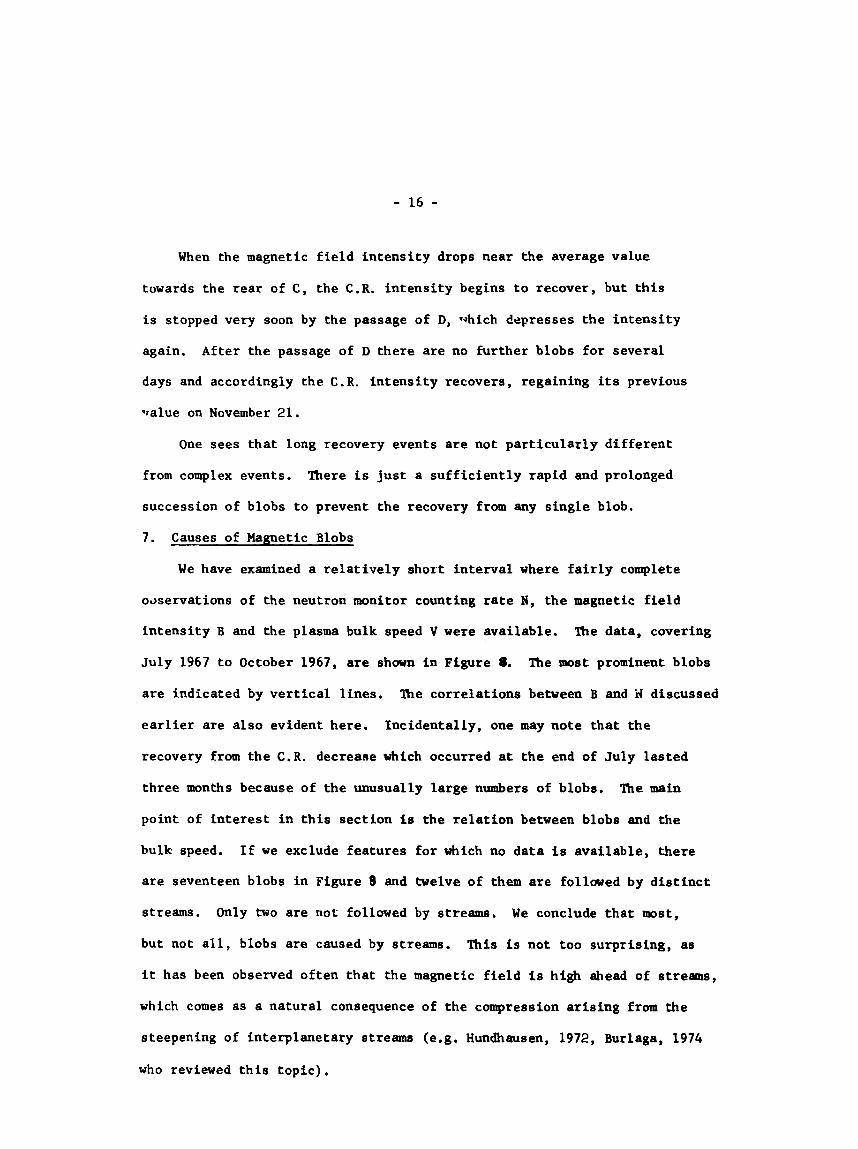
When the magnetic f i e l d i n t e n s i t y drops near the average value
towards the rear of C , the C.R. i n t e n s i t y begins t o recover, but t h i s
is stopped very soon by the passage of D, vahich depresses the in t ens i ty
again.
days and accordingly the C. R. i n t e n s i t y recovers, regaining its previous
lralue on November 21.
After the passage of D there are no fur ther blobs f o r several
One sees t h a t long recovery events a r e not p a r t i c u l a r l y d i f f e ren t
There is j u s t a s u f f i c i e n t l y rapid and prolonged from complex events.
succession of blobs t o prevent t he recovery from any s ing le blob.
7. Causes of Magnetic Blobs
We have examined a r e l a t i v e l y shor t i n t e rva l where f a i r l y complete
oaservations of the neutron monitor counting rate N, t h e magnetic f i e l d
in t ens i ty B and the plasma bulk speed V were avai lable .
Ju ly 1967 t o October 1967, are shown i n Figure S.
are indicated by v e r t i c a l l ines .
earl ier a re a l s o evident here.
recovery from the C.R. decreaae which occurred at t h e end of Ju ly l a s t ed
three months because of t h e unusually la rge numbers of blobs. me main
point of i n t e r e s t i n t h i s sec t ion is the r e l a t i o n between blobs and the
bulk speed.
are seventeen blobs i n Figure 8 and twelve of them a r e follawed by d i s t i n c t
streams.
but not a l l , blobs are caused by streams.
i t has been observed of ten t h a t t he magnetic f i e l d i s high ahead of streams,
which comes as a na tura l consequence of t he compression a r i s i n g from the
steepening of in te rp lane tary streams (e.g. Hundhausen, 1972, Burlaga, 1974
who reviewed t h i s t op ic ) ,
'he data , covering
The most prominent blobs
The cor re la t ions between B and H discussed
Inc identa l ly , one may note t h a t t he
I f we exclude fea tures fo r which no da ta is available, there
Only two are not followed by streams. We conclude t h a t most,
This i s not too surpr i s ing , as

- 17 -
There a r e perhaps other in te rp lane tary phenomena which can give rise
t o these features .
massive e j ec t ion of magnetised material from the sun, and b o t t l e configuration.
We propose t o study some of these p o s s i b i l i t i e s i n another paper, but w e
must stress here t h a t i t seems l i k e l y t h a t the most frequent phenomenon,
a t lezst i n the p a r t of t he s o l a r cycle which w e s tudied, is t he stream
steepening mechanism. For the years 1967-1968 a preliminary inves t iga t ion
has s h m t h a t only four or f i v e candidates’ f o r bo t t l e - l i ke configurations
are l i k e l y - although w e were not using as complete a set of plasma
observations as one could hope for .
with Forbush decreases, and may be considered probably as t h e next important
blob generator.
blobs o r Forbush decreases, although some noteworthy exceptions have been
found i n t h e da t a set s tudied ( in f a c t w e have magnetic f i e l d angular da t a
f o r a l l the t i m e i n t e rva l s presented i n t h i s paper, and have not presented
Some p o s s i b i l i t i e s which come t o mind a r e driven shocks,
Shocks are indeed of ten associated
Sector boundaries are not i n general associated with e i t h e r
it i n the i n t e r e s t of keeping the f igures as clear as possible) .
8. Conclusions
Evidence has been presented conclusively showing the assoc ia t ion
regions of high magnetic f i e l d with cosmic ray i n t e n s i t y depressions.
of
The
hypothesis t ha t these depressions are caused by the magnetic blobs has been
shown t o explain complex Forbush decreases and long-lived depressions i n
a qua l i t a t ive way i n those cases examined.
i s achieved has not been unambiguously iden t i f i ed , although w e f e e l t h a t
our preliminary model presents several a t t r a c t i v e features.
The mechanism by which t h i s
Further ins ight i n t o the Forbush decrease phenomenon may be achieved
i n a number of ways, some of which are under inves t iga t ion i n t h i s laboratory.
- 18 -
Fundamentally, two di rec t ions may be pursued: the study of the extent and
proper t ies of magnetic blobs, and the de t a i l ed study of cosmic ray phenomena
associated with the Forbush decreases.
Prec ise quan t i t a t ive predict ions of the i n t e n s i t y of the decrease,
t i m e constants of the decrease and recovery phase, and anisotropy proper t ies
of the F.3. phenomenon cannot, i n our view, be made without a f u l l three-
dimensional mapping of the magnetic f i e l d i r l tensi ty i n the v i c i n i t y of
ear th . It does not seem possible t o achieve t h i s in the near future .
We hope t o obtain some b e t t e r idea of t he gross fea tures of the magnetic
f i e l d configurations from three sources: multi-space c r a f t observations,
t heo re t i ca l predict ions of in te rp lane tary dynaniics, and, i nd i r ec t ly , from
the study of the path of moving type I11 burs t s throughout the so l a r system. Such
da ta should be ava i lab le with the next year o r two.
of the decrease may l i e i n the study of the d i r ec t iona l anisotropy as a
function of t i m e i n those cases where the geometry can be a t least roughly
estimated - i so l a t ed blobs observed by two or more spacecraft .
ixp l ica t ions regarding the anisotropy inherent i n our model have not been
worked out as yet and fu r the r work on t h i s is i n progress.
'fie key to the mechanism
m e
The general t hes i s presented i n t h i s paper allows us t o make some
predict ions as t o the r i g i d i t y dependence of F.D.'s.
of a complex F.D. caused by a succession of blobs should vary markedly
from the f i r s t t o the second blob passage.
the harder the r i g i d i t y dependence should be.
telescope da ta set we were unable t o v e r i f y these predict ions.
The r i g i d i t y dependence
The higher the f i e l d i n the blob
As w e do not have a meson
It is c l e a r t h a t the type of s t r u c t u r e of' t he in te rp lane tary magnetic
f i e l d here revealed implies important e f f e c t s i n other cosmic ray phenomena

- 19 -
besides the Forbush decreases.
rays w i l l surely move about differently in an ensemble of b lobs such as i s
depicted here than in the usual homogeneously turbulent magnetic Eield
assumed in the current theories of cosmic ray propagation.
These cannot be detailed here, but cosmic

- 20 -
Acknowledgments
One of us (E.B.) i s indebted to the National Academy of Sciences for
a Senior Research Associateship at NASA, and t o N. F . Ness for h i s kind
hospitality at the Laboratory for Extraterrestrial Physics of NASA Goddard
Space Flight Center. Programming assistance by G. Burgess. D. Howell,
W . Mish and F. Ottens i s gratefully acknowledged.

Figure Captions
Figure 1
Figure 2
Figure 3
Figure 4
Figure 5
Figure 6
Figure 7
Figure 8
Hourly averages of the smoothed neutron monitor da ta and
magnetic f i e l d i n t e n s i t y a t ea r th and Pioneer 7 respect ively - Feb. 3-15.
As i n Figure 1, Feh. 16-22.
Hourly averages of the smoothed Deep River neutron monitor
data, logarithmic der iva t ive of t h i s curve, and magnetic
f i e l d in t ens i ty c lose t o ea r th as measured by Explorer
s e r i e s spacecraf t .
Ideal ised magnetic blob, (black region) moving r a d i a l l y
outward with ve loc i t i e s ind ics ted by the arrows.
hypothetical s p i r a l magnetic f i e l d l i n e s are shown. The
dots represent the conjectured cosmic ray in tens i ty .
Five successive magnetic blobs and t h e i r e f f e c t on the
smoothed neutron monitor in tens i ty .
Complex Forbush decrease showing the e f f e c t of a succession
of blobs.
t he neutron monitor i n t e n s i t y t racks the magnetic f i e l d
qu i t e c losely.
A very long-lived Forbush-like decrease caused by four
magnetic blobs of long duration.
Three hour averages of the plasma bulk ve loc i ty , one hour
averages of the magnetic: f i e l d i n t e n s i t y and smoothed
neutron monitor data, i l l u s t r a t i n g the formation of blobs at
the head of high-speed streams.
Two
The negative of t he logarithmic der iva t ive 02
References
Bachelet, F. , P. Balata, A. M. Conforto, and G. Marini, The Cosmic Ray
Events and Their Correlat ion with the Geomagnetic Events. Nuovo Cim.
l.6, p.292-320, 1960.
Barnden, L. R. , Forbush Decreases 1966-1972: Their Solar and In te rp lane tary
Associations and Their Anisotropies. 13th In t . Cosmic Ray Conf. Vol 2,
p. 1271-1276 , Denver , 1973a.
Barnden, L. R., The Large-scale Magnetic Field Configuration Associated
with Forbush decreases, Proc. 13th In t , Cosmic Ray Conf. Vol. 2,
p. 1277-1282, 1973b.
Barouch, E., Une Methode de Representation des mregis t rements de Rayons
cosmiques, J. Phys. (Par i s ) , 26, p.241A-243AY 1965.
Burlaga, L. F., In te rp lane tary Streams and t h e i r In te rac t ion with the
Earth, t o be published, 1974.
Chao, J. K., and R. P. Lepping, A Corre la t ive study of SSC's, In te rp lane tary
Shocks, and Solar Act iv i ty , J. Geophys. Res., 79, 1799, 1974.
Cini-Castagnoli, G . , Modulation of Galactic Cospic Rays, 13th In t .
Cosmic Ruys Conf. Vol. 5, p.3706-3730, 1973.
Davis, L., E. J. Smith, P. J. Coleman, and C. P. Sonet t , In The Solar Wind -' p.35, ed. R. J. Mackin, Jr., and Marcia Neugebauer (New York: Pergamin
Press) 1966.
Cold, T . , P l a s m and Magnetic F ie lds fn the Solar System, J. Geophys. Res.,
- 64, 1665, 1959.
Hirsnberg, J. and D. S. Colburn, In te rp lane tary F4.eld and Geomagnetic
Variations - A Unified V i e w , Planet. Space Sci . , l7, 1183, 1969.
Hirshberg, J., A. Alksne, D. S. Colburn, S. J. Bane., and A. J. Hundhausen,
Observation of a Solar Flare Induced In te rp lane tary Shock and Hel ium
Enriched Driver Gas, J. Geophys. Res., 75, 1, 1970.
Hundhausen, A. J., Coronal Expansion and Solar Wind, Springer-Verlag,
New York, 1972 . Laster, H., A. M. Lenchek, and S. F. t, For&sh Dcreases Produced
by Diffusive Decel e ra t ion Mechanisz
Res., 67, 2639, 1962.
2terplane:ary Space, J. Geophys.
Lockwood, J A , , Forbush Decreases in the Cosmic Radiation, Space Science
Reviews, l2, 658, 1971.
Mariani, F., N. F. Ness and B. Bavassano, Magnetic F ie ld Measurements by
Pionecr 8.
t o December 7, 1968 (Bar t e l ' s Solar Rotation 1839 t o 1851), PLS prepr in t
LPS 71-22, 1971.
I. Hourly Averages of the Field Elements from December 23, 1967
Morrison, P., Solar Oribin of Cosmic Ray Time Variations, Phya. Rev.,
1397, 1956.
Northrop, T. G., The Adiabatic 'rbtion of Charged P a r t i s l z s , Interscience,
New York, 1963.
Parker, E. N . , In te rp lane tary Dynamical Processes, Interscience, New York,
1963.
Qutnby, J. J., Handbook of Physics, XLVI/2, 310, 1967.
Quenby, J. J., The Mechanism f o r the Forbush Decreases i n Pa r t i cu la r f o r
the Event of February 26, 1969, Proc. 12th I n t l . Conf. Cosmic Rays,
Hobart, 2, 730, 1971.
Sandstrom, A. G . , Cosmic Ray Physics, North Holland Pub. Co., h t e r d s m ,
1965.
S a r i , J. W., Modulation of Law Energy Cosmic Rays, NASA-GSE'C X-692-72-309,
1972.
Scudder, J. D., and L. F. Burlaga, EOS, 2, 413, 1974.
i

40
8 ( y ) PIONEER 7
0 35
B ( y ) EXPLORE R
5 0
6700
N (DEEP RIVER
COUNT9 ' /,* i ;
. , . I I I I I 20
FEBRUARY, 1967


.... .... .... .... .... .... .... ... .... .... .... .... .... .... .... .... .... .... .... *.*. .... .... .... .... .... .... .... .... .... .... .... .... .... .... .... .... ..I. .... .... .... .-.. .... .... . d . . ..I. .... .... .... .... .... .... .... .... .... .... .... .... .... .... .... .... .... .... .... .... .... .... .... .... .... .... .... .... .... .... .... .... .... .... .... .... .... .... .... .... .... .... .... .... .... .... .... .... .... .... .... .... .... .... .... .... ....
................................................................................................ .............................................................................................. ,........=.*...........................*..-. ....................................................... '.............................. ............................................................... .............................................................................................. .............................................................................................. .............................................................................................. .............................................................................................. .............................................................................................. ................................................................. ...................... ........................................ ~.....................*., ..................... ................................................................ ................................................................ ...................... ................................................................ ................................................................
................................................................. - . ..........................
................................................................ L L I . . . . . . . . . . . . . . . . . . . . . .
................................................................ OI- ~::::::::::::::::::::
....................
..................................... .................................... .......... '..............;.. ..................................
. . . . . . . . - e . . . . . . . . . . . . . . . . . . . . . . . .? .
...............................
............... ............................................................................................... ............................................................................................. ............................................................................................ .............................................................................................. ..,.....~..........................................~...*.~...*..............*.*..~............. .. ............................................. ....................................... ............................................................................................... ............................................................................................. ............................................................................................. ............................................................................................... .............................................................................................. ............................................................................................. ............................................................................................. .............................................................................................. ............................................................................................... ...............................................................................................
...................................................... t b.....................................e~
....................... . . . . . . . . . . . . . * . . . . . . . . . . * . . . ~ . . . . . . . . . . * . . * . . . . . . . . 8 w . - . . . . . . . O . . . * . ~ .
....................................................... \ .................................. b e ..
.................,...............,.......ow.....o.......~~...~~.o...*~.o~... ...............................................................................................
............................................................ 0.0\ . .............................. ..............
0 0 0 (c
0 0 w (D

U
n L c - 3
v) -12 m 0 0 I
0
.
dD .
- 1
I Y
m o 0 0 0 tc
n
h U
m

0
c I I 1
W
*
4 I 1 I
1 .
Y

n
0 - 0 0 0 d, (0 a
W n
Y
>
n
h m Y
Y