causes and correlates of brain atrophy - epib.nlcauses and correlates of brain atrophy a...
TRANSCRIPT

Causes and Correlates of Brain AtrophyA population-based MRI study
Tom den Heijer

Acknowledgements
The work presented in this thesis was conducted at the Department of Epidemiology &
Biostatistics of Erasmus MC, Rotterdam.
The Rotterdam Scan Study was supported by grants from the Netherlands Organisation for
Scientific Research and the Netherlands Heart Foundation. The work described in this thesis
was funded by the Netherlands Organisation for Scientific Research (grant 904-61-133).
Financial support for the study on homocysteine was provided by the EU BIOMED Demon-
stration Project, which paid for the homocysteine assays.
The author gratefully acknowledges the collaboration with the Department of Neurology of Er-
asmus MC (Prof. dr. P.J. Koudstaal), the Departments of Radiology of Erasmus MC and of the
University Hospital Groningen (Prof. dr. M. Oudkerk), the Clinical Trial Service Unit, University
of Oxford, United Kingdom (Prof. dr. R. Clarke), the Department of Internal Medicine of Eras-
mus MC (Prof. dr. F.H. de Jong, Prof. dr. H.A.P. Pols, Dr. A. Uitterlinden), the Regional Institute
for Ambulatory Mental Health (locations Brainpark Rotterdam and Haagland), and the general
practitioners participating in the Rotterdam Study and the Zoetermeer Study.
The publication of this thesis was financially supported by the Department of Epidemiology
& Biostatistics of Erasmus MC, de Internationale Stichting Alzheimer Onderzoek, stichting
Alzheimer Nederland, het Diabetes Fonds, het Remmert Adriaan Laan Fonds, Boehringer
Ingelheim B.V., Lundbeck B.V, Roche Nederland B.V., Sigma Tau Ethifarma B.V.
Cover design: Gwenda de Krijger
Jeroen Stam
Lay-out: Jeroen Stam
Tom den Heijer
Printed by: Optima Grafische Communicatie, Rotterdam
ISBN: 90-77595-19-8

Causes and Correlates of Brain Atrophy
A population-based MRI study
Oorzaken en klinische betekenis van hersenatrofie
Een onderzoek in de algemene populatie
Proefschrift
ter verkrijging van de graad van doctor aan de
Erasmus Universiteit Rotterdam
op gezag van de Rector Magnificus
Prof. dr. S.W.J. Lamberts
en volgens besluit van het College voor Promoties.
De openbare verdediging zal plaatsvinden op
woensdag 14 april 2004 om 11.45 uur
door
Tommie den Heijer
geboren te Rotterdam

Promotiecommissie
Promotoren: Prof. dr. M.M.B. Breteler
Prof. dr. A. Hofman
Overige leden: Prof. dr. M.S. Albert
Prof. dr. P.J. Koudstaal
Prof. dr. H.W.M. Steinbusch

Contents
1 Introduction 3
2 Vascular risk factors of brain atrophy on MRI
2.1 Blood pressure levels and medial temporal lobe atrophy 7
2.2 Blood pressure levels and global brain atrophy 21
2.3 Plasma homocysteine levels 33
2.4 Alcohol intake 43
2.5 Apolipoprotein E genotype 57
3 Endocrine risk factors of brain atrophy on MRI
3.1 Plasma estrogen levels 67
3.2 Estrogen receptor α polymorphisms 83
3.3 Type 2 diabetes 99
4 Clinical correlates of brain atrophy on MRI
4.1 Memory performance 117
4.2 Dementia 131
4.3 Depression 143
5 General discussion 153
Summary 171
Samenvatting 175
Dankwoord 178
Publications 181
About the author 183

Publications and manuscripts based on the studies described in this thesis
Chapter 2.1 den Heijer T, Launer LJ, Prins ND, van Dijk EJ, Vermeer SE, Hofman A, Koudstaal PJ, Breteler MMB. Association between blood pressure and atrophy of structures of the medial temporal lobe on MRI. Submitted.
Chapter 2.2den Heijer T, Skoog I, Oudkerk M, de Leeuw FE, de Groot JC, Hofman A, Breteler MMB. Associa-tion between blood pressure levels over time and brain atrophy in the elderly. Neurobiology of Aging 2003;24:307-313.
Chapter 2.3den Heijer T, Vermeer SE, Clarke R, Oudkerk M, Koudstaal PJ, Hofman A, Breteler MMB. Homocysteine and brain atrophy on MRI of non-demented elderly. Brain 2003;126:170-175.
Chapter 2.4den Heijer T, Vermeer SE, van Dijk EJ, Prins ND, Koudstaal PJ, van Duijn CM, Hofman A, Breteler MMB. Alcohol intake in relation to brain MRI findings in non-demented elderly. Submitted.
Chapter 2.5den Heijer T, Oudkerk M, Launer LJ, van Duijn CM, Hofman A, Breteler MMB. Hippocampal, amygdalar and global brain atrophy in different apolipoprotein E genotypes. Neurology 2002;59:746-748.
Chapter 3.1den Heijer T, Geerlings MI, Hofman A, de Jong FH, Launer LJ, Pols HAP, Breteler MMB. Higher estrogen levels are not associated with larger hippocampi and better memory performance. Archives of Neurology 2003;60:213-220.
Chapter 3.2den Heijer T, Schuit SCE, Pols HAP, van Meurs JB, Hofman A, Koudstaal PJ, van Duijn CM, Uitterlinden AG, Breteler MMB. Variations in estrogen receptor α gene and risk of dementia and brain atrophy on MRI. Submitted.
Chapter 3.3den Heijer T, Vermeer SE, van Dijk EJ, Prins ND, Koudstaal PJ, Hofman A, Breteler MMB. Type 2 diabetes and atrophy of medial temporal lobe structures on brain MRI. Diabetologia 2003;46:1604-1610
Chapter 4.1Hackert VH, den Heijer T, Oudkerk M, Koudstaal PJ, Hofman A, Breteler MMB. Hippocampal head size associated with verbal memory performance in nondemented elderly. NeuroImage 2002; 17:1365-1372.
Chapter 4.2den Heijer T, Geerlings MI, Hoebeek FE, Hofman A, Koudstaal PJ, Breteler MMB. Hippocampal and amygdalar atrophy predict dementia in cognitively intact elderly. Submitted.
Chapter 4.3den Heijer T, Tiemeier H, Koudstaal PJ, Hofman A, Breteler MMB. Hippocampal, amygdalar and frontal atrophy and the risk of incident depression in late life. Submitted.

Chapter 1
Introduction


Introduction
3
In 1906, Alois Alzheimer described for the first time a form of dementia that later became
known as Alzheimer’s disease.1 At necropsy, he had observed that the brain of a 51-year-old
woman with progressive cognitive decline was filled with –at that time still anonymous– amy-
loid plaques and neurofibrillary tangles. Since then, numerous investigators saw in patients
with dementia the same pathological findings that Alzheimer had seen. Clinically, Alzheimer’s
disease is recognized by a long period of progressive cognitive decline. Braak and Braak
showed in the late eighties that the accumulation of plaques and tangles in the brain follows
a predictable pattern over time that parallels this cognitive decline.2 In their now widely ac-
cepted staging system, they identify a long phase where the medial temporal lobe is the first
area to be afflicted whereas only in the later disease stages the pathology involves the iso-
cortices. However, recent pathological studies show that brains of elderly patients, unlike the
middle–aged patient that Alzheimer had observed, who in life receive a diagnosis of Alzhei-
mer’s disease have a rather mixed bag of brain pathology. Not only the traditionally recognized
amyloid plaques and neurofibrillary tangles are observed but also cerebrovascular disease is
found which could have contributed to the cognitive decline.3
The search for causes of Alzheimer’s disease is hampered by its long preclinical period and
the pathological diversity that contribute to clinical symptoms of Alzheimer’s disease. Environ-
mental or physiological factors that are present at time of a clinical diagnosis of Alzheimer’s
disease may not have effectuated the brain damage in the preclinical period. Furthermore, dif-
ferent key mechanisms could be involved in either the development of the specific Alzheimer
pathology i.e. neurofibrillary tangles and amyloid plaques, or cerebrovascular disease such as
lacunar infarcts and white matter disease. We took the approach of focusing on the preclini-
cal stages of the disease by making magnetic resonance imaging (MRI) of the brain in non-
demented elderly and assessing the extent of brain atrophy. The advantage of this approach
is that brain atrophy on MRI, particularly atrophy of structures in the medial temporal lobe,
is evident years before a clinical diagnosis of Alzheimer’s disease and specifically reflects
neuronal loss and neurofibrillary tangles.4 By identifying causes of atrophy on MRI, which we
consider a preclinical sign of Alzheimer’s disease, we hope to shed light on mechanisms by
which Alzheimer’s disease develops. The studies described in this thesis formed part of the
Rotterdam Scan Study, a large population-based cohort study among elderly who were at time
of MRI free of clinical dementia. Vascular risk factors are increasingly recognized to contribute
to the clinical syndrome of Alzheimer’s disease in late life,5 yet it is unclear whether this is only
through induction of cerebrovascular disease that in itself causes cognitive decline or whether
vascular factors also have more direct effects on brain atrophy. In chapter 2 of this thesis, the
focus is on vascular risk factors in relation to brain atrophy on MRI. Chapter 3 is devoted to
the endocrine factors plasma estradiol levels and genetic variation in the estrogen receptor
α polymorphism. The potential of estrogen replacement therapy in preventing Alzheimer’s

Chapter 1
4
disease has recently received a lot of attention and there is considerable controversy on the
role of estrogens in the etiology of Alzheimer’s disease. Also in chapter 3, type 2 diabetes
mellitus and insulin resistance are investigated as potential risk factors for brain atrophy on
MRI. The functional significance and clinical correlates of atrophy on MRI are addressed in
chapter 4. We examined whether atrophy on MRI was associated to memory performance,
risk of dementia and depression. Finally, in chapter 5, the main findings in the context of cur-
rent knowledge on the etiology of Alzheimer’s disease, methodological aspects and sugges-
tions for future research are discussed.
References
1. Alzheimer A. Über einen eigenartigen schweren Erkrankungsprozeß der Hirnrinde. Neurolo-
gisches Centralblatt 1906; 23:1129-1136.
2. Braak H, Braak E. Neuropathological stageing of Alzheimer-related changes. Acta Neuropathol
1991; 82:239-59.
3. Pathological correlates of late-onset dementia in a multicentre, community-based population
in England and Wales. Neuropathology Group of the Medical Research Council Cognitive Func-
tion and Ageing Study (MRC CFAS). Lancet 2001; 357:169-75.
4. Gosche KM, Mortimer JA, Smith CD, Markesbery WR, Snowdon DA. Hippocampal volume as
an index of Alzheimer neuropathology: findings from the Nun Study. Neurology 2002; 58:1476-
82.
5. Breteler MMB. Vascular involvement in cognitive decline and dementia. Epidemiologic evi-
dence from the Rotterdam Study and the Rotterdam Scan Study. Ann N Y Acad Sci 2000;
903:457-65.

Chapter 2
Vascular risk factors of brain atrophy on MRI

7
Chapter 2.1
Blood pressure and medial temporal lobe atrophy
Blood pressure may be associated to clinical Alzheimer’s disease (AD) in several ways. High
blood pressure levels can lead to cerebrovascular damage, which contributes to cognitive
decline in AD. However, high blood pressure may also trigger the development of AD pathol-
ogy, i.e. neurofibrillary tangles and amyloid plaques. In vivo, atrophy of the hippocampus and
amygdala on MRI is a good and early indicator of AD pathology. We investigated the associa-
tion of blood pressure levels with hippocampal and amygdalar atrophy on MRI. Additionally,
we examined the association of markers of large vessel (carotid atherosclerosis) and small
vessel disease (white matter lesions on MRI) with atrophy of the hippocampus and amygdala.
In 1995-1996, 511 non-demented elderly (60-90 year) underwent brain MRI. Blood pressure
levels were assessed concurrently with MRI and 5 years before the MRI. A high diastolic
blood pressure 5 years before MRI predicted more hippocampal atrophy in persons untreated
for hypertension. Conversely, in persons treated for hypertension a low diastolic blood pres-
sure was related to atrophy. Small vessel disease, but not large vessel disease, coexisted
with hippocampal and amygdalar atrophy. These results indicate that high blood pressure and
markers of small vessel disease in the brain are associated with atrophy of structures affected
by AD. A low blood pressure level may be either a cause or consequence of atrophy.

Chapter 2.1
8
Introduction
Although Alzheimer’s disease (AD) is originally considered to be a non-vascular disease, this
view is challenged by observations that vascular factors contribute to the development of
late-onset AD.1-3 In this respect, the most frequently investigated vascular factor is blood pres-
sure.4, 5 Long-term longitudinal studies have shown that a high blood pressure increases the
risk of clinical AD.6-8 Yet cross-sectional studies9, 10 and studies with a shorter follow-up11, 12
reported a low blood pressure in patients with AD.
It is unclear whether and which structural brain changes could underlie the associations be-
tween blood pressure and clinical AD. High blood pressure levels can lead to cerebrovascular
damage such as white matter lesions (WML) and small brain infarcts that contribute to cog-
nitive decline in a patient with clinical AD.13-15 Alternatively, more direct links between blood
pressure and AD are suggested by the observation that persons with hypertension have in-
creased neurofibrillary tangles and brain atrophy at autopsy.16, 17 To explore the latter in vivo,
we decided to study the relation between blood pressure and hippocampal and amygdalar
atrophy on MRI in non-demented elderly. The hippocampus and amygdala are highly affected
by amyloid plaques and neurofibrillary tangles even in the earliest stage of the development
of Alzheimer’s disease.18 Histopathological studies confirm that neuronal loss, neurofibrillary
tangles and amyloid plaques at autopsy are highly correlated to atrophy visible on MRI.19-21 If
the association between blood pressure and clinical AD is (partly) mediated through effects
on the development of Alzheimer neuropathology in the medial temporal lobe, one would
expect to find an association between blood pressure levels and atrophy of the hippocampus
and amygdala on MRI. We additionally examined whether markers of small vessel disease in
the brain (WML) or large vessel disease (carotid atherosclerosis) are associated to atrophy of
the hippocampus and amygdala on MRI and modifies the association between blood pressure
and atrophy on MRI.
Methods
Participants
The Rotterdam Study is a large population-based cohort study in the Netherlands designed
to investigate prevalence, incidence and determinants of diseases in the elderly.22 Baseline
examinations were done in 1990 to 1993. In 1995 to 1996, we randomly selected 965 living
members (60-90 years of age) of the cohort in strata of sex and age (5 years) for participation
in the Rotterdam Scan Study designed to study age-related brain changes on MRI.1 As part of
the eligibility criteria, we excluded from this selection people with dementia (n=17)23 or MRI
contraindications (n=116). Thus, 832 persons were eligible and invited. Among these, 563

Blood pressure and medial temporal lobe atrophy
9
participants gave their written informed consent to participate in the study, which included
undergoing an MRI scan of the brain (response rate: 68%). Complete MRI data was available
for 511 participants.24 Participants were in general healthier than non-participants.25 The study
protocol was approved by the medical ethics committee of the Erasmus Medical Center.
MRI procedures
Standard T1, T2 and proton-density weighted axial MR images and a custom-made three-
dimensional (3D) MRI sequence covering the whole brain were made using a 1.5 Tesla MR
unit (VISION MR, Siemens, Erlangen, Germany). The MRI acquisition parameters have been
described.24, 26
MRI assessment of hippocampal and amygdalar volumes
We constructed a series of coronal brain slices (contiguous 1.5-mm slice thickness) from the
3D MRI, aligned to be perpendicular to the long axis of the hippocampus. We manually traced
the boundaries of the hippocampus and amygdala on both sides on each slice with a mouse-
driven cursor.24 The summed surface was multiplied by slice thickness to yield estimates of
the hippocampal and amygdalar volume (ml). The left and right-sided volumes were summed
to yield the total hippocampal and amygdalar volume. As a proxy for head size, we measured
on the middle sagittal MRI slice the intracranial cross-sectional area.24 We corrected for head
size differences across individuals by dividing the uncorrected volumes by the participant’s
calculated head size area and subsequently multiplying this ratio by the average head size
area (men and women separately).27
Assessment of blood pressure and vasculopathy
At baseline and time of MRI we assessed blood pressure with a random zero sphygmoma-
nometer.28 Participants were asked to bring all prescribed medications to the research center
where a physician recorded the use. At baseline and time of MRI, participants underwent
ultrasonography of the carotid arteries.29 The presence of atherosclerotic plaques was deter-
mined at six locations: common carotid artery, carotid bifurcation, and internal carotid artery
at the left and right side and summed (range 0-6). The intima-media thickness was measured
by longitudinal two-dimensional ultrasound of the anterior and posterior wall of both com-
mon carotid arteries. We calculated the mean of these four locations. Cerebral WML on MRI
were assessed on proton-density and T2 weighted axial MR images and were scored in the
periventricular regions (range 0-9) and the subcortical regions (approximated volume).26 We
defined a group with severe WML on MRI similar to previous analyses30 as having either a
subcortical WML score or periventricular WML score in the upper quintile of the distribution.
Brain infarcts were defined as focal hyperintensities on T2 weighted images, and, if present in

Chapter 2.1
10
the white matter, with corresponding prominent hypointensity on T1 weighted images.31
Other measurements
Body mass index (BMI) was calculated as weight divided by the square of height. A physician
assessed participants’ smoking habits with a structured questionnaire and we categorized
this into never, former or current smoking. Serum total cholesterol and high-density lipopro-
tein (HDL) were determined with an automated enzymatic procedure.
Data analysis
We assessed the relation between blood pressure continuously and in categories at baseline
or at time of MRI and atrophy with multiple linear regression. As preliminary analysis and pre-
vious studies on AD and cognitive impairment.7, 32-34 suggest differences in relations between
persons with or without antihypertensive medication, we stratified for antihypertensive medi-
cation use. With multiple linear regression, we investigated the association between WML,
carotid atherosclerosis and atrophy. Analyses were adjusted for age and sex and additionally
for other cardiovascular factors. Finally, we repeated the analyses on blood pressure and atro-
phy in strata of severity of WML on MRI. Assumptions of the model were verified by residual
diagnostics.

Blood pressure and medial temporal lobe atrophy
11
Results
Table 1 gives several characteristics of the study sample both at baseline and at time of
MRI.
Table 1. Characteristics of the study sample at baseline (1990-1993) and time of MRI (1995-1996)
Baseline
(n=511)
Time of MRI
(n=511)
Age, year 68.8 ± 8.0 73.4 ± 8.0
Sex, % women 49.1 49.1
Cholesterol / HDL ratio 5.4 ± 1.8 4.9 ± 1.5
Current smoking, % 19.6 16.3
BMI, kg/m2 26.2 ± 3.4 26.3 ± 3.6
Diastolic blood pressure, mmHg 73.0 ± 10.8 76.5 ± 11.6
Systolic blood pressure, mmHg 136.5 ± 20.3 145.8 ± 20.3
Antihypertensive medication, % 30.3 38.9
Carotid plaques, score range 0-6 1.3 ± 1.5 1.6 ± 1.6
Intima-media thickness, mm 0.76 ± 0.14 0.87 ± 0.14
Periventricular WML on MRI, grade - 2.7 ± 2.2
Subcortical WML on MRI, ml - 1.80 ± 3.40
Infarcts on MRI, % - 28.0
Values are unadjusted means ± SD or percentages
People using antihypertensive medication at both baseline and follow-up had on average
smaller hippocampal (age and sex adjusted difference –0.15, 95% CI –0.32 to 0.02, P=0.09)
and amygdalar volumes (–0.20, 95% CI –0.34 to –0.06, P=0.005) compared to people without
antihypertensive medication. A higher diastolic blood pressure at baseline in persons untreat-
ed for hypertension was related to smaller hippocampal volumes (Figure 1). Per SD increase
in diastolic blood pressure at baseline, we found in persons untreated a 0.10 ml smaller hip-
pocampal volume (95% CI –0.19 to –0.02, P=0.02). Diastolic blood pressure at time of MRI
was not associated with hippocampal or amygdalar volume in persons without antihyperten-
sive treatment (Figure 1). Conversely, in persons using antihypertensive medication, a lower
diastolic blood pressure at time of MRI was related to smaller volumes on MRI, statistically

Chapter 2.1
12
significant for the amygdala (Figure 1). Per SD increase in diastolic blood pressure at time of
MRI, 0.10 ml (95% CI 0.00 to 0.20, P=0.05) larger amygdalar volumes were found. These as-
sociations did not change after adjusting for the cholesterol/HDL ratio, BMI or smoking.
Figure 1. Association between diastolic blood pressure levels at baseline (upper panel) or at time of MRI
(lower panel) and volumes of the hippocampus (left panel) and amygdala (right panel). Adjusted for age
and sex and normalized to head size. *P<0.05 compared to diastolic blood pressure <70 mmHg
No associations were found with systolic blood pressure levels (Figure 2).
People with more carotid atherosclerosis at either baseline (data not shown) or time of MRI
did not have smaller volumes on MRI (Table 2). People with more WML had smaller hippo-
campal or amygdalar volumes (Table 2). This relation did not disappear after adjusting for blood
pressure levels, antihypertensive medication use, cholesterol/HDL ratio, BMI and smoking.
People with infarcts on MRI did not have significantly smaller hippocampal or amygdalar vol-
���
���
���
���
���
���
��� �����
�����
��� ��� �����
�����
���
����������������������������������������
���
����
���
����
���
����
��
�������������������� �����������������
���
���
���
���
���
���
��� �����
�����
��� ��� �����
�����
���
����������������������������������������
��
����
����
����
����
��
���
���
���
���
���
���
��� �����
�����
��� ��� �����
�����
���
�����������������������������������
���
����
���
����
���
����
��
���
���
���
���
���
���
��� �����
�����
��� ��� �����
�����
���
�����������������������������������
��
����
����
����
����
���
�

Blood pressure and medial temporal lobe atrophy
13
umes (age and sex adjusted difference in hippocampal volume –0.10 ml (95% CI –0.27 to 0.07,
P=0.24) and in amygdalar volume –0.01 ml (95% CI –0.15 to 0.13, P=0.89)).
Figure 2. Association between systolic blood pressure levels at baseline (upper panel) or at time of MRI
(lower panel) and volumes of the hippocampus (left panel) and amygdala (right panel). Adjusted for age
and sex and normalized to head size
The association that we found in persons without antihypertensive treatment between a high
diastolic blood pressure at baseline and hippocampal atrophy on MRI remained when exclu-
ding persons with severe WML on MRI (per SD increase in 0.13 ml smaller hippocampal vol-
ume (95% CI 0.03 to 0.23, P=0.02). The association between concurrent low diastolic blood
pressure level and more atrophy in persons using antihypertensive medications was however
restricted to people with coexistent severe WML on MRI (Table 3).
���
���
���
���
���
���� �������
�������
���� ���� �������
�������
����
���������������������������������������
���
����
���
����
���
����
��
�������������������� �����������������
���
���
���
���
���
���� �������
�������
���� ���� �������
�������
����
���������������������������������������
��
����
����
����
����
��
���
���
���
���
���
���� �������
�������
���� ���� �������
�������
����
����������������������������������
���
����
���
����
���
����
��
���
���
���
���
���
���� �������
�������
���� ���� �������
�������
����
����������������������������������
��
����
����
����
����
��

Chapter 2.1
14
Table 2. Cross-sectional associations between markers of vasculopathy and hippocampal and amygdalar
volumes on MRI (n=511)
Hippocampal volume (ml) Amygdalar volume (ml)
Estimate (95% CI) P Estimate (95% CI) P
Carotid atherosclerosis
IMT –0.01 (–0.09 ; 0.07) 0.84 –0.01 (–0.07 ; 0.06) 0.83
Carotid plaques –0.00 (–0.09 ; 0.08) 0.92 –0.01 (–0.07 ; 0.06) 0.83
WML on MRI
Periventricular -0.11 (-0.19 ; -0.03) 0.01 -0.05 (-0.12 ; 0.02) 0.14
Subcortical -0.09 (-0.17 ; -0.01) 0.02 -0.08 (-0.14;-0.02) 0.01
Values are adjusted regression coefficients (with 95% confidence interval (CI) and P-value) per SD in-
crease in atherosclerosis or white matter lesions (WML) on MRI. Adjustments were made for age and
sex
Table 3. Cross-sectional association between diastolic blood pressure level and volumes of hippocampus
and amygdala on MRI according to WML severity on MRI
Hippocampal volume (ml) Amygdalar volume (ml)
No antihypertensive medication (n=313) Estimate (95% CI) P Estimate (95% CI) P
Diastolic BP
No or moderate WML* (n=245) -0.01 (-0.12; 0.10) 0.83 0.06 (-0.02;0.15) 0.14
Severe WML* (n=68) 0.17 (-0.05;0.38) 0.12 0.06 (-0.11;0.22) 0.50
Antihypertensive medication (n=198) Estimate (95% CI) P Estimate (95% CI) P
Diastolic BP
No or moderate WML* (n=129) -0.05 (-0.20;0.10)† 0.47 0.04 (-0.08;0.16)† 0.52
Severe WML* (n=69) 0.20 (0.01;0.39) 0.04 0.19 (0.02;0.36) 0.03
Values are adjusted regression coefficients (with 95% confidence interval (CI) and P-value) per SD in-
crease in diastolic blood pressure level. * White matter lesions (WML) on MRI categorized according to
upper quintile cut-off of distribution in either subcortical or periventricular WML.
†P-value of interaction term of diastolic blood pressure level and WML for hippocampus=0.03 amygda-
la=0.07

Blood pressure and medial temporal lobe atrophy
15
Discussion
We found in this community cohort of non-demented elderly that a high diastolic blood pres-
sure in persons not treated for hypertension was associated with more hippocampal atrophy
on MRI. Higher severity of WML coexisted with atrophy of the hippocampus and amygdala.
Finally, in persons using antihypertensive medications a low diastolic blood pressure was
related to more hippocampal and amygdalar atrophy.
The clinical distinction between vascular dementia and AD is sometimes difficult hampering
studies investigating vascular risk factors in relation to clinically diagnosed AD.35 In elderly
people, dementia symptoms are mostly due to mixed disease i.e. both cerebrovascular dam-
age and AD pathology contribute to the cognitive symptoms.36 We had the opportunity to
assess hippocampal and amygdalar atrophy on MRI that can be regarded as preclinical MRI
markers of AD.19-21, 37 These assessments in vivo may help us clarifying whether vascular fac-
tors influence the AD pathology in the medial temporal lobe. However, we need to bear in
mind that a small volume of the hippocampus or amygdala on MRI does not always reflect
atrophy caused by incipient AD. For some persons a small regional brain volume will be innate
or due to diseases other than AD. Future serial MRI studies can provide information to distin-
guish people with a high rate of brain volume loss due to AD pathology.38
The results of studies on the association between blood pressure and AD are determined by
the time period between blood pressure level assessment and AD diagnosis.5, 39 Longitudinal
population studies with a long follow-up have shown high blood pressure levels in people
who develop clinically overt AD several years later.6-8 Especially in persons not using antihy-
pertensive medications, a higher blood pressure is a risk factor for clinical AD7 and cognitive
impairment.32, 34 High blood pressure levels may lead to a spectrum of brain changes, which
all could separately or in combination cause cognitive decline. Generalized brain atrophy,40-42
WML,25, 41, 42 and infarcts on MRI31 are observed in persons with hypertension and are associ-
ated with cognitive decline and dementia.13 Another potential structural intermediate in the
association between high blood pressure and clinical AD is damage to hippocampal neurones,
as suggested by an autopsy study showing more neurofibrillary tangles and amyloid plaques
in the hippocampus of persons with a high blood pressure.17 How exactly these pathological
changes in the hippocampus develop due to high blood pressure is unclear. Long-standing
hypertension and chronic brain hypoperfusion in rats may upregulate levels of nitric oxide in
the hippocampus, lead to amyloid accumulation and memory loss.43 The coexistence of WML,
which reflects microangiopathy,44 and atrophy of the hippocampus and amygdala on MRI has
been reported before.45 Its coexistence may be explained by both having a similar aetiology
such as high blood pressure that in our sample was strongly related to WML.25 Alternatively,
as adjusting for blood pressure levels did not change the relation between WML and atrophy,

Chapter 2.1
16
generalized microangiopathy may reduce cerebral blood flow to the hippocampus46 and in-
duce loss of hippocampal neurones.47 Of interest, infarcts on MRI were not associated with
the degree of atrophy of the hippocampus and amygdala on MRI. The majority of infarcts on
MRI are lacunar infarcts31 due to microangiopathy. Unlike WML however, they are caused by
acute occlusions of single small vessels possibly not affecting blood flow to the medial tem-
poral lobe. Carotid atherosclerosis was not associated with atrophy of the hippocampus or
amygdala suggesting that the association found between atherosclerosis and clinical AD48 is
not through effects on the hippocampus or amygdala but purely through WML or infarcts.
Studies in which blood pressure is assessed shortly before or at time of diagnosis of AD
showed patients to have lower blood pressure levels compared to controls.9-12, 49, 50 Two hy-
potheses have been put forward to explain these associations with low blood pressure: (1) a
low blood pressure is a secondary phenomenon of the dementia process or (2) a low blood
pressure primarily contributes to development of dementia. Regarding the first hypothesis,
the hippocampus and amygdala have a role in blood pressure regulation51, 52 and atrophy of
these structures due to AD pathology could result in a decrease of blood pressure level. How-
ever, this being true, we would expect similar associations between atrophy and low blood
pressure levels in all persons whereas in our study the association was strongest in those
using antihypertensive medication. This is in line with the stronger association found between
a low blood pressure and AD in persons on antihypertensive treatment.11, 12, 50 According to
the second hypothesis, a too low blood pressure level can be detrimental to the brain.53 Un-
der normal conditions, cerebral autoregulatory mechanisms will keep up adequate cerebral
blood flow despite a low systemic blood pressure level.54 This is achieved by vasodilatation
of the arterioles of the brain.55 In persons with chronic hypertension and microangiopathy56,
57 the ability to vasodilate is reduced and a low systemic blood pressure might lead to hypo-
perfusion and ischemia of the brain particularly to the sensitive hippocampus and amygdala.
Our finding that a low diastolic blood pressure level was particularly associated to atrophy in
persons with antihypertensive medication (most likely with a history of chronic hypertension)
and severe WML may fit this hypothesis.
To conclude, our findings support the idea that blood pressure has effects on atrophy of struc-
tures in the medial temporal lobe that have a central role in AD. However, as our study was
cross-sectional we cannot infer causality of the associations. Prospective studies are needed
to confirm or reject the associations we found.

Blood pressure and medial temporal lobe atrophy
17
References
1. Breteler MMB. Vascular involvement in cognitive decline and dementia. Epidemiologic evi-
dence from the Rotterdam Study and the Rotterdam Scan Study. Ann N Y Acad Sci 2000;
903:457-65.
2. de la Torre JC. Alzheimer disease as a vascular disorder: nosological evidence. Stroke 2002;
33:1152-62.
3. Skoog I, Kalaria RN, Breteler MMB. Vascular factors and Alzheimer disease. Alzheimer Dis Assoc
Disord 1999; 13 Suppl 3:S106-14.
4. Skoog I. The relationship between blood pressure and dementia: a review. Biomed Pharmaco-
ther 1997; 51:367-75.
5. Skoog I. Highs and lows of blood pressure:a cause of Alzheimer’s disease? Lancet Neurol
2003; 2:334.
6. Kivipelto M, Helkala EL, Laakso MP, et al. Midlife vascular risk factors and Alzheimer’s disease
in later life: longitudinal, population based study. BMJ 2001; 322:1447-51.
7. Launer LJ, Ross GW, Petrovitch H, et al. Midlife blood pressure and dementia: the Honolulu-
Asia aging study. Neurobiol Aging 2000; 21:49-55.
8. Skoog I, Lernfelt B, Landahl S, et al. 15-year longitudinal study of blood pressure and dementia.
Lancet 1996; 347:1141-5.
9. Guo Z, Viitanen M, Fratiglioni L, Winblad B. Low blood pressure and dementia in elderly people:
the Kungsholmen project. BMJ 1996; 312:805-8.
10. Morris MC, Scherr PA, Hebert LE, et al. The cross-sectional association between blood pres-
sure and Alzheimer’s disease in a biracial community population of older persons. J Gerontol A
Biol Sci Med Sci 2000; 55:M130-6.
11. Ruitenberg A, Skoog I, Ott A, et al. Blood pressure and risk of dementia: results from the Rot-
terdam study and the Gothenburg H-70 Study. Dement Geriatr Cogn Disord 2001; 12:33-9.
12. Qiu C, von Strauss E, Fastbom J, Winblad B, Fratiglioni L. Low blood pressure and risk of de-
mentia in the Kungsholmen project: a 6-year follow-up study. Arch Neurol 2003; 60:223-8.
13. Vermeer SE, Prins ND, den Heijer T, Hofman A, Koudstaal PJ, Breteler MMB. Silent brain inf-
arcts and the risk of dementia and cognitive decline. N Engl J Med 2003; 348:1215-22.
14. Kalaria RN. The role of cerebral ischemia in Alzheimer’s disease. Neurobiol Aging 2000; 21:321-
30.
15. Barber R, Scheltens P, Gholkar A, et al. White matter lesions on magnetic resonance imaging in
dementia with lewy bodies, Alzheimer’s disease, vascular dementia, and normal aging. J Neu-
rol Neurosurg Psychiatry 1999; 67:66-72.
16. Sparks DL, Scheff SW, Liu H, et al. Increased density of senile plaques (SP), but not neurofi-
Chapter 2.1
18
brillary tangles (NFT), in non-demented individuals with the apolipoprotein E4 allele: compari-
son to confirmed Alzheimer’s disease patients. J Neurol Sci 1996; 138:97-104.
17. Petrovitch H, White LR, Izmirilian G, et al. Midlife blood pressure and neuritic plaques, neurofi-
brillary tangles, and brain weight at death: the HAAS. Neurobiol Aging 2000; 21:57-62.
18. Braak H, Braak E. Neuropathological stageing of Alzheimer-related changes. Acta Neuropathol
1991; 82:239-59.
19. Bobinski M, de Leon MJ, Wegiel J, et al. The histological validation of post mortem magnetic
resonance imaging- determined hippocampal volume in Alzheimer’s disease. Neuroscience
2000; 95:721-5.
20. Gosche KM, Mortimer JA, Smith CD, Markesbery WR, Snowdon DA. Hippocampal volume as
an index of Alzheimer neuropathology: findings from the Nun Study. Neurology 2002; 58:1476-
82.
21. Jack CR, Jr., Dickson DW, Parisi JE, et al. Antemortem MRI findings correlate with hippocampal
neuropathology in typical aging and dementia. Neurology 2002; 58:750-7.
22. Hofman A, Grobbee DE, de Jong PTVM, van den Ouweland FA. Determinants of disease and
disability in the elderly: the Rotterdam Elderly Study. Eur J Epidemiol 1991; 7:403-22.
23. Ott A, Stolk RP, Hofman A, van Harskamp F, Grobbee DE, Breteler MMB. Association of diabe-
tes mellitus and dementia: the Rotterdam Study. Diabetologia 1996; 39:1392-7.
24. den Heijer T, Vermeer SE, Clarke R, et al. Homocysteine and brain atrophy on MRI of non-de-
mented elderly. Brain 2003; 126:170-5.
25. de Leeuw FE, de Groot JC, Oudkerk M, et al. A follow-up study of blood pressure and cerebral
white matter lesions. Ann Neurol 1999; 46:827-33.
26. de Groot JC, de Leeuw FE, Oudkerk M, et al. Cerebral white matter lesions and cognitive func-
tion: the Rotterdam Scan Study. Ann Neurol 2000; 47:145-51.
27. Callen DJ, Black SE, Gao F, Caldwell CB, Szalai JP. Beyond the hippocampus: MRI volumetry
confirms widespread limbic atrophy in AD. Neurology 2001; 57:1669-74.
28. Vermeer SE, den Heijer T, Koudstaal PJ, Oudkerk M, Hofman A, Breteler MMB. Incidence and
risk factors of silent brain infarcts in the population-based Rotterdam Scan Study. Stroke 2003;
34:392-6.
29. Bots ML, Hoes AW, Koudstaal PJ, Hofman A, Grobbee DE. Common carotid intima-media
thickness and risk of stroke and myocardial infarction: the Rotterdam Study. Circulation 1997;
96:1432-7.
30. Vermeer SE, Van Dijk EJ, Koudstaal PJ, et al. Homocysteine, silent brain infarcts, and white
matter lesions: the Rotterdam Scan Study. Annals of Neurology 2002; 51:285-289.
31. Vermeer SE, Koudstaal PJ, Oudkerk M, Hofman A, Breteler MMB. Prevalence and risk factors
of silent brain infarcts in the population-based Rotterdam Scan Study. Stroke 2002; 33:21-5.

Blood pressure and medial temporal lobe atrophy
19
32. Kilander L, Nyman H, Boberg M, Hansson L, Lithell H. Hypertension is related to cognitive
impairment: a 20-year follow-up of 999 men. Hypertension 1998; 31:780-6.
33. Elias MF, Wolf PA, D’Agostino RB, Cobb J, White LR. Untreated blood pressure level is inversely
related to cognitive functioning: the Framingham Study. Am J Epidemiol 1993; 138:353-64.
34. Tzourio C, Dufouil C, Ducimetiere P, Alperovitch A. Cognitive decline in individuals with high
blood pressure: a longitudinal study in the elderly. EVA Study Group. Epidemiology of Vascular
Aging. Neurology 1999; 53:1948-52.
35. Korczyn AD. Mixed dementia--the most common cause of dementia. Ann N Y Acad Sci 2002;
977:129-34.
36. Pathological correlates of late-onset dementia in a multicentre, community-based population
in England and Wales. Neuropathology Group of the Medical Research Council Cognitive Func-
tion and Ageing Study (MRC CFAS). Lancet 2001; 357:169-75.
37. Schott JM, Fox NC, Frost C, et al. Assessing the onset of structural change in familial Alzheim-
er’s disease. Annals of Neurology 2003; 53:181-188.
38. Jack CR, Jr., Petersen RC, Xu Y, et al. Rate of medial temporal lobe atrophy in typical aging and
Alzheimer’s disease. Neurology 1998; 51:993-9.
39. Skoog I, Gustafson D. Hypertension and related factors in the etiology of Alzheimer’s disease.
Ann N Y Acad Sci 2002; 977:29-36.
40. den Heijer T, Skoog I, Oudkerk M, et al. Association between blood pressure levels over time
and brain atrophy in the elderly. Neurobiol Aging 2003; 24:307-13.
41. DeCarli C, Miller BL, Swan GE, et al. Predictors of Brain Morphology for the Men of the NHLBI
Twin Study. Stroke 1999; 30:529-536.
42. Swan GE, DeCarli C, Miller BL, et al. Association of midlife blood pressure to late-life cognitive
decline and brain morphology. Neurology 1998; 51:986-93.
43. de la Torre JC, Pappas BA, Prevot V, et al. Hippocampal nitric oxide upregulation precedes
memory loss and A beta 1-40 accumulation after chronic brain hypoperfusion in rats. Neurol
Res 2003; 25:635-41.
44. Pantoni L, Garcia JH. Pathogenesis of leukoaraiosis: a review. Stroke 1997; 28:652-9.
45. O’Brien JT, Desmond P, Ames D, Schweitzer I, Tress B. Magnetic resonance imaging correlates
of memory impairment in the healthy elderly: association with medial temporal lobe atrophy
but not white matter lesions. Int J Geriatr Psychiatry 1997; 12:369-74.
46. Waldemar G, Christiansen P, Larsson HB, et al. White matter magnetic resonance hyperinten-
sities in dementia of the Alzheimer type: morphological and regional cerebral blood flow cor-
relates. J Neurol Neurosurg Psychiatry 1994; 57:1458-65.
47. Kril JJ, Patel S, Harding AJ, Halliday GM. Patients with vascular dementia due to microvascular
pathology have significant hippocampal neuronal loss. J Neurol Neurosurg Psychiatry 2002;
72:747-51.

Chapter 2.1
20
48. Hofman A, Ott A, Breteler MMB, et al. Atherosclerosis, apolipoprotein E, and prevalence of
dementia and Alzheimer’s disease in the Rotterdam Study. Lancet 1997; 349:151-4.
49. Morris MC, Scherr PA, Hebert LE, Glynn RJ, Bennett DA, Evans DA. Association of incident
Alzheimer disease and blood pressure measured from 13 years before to 2 years after diagno-
sis in a large community study. Arch Neurol 2001; 58:1640-6.
50. Posner HB, Tang MX, Luchsinger J, Lantigua R, Stern Y, Mayeux R. The relationship of hyperten-
sion in the elderly to AD, vascular dementia, and cognitive function. Neurology 2002; 58:1175-
81.
51. Burke WJ, Coronado PG, Schmitt CA, Gillespie KM, Chung HD. Blood pressure regulation in
Alzheimer’s disease. J Auton Nerv Syst 1994; 48:65-71.
52. Salomé N, Viltart O, Leman S, Sequeira H. Activation of ventrolateral medullary neurons project-
ing to spinal autonomic areas after chemical stimulation of the central nucleus of amygdala: a
neuroanatomical study in the rat. Brain Res 2001; 890:287-95.
53. de la Torre JC. Critically attained threshold of cerebral hypoperfusion: the CATCH hypothesis of
Alzheimer’s pathogenesis. Neurobiol Aging 2000; 21:331-42.
54. Paulson OB, Strandgaard S, Edvinsson L. Cerebral autoregulation. Cerebrovasc Brain Metab
Rev 1990; 2:161-92.
55. Ursino M, Giulioni M, Lodi CA. Relationships among cerebral perfusion pressure, autoregula-
tion, and transcranial Doppler waveform: a modeling study. J Neurosurg 1998; 89:255-66.
56. Strandgaard S, Paulson OB. Regulation of cerebral blood flow in health and disease. J Cardio-
vasc Pharmacol 1992; 19 Suppl 6:S89-93.
57. Pantoni L. Pathophysiology of age-related cerebral white matter changes. Cerebrovasc Dis
2002; 13 Suppl 2:7-10.

21
Chapter 2.2
Blood pressure and global brain atrophy
The relation between blood pressure level and degree of global brain atrophy is equivocal. We
evaluated past and present blood pressure levels and change in blood pressure over 20 years
in relation to the degree of cortical atrophy on magnetic resonance imaging (MRI). In 1995-
1996, we measured blood pressure and performed MRI in 1,077 non-demented elderly (age
60-90 years). For 513 of these, we had information on a blood pressure level 20 years before.
The degree of cortical atrophy was semi-quantitatively scored (range 0-15). In late life, a high
(≥90 mmHg) and low (<65 mmHg) diastolic blood pressure were associated with more corti-
cal atrophy than a diastolic blood pressure level between 65-74 mmHg (adjusted difference
0.60 units (95% confidence interval (CI), 0.18-1.02) and 0.77 units (0.28-1.25), respectively).
Persons whose diastolic blood pressure had declined more than 10 mmHg over 20 years had
more cortical atrophy than those with stable blood pressure levels (adjusted difference 0.53
units, 0.05-1.02). Both high and declining diastolic blood pressure levels are associated with
more global brain atrophy on MRI.

Chapter 2.2
22
Introduction
Global brain atrophy is a common finding on magnetic resonance imaging (MRI) scans of
elderly persons. Elderly with more pronounced brain atrophy perform worse on neuropsycho-
logical testing,1 and may even be at increased risk to develop Alzheimer’s disease.2 Besides
age, no definite risk factor for the development of severe brain atrophy has yet been identified.
High blood pressure levels in mid or late life have been suggested to increase the degree of
brain atrophy in later life,3, 4 but other observational studies reported that a low blood pressure
level or a decline in blood pressure are associated with severe brain atrophy.5, 6 In a popula-
tion-based sample of older people we investigated the relation between blood pressure levels
and degree of brain atrophy on MRI. We investigated blood pressure levels 20 years before
MRI, change in blood pressure over time, and concurrent blood pressure level in relation to
the degree of brain atrophy on MRI.
Methods
Study sample
This study is based on data from the Rotterdam Scan Study, which was designed to investi-
gate determinants and consequences of brain abnormalities on MRI in the elderly.7 In 1995-
1996, 1,904 subjects aged 60-90 years were randomly selected in strata of age (5 years) and
sex from two population cohort studies.8, 9 We excluded 187 subjects who were demented,
blind or had MRI contraindications at time of selection. Of the 1,717 eligible non-demented
subjects, complete information including a cerebral MRI scan was obtained in 1,077 who
gave written informed consent (participation rate 63%, mean age 72.2 years, 52% women).
Subjects who consented to the MRI examination were on average younger and healthier than
subjects who refused the MRI examination.10 In 513 subjects, originating from one of the co-
horts (participation rate 59 %),8 we had information on a blood pressure level 20 years before
MRI (measured from 1975-1978; age at that time between 40 and 70 years). The Medical
Ethics Committee of Erasmus Medical Center, the Netherlands, approved the study.
Measurements
Measurements were done similarly at both examinations. Blood pressure was measured
twice in a seated position with a random-zero sphygmomanometer. We used the average of
these two measurements. In six subjects with MRI, we had no information on concurrent
blood pressure level. Subjects showed prescribed medications to a physician who coded
these according to the Anatomic-Therapeutic-Chemical index. Antihypertensive medications
were medications falling into classification codes C02, C03 and C07. Diabetes mellitus was

Blood pressure and global brain atrophy
23
considered present when subjects reported use of oral antidiabetic medication or insulin
(classification code A10). A physician asked about smoking habits (current, never or former)
and quantified this as pack-years of cigarettes smoked (=number of cigarettes per day X year
of smoking/20) (pack-years could only be quantified at time of MRI). Body mass index (BMI)
was calculated as weight divided by height square.
MRI procedures
An axial T1, T2 and proton density weighted brain MRI scan was made with 1.5-Tesla scanners
(Gyroscan, Philips NT, Best, The Netherlands or VISION MR, Siemens, Erlangen, Germany).10
Slice thickness was 5 or 6 mm with an interslice gap of 20 %. Images were optimized on the
scanner screen and printed on laser hard copies. The extent of cortical atrophy was scored
blinded to all clinical characteristics on a four point rating scale based on the size of the gyri
and sulci from 0 (no cortical atrophy) to 3 (severe cortical atrophy) at five regions (frontal, pa-
rietal, temporal and occipital lobes and the insular region) with use of reference scans (Figure
1).
Figure 1. Axial brain slices at the level of the basal ganglia showing brains with sum score of cortical
atrophy of A=0, B=5, C=10, D=15. Cortical atrophy was scored from 0-3 at the frontal, parietal, temporal
and occipital lobes and the insular region

Chapter 2.2
24
The sum of these five regions (0-15) was calculated. Two experienced raters scored all scans
for cortical atrophy independent of each other. When the raters differed more than one point
in any of the five regions a consensus reading was held, otherwise the mean score was calcu-
lated. Intra and interrater studies based on the first 200 scans showed good reproducibility for
scoring cortical atrophy (intrarater weighted kappa 0.82 and interrater weighted kappa 0.81).
White matter lesions were scored in periventricular (grade 0-9) and subcortical white matter
regions (approximated volume) on the proton density scans.10 White matter lesions had to be
hyperintense on the proton density and T2 weighted images, without prominent hypointen-
sity on the T1 weighted images. We defined infarcts as focal hyperintensities on T2 weighted
images.11 Infarcts in the white matter also had to have corresponding hypointensities on T1
weighted images, in order to distinguish them from white matter lesions.
Data analysis
Age and sex adjusted linear regression was used to quantify the relation between several
characteristics and atrophy. We used analysis of covariance (ANCOVA) to calculate adjusted
means of cortical atrophy in blood pressure level categories. This was done for blood pressure
levels 20 years before MRI, change in blood pressure level, and concurrent blood pressure
level. When the ANCOVA suggested a linear association between the blood pressure variable
and atrophy, we performed a multivariate linear model to calculate the increase in cortical
atrophy units per 10 mmHg increase in blood pressure level. A possible U-shaped association
between blood pressure measures and atrophy was evaluated by adding the quadratic term
of the blood pressure variable to the linear model. We then report the P-value of the regres-
sion coefficient of the quadratic term. All analyses were adjusted for age, sex, and cigarette
smoking (at examination in 1975-1978: smoking status; current, former, never; concurrent
with MRI: pack-years of cigarette smoking). Additional adjustments were made for presence
of diabetes, BMI, and white matter lesions. We evaluated whether relations differed accor-
ding to antihypertensive medication use through stratified analyses. In addition, all analyses
were repeated with the different regions of atrophy as dependent variables separately. Finally,
we repeated all analyses excluding subjects with an infarct on MRI.
For missing data on categorical covariates, we used a missing indicator, whereas for missing
data on continuous covariates we used the median value of the respective value as calculated
from the total sample. Data were missing on cigarette smoking (n=24), diabetes (n=3), body
mass index (n=3), and subcortical white matter lesions (n=4). All analyses were followed by
residual analyses to confirm assumptions of the model.

Blood pressure and global brain atrophy
25
Results
Table 1 shows characteristics of the total study sample at time of MRI and characteristics of
the part with additional examinations 20 years before MRI.
Table 1. Characteristics of the total study sample in 1995-1996 (at time of MRI scan) and of subjects with
additional examinations in 1975-1978
Total study sample Examinations in
1995-1996 (n=1077) 1975-1978 (n=513)
Age, years 72 ± 7 51 ± 7
Sex, % women 52 53
Systolic blood pressure (mmHg) 147.3 ± 21.6 131.4 ± 17.0
Diastolic blood pressure (mmHg) 78.7 ± 11.7 81.3 ± 10.9
Antihypertensive medication, % 35 15
Smoking cigarettes, % current 16 37
Prevalent diabetes mellitus, % 6 1
Body mass index (kg/m2) 26.7 ± 3.6 25.0 ± 3.0
Subcortical white matter lesions (ml) 1.4 ± 2.9 -
Periventricular white matter lesions, grade 2.4 ± 2.2 -
Infarcts on MRI, % 24 -
Cortical atrophy, range 0-15 5.56 ± 2.86 -
Values are unadjusted means ±standard deviation or percentages unless otherwise specified
The degree of cortical atrophy was significantly higher with increasing age (0.22 units per year
(95% confidence interval (CI), 0.20 to 0.24) and more pronounced in men than in women (sex
difference 0.90 units (95% CI, 0.56 to 1.24)). Users of antihypertensive medications in late life,
but not in mid life, had more pronounced cortical atrophy (age- and sex-adjusted difference
0.52 units (95% CI, 0.23 to 0.82), and –0.26 units (95% CI, –0.75 to 0.22), respectively).
Figure 2 shows cortical atrophy according to concurrent blood pressure level. Subjects with
a high diastolic blood pressure level (85-90 mmHg and above 90 mmHg) had adjusted 0.48
units (95% CI, 0.01 to 0.94) and 0.60 units (0.18 to 1.02) more cortical atrophy than subjects
with a diastolic blood pressure level between 65 and 74 mmHg. In addition, subjects with a
diastolic blood pressure level less than 65 mmHg had adjusted 0.77 units (95% CI, 0.28 to

Chapter 2.2
26
1.25) more cortical atrophy than subjects with a diastolic blood pressure level between 65 and
74 mmHg. This U-shaped association between diastolic blood pressure level and degree of
cortical atrophy was statistically significant (P of quadratic term = 0.02), and remained after
additional adjustments for diabetes, BMI, and white matter lesions (P of quadratic term =
0.05). The association was similar for users and non-users of antihypertensive medications.
Concurrent systolic blood pressure level was not related to the degree of cortical atrophy
(Figure 2) (per 10 mmHg a decrease of –0.02 units (95% CI, –0.09 to 0.04)).
���
���
���
���
���
���� �������� �������� ��������
������������������������������
���
���
���
����
����
��
���
���
��
���
���
���
���
���
��� ����� ����� ���������������≥��
�������������������������������
���
���
���
����
����
��
���
���
��
≥���
�
��
Figure 2. Cortical atrophy according to concurrent blood pressure levels. Values are adjusted means
(+standard error) of cortical atrophy. Adjusted for age, sex, and pack-years of cigarette smoking. Numbers
in the respective categories were for diastolic blood pressure 122, 271, 350, 140, 188 and for systolic
blood pressure 99, 215, 186, 268, 303.*Adjusted mean in blood pressure level category differs from ad-
justed mean in diastolic blood pressure level category 65-74 mmHg P<0.05
Higher diastolic blood pressure levels 20 years before MRI predicted more cortical atrophy
in later life in subjects without antihypertensive medication (n=434) (per 10 mmHg increase
in diastolic blood pressure 0.17 units (95% CI, 0.00 to 0.34), but not in subjects with antihy-
pertensive medication (n=79) –0.03 units (95% CI, –0.44 to 0.38). The association in subjects
without antihypertensive medication weakened after adjusting for diabetes, BMI, and white
matter lesions (per 10 mmHg increase in diastolic blood pressure 0.15 units (95% CI, –0.03 to
0.33). The number of subjects without antihypertensive medication allowed us to examine the
association between previous diastolic blood pressure and atrophy in age categories of 40-50,
50-60 and 60-70. The association was strongest in the youngest (per 10 mmHg increase in
diastolic blood pressure respectively 0.26 units (95% CI, 0.05 to 0.48); 0.12 (95% CI, –0.17 to
0.42); 0.13 (95% CI, –0.68 to 0.95). Systolic blood pressure levels 20 years before MRI were

Blood pressure and global brain atrophy
27
not associated with the degree of cortical atrophy in later life (data not shown).
On average, subjects declined very little in diastolic blood pressure over 20 years (change –0.2
mmHg). A steeper decline in diastolic blood pressure was associated with significantly more
cortical atrophy compared to a stable blood pressure level over time (Figure 3). Persons who
had experienced a decline of more than 10 mmHg in diastolic blood pressure level had 0.53
units (95% CI, 0.05 to 1.02) more cortical atrophy than persons with a stable blood pressure
level over time (change between –5 and +5 mmHg).
���
���
���
���
���
���� ����� ���� ���� �≥��
�����������������������������������������������
���
���
���
����
����
��
���
���
��
���
���
���
���
���
��� ����� ����� ����� �≥��
����������������������������������������
���
���
���
����
����
��
���
���
��
�
Figure 3. Cortical atrophy according to change in blood pressure level over 20 years time. Values are
adjusted means (+standard error) of cortical atrophy. Adjusted for age, sex, and pack-years of cigarette
smoking. Numbers in the respective categories were for diastolic blood pressure change 115, 81, 123,
76, 112 and for systolic blood pressure change 65, 120, 188, 60, 74.*Adjusted mean in blood pressure
change category differs from adjusted mean in diastolic blood pressure level change from –5 to 5 mmHg
P<0.05
The decliners with ensuing late life diastolic blood pressure level less than 65 mmHg (n=27)
had 1.27 units (95% CI, 0.45 to 2.13) more cortical atrophy than decliners with ensuing late life
diastolic blood pressure level above 65 mmHg (n=88). Likewise, persons with a low diastolic
blood pressure in late life who had experienced a decline of more than 10 mmHg (n=27) had
1.69 units (95% CI, -0.04 to 3.43) more cortical atrophy compared to persons with a low di-
astolic blood pressure without a preceding decline of more than 10 mmHg (n=7). The associa-
tion between a decline of more than 10 mmHg in diastolic blood pressure and more cortical
atrophy was present in persons without antihypertensive medications at anytime (n=336),
(0.80 units (95% CI, 0.18 to 1.42)), whereas the association in chronic antihypertensive users
was unclear due to small numbers (n=56). In persons who used antihypertensive medica-

Chapter 2.2
28
tion only at late life (n=98), the decliners had 0.34 units (95% CI, -0.84 to 1.51) more cortical
atrophy compared to subjects with a stable blood pressure level. There were only 23 subjects
who used antihypertensive medication in earlier life without using antihypertensive medica-
tion in later life. An increase in diastolic blood pressure of more than 10 mmHg was also asso-
ciated with more cortical atrophy (Figure 3), but the apparent U-shaped association between
diastolic blood pressure change and atrophy was not statistically significant (P of quadratic
term = 0.14). The associations did not change by additional adjustments for diabetes, BMI,
and white matter lesions. Systolic blood pressure change over 20 years was not associated
with the degree of cortical atrophy (Figure 3).
When analyzing the relation between blood pressure and the separate regions in which we
measured cortical atrophy, no differential pattern emerged for any of the relations between
blood pressure and atrophy. Finally, excluding subjects with an infarct on MRI did not materi-
ally change any of the results.
Discussion
The main finding of this study is that in a population of non-demented elderly a high diastolic
blood pressure level 20 years before MRI predicted more pronounced cortical atrophy. Sec-
ond, both concurrent high and low diastolic blood pressure levels were associated with more
atrophy. Finally, subjects who had experienced a steep decline in diastolic blood over a 20-
year period, and had subsequently a low diastolic blood pressure at late life, had more cortical
atrophy than subjects with a stable blood pressure level over time. These associations were
independent of other vascular risk factors, cerebral white matter lesions or infarcts on MRI.
Some limitations of this study have to be considered. First, people had to be alive to be in-
cluded in our study. Subjects with either very low or high blood pressure levels earlier in life
may have preferentially died and hence could have been underrepresented in our sample.
Most likely, this led us to underestimate the association between previous blood pressure
levels or change in blood pressure level and brain atrophy. Some evidence that this played a
role comes from our observation that higher previous blood pressure levels were associated
with more atrophy especially in the youngest for whom higher blood pressure levels will not
have a large impact on mortality rate. A second limitation is that our rating of brain atrophy
is rather crude compared to that of others who used quantitative, yet time-consuming, tech-
niques.2 However, this crude rating should decrease the possibility of finding any association.
Finally, we only had single measurements of blood pressure. Due to regression dilution this
also would lead us to underestimate the effect of blood pressure on atrophy.
Our finding that previous or later life high blood pressure levels are associated with more
global brain atrophy in late life is in concordance with observations in clinical hypertensive pa-

Blood pressure and global brain atrophy
29
tients12-14 and population studies.3, 4 As previously reported in our sample, high blood pressure
levels were associated with severe white matter lesions and infarcts.11, 15 Given the fact that
white matter lesions, infarcts and severe global brain atrophy commonly occur in the same
brain,16 we considered that the relation between high blood pressure and atrophy could be
due to the relation between blood pressure and other cerebrovascular pathology. However,
adjusting for the severity of white matter lesions or excluding those with infarcts did not
change the association between blood pressure and atrophy, suggesting that blood pres-
sure is independently associated with atrophy. Biological support of an association between
high blood pressure and atrophy comes from a pathological study that showed higher mid
life blood pressure levels to be associated with more neurofibrillary tangles in the cortex and
brain atrophy at death.17 However, this study was done in Honolulu comprising a different
ethnical population under other environmental factors. Replication needs to be done in a Cau-
casian population such as ours. Another pathological study showed that elderly who died with
hypertension had more senile plaques in the cortex than those without hypertension.18
Besides a high blood pressure level, we also found dropping blood pressure and lower con-
current blood pressure levels to be associated with more global brain atrophy, as was also
reported by others.5, 6 From our sample with examinations 20 years before MRI, we observed
that most of the subjects with low blood pressure levels in late life came from higher blood
pressure levels earlier in life. Hence it may be that these previous higher blood pressure levels
were responsible for more global brain atrophy at late life. However, it seems unlikely that
this explains the whole association between a low or dropping blood pressure level and more
global brain atrophy, given our observation that higher previous blood pressure levels were
not very strongly associated with more global brain atrophy at late life. We can speculate on
two interpretations of the association between low or dropping diastolic blood pressure levels
and atrophy. First, a decline in blood pressure level over time may lead to mild ischemia of the
brain.19, 20 In healthy subjects, a low systemic blood pressure level will not have a large impact
on cerebral blood flow because the brain has the ability to keep cerebral blood flow constant
by cerebral autoregulation.21 However, in subjects with impaired cerebral autoregulation, the
lower limit of blood pressure at which cerebral autoregulation still functions is shifted towards
a higher blood pressure level,22 and subsequently a low systemic blood pressure level may
be inadequate for healthy brain perfusion.19, 23 As a second interpretation for the association
between a drop in blood pressure and atrophy, one might speculate that atrophy of the brain,
once it is severe enough, causes a decline in blood pressure levels. The central nervous sys-
tem is involved in blood pressure regulation24, 25 and in the very elderly it was observed that
those with more frontal or insular atrophy had on average lower blood pressure levels.5 Our
results did however not indicate a differential association between a low blood pressure level
and atrophy in specific regions. The association between low blood pressure and atrophy in

Chapter 2.2
30
this non-demented population fit findings in patients with early Alzheimer’s disease in which
blood pressure levels drop, possibly due to an increase in atrophy.26, 27
In summary, we found that in a non-demented population both a high and a declining blood
pressure predicted more global brain atrophy on MRI. Prospective studies using several
measurements of atrophy and blood pressure are required to unravel the chronology of these
associations.
References
1. Schmidt R, Fazekas F, Koch M, et al. Magnetic resonance imaging cerebral abnormalities and
neuropsychologic test performance in elderly hypertensive subjects. A case-control study. Arch
Neurol 1995; 52:905-10.
2. Fox NC, Crum WR, Scahill RI, Stevens JM, Janssen JC, Rossor MN. Imaging of onset and pro-
gression of Alzheimer’s disease with voxel- compression mapping of serial magnetic reso-
nance images. Lancet 2001; 358:201-5.
3. Manolio TA, Kronmal RA, Burke GL, et al. Magnetic resonance abnormalities and cardiovascular
disease in older adults. The Cardiovascular Health Study. Stroke 1994; 25:318-27.
4. DeCarli C, Miller BL, Swan GE, et al. Predictors of Brain Morphology for the Men of the NHLBI
Twin Study. Stroke 1999; 30:529-536.
5. Skoog I, Andreasson LA, Landahl S, Lernfelt B. A population-based study on blood pressure and
brain atrophy in 85-year- olds. Hypertension 1998; 32:404-9.
6. Swan GE, DeCarli C, Miller BL, Reed T, Wolf PA, Carmelli D. Biobehavioral characteristics of
nondemented older adults with subclinical brain atrophy. Neurology 2000; 54:2108-14.
7. Breteler MMB. Vascular involvement in cognitive decline and dementia. Epidemiologic evi-
dence from the Rotterdam Study and the Rotterdam Scan Study. Ann N Y Acad Sci 2000;
903:457-65.
8. Hofman A, Laar van A, Klein F, Valkenburg HA. Coffee and cholesterol (letter). New England
Journal of Medicine 1983; 309:1248-1249.
9. Hofman A, Grobbee DE, de Jong PTVM, van den Ouweland FA. Determinants of disease and
disability in the elderly: the Rotterdam Elderly Study. Eur J Epidemiol 1991; 7:403-22.
10. de Groot JC, de Leeuw FE, Oudkerk M, et al. Cerebral white matter lesions and cognitive func-
tion: the Rotterdam Scan Study. Ann Neurol 2000; 47:145-51.
11. Vermeer SE, Koudstaal PJ, Oudkerk M, Hofman A, Breteler MMB. Prevalence and risk factors
of silent brain infarcts in the population-based Rotterdam Scan Study. Stroke 2002; 33:21-5.
12. Salerno JA, Murphy DGM, Horwitz B, et al. Brain atrophy in hypertension. A volumetric mag-
netic resonance imaging study. Hypertension 1992; 20:340-8.

Blood pressure and global brain atrophy
31
13. Hatazawa J, Yamaguchi T, Ito M, Yamaura H, Matsuzawa T. Association of hypertension with
increased atrophy of brain matter in the elderly. J Am Geriatr Soc 1984; 32:370-4.
14. Strassburger TL, Lee HC, Daly EM, et al. Interactive effects of age and hypertension on vol-
umes of brain structures. Stroke 1997; 28:1410-7.
15. de Leeuw FE, de Groot JC, Oudkerk M, et al. A follow-up study of blood pressure and cerebral
white matter lesions. Ann Neurol 1999; 46:827-33.
16. Meguro K, Yamaguchi T, Hishinuma T, et al. Periventricular hyperintensity on magnetic reso-
nance imaging correlated with brain ageing and atrophy. Neuroradiology 1993; 35:125-9.
17. Petrovitch H, White LR, Izmirilian G, et al. Midlife blood pressure and neuritic plaques, neurofi-
brillary tangles, and brain weight at death: the HAAS. Neurobiol Aging 2000; 21:57-62.
18. Sparks DL, Scheff SW, Liu H, Landers TM, Coyne CM, Hunsaker JC, 3rd. Increased incidence of
neurofibrillary tangles (NFT) in non-demented individuals with hypertension. J Neurol Sci 1995;
131:162-9.
19. de la Torre JC. Critically attained threshold of cerebral hypoperfusion: the CATCH hypothesis of
Alzheimer’s pathogenesis. Neurobiol Aging 2000; 21:331-42.
20. Sabri O, Ringelstein EB, Hellwig D, et al. Neuropsychological Impairment Correlates With Hy-
poperfusion and Hypometabolism but Not With Severity of White Matter Lesions on MRI in
Patients With Cerebral Microangiopathy. Stroke 1999; 30:556-566.
21. Paulson OB, Strandgaard S, Edvinsson L. Cerebral autoregulation. Cerebrovasc Brain Metab
Rev 1990; 2:161-92.
22. Moody DM, Santamore WP, Bell MA. Does tortuosity in cerebral arterioles impair down-au-
toregulation in hypertensives and elderly normotensives? A hypothesis and computer model.
Clin Neurosurg 1991; 37:372-87.
23. Mentis MJ, Salerno J, Horwitz B, et al. Reduction of functional neuronal connectivity in long-
term treated hypertension. Stroke 1994; 25:601-7.
24. Chalmer J, Arnolda L, Llewellyn-Smith I, Minson J, Pilowsky P. Central nervous control of blood
pressure. In: Swales JD, editor. Textbook of Hypertension. Oxford: Blackwell Scientific Publica-
tions, 1994:409-26.
25. Burke WJ, Coronado PG, Schmitt CA, Gillespie KM, Chung HD. Blood pressure regulation in
Alzheimer’s disease. J Auton Nerv Syst 1994; 48:65-71.
26. Skoog I, Lernfelt B, Landahl S, et al. 15-year longitudinal study of blood pressure and dementia.
Lancet 1996; 347:1141-5.
27. Ruitenberg A, Skoog I, Ott A, et al. Blood pressure and risk of dementia: results from the Rot-
terdam study and the Gothenburg H-70 Study. Dement Geriatr Cogn Disord 2001; 12:33-9.


33
Chapter 2.3
Homocysteine and brain atrophy
Patients with Alzheimer’s disease have higher plasma homocysteine levels than controls but
it is uncertain whether higher plasma homocysteine levels are involved in the early patho-
genesis of the disease. Hippocampal, amygdalar and global brain atrophy on brain magnetic
resonance imaging (MRI) have been proposed as early markers of Alzheimer’s disease. In
the Rotterdam Scan Study, a population-based study of age-related brain changes in 1,077
non-demented people aged 60 to 90 years, we investigated the association between plasma
homocysteine levels and severity of hippocampal, amygdalar and global brain atrophy on MRI.
We used axial T1 weighted MR images to visualise global cortical brain atrophy (measured
semi-quantitatively; range 0-15) and a 3D HASTE (half-Fourier acquisition single-shot turbo
spin echo) sequence in 511 participants to measure hippocampal and amygdalar volumes.
We had non-fasting plasma homocysteine levels in 1,031 of the participants and in 505 of
the participants with hippocampal and amygdalar volumes. Individuals with higher plasma
homocysteine levels had on average more cortical atrophy [0.23 units (95% CI 0.07 to 0.38
units) per standard deviation increase in plasma homocysteine levels] and more hippocam-
pal atrophy [difference in left hippocampal volume –0.05 ml (95% CI –0.09 to –0.01) and in
right hippocampal volume –0.03 ml (95% CI –0.07 to 0.01) per standard deviation increase in
plasma homocysteine levels]. No association was observed between plasma homocysteine
levels and amygdalar atrophy. These results support the hypothesis that higher plasma homo-
cysteine levels are associated with more atrophy of the hippocampus and cortical regions in
elderly at risk of Alzheimer’s disease.

Chapter 2.3
34
Introduction
Patients with Alzheimer’s disease or cognitive impairment have higher plasma homocysteine
levels than cognitively unimpaired older subjects.1-3 Recently, a high plasma homocysteine
level was shown to be a strong, independent risk factor for the development of Alzheimer’s
disease.4 Elevated plasma total homocysteine level has emerged as a vascular risk factor5 and
vascular factors may play an important role in the pathogenesis of Alzheimer’s disease.6 Fur-
thermore, homocysteine has direct neurotoxic effects on hippocampal and cortical neurones.7,
8 In Alzheimer patients, homocysteine was associated with atrophy of the medial temporal
lobe and patients with higher homocysteine levels had a more rapid rate of atrophy over time.1
Since Alzheimer’s disease is characterised by a long prodromal period, its etiology may be bet-
ter investigated in relation to early preclinical markers of the disease. Hippocampal, amygdalar
and global brain atrophy on MRI may serve as such early markers.9-11 The aim of this study was
to investigate the association between plasma homocysteine levels and these brain MRI out-
comes as putative early markers of Alzheimer’s disease in a non-demented older population.
Methods
Study Sample
This study is based on data collected in the Rotterdam Scan Study, a population-based co-
hort study, designed to investigate the determinants and consequences of age-related brain
changes in the elderly.6 In 1995-1996, we randomly selected 1,904 elderly participants (aged
60 to 90 years) stratified by gender and age (5 years) from two ongoing population-based
cohort studies: the Rotterdam Study12 and the Zoetermeer Study.13 The presence of dementia
was assessed in a stepwise approach as used in the Rotterdam Study.14 First, participants
were screened with the Mini-Mental State Examination (MMSE) and the Geriatric Mental
State Schedule (GMS). Those scoring below 26 on the MMSE or more than 0 on the GMS
were additionally assessed with the CAMDEX interview.15 Subjects thereafter suspected to
be demented were examined by a neurologist. Finally, an expert panel reviewing all relevant
information decided whether an individual was to be considered demented or not, based on
criteria of the DSM-IIIR. Additionally, persons who were blind or had contraindications for MRI
were excluded, leaving 1,717 persons eligible. A total of 1,077 individuals participated (partici-
pation rate of 63 %) and gave written informed consent to a protocol, which was approved by
the medical ethics committee of Erasmus Medical Center, Rotterdam, the Netherlands.

Homocysteine and brain atrophy
35
MRI acquisition
All 1,077 participants underwent an axial T1, T2 and proton-density weighted brain MRI scan
in a 1.5-Tesla unit [Philips (n=514) and Siemens (n=563)].16 For the 563 subjects originating
from the Rotterdam Study,12 we added a 3D Half-Fourier Acquisition Single-Shot Turbo Spin
Echo (HASTE) sequence to the protocol (inversion time 440 ms, repetition time 2800 ms,
128 contiguous sagittal slices of 1.2-mm, matrix 192x256, field of view 256x256). Two HASTE
modules were sequentially acquired after the inversion pulse (effective echo time of 29 ms
and 440 ms), of which the first was used for the volumetric assessments of the hippocampus
and amygdala. Of the 563, fifty-two participants developed claustrophobia, leaving 511 partici-
pants with a HASTE sequence.
Hippocampal and amygdalar volumes
The HASTE sequence was used to reconstruct coronal slices (contiguous 1.5-mm slices) per-
pendicular to the long axis of the hippocampus (Figure 1).
Figure 1. Coronal slice on which the hippocampus (H) and amygdala (A) are depicted
The left and right hippocampus and amygdala were manually traced using a mouse-driven
cursor based on a reference atlas.17 Tracing proceeded from posterior to anterior, starting
at the slice where the crux of the fornices was in full profile. The in-plane boundaries of the
hippocampus were defined to include the subiculum, the CA1 through CA4 sectors of the
hippocampus proper and the gyrus dentatus. Tracing of the amygdala included all of its nuclei.

Chapter 2.3
36
As the anterior boundary of the amygdala is poorly defined in nature, we defined this to be the
slice at the rostral extreme of the temporal stem. Volumes (ml) were calculated [sum of areas
(mm2) X 1.5 mm/1000]. We measured the midsagittal area (cm2) by tracing the margin of the
inner table of the skull in order to have a proxy for total intracranial volume.9 Two readers, who
were blinded to clinical information, measured the 511 scans. Intra- and interreader studies
based on 14 random scans showed good reproducibility. Intrarater intraclass correlation coef-
ficients for the left and right hippocampus were r=0.93 and r=0.90, and interrater intraclass
correlation coefficients were r=0.87 and r=0.83, respectively. For the left and right amygdala
the intrarater intraclass correlation coefficients were r=0.82 and r=0.78, the interrater intrac-
lass correlation coefficients were r=0.80 and r=0.77, respectively.
Global brain atrophy rating
The severity of global brain atrophy was scored on T1 weighted hard copies, blinded to clinical
information, based on the widening of sulci and narrowing of gyri in comparison to reference
scans. A score from 0 (no cortical atrophy) to 3 (severe cortical atrophy) at five different brain
regions (frontal, parietal, temporal and occipital lobes and insular region) was given. The sum
score of all five regions (range 0-15) was used for the analyses. The intrarater weighted kappa
was 0.82, and the interrater weighted kappa was 0.81.
Plasma homocysteine measurements
Non-fasting blood samples were collected and processed at time of MRI as described previ-
ously.18 Blood samples were unavailable in 39 participants due to errors in the blood collection
process. Plasma levels of total homocysteine were determined by fluorescence polarisation
immunoassay on an IMx analyser (Abbott). Seven individuals with extreme values were ex-
cluded from the analyses since their plasma homocysteine levels fell outside the range 5-45
µmol/l in order to minimize the effects of regression dilution bias. Finally, 1,031 participants
were available for the analyses on global brain atrophy, and 505 participants for the analyses
on hippocampal and amygdalar atrophy.
Covariates
We obtained information on the following covariates by interview and physical examination in
1995-1996: diabetes mellitus, hypertension (systolic blood pressure level ≥160 mmHg, or di-
astolic blood pressure level ≥95 mmHg, or use of blood pressure lowering medication), pack-
years of cigarette smoking, vitamin supplements19 and serum creatinine levels (enzymatic
assay). Presence of carotid artery plaques, and the intima-media thickness of the common
carotid artery, were assessed as markers of atherosclerotic disease.20 White matter lesions
on MRI were scored in periventricular (grade 0-9) and subcortical regions (approximated vol-

Homocysteine and brain atrophy
37
ume).16 Infarcts on MRI were defined as focal hyperintensities on T2 weighted images, with-
out prominent hypointensities on T1 weighted images.19
Data analysis
The relation between plasma homocysteine level and atrophy was evaluated using both
homocysteine in quintiles and as continuous variable. Since homocysteine levels increase
markedly with age, quintiles were defined in an age-specific manner for each of five-year
age categories. We compared adjusted means of hippocampal and amygdalar volumes and
global brain atrophy across the age-specific quintiles of plasma homocysteine by analysis
of covariance (ANCOVA). The analyses were adjusted for age, sex, diabetes, hypertension,
pack-years of cigarette smoking, serum creatinine, and, for the hippocampal and amygdalar
analyses, midsagittal area. Because these analyses did not suggest a non-linear association
between homocysteine and atrophy, we performed multivariate linear regression to calculate
the change in atrophy per standard deviation (SD) increase in plasma homocysteine level. We
investigated whether carotid atherosclerosis, white matter lesions or presence of infarcts on
MRI mediated the association between homocysteine and atrophy by adding these covariates
to the model. Assumptions of the models were confirmed by residual analyses.
Results
Selected characteristics of the total study sample and the subset with hippocampal and
amygdalar volumes are shown in Table 1.
Table 1. Characteristics of the study sample in total and of the subset with hippocampal and amygdalar
volumes
Characteristic Total (n=1031) Subset (n=505)
Age, years 72 ± 7 73 ± 8
Sex, % women 52 50
Total homocysteine (µmol/l) 11.5 ± 4.1 11.9 ± 4.3
Presence of diabetes, % 7 6
Presence of hypertension, % 52 53
Pack-years of cigarette smoking 19 ± 24 20 ± 25
Serum creatinine level (µmol/l) 88.9 ± 18.6 89.7 ± 19.9
Values are unadjusted means ± SD or percentages unless otherwise specified

Chapter 2.3
38
Plasma homocysteine levels increased with increasing age (1.5 µmol/l increase per 10 years)
and were higher in men (sex difference 1.2 µmol/l). Sixty-one participants (5.9%) reported use
of multivitamin supplements, and these individuals had lower plasma homocysteine levels
than non-users (age and sex adjusted difference –1.3 µmol/l; 95% CI –2.3 to –0.3).
Figure 2 shows the association between plasma homocysteine levels and hippocampal vol-
umes. People with higher plasma homocysteine levels had smaller hippocampal volumes
[difference in left hippocampal volume –0.05 (95% CI –0.09 to –0.01) and right hippocampal
volume –0.03 (95% CI –0.07 to 0.01) per SD increase in plasma homocysteine level adjusted
for age, sex, diabetes, hypertension, pack-years of cigarette smoking, creatinine levels and
midsagittal area].
Figure 2. Hippocampal volumes according to age-specific quintiles of plasma homocysteine levels. The
mean volumes (standard error) are plotted at the median of each quintile and are adjusted for age, sex,
diabetes, hypertension, pack-years of cigarette smoking, creatinine levels and midsagittal area. Note that
the left hippocampus is on average smaller than the right hippocampus
Further adjustment for carotid atherosclerosis, white matter lesions and infarcts did not
change this association (data not shown). In contrast, there was a non-significant decrease
in amygdalar volume with increasing plasma homocysteine levels (Figure 3). Per SD increase
in plasma homocysteine level, the left amygdalar volume decreased –0.01 (95% CI –0.04 to
0.03) and the right amygdalar volume decreased –0.02 ml (95% CI –0.05 to 0.02).
����������������
����
����
����
����
����
����
����
����
� �� �� ��
����������������������������
���
��
���
���
���
���
����
��
�����������������
����
����
����
����
����
����
����
����
� �� �� ��
�����������������������������
���
��
���
���
���
���
����
��

Homocysteine and brain atrophy
39
Figure 3. Amygdalar volumes according to age-specific quintiles of plasma homocysteine levels. The
mean volumes (standard error) are plotted at the median of each quintile and are adjusted for age, sex,
diabetes, hypertension, pack-years of cigarette smoking, creatinine levels and midsagittal area. Note that
the left amygdala is on average smaller than the right amygdala
Figure 4. Global brain atrophy according to age-specific quintiles of plasma homocysteine levels. The
mean atrophy score (standard error) is plotted at the median of each quintile and is adjusted for age, sex,
diabetes, hypertension, pack-years of cigarette smoking and creatinine levels
�������������
����
����
����
����
����
����
� �� �� ��
�����������������������������
��
���
����
���
���
����
��
��������������
����
����
����
����
����
����
� �� �� ��
����������������������������
��
���
����
���
���
����
��
���
���
���
���
���
���
� �� �� ��
��
����
����
���
��
�
����������������������������

Chapter 2.3
40
Figure 4 shows the association between plasma homocysteine levels and severity of cortical
atrophy. The degree of cortical atrophy increased with increasing plasma homocysteine levels
[per SD 0.23 units more (95% CI 0.07 to 0.38)]. This association was unaltered after adjusting
for carotid atherosclerosis [per SD 0.22 (0.06 to 0.37)] and slightly weakened after adjusting
for white matter lesions and infarcts [per SD 0.19 (0.03 to 0.34)].
The results were not materially altered after exclusion of regular users of multivitamin sup-
plements.
Discussion
This study found that increasing plasma homocysteine levels are associated with more hip-
pocampal and cortical atrophy in an older non-demented population.
The chief strength of the present study is the population-based study design and the large
number of volumetric assessments of the hippocampus and amygdala. However, a limitation
was that the instruments used to assess global brain atrophy were somewhat imprecise.
Plasma homocysteine levels reflect vitamin status, renal function and genetic variations in
the enzymes controlling homocysteine metabolism genes.5 Recently, it was shown that a
low plasma folate level may predict more neocortical atrophy at death21 though homocysteine
may have mediated this association. There is no available data on effects of genetic varia-
tions in homocysteine metabolism on brain atrophy. Two putative effects of homocysteine
support a causal association between higher plasma homocysteine levels and brain atrophy.
First, homocysteine damages the vascular walls22 from arteries.23, 24 People with more global
brain atrophy have more frequently atherosclerosis in the carotid arteries and white matter
lesions on MRI, which are assumed to be small vessel disease.25, 26 However, the associa-
tion between plasma homocysteine levels and atrophy was unaltered by adjusting for carotid
atherosclerosis and only partly reduced by adjusting for white matter lesions, suggesting
that other pathways may be involved. Second, neurotoxic effects of homocysteine in cul-
tures of cortical and hippocampal neurones could partly explain the associations.7, 8 These
studies in rats showed that hippocampal neurones were even more sensitive to the effects
of homocysteine7 than cortical neurones.8 Some individuals with hippocampal, and possibly
global, brain atrophy are more likely to develop clinical Alzheimer’s disease.10, 11 The findings
of the present study suggest that higher homocysteine levels may be associated with early
Alzheimer pathology. However, due to the cross-sectional design of the current study, it re-
mains uncertain whether high homocysteine levels actually precede changes in pathology
and cause the brain to shrink. Prospective studies using several atrophy and homocysteine
measurements are necessary to unravel cause and consequence. The finding that high base-
line homocysteine levels in patients with Alzheimer’s disease predicted more rapid atrophy

Homocysteine and brain atrophy
41
of the medial temporal lobe over the following three years supports a causal association.1
Our results confirm cross-sectional studies which show a high plasma homocysteine level to
be associated with Alzheimer’s disease and cognitive impairment.1-3 Furthermore, they are in
keeping with a prospective study which showed that a high plasma homocysteine level is an
independent risk factor of Alzheimer’s disease.4
Several large-scale randomised trials with folic acid-based vitamin supplements to lower ho-
mocysteine levels are currently being conducted and almost all of these trials include an
assessment of cognitive function, some have sub-studies that also include MRI measure-
ments. Further large-scale trials are required to assess whether lowering plasma homo-
cysteine levels may prevent Alzheimer-related structural abnormalities or delay progression of
clinical symptoms of Alzheimer’s disease.
References
1. Clarke R, Smith AD, Jobst KA, Refsum H, Sutton L, Ueland PM. Folate, vitamin B12, and serum
total homocysteine levels in confirmed Alzheimer disease. Arch Neurol 1998; 55:1449-55.
2. Lehmann M, Gottfries CG, Regland B. Identification of cognitive impairment in the elderly:
homocysteine is an early marker. Dement Geriatr Cogn Disord 1999; 10:12-20.
3. McCaddon A, Davies G, Hudson P, Tandy S, Cattell H. Total serum homocysteine in senile de-
mentia of Alzheimer type. Int J Geriatr Psychiatry 1998; 13:235-9.
4. Seshadri S, Beiser A, Selhub J, et al. Plasma homocysteine as a risk factor for dementia and
Alzheimer’s disease. N Engl J Med 2002; 346:476-83.
5. Refsum H, Ueland PM, Nygård O, Vollset SE. Homocysteine and cardiovascular disease. Annu
Rev Med 1998; 49:31-62.
6. Breteler MMB. Vascular involvement in cognitive decline and dementia. Epidemiologic evi-
dence from the Rotterdam Study and the Rotterdam Scan Study. Ann N Y Acad Sci 2000;
903:457-65.
7. Kruman II, Culmsee C, Chan SL, et al. Homocysteine elicits a DNA damage response in neu-
rons that promotes apoptosis and hypersensitivity to excitotoxicity. J Neurosci 2000; 20:6920-
6.
8. Lipton SA, Kim WK, Choi YB, et al. Neurotoxicity associated with dual actions of homocysteine
at the N- methyl-D-aspartate receptor. Proc Natl Acad Sci U S A 1997; 94:5923-8.
9. Cuenod CA, Denys A, Michot JL, et al. Amygdala atrophy in Alzheimer’s disease. An in vivo
magnetic resonance imaging study. Arch Neurol 1993; 50:941-5.
10. Fox NC, Crum WR, Scahill RI, Stevens JM, Janssen JC, Rossor MN. Imaging of onset and pro-
gression of Alzheimer’s disease with voxel- compression mapping of serial magnetic reso-
nance images. Lancet 2001; 358:201-5.

Chapter 2.3
42
11. Jack CR, Jr., Petersen RC, Xu Y, et al. Rates of hippocampal atrophy correlate with change in clini-
cal status in aging and AD. Neurology 2000; 55:484-89.
12. Hofman A, Grobbee DE, de Jong PTVM, van den Ouweland FA. Determinants of disease and
disability in the elderly: the Rotterdam Elderly Study. Eur J Epidemiol 1991; 7:403-22.
13. Hofman A, Laar van A, Klein F, Valkenburg HA. Coffee and cholesterol (letter). New England
Journal of Medicine 1983; 309:1248-1249.
14. Ott A, Breteler MMB, van Harskamp F, Stijnen T, Hofman A. Incidence and risk of dementia. The
Rotterdam Study. Am J Epidemiol 1998; 147:574-80.
15. Roth M, Huppert FA, Tym E. Camdex, The Cambridge examination for mental disorders of the
elderly. Cambridge: Cambridge University Press, 1988.
16. de Groot JC, de Leeuw FE, Oudkerk M, et al. Cerebral white matter lesions and cognitive func-
tion: the Rotterdam Scan Study. Ann Neurol 2000; 47:145-51.
17. Duvernoy HM. The human hippocampus: functional anatomy, vascularization and serial sec-
tions with MRI. Berlin: Springer-Verlag, 1998.
18. Vermeer SE, Van Dijk EJ, Koudstaal PJ, et al. Homocysteine, silent brain infarcts, and white
matter lesions: the Rotterdam Scan Study. Annals of Neurology 2002; 51:285-289.
19. Vermeer SE, Koudstaal PJ, Oudkerk M, Hofman A, Breteler MMB. Prevalence and risk factors
of silent brain infarcts in the population-based Rotterdam Scan Study. Stroke 2002; 33:21-5.
20. Bots ML, van Swieten JC, Breteler MMB, et al. Cerebral white matter lesions and atheroscle-
rosis in the Rotterdam Study. Lancet 1993; 341:1232-7.
21. Snowdon DA, Tully CL, Smith CD, Perez Riley K, Markesbery WR. Serum folate and the sever-
ity of atrophy of the neocortex in Alzheimer disease: findings from the Nun study. Am J Clin
Nutr 2000; 71:993-8.
22. Nappo F, De Rosa N, Marfella R, et al. Impairment of endothelial functions by acute hyperho-
mocysteinemia and reversal by antioxidant vitamins. JAMA 1999; 281:2113-8.
23. Fassbender K, Mielke O, Bertsch T, Nafe B, Fröschen S, Hennerici M. Homocysteine in cerebral
macroangiography and microangiopathy. Lancet 1999; 353:1586-7.
24. Selhub J, Jacques PF, Bostom AG, et al. Association between plasma homocysteine concentra-
tions and extracranial carotid-artery stenosis. N Engl J Med 1995; 332:286-91.
25. Manolio TA, Burke GL, O’Leary DH, et al. Relationships of Cerebral MRI Findings to Ultrasono-
graphic Carotid Atherosclerosis in Older Adults : The Cardiovascular Health Study. Arterioscler
Thromb Vasc Biol 1999; 19:356-365.
26. Meguro K, Yamaguchi T, Hishinuma T, et al. Periventricular hyperintensity on magnetic reso-
nance imaging correlated with brain ageing and atrophy. Neuroradiology 1993; 35:125-9.

43
Chapter 2.4
Alcohol intake and brain MRI findings
Background: Light-to-moderate alcohol consumers have a lower risk of dementia and possi-
bly Alzheimer’s disease compared to abstainers. As vascular disease may contribute to symp-
toms of Alzheimer’s disease, reduction of cerebrovascular disease in light alcohol consumers
could account for these observations. However, a low concentration of alcohol may also have
direct effects on the hippocampus, a brain structure highly affected by Alzheimer’s disease.
Objective: We investigated alcohol intake in relation to brain magnetic resonance imaging
(MRI) findings of presumed vascular origin (white matter lesions and infarcts) and findings
more specifically found in early Alzheimer’s disease (hippocampal and amygdalar atrophy).
Design: In a population-based sample of 1,074 non-demented elderly (age 60-90) we made
brain MRI on which we rated white matter lesions and brain infarcts. In a subset of 509
people, hippocampal and amygdalar volumes on MRI were measured. Alcohol intake was as-
sessed with a structured questionnaire. We categorized alcohol intake into lifetime abstaining,
very light (<1 drink weekly), light (≥1 drink/week to <1 drink/day), moderate (≥1 drink/day to <4
drinks/day) and heavy (≥4 drinks/day).
Results: Light-to-moderate alcohol drinkers had less severe white matter lesions and brain
infarcts on MRI compared to abstainers or heavy drinkers. Abstainers and very light drinkers
had smaller hippocampal and amygdalar volumes on MRI than light-to-moderate drinkers, but
only if carrying an apolipoprotein (APOE) ε4 allele.
Conclusions: Our data suggest that light-to-moderate alcohol intake is associated with a low-
er prevalence of vascular brain findings and -in APOE ε4 carriers- hippocampal and amygdalar
atrophy on MRI.

Chapter 2.4
44
Introduction
Several prospective population-based studies have shown that light-to-moderate alcohol con-
sumers have a lower risk of dementia compared to abstaining or heavy alcohol use.1-4 Most
studies find a relation with vascular dementia,2, 4, 5 consistent with the known beneficial ef-
fects of light-to-moderate alcohol consumption on vascular risk profile6 and risk of stroke.7
Vascular pathology likely contributes to the clinical syndrome in a large proportion of elderly
Alzheimer patients.8, 9 A plausible explanation for the associations that are seen between
alcohol consumption and overall dementia or Alzheimer’s disease3, 4, 10 is therefore that this
is through an effect on vascular pathology. Alternatively, alcohol in low amounts could have
stimulatory effects on the release of acetylcholine in the hippocampus11 and other non-vas-
cular mechanisms might play a role.12 A non-vascular relation between alcohol intake and
Alzheimer’s disease was indeed suggested by our observation in the Rotterdam Study that
alcohol intake seemed only associated with Alzheimer’s disease in carriers of the apolipopro-
tein (APOE) ε4 allele,2 the risk allele for Alzheimer’s disease.13
To further investigate what could underlie the relation between alcohol intake and risk of
dementia, we decided to focus on the relation between alcohol intake and structural brain
findings on MRI of non-demented elderly. We hypothesized that if the effect of alcohol on
dementia risk were purely through an effect on vascular pathology, one would see a relation
between alcohol intake and markers of cerebrovascular disease (brain infarcts, white mat-
ter lesions9, 14-16 but not between alcohol intake and putative presymptomatic MRI markers
of Alzheimer’s disease (hippocampal and amygdalar atrophy17-22 We investigated this in the
population-based Rotterdam Scan Study.
Methods
Study sample
This study was based on data collected in the Rotterdam Scan Study, a population-based
cohort study designed to investigate determinants and consequences of age-related brain
changes on MRI.23 The study had its baseline examinations from 1995 to 1996. At that time,
we made a random selection of 1,904 elderly aged 60 to 90 years originating from two popu-
lation cohort studies in strata of age (5 years) and sex. After exclusion of persons with demen-
tia,24 or contraindications to undergo MRI (such as metal clips, pacemaker, or claustrophobia),
1,717 persons were eligible of whom 1,077 participated and gave written informed consent
(participation rate 63%, mean age 72.2 years, 52% women). The medical ethics committee
of Erasmus Medical Center approved the study protocol.

Alcohol intake and brain MRI
45
Alcohol intake
A physician questioned each participant at baseline examinations about alcohol intake with a
structured questionnaire. Alcohol intake was coded into lifetime abstaining, former drinking
and current drinking (defined as having consumed alcohol during the past 12 months). Current
and former drinkers were asked about the amount of their alcohol consumption. The amount
assessed with this questionnaire correlated well with the information obtained by a food fre-
quency questionnaire administered five years before in part of the sample (Pearson r=0.72,
P<0.01).25 We categorized current alcohol drinkers into very light (<1 drink weekly), light (≥1
drink/week to <1 drink/day), moderate (≥1 drink/day to <4 drinks/day) and heavy (≥4 drinks/
day) drinkers similar to our previous report on dementia.2 For three participants information
on alcohol intake was missing.
MRI acquisition
All participants underwent axial T1, T2 and proton-density weighted brain MRI scanning with
a 1.5-Tesla unit (Philips or Siemens) at baseline.26 Only the Siemens MRI unit, in which 563
participants had their MRI brain scan, allowed us to additionally include a custom-made three
dimensional (3D) MRI sequence (Half-Fourier Acquisition Single-Shot Turbo Spin Echo27 for
volumetric assessment of the hippocampus and amygdala. Fifty-two of the 563 participants
developed claustrophobia during the MRI acquisition and another two had no information on
alcohol intake, leaving 509 participants with information on alcohol intake and hippocampal
and amygdalar volumes.
Cerebrovascular disease on MRI
MRI measurements were performed blinded to clinical information of the participants.26, 28
White matter lesions were considered present if visible as hyperintense on proton-density
and T2 weighted images, without prominent hypointensity on T1 weighted scans. Periven-
tricular white matter lesions were scored semi-quantitatively from 0-9 and subcortical white
matter lesions were counted in different size categories to approximate a total lesion volume
(ml).26 We defined infarcts as focal hyperintensities on T2 weighted images. Infarcts in the
white matter also had to have corresponding hypointensities on T1 weighted images in order
to distinguish them from white matter lesions. Infarcts on MRI were classified as silent or
symptomatic.28
Hippocampal and amygdalar volumes on MRI
We constructed a series of coronal brain slices (contiguous 1.5-mm slice thickness) from
the 3D MRI, aligned to be perpendicular to the long axis of the hippocampus. We manually
traced the boundaries of the hippocampus and amygdala on both sides on each slice with a

Chapter 2.4
46
mouse-driven cursor.27 The summed surface areas were multiplied by slice thickness to yield
estimates of the hippocampal and amygdalar volume (ml). The left and right-sided volumes
were summed to yield the total hippocampal and amygdalar volume. As a proxy for head
size, we measured on the middle sagittal MRI slice the intracranial cross-sectional area.27 We
corrected for head size differences across individuals by dividing the uncorrected volumes by
the subject’s calculated head size area and subsequently multiplying this ratio by the average
head size area (men and women separately).29, 30
Covariates
The following covariates were assessed at baseline by interview and physical examination:
pack-years of cigarette smoking, educational level, body mass index, diabetes mellitus and
hypertension.28 APOE genotype testing was performed31 and available for 969 participants in
the total sample and 436 participants in the subset with hippocampal and amygdalar volume
assessment; the remainder was mainly missing owing to no blood available. Participants
were classified into carrier or non-carrier of an APOE ε4 allele; those with genotype APOE
ε2ε4 (n=22 in the total sample and 9 in the subsample) were excluded in analyses considering
APOE genotype.
Data analysis
We used multivariable linear regression to quantify the association between alcohol intake
categories and white matter lesions and hippocampal and amygdalar volumes. With logis-
tic regression, we calculated the adjusted odds ratio (95% confidence interval (CI)) of brain
infarcts across alcohol intake categories using abstainers as the reference category. For tests
of linear trend, we treated the categories of alcohol intake as continuous variable. For tests of
quadratic trend, we squared the linear trend variable. As covariates we included age, sex and
pack-years of cigarette smoking. Additionally, we adjusted for educational level, body mass
index, diabetes and hypertension. We evaluated whether the effects of alcohol differed across
sex and APOE genotype (carrier or non-carrier of the APOE ε4 allele) by performing stratified
analyses and including interaction terms in the model.
Results
There were no differences in baseline characteristics between the total sample and the sub-
sample with assessment of hippocampal and amygdalar volumes on MRI (Table 1). In Table 2
characteristics according to alcohol intake categories are given for the total sample. Former
drinkers (n=86 in the total sample and n=42 in the subsample) more frequently had hyper-
tension and diabetes mellitus compared to current drinkers supporting our presumption that

Alcohol intake and brain MRI
47
former drinkers could have stopped drinking due to illness. Therefore, former drinkers were
excluded from analyses on alcohol intake and brain MRI findings.
Table 1. Characteristics of the total study sample and of the subsample with assessment of hippocampal
and amygdalar volumes on 3D MRI
Total sample
(n=1074)
Subsample with 3D MRI
(n=509)
Age, years 72 ± 7 73 ± 8
Women, % 52 49
Current alcohol intake, drinks/day 1.2 ± 1.3 1.2 ± 1.4
Former alcohol users, % 8 8
Pack-years of cigarette smoking 19 ± 24 20 ± 25
Primary education, % 35 31
Body mass index, kg/m2 27 ± 4 26 ± 4
Presence of diabetes, % 7 6
Presence of hypertension, % 52 53
Presence of APOE ε4 allele, %* 28 27
Presence of symptomatic infarct on MRI, % 4 6
Values are means ± standard deviation or percentages.
*Available in 969 out of the 1074 and in 436 out of the 509.
Table 3 shows that light alcohol drinkers had the lowest degree of periventricular white mat-
ter lesions on MRI (adjusted difference compared to abstainers 0.69 (95% CI 0.25 to 1.13,
P = 0.002); compared to heavy drinkers 0.79 (95% CI 0.17 to 1.41, P = 0.01)). They also had
less subcortical white matter lesions but differences did not reach statistical significance (ad-
justed difference compared to abstainers 0.57 (95% CI –0.05 to 1.20, P = 0.07); compared
to heavy drinkers 0.35 (95% CI –0.54 to 1.24, P = 0.44)). Brain infarcts on MRI were less
frequently found in very light and light drinkers but none of the odds ratios reached statistical
significance (Table 3). When we excluded persons with symptomatic infarcts on MRI (n=42),
because they could have changed alcohol intake after the stroke, results remained similar. The
associations did not change after additional adjustments for educational level, body mass in-
dex, diabetes and hypertension and were similar in men and women and in APOE ε4 carriers
and non-ε4 carriers.

Chapter 2.4
48
Tab
le 2
. Cha
ract
eris
tics
acco
rdin
g to
cur
rent
alc
ohol
inta
ke in
the
tot
al s
ampl
e
Alc
ohol
inta
ke
Abs
tain
ers
Very
ligh
t
(<1/
wee
k)
Ligh
t
(≥1/
wee
k - <
1/da
y)
Mod
erat
e
(1-3
/day
)
Hea
vy
(≥4/
day)
Form
er d
rinke
rs
(n=
114)
(n=
195)
(n=
247)
(n=
386)
(n=
46)
(n=
86)
Age
, yea
rs72
± 8
73 ±
872
± 8
72 ±
770
± 7
74 ±
7
Wom
en, %
7869
5038
2655
Pack
-yea
rs o
f ci
gare
tte
smok
ing
7 ±
16
14 ±
22
18 ±
22
23 ±
24
37 ±
33
21 ±
25
Prim
ary
educ
atio
n, %
4538
3428
3945
Bod
y m
ass
inde
x, k
g/m
227
± 4
27 ±
427
± 4
26 ±
326
± 3
26 ±
4
Pres
ence
of
diab
etes
, %10
75
54
17
Pres
ence
of
hype
rten
sion
, %56
5651
4754
59
Pres
ence
of A
PO
E ε
4 al
lele
, %31
2323
2830
39
Pres
ence
of
sym
ptom
atic
infa
rct
on M
RI,
%6
32
54
2
Valu
es a
re m
eans
±st
anda
rd d
evia
tion
or p
erce
ntag
es

Alcohol intake and brain MRI
49
Tab
le 3
. Vas
cula
r br
ain
MR
I find
ings
acc
ordi
ng t
o al
coho
l int
ake
in t
he t
otal
sam
ple
Alc
ohol
inta
ke
Abs
tain
ers
Very
ligh
t
(<1/
wee
k)
Ligh
t
(≥1/
wee
k - <
1/da
y)
Mod
erat
e
(1-3
/day
)
Hea
vy
(≥4/
day)
(n=
114)
(n=
195)
(n=
247)
(n=
386)
(n=
46)
P v
alue
for T
rend
*
Line
ar (Q
uadr
atic
)
Whi
te m
atte
r le
sion
s Periv
entr
icul
ar,
mea
n gr
ade
± S
E†
2.73
± 0
.19
2.51
± 0
.14
2.04
± 0
.12
2.37
± 0
.10
2.83
± 0
.29
0.00
1 (0
.001
)
Sub
cort
ical
mea
n vo
lum
e (m
l) ±
SE
† 1.
58 ±
0.2
71.
60 ±
0.2
01.
01 ±
0.1
81.
49 ±
0.1
41.
36 ±
0.4
20.
31 (0
.36)
Bra
in in
farc
ts
Num
ber
(%)
34 (3
0)43
(22)
52 (2
1)94
(24)
9 (2
0)
Odd
s ra
tio (9
5% C
I)‡1.
00 (r
ef)
0.63
(0.3
6-1.
09)
0.65
(0.3
8-1.
12)
0.86
(0.5
2-1.
43)
0.80
(0.3
3-1.
96)
0.14
(0.1
1)
*P-v
alue
for
tren
d ca
lcul
ated
fro
m m
ultip
le li
near
reg
ress
ion
mod
els
with
alc
ohol
inta
ke in
cat
egor
ies
and
its s
quar
ed t
erm
.
†AN
CO
VA w
as u
sed
for
calc
ulat
ing
adju
sted
mea
ns in
gro
ups.
Adj
uste
d fo
r ag
e, s
ex, a
nd p
ack-
year
s of
cig
aret
te s
mok
ing.
‡Log
istic
reg
ress
ion
was
use
d to
cal
cula
te a
djus
ted
odds
rat
ios.
Adj
uste
d fo
r ag
e, s
ex, a
nd p
ack-
year
s of
cig
aret
te s
mok
ing

Chapter 2.4
50
Tab
le 4
. Hip
poca
mpa
l and
am
ygda
lar
volu
me
on M
RI a
ccor
ding
to
alco
hol i
ntak
e in
the
sub
sam
ple
Alc
ohol
inta
ke
Abs
tain
ers
Very
ligh
t
(<1/
wee
k)
Ligh
t
(≥1/
wee
k - <
1/da
y)
Mod
erat
e
(1-3
/day
)
Hea
vy
(≥4/
day)
(n=
38)
(n=
97)
(n=
103)
(n=
209)
(n=
20)
P v
alue
for T
rend
*
Line
ar (Q
uadr
atic
)
Hip
poca
mpa
l vol
ume
(ml)
± S
E†
6.33
± 0
.14
6.41
± 0
.09
6.47
± 0
.08
6.38
± 0
.06
6.28
± 0
.20
0.30
(0.2
5)
Am
ygda
lar
volu
me
(ml)
± S
E†
4.56
± 0
.11
4.49
± 0
.07
4.63
± 0
.07
4.62
± 0
.05
4.62
± 0
.16
0.66
(0.9
0)
*P-v
alue
for
tren
d ca
lcul
ated
fro
m m
ultip
le li
near
reg
ress
ion
mod
els
with
alc
ohol
inta
ke in
cat
egor
ies
and
its s
quar
ed t
erm
.
†AN
CO
VA w
as u
sed
for
calc
ulat
ing
adju
sted
mea
ns in
gro
ups.
Adj
uste
d fo
r ag
e, s
ex, a
nd p
ack-
year
s of
cig
aret
te s
mok
ing

Alcohol intake and brain MRI
51
Table 4 shows that overall there was no association between alcohol intake and hippocampal
or amygdalar volumes on MRI. However, the effect of alcohol intake on volumes differed ac-
cording to APOE genotype (P-value of interaction term = 0.02 for hippocampal volume and
P = 0.07 for amygdalar volume). In carriers of the ε4 allele, alcohol intake was positively as-
sociated with hippocampal and amygdalar volumes, whereas in non-ε4 carriers there was no
association (Figure 1). The associations between alcohol intake and hippocampal or amygdalar
volumes did not change after additional adjustment for educational level, body mass index,
diabetes and hypertension and were similar in men and women.
Figure 1. Hippocampal and amygdalar volume on MRI according to alcohol intake in strata of APOE geno-
type (non-ε4 carrier (n=288) and ε4 carrier (n=101)). Volumes were adjusted for age, sex and pack-years of
cigarette smoking and normalized to average head size. Error bars indicate standard error of the mean
������������������������������
���������� ������� �����������������
������� ������
��������������
���
��
���
���
���
���
����
��
���
���
���
���
���
���
���
���
���
Abstainers <1/week 1/weekand <1/day
1-3/day 4+/day
��������������
��
���
����
���
���
����
��
����������������������������������������������������
������� ��������������������������������������������
���������������������������������������������������
������� ��������������������������������������������

Chapter 2.4
52
Discussion
In this population-based study in the elderly, we found that light-to-moderate alcohol drinkers
had less cerebral white matter lesions and brain infarcts on MRI compared to abstainers and
heavy drinkers. In APOE ε4 carriers, but not in non-ε4 carriers, we found a positive association
between alcohol intake and hippocampal and amygdalar volumes on MRI.
The strength of our study is the large sample with brain MRI and volumetric assessments of
the hippocampus and amygdala. Some methodological issues need to be discussed. First, we
relied on self-reported alcohol intake, which may have led to underreporting or overreporting.
Although we may misclassify absolute amounts of alcohol intake, the ranking of people ac-
cording to their alcohol intake will be adequate.32 Second, we assessed average alcohol intake
over a 1-year period before MRI examinations while it might be better to have information on
the average alcohol intake over the lifetime. Finally, we had no detailed information on the
type of alcoholic drink used. Previous studies showed that moderate beer, liquids or wine con-
sumption are equally associated with a reduced risk of dementia,2, 4 though the Copenhagen
City Heart Study found the association only for moderate wine consumption.10
Light-to-moderate alcohol drinking is associated with a reduced risk of cognitive impairment
and dementia compared to lifetime abstention.1-4, 10, 33, 34 In line with the beneficial effects of
alcohol on lipid profile, hemostatic factors,6 and atherosclerosis,35 most investigators found
a reduced risk of vascular dementia in light-to-moderate alcohol consumers.2, 4, 5 Consistent
with these vascular effects of alcohol and with observations in the Cardiovascular Health
Study (CHS),36 we found that light-to-moderate alcohol consumers had less cerebral white
matter lesions -in particular in the periventricular region- and infarcts on MRI. Different patho-
physiological events may lead to either periventricular or subcortical white matter lesions.14
Especially the periventricular white matter is vulnerable to ischemia and severe periventricular
white matter lesions are related to carotid atherosclerosis.37 Light-to-moderate alcohol drink-
ing has also been associated with a reduced risk of Alzheimer’s disease in several,1, 3, 4, 10, 38
but not all studies.39, 40 Besides reducing cerebrovascular pathology which contributes to the
development of symptoms of Alzheimer’s disease8, 9, 24 alcohol in moderate amounts may also
increase the release of acetylcholine of the hippocampus,11 has antioxidative effects41 and in-
duce the release of potentially beneficial prostaglandins.12 The traditional Alzheimer pathology,
i.e. amyloid plaques and neurofibrillary tangles accumulates in the brain with high predilection
of the medial temporal lobe.42 This may lead to neuronal loss and atrophy in vivo detectable on
MRI even in persons who have not yet developed clinical symptoms of dementia.17-22 APOE ε4
carriers are at increased risk to develop Alzheimer neuropathology,43 atrophy of structures in
the medial temporal lobe44 and clinical Alzheimer’s disease.13 Observations in the Rotterdam
Study suggested that light-to-moderate alcohol consumption is associated with a reduced risk

Alcohol intake and brain MRI
53
of Alzheimer’s disease only in APOE ε4 carriers.2 Carmelli et al45 also reported a stronger as-
sociation of light drinking and better cognitive performance in APOE ε4 carriers. In our current
study, we found that APOE ε4 carriers who were light-to-moderate alcohol drinkers had less
hippocampal and amygdalar atrophy compared to abstainers. Although not all persons with
hippocampal or amygdalar atrophy will develop Alzheimer’s disease, they are at increased risk
to develop clinical symptoms of Alzheimer’s disease18 and, as such, our finding support the
hypothesis that there could be a reduced risk of Alzheimer’s disease for light-to-moderate
alcohol drinkers with the APOE ε4 allele. Alcohol has antioxidative properties41 and this might
suppress the highly sensitive peroxidation of the apolipoprotein ε4,46 and thereby amyloid
plaque formation in the medial temporal lobe47, 48 or neurotoxicity of ß-amyloid.49 Surprisingly,
the CHS found a lower risk of dementia in alcohol users to be more consistent among persons
without the APOE ε4 allele.4 Possibly the younger population studied in the Rotterdam Study
compared to the CHS led to these discrepancies because the APOE ε4 allele is a stronger
risk factor for Alzheimer’s disease at younger ages.13 The EVA study also found a reduced risk
of cognitive deterioration with alcohol intake in non-ε4 carriers but in that study the APOE ε4
allele itself was not a risk factor for cognitive decline.50
To conclude, our findings suggest that light-to-moderate alcohol intake is associated to brain
MRI findings indicative of cerebrovascular disease and -in APOE ε4 carriers- to hippocampal
and amygdalar atrophy on MRI. Given the possibility of confounding in observational studies
on alcohol use, and the potentially dangerous effects of alcohol, recommendations to start
drinking alcohol cannot be given. Our findings are however in line with observations that light-
to-moderate alcohol consumption is associated with a reduced risk of dementia.
References
1. Orgogozo JM, Dartigues JF, Lafont S, et al. Wine consumption and dementia in the elderly: a
prospective community study in the Bordeaux area. Rev Neurol (Paris) 1997; 153:185-92.
2. Ruitenberg A, van Swieten JC, Witteman JCM, et al. Alcohol consumption and risk of demen-
tia: the Rotterdam Study. Lancet 2002; 359:281-6.
3. Huang W, Qiu C, Winblad B, Fratiglioni L. Alcohol consumption and incidence of dementia in a
community sample aged 75 years and older. J Clin Epidemiol 2002; 55:959-64.
4. Mukamal KJ, Kuller LH, Fitzpatrick AL, Longstreth WT, Jr., Mittleman MA, Siscovick DS. Pro-
spective study of alcohol consumption and risk of dementia in older adults. JAMA 2003;
289:1405-13.
5. Hébert R, Lindsay J, Verreault R, Rockwood K, Hill G, Dubois MF. Vascular dementia : incidence
and risk factors in the Canadian study of health and aging. Stroke 2000; 31:1487-93.
6. Rimm EB, Williams P, Fosher K, Criqui M, Stampfer MJ. Moderate alcohol intake and lower

Chapter 2.4
54
risk of coronary heart disease: meta- analysis of effects on lipids and haemostatic factors. BMJ
1999; 319:1523-1528.
7. Reynolds K, Lewis B, Nolen JD, Kinney GL, Sathya B, He J. Alcohol consumption and risk of
stroke: a meta-analysis. JAMA 2003; 289:579-88.
8. de la Torre JC. Alzheimer disease as a vascular disorder: nosological evidence. Stroke 2002;
33:1152-62.
9. Kalaria RN. The role of cerebral ischemia in Alzheimer’s disease. Neurobiol Aging 2000; 21:321-
30.
10. Truelsen T, Thudium D, Grønbæk M. Amount and type of alcohol and risk of dementia: the Co-
penhagen City Heart Study. Neurology 2002; 59:1313-9.
11. Henn C, Loffelholz K, Klein J. Stimulatory and inhibitory effects of ethanol on hippocampal
acetylcholine release. Naunyn Schmiedebergs Arch Pharmacol 1998; 357:640-7.
12. Das UN. Alcohol consumption and risk of dementia. Lancet 2002; 360:490.
13. Farrer LA, Cupples LA, Haines JL, et al. Effects of age, sex, and ethnicity on the association be-
tween apolipoprotein E genotype and Alzheimer disease. A meta-analysis. APOE and Alzhe-
imer Disease Meta Analysis Consortium. JAMA 1997; 278:1349-56.
14. Pantoni L, Garcia JH. Pathogenesis of leukoaraiosis: a review. Stroke 1997; 28:652-9.
15. Wong TY, Klein R, Sharrett AR, et al. Cerebral white matter lesions, retinopathy, and incident
clinical stroke. JAMA 2002; 288:67-74.
16. Barber R, Scheltens P, Gholkar A, et al. White matter lesions on magnetic resonance imaging in
dementia with lewy bodies, Alzheimer’s disease, vascular dementia, and normal aging. J Neu
rol Neurosurg Psychiatry 1999; 67:66-72.
17. Bobinski M, de Leon MJ, Wegiel J, et al. The histological validation of post mortem magnetic
resonance imaging- determined hippocampal volume in Alzheimer’s disease. Neuroscience
2000; 95:721-5.
18. Jack CR, Jr., Petersen RC, Xu YC, et al. Prediction of AD with MRI-based hippocampal volume in
mild cognitive impairment. Neurology 1999; 52:1397-1403.
19. Scheltens P, Fox N, Barkhof F, De Carli C. Structural magnetic resonance imaging in the practical
assessment of dementia: beyond exclusion. Lancet Neurol 2002; 1:13-21.
20. Mizuno K, Wakai M, Takeda A, Sobue G. Medial temporal atrophy and memory impairment in
early stage of Alzheimer’s disease: an MRI volumetric and memory assessment study. J Neu
rol Sci 2000; 173:18-24.
21. Killiany RJ, Gomez-Isla T, Moss M, et al. Use of structural magnetic resonance imaging to pre-
dict who will get Alzheimer’s disease. Ann Neurol 2000; 47:430-9.
22. Convit A, de Leon MJ, Tarshish C, et al. Hippocampal volume losses in minimally impaired
elderly. Lancet 1995; 345:266.
23. Breteler MMB. Vascular involvement in cognitive decline and dementia. Epidemiologic evi-

Alcohol intake and brain MRI
55
dence from the Rotterdam Study and the Rotterdam Scan Study. Ann N Y Acad Sci 2000;
903:457-65.
24. Vermeer SE, Prins ND, den Heijer T, Hofman A, Koudstaal PJ, Breteler MMB. Silent brain inf-
arcts and the risk of dementia and cognitive decline. N Engl J Med 2003; 348:1215-22.
25. Klipstein-Grobusch K, den Breeijen JH, Goldbohm RA, et al. Dietary assessment in the elderly:
validation of a semiquantitative food frequency questionnaire. Eur J Clin Nutr 1998; 52:588-
96.
26. de Groot JC, de Leeuw FE, Oudkerk M, et al. Cerebral white matter lesions and cognitive func-
tion: the Rotterdam Scan Study. Ann Neurol 2000; 47:145-51.
27. Hackert VH, den Heijer T, Oudkerk M, Koudstaal PJ, Hofman A, Breteler MMB. Hippocam-
pal head size associated with verbal memory performance in nondemented elderly. Neuroim
age 2002; 17:1365-72.
28. Vermeer SE, Koudstaal PJ, Oudkerk M, Hofman A, Breteler MMB. Prevalence and risk factors
of silent brain infarcts in the population-based Rotterdam Scan Study. Stroke 2002; 33:21-5.
29. Callen DJ, Black SE, Gao F, Caldwell CB, Szalai JP. Beyond the hippocampus: MRI volumetry
confirms widespread limbic atrophy in AD. Neurology 2001; 57:1669-74.
30. Cuenod CA, Denys A, Michot JL, et al. Amygdala atrophy in Alzheimer’s disease. An in vivo
magnetic resonance imaging study. Arch Neurol 1993; 50:941-5.
31. Wenham PR, Price WH, Blandell G. Apolipoprotein E genotyping by one-stage PCR. Lancet
1991; 337:1158-9.
32. Feunekes GI, van ‘t Veer P, van Staveren WA, Kok FJ. Alcohol intake assessment: the sober
facts. Am J Epidemiol 1999; 150:105-12.
33. Dufouil C, Ducimetiere P, Alperovitch A. Sex differences in the association between alcohol
consumption and cognitive performance. EVA Study Group. Epidemiology of Vascular Aging.
Am J Epidemiol 1997; 146:405-12.
34. Elias PK, Elias MF, D’Agostino RB, Silbershatz H, Wolf PA. Alcohol consumption and cognitive
performance in the Framingham Heart Study. Am J Epidemiol 1999; 150:580-9.
35. Kiechl S, Willeit J, Rungger G, Egger G, Oberhollenzer F, Bonora E. Alcohol consumption and
atherosclerosis: what is the relation? Prospective results from the Bruneck Study. Stroke 1998;
29:900-7.
36. Mukamal KJ, Longstreth WT, Jr., Mittleman MA, Crum RM, Siscovick DS. Alcohol consumption
and subclinical findings on magnetic resonance imaging of the brain in older adults: the cardio-
vascular health study. Stroke 2001; 32:1939-46.
37. de Leeuw FE, de Groot JC, Bots ML, et al. Carotid atherosclerosis and cerebral white matter
lesions in a population based magnetic resonance imaging study. J Neurol 2000; 247:291-6.
38. Bachman DL, Green RC, Benke KS, Cupples LA, Farrer LA. Comparison of Alzheimer’s disease
risk factors in white and African American families. Neurology 2003; 60:1372-1374.

Chapter 2.4
56
39. Tanaka N, Asada T, Kinoshita T, Yamashita F, Uno M. Alcohol consumption and risk of dementia.
Lancet 2002; 360:491.
40. Hebert LE, Scherr PA, Beckett LA, et al. Relation of smoking and alcohol consumption to inci-
dent Alzheimer’s disease. Am J Epidemiol 1992; 135:347-55.
41. Hillbom M. Oxidants, antioxidants, alcohol and stroke. Front Biosci 1999; 4:e67-71.
42. Braak H, Braak E. Neuropathological stageing of Alzheimer-related changes. Acta Neuropathol
1991; 82:239-59.
43. Bennett DA, Wilson RS, Schneider JA, et al. Apolipoprotein E e4 allele, AD pathology, and the
clinical expression of Alzheimer’s disease. Neurology 2003; 60:246-52.
44. den Heijer T, Oudkerk M, Launer LJ, van Duijn CM, Hofman A, Breteler MMB. Hippocampal,
amygdalar, and global brain atrophy in different apolipoprotein E genotypes. Neurology 2002;
59:746-8.
45. Carmelli D, Swan GE, Reed T, Schellenberg GD, Christian JC. The effect of apolipoprotein E
epsilon4 in the relationships of smoking and drinking to cognitive function. Neuroepidemiology
1999; 18:125-33.
46. Jolivalt C, Leininger-Muller B, Bertrand P, Herber R, Christen Y, Siest G. Differential oxidation of
apolipoprotein E isoforms and interaction with phospholipids. Free Radic Biol Med 2000;
28:129-40.
47. Strittmatter WJ, Weisgraber KH, Huang DY, et al. Binding of human apolipoprotein E to syn-
thetic amyloid beta peptide: isoform-specific effects and implications for late-onset Alzheimer
disease. Proc Natl Acad Sci U S A 1993; 90:8098-102.
48. Pike CJ, Burdick D, Walencewicz AJ, Glabe CG, Cotman CW. Neurodegeneration induced by
beta-amyloid peptides in vitro: the role of peptide assembly state. J Neurosci 1993; 13:1676-
87.
49. Huang HM, Ou HC, Hsieh SJ. Antioxidants prevent amyloid peptide-induced apoptosis and
alteration of calcium homeostasis in cultured cortical neurons. Life Sci 2000; 66:1879-92.
50. Dufouil C, Tzourio C, Brayne C, Berr C, Amouyel P, Alpérovitch A. Influence of apolipoprotein E
genotype on the risk of cognitive deterioration in moderate drinkers and smokers. Epidemiol
ogy 2000; 11:280-4.

57
Chapter 2.5
Apolipoproteine E genotype and brain atrophy
The ε4 allele of the APOE gene increases the risk for Alzheimer’s disease (AD),
whereas the ε2 allele may be protective. The authors assessed the impact of
APOE genotype on hippocampal, amygdalar and global brain atrophy as puta-
tive markers of preclinical AD in a non-demented population. Carriers of ε4 had
significantly more hippocampal and amygdalar atrophy than ε3ε3 subjects, but
not more global brain atrophy. Carriers of ε2 did not have less brain atrophy than
ε3ε3 subjects.

Chapter 2.5
58
Introduction
The elevated risk of APOE allele ε4 for AD is well established, whereas the APOE allele ε2
may have a protective effect on AD. Hippocampal and amygdalar atrophy are putative early
markers of AD. MRI studies investigating the impact of APOE genotype on the degree of
hippocampal atrophy have yielded contradictory findings.1-6 Some studies found demented
persons carrying the ε4 allele to have more severe hippocampal atrophy1, 2 but other studies
did not.3, 4 Suggestions that primarily the right hippocampus is affected in non-demented and
demented ε4 carriers need further study.5, 6 Most studies, although not all,7 showed no effect
of the ε4 allele on the degree of global brain atrophy, which occurs probably later in the course
of AD.3, 6, 8 To our knowledge, no studies specifically evaluated the relation of the ε2 allele with
the degree of hippocampal, amygdalar, and global brain atrophy. The aim of this study was to
assess whether hippocampal, amygdalar, and global brain atrophy in non-demented elderly
subjects differed according to APOE genotype. We hypothesized that ε2 carriers would have
less and ε4 carriers more atrophy than those with the common APOE ε3ε3 genotype.
Methods
Subjects and procedures
In 1995 and 1996, we invited 1,904 elderly aged 60 to 90 years to participate as part of the
Rotterdam Scan Study.9 We excluded persons who were demented, were blind or had MRI
contraindications, leaving 1,717 persons eligible. Complete information, including a cerebral
MRI scan, was obtained in 1,077 individuals, who gave written informed consent (participa-
tion rate 63%). The medical ethics committee of Erasmus University, Rotterdam, the Nether-
lands approved the study.
MRI examinations were done using a 1.5 Tesla MR unit and included an axial T1 weighted
scan (repetition time [TR] 485 ms or 700 ms, echo time [TE] 14 ms, slice thickness 5 or 6
mm, interslice gap 20%). For volumetric measurements of the hippocampus and amygdala,
a custom-made, inversion recovery - double contrast 3D half-Fourier acquisition single-shot
turbo spin echo (HASTE) sequence was included (inversion time 440 ms, [TR] 2800 ms, 128
contiguous sagittal slices of 1.2-mm, matrix 192x256, field of view 256x256). Two HASTE
modules were sequentially acquired after the inversion pulse (effective TE of 29 ms and 440
ms); the first was used for the volume measurements. This 3D sequence was done in a sub-
sample of 563 subjects; 52 developed claustrophobia during the measurement, leaving 511
subjects. APOE genotyping was performed on coded DNA samples10 without knowledge of
MRI measurements. APOE genotyping was present for 971 in the total sample and 437 in
the subsample; the remainder was missing owing to no blood available. The allele frequencies

Apolipoproteine E genotype and brain atrophy
59
were ε2=0.08, ε3=0.77, and ε4=0.15, which was in Hardy-Weinberg equilibrium (χ2=0.6, df=3:
P>0.2). Memory function was evaluated by a 15 word verbal word learning task that tests im-
mediate and delayed recall (after 15 minutes).
MRI measurements
MRI measurements were done blinded to clinical characteristics. Global brain atrophy was
scored on T1 weighted scans for cortical atrophy based on the size of gyri and sulci at five
locations (0 [no cortical atrophy] to 3 [severe cortical atrophy]: total range 0 to 15), and for
subcortical atrophy by the ventricle-to-brain ratio (average of assessments at three loca-
tions). Intra- and interreader studies showed moderate to good agreement. Hippocampal
and amygdalar volumes were measured on coronal slices (1.5-mm, no interslice gap) recon-
structed from the HASTE to be perpendicular to the long axis of the hippocampus. The left
and right hippocampus and amygdala were manually traced with a mouse-driven cursor on a
SUN work station featuring a Magic View 1000 program using boundaries similar to others.4
The anterior boundary of the amygdala was defined as the plane including the most anterior
part of the temporal stem. Volumes were calculated by summing the areas multiplied by slice
thickness. Intra- and interreader studies showed intraclass correlation coefficients exceeded
r=0.77. We also measured the midsagittal area by tracing the inner skull in order to have a
proxy for intracranial volume.
Data analyses
APOE genotypes were grouped in at least one APOE ε2 allele (APOE ε2+), APOE ε3ε3, or
at least one APOE ε4 allele (APOE ε4+). Subjects with APOE ε2ε4 genotype were excluded
(n=22 in the total study sample and n=9 in the subsample). The APOE group was entered as
a categorical dummy variable (with APOE ε3ε3 as reference) into a multiple linear regression
model (analysis of covariance). This model included age, sex and -in the hippocampal and
amygdalar analyses- midsagittal area as covariates. We calculated adjusted means in cortical
and subcortical atrophy and hippocampal and amygdalar volumes across APOE genotypes
by entering the mean age, sex distribution, and -in the hippocampal and amygdalar analyses-
mean midsagittal area in the linear regression model. Analyses were done for the left and
right hippocampal and amygdalar volume separately and for the sum of left and right volumes.
Finally, we repeated the analyses excluding persons with a memory score (immediate or de-
layed recall) <1.5 SD of the age- and education- adjusted means.

Chapter 2.5
60
Results
Characteristics according to APOE genotype are shown in Table 1. The total study sample
comprised 24 subjects homozygous for the ε4 allele, 10 of whom were in the subsample.
Carriers of ε4 had more often a low memory score than those with APOE ε3ε3 (P=0.01).
APOE genotype was not related to global brain atrophy (age- and sex- adjusted means [SEM]
for cortical atrophy: ε2+ =5.63 [0.21], ε3ε3 =5.46 [0.09], ε4+ =5.57 [0.14], [P=0.65]; for sub-
cortical atrophy ε2+ =0.321 [0.003], ε3ε3 =0.316 [0.001], ε4+ =0.316 [0.002], [P=0.19]).
Carriers of ε4 had significantly smaller hippocampi and amygdalae than did subjects with
APOE ε3ε3, both on the left and right side (Table 2). APOE ε2 carriers did not have larger hip-
pocampal or amygdalar volumes compared to APOE ε3ε3 subjects. In contrast, their average
volumes approximated those of ε4 carriers (difference in total hippocampal and total amy-
gdalar volume for ε2 versus ε4 carriers 0.09 ml [-0.18 to 0.35] and 0.13 ml [-0.10 to 0.35]).
Table 1. Characteristics of study sample according to APOE genotype
APOE genotype*
CharacteristicAPOE ε2+
(n=120)
APOE ε3ε3
(n=568)
APOE ε4+
(n=261)
Age, years 72 ± 7 73 ± 7 71 ± 7
Sex, % women 58 51 52
Mini-Mental State Examination 27.7 ± 2.0 27.5 ± 2.1 27.1 ± 2.5
Memory score < 1.5 SD, %† 7 9 15
Cortical atrophy, range 0-15 5.63 ± 2.71 5.56 ± 2.77 5.35 ± 2.82
Subcortical atrophy, ratio 0.321 ± 0.039 0.317 ± 0.036 0.314 ± 0.032
Hippocampus (ml)‡
Left 3.12 ± 0.45 3.19 ± 0.46 3.12 ± 0.45
Right 3.21 ± 0.39 3.26 ± 0.45 3.19 ± 0.47
Amygdala (ml)‡
Left 2.22 ± 0.30 2.25 ± 0.38 2.17 ± 0.41
Right 2.31 ± 0.36 2.35 ± 0.41 2.28 ± 0.40
Values are unadjusted means ±SD or percentages.
* Subjects with APOE ε2ε4 (n=22) were excluded.
† Percentage of subjects with memory score <1.5 SD below the age and education adjusted means.
‡ Hippocampal and amygdalar volumes were assessed in 428 subjects

Apolipoproteine E genotype and brain atrophy
61
Hippocampal and amygdalar volumes decreased with increasing ε4 dose (difference with
ε3ε3 subjects, total hippocampal volume: 1 allele –0.17 ml [95% CI –0.35 to 0.02], 2 alleles
–0.71 ml [95% CI –1.22 to –0.20]; total amygdalar volume: 1 allele –0.17 ml [95% CI –0.33 to
–0.02], 2 alleles –0.42 ml [95% CI –0.85 to 0.02]).
Table 2. Difference in hippocampal and amygdalar volume according to APOE genotype
Difference in volume (95% CI)
as compared to subjects with APOE ε3ε3 (n=259)*
Number
Hippocampus Amygdala
Left Right Left Right
APOE ε2+ 52–0.08
(–0.21 to 0.05)
–0.05
(–0.17 to 0.08)
–0.03
(–0.14 to 0.07)
–0.03
(–0.14 to 0.08)
APOE ε4+ 117–0.11
(–0.20 to –0.01)
–0.11
(–0.20 to –0.02)
–0.10
(–0.18 to –0.02)
–0.09
(–0.17 to –0.01)
*Values are differences (95% CI) in volume (ml), adjusted for age, sex and midsagittal area
Subjects with memory performance lower than 1.5 SD below the age- and education- adjust-
ed means had smaller hippocampal (adjusted difference –0.25 ml [95% CI –0.50 to –0.01]) but
not amygdalar volumes (–0.08 ml [95% CI –0.29 to 0.13]). When we excluded these subjects,
we found a similar effect of ε4 on volumes (Table 3).
Table 3. Difference in hippocampal and amygdalar volume according to APOE genotype, in total sample
and in sample after exclusion of subjects with low memory performance
Difference in volume (95% CI)
as compared to subjects with APOE ε3ε3*
Hippocampus Amygdala
TotalExclusion low memory
performance†Total
Exclusion low memory
performance†
Number 428 369 428 369
APOE ε2+–0.13
(–0.37 to 0.12)
–0.20
(–0.45 to 0.05)
–0.06
(–0.27 to 0.14)
–0.13
(–0.35 to 0.08)
APOE ε4+–0.21
(–0.39 to –0.03)
–0.21
(–0.40 to –0.02)
–0.19
(–0.34 to –0.04)
–0.17
(–0.33 to –0.01)
*Values are difference (95% CI) in volume (ml), adjusted for age, sex and midsagittal area.
†Subjects with memory score <1.5 SD below the age and education adjusted means were excluded

Chapter 2.5
62
Discussion
We found that non-demented ε4 carriers had more hippocampal and amygdalar atrophy, but
not more global brain atrophy, than those with the APOE ε3ε3 genotype. Suggestions from
smaller studies in both nondemented (n=54) and demented (n=42) subjects that the ε4 allele
especially affected the right hippocampus and amygdala could not be confirmed.5, 6 Contrary
to expectations, ε2 carriers had more atrophy than those with the ε3ε3 genotype, but the
difference was not statistically significant. Our finding that APOE genotype is not related
to global brain atrophy is in keeping with previous studies in non-demented and demented
elderly.3, 6, 8 However, the rating of global brain atrophy was less sensitive than our volumetric
measurements and subtle differences in global brain atrophy across genotype may have been
missed. We considered that the associations that we found in this non-demented population
may reflect preclinical AD in ε4 carriers. Indeed, the ε4 carriers more often had low memory
performance which was associated with smaller hippocampal volumes. However, excluding
subjects with memory performance lower than 1.5 SD below the age- and education- adjust-
ed means did not change results. Although we cannot exclude the possibility that ε4 carriers
have smaller hippocampi and amygdalae throughout life, our data suggest that measurable
hippocampal and amygdalar atrophy occurs before memory decline can be objectively deter-
mined.
References
1. Hashimoto M, Yasuda M, Tanimukai S, et al. Apolipoprotein E ε4 and the pattern of regional
brain atrophy in Alzheimer’s disease. Neurology 2001; 57:1461-6.
2. Geroldi C, Pihlajamäki M, Laakso MP, et al. APOE-ε4 is associated with less frontal and more
medial temporal lobe atrophy in AD. Neurology 1999; 53:1825-32.
3. Schmidt H, Schmidt R, Fazekas F, et al. Apolipoprotein E ε4 allele in the normal elderly: neu-
ropsychologic and brain MRI correlates. Clin Genet 1996; 50:293-9.
4. Jack CR, Jr., Petersen RC, Xu YC, et al. Hippocampal atrophy and apolipoprotein E genotype are
independently associated with Alzheimer’s disease. Ann Neurol 1998; 43:303-10.
5. Tohgi H, Takahashi S, Kato E, et al. Reduced size of right hippocampus in 39- to 80-year-old
normal subjects carrying the apolipoprotein E ε4 allele. Neurosci Lett 1997; 236:21-4.
6. Lehtovirta M, Laakso MP, Soininen H, et al. Volumes of hippocampus, amygdala and frontal
lobe in Alzheimer patients with different apolipoprotein E genotypes. Neuroscience 1995;
67:65-72.
7. Wahlund LO, Julin P, Lannfelt L, Lindqvist J, Svensson L. Inheritance of the ApoE ε4 allele
increases the rate of brain atrophy in dementia patients. Dement Geriatr Cogn Disord 1999;

Apolipoproteine E genotype and brain atrophy
63
10:262-8.
8. DeCarli C, Reed T, Miller BL, Wolf PA, Swan GE, Carmelli D. Impact of apolipoprotein E ε4 and
vascular disease on brain morphology in men from the NHLBI twin study. Stroke 1999; 30:1548-
53.
9. Breteler MMB. Vascular involvement in cognitive decline and dementia. Epidemiologic evi-
dence from the Rotterdam Study and the Rotterdam Scan Study. Ann N Y Acad Sci 2000;
903:457-65.
10. Slooter AJC, Cruts M, Kalmijn S, et al. Risk estimates of dementia by apolipoprotein E geno-
types from a population-based incidence study: the Rotterdam Study. Arch Neurol 1998; 55:964-
8.


Chapter 3
Endocrine risk factors of brain atrophy on MRI


67
Chapter 3.1
Plasma estrogens, hippocampal atrophy and memory performance
Background: Estrogens may prevent cognitive decline and Alzheimer disease. Animal study
findings have shown beneficial effects of estrogen on the brain, particularly on the hippocam-
pus, a structure related to memory performance and early Alzheimer disease.
Objective: To investigate whether higher levels of endogenous estradiol in older women and
men are associated with larger hippocampal volumes on magnetic resonance imaging and
better memory performance.
Design and Setting: Cross-sectional analysis within the Rotterdam Scan Study, a population-
based study in the Netherlands of elderly subjects who do not have dementia.
Participants: Two hundred ten women and 202 men, aged 60 to 90 years, with plasma levels
of total estradiol and, in part, 162 women and 149 men also with levels of bioavailable and
free estradiol.
Main Outcome Measure: Hippocampal volumes on magnetic resonance imaging and
memory performance (delayed recall).
Results: Women with higher total estradiol levels had smaller hippocampal volumes and
poorer memory performance –0.29 ml (95% confidence interval, –0.57 to –0.00) and –0.4
(95% confidence interval, –1.3 to 0.5) fewer words in delayed recall testing for the highest
tertile compared with the lowest tertile. Similar inverse associations were found among bio-
available and free-estradiol levels, hippocampal volumes, and memory. In men, no association
was observed between estradiol levels and hippocampal volume, but a trend was found for
higher levels of total estradiol to be associated with poorer memory performance.
Conclusion: Our data do not support the hypothesis that higher levels of endogenous es-
tradiol in older women and men are associated with larger hippocampal volumes and better
memory performance.

Chapter 3.1
68
Introduction
After menopause, women have low levels of circulating estrogens. Observational studies
reported a reduced risk of cognitive decline and Alzheimer disease (AD) in postmenopausal
women using estrogen replacement therapy.1, 2 In animals, estrogens protect hippocampal
neurons exposed to amyloid-ß,3 improve synapse formation on dendritic spines in the hip-
pocampus,4 and promote survival of hippocampal neurons, acting in concert with growth
factors.5 Estrogen receptors are located throughout the brain, but especially in the hippocam-
pus.6 Given the beneficial effects of estrogens on the hippocampus in animals, it has been
hypothesized that estrogens may prevent hippocampal atrophy, a key feature of AD.7 The hip-
pocampus plays a pivotal role in memory function and is one of the first regions affected in
AD.8 The aim of this study was to investigate whether higher endogenous levels of estradiol
were associated with larger hippocampal volumes on magnetic resonance imaging (MRI) and
better memory performance. We examined this hypothesis in a population-based study of
older women and men who did not have dementia.
Methods
Rotterdam Scan Study
This study is based on all participants in the Rotterdam Scan Study that originated from the
Rotterdam Study. The Rotterdam Study is a large population-based cohort study in the Ne-
therlands that started in 1990 and investigates the prevalence, incidence, and determinants
of various chronic diseases among elderly participants.9 From 1995 to 1996, we randomly se-
lected 965 living members (aged, 60-90 years) of this cohort in strata of sex and age (5 years)
for participation in the Rotterdam Scan Study.10 After exclusion of individuals who had demen-
tia (n=16),11 or had contraindications to undergo MRI (n=117), 832 persons were eligible for
our study. Among these, 563 participants gave their written informed consent to participate in
the study (response rate, 68%), which included undergoing a MRI brain scan. The study was
approved by the medical ethics committee of Erasmus MC, Rotterdam, the Netherlands.
MRI procedures
All subjects underwent T1-, T2-, and proton-density–weighted images in a 1.5-T magnetic
resonance unit (VISION MR; Siemens, Erlangen, Germany).12 For volumetric measurements
of the hippocampus, a custom-made, inversion recovery—double contrast, 3-dimensional,
half-Fourier acquisition single-shot turbo spin-echo (HASTE) sequence was included (inver-
sion time, 440 milliseconds; repetition time, 2800 milliseconds; 128 contiguous sagittal slices
of 1.2-mm; acquisition matrix, 192×256 pixels; and field of view, 256×256 cm). Two HASTE

Plasma estrogens and hippocampal atrophy
69
modules were sequentially acquired after the inversion pulse (effective echo times of 29 mil-
liseconds and 440 milliseconds). Each HASTE module combined nonselective radiofrequency
excitations to provide a short interecho spacing of 3.9 milliseconds. The fi rst HASTE module
was used for the hippocampal volume measurement.
Hippocampal volumes
We reconstructed a series of coronal brain slices (contiguous 1.5-mm slices) based on the
HASTE sequence, aligned to be perpendicular to the long axis of the hippocampus. All recon-
structed slices were transferred to a workstation (Magic View 1000; Siemens) for volumetric
assessment of the left and right hippocampi (Figure 1).
Figure 1. Coronal slice on which left and right hippocampus (H) are depicted
Referencing to an anatomical atlas,13 we manually traced the boundaries of both hippocampi
on each slice using a mouse-driven pointer. We proceeded from posterior to anterior, starting
on the slice where the crux of the fornices was in full profi le. The alveus could often be used
to delineate the boundary of the hippocampal head from the amygdala. Entering the outlined
surface areas (expressed in millimeters squared), we multiplied the summed surface areas
on each side with slice thickness to yield estimates of the left and right hippocampal volume
(expressed in milliliters). In the current analyses the left and right hippocampal volumes were
summed.
We also reconstructed a midsagittal slice (thickness 3.0 mm). The midsagittal area, which
was used as a proxy for intracranial volume, was measured by tracing the inner table of the
skull. Two raters (T.d.H. and a colleague) who were blinded to any clinical information related
to the participants, assessed the scans. Studies performed on 14 random scans to evaluate
intrarater and interrater correlation showed good overall agreement.

Chapter 3.1
70
Memory performance
All participants underwent neuropsychological testing.12 The Mini-Mental State Examination
was administered to assess global cognitive function.14 Memory function was evaluated by
a 15-word learning test based on the Rey Auditory Verbal Learning Test.15 This test consists
of 3 learning trials in which 15 words have to be remembered. After 15 minutes, the subject
is asked to recall as many words as possible (delayed recall). In the present study we used
the delayed recall score because this score is most strongly associated with hippocampal
volumes16 and with early AD.17
Blood measurements
Venapuncture was done in nonfasting subjects between 8:30 AM and 4 PM at baseline exam-
ination of the Rotterdam Scan Study (1990-1993). Blood samples were collected in 5-ml tubes
containing a 0.5-ml sodium citrate solution. All tubes were stored on ice before and after
blood sampling. Platelet-free plasma was obtained by 2-stage centrifugation (10 minutes at
1600g at 4ºC and 30 minutes at 7000g at 4ºC). Platelet-free samples were immediately frozen
in liquid nitrogen and stored at –80ºC. Assays were performed blinded to information on the
subject. Plasma levels of estradiol and sex hormone–binding globulin were estimated with
double antibody radioimmunoassays (ultrasensitive method for estradiol; Diagnostic Systems
Laboratories, Webster, Tex). Because of the small volumes of plasma available, all estradiol
levels are single sample estimations. Intra-assay coefficients of variation, determined on the
basis of duplicate results of internal quality control pools with 3 different levels of each ana-
lyte, were below 4% for sex hormone–binding globulin and 18% for estradiol. Because inter-
assay variations were 14% (sex hormone–binding globulin) and 21% (estradiol), results of all
batches were normalized by multiplying all concentrations within a batch with a factor, which
equalized results for the internal quality control pools. As measures of the levels of bioavail-
able and free estradiol, nonsex hormone–binding globulin-bound estradiol, and nonprotein-
bound estradiol, respectively, were calculated on the basis of hormone and binding protein
levels.18, 19 The median interval from blood sampling (1990-1993) to hippocampal volumes and
memory testing (1995-1996) was 2.9 years (range, 1.6-6.6 years).
Covariates
Several variables may confound an association between estradiol levels and hippocampal
volume or memory performance, such as age at the time of venapuncture, educational level,
smoking habits, alcohol intake, body mass index (BMI) (calculated as weight in kilograms
divided by the height in meters squared), depressive symptoms, apolipoprotein E (APOE)
genotype, and for women, the variables included type of menopause, age at menopause, and
use of hormone replacement therapy (HRT) (ie, those who ever used HRT or those who never

Plasma estrogens and hippocampal atrophy
71
used HRT) for menopausal reports (Anatomical Therapeutical Chemical code g03). The level
of education was dichotomized into primary education and lower vocational training and uni-
versity education. We categorized smoking status into current, former, and never and made
dummy variables for the analyses. Alcohol intake was recorded in grams per day.20 Depres-
sive symptoms were assessed using the Center for Epidemiologic Studies Depression Scale
(CES-D)21 at time of assessment of memory performance. Apolipoprotein E genotyping was
done according to standard methods22 and was coded into non-APOE ε4 carrier and APOE
ε4 carrier. Type of menopause was classified into natural or artificial (surgically or chemically
induced). Age at natural menopause was defined as the age at which menses had not oc-
curred for at least 1 year. Type and age of menopause were combined in 1 categorical variable
with 4 groups: (1) artificial menopause, (2) natural menopause before the age of 48 years, (3)
natural menopause between ages 48 and 52 years, or (4) natural menopause after the age of
52 years.
Study sample
To obtain the study samples for the analyses, we excluded 4 women who used HRT at the
time of blood drawing, leaving 559 subjects (Figure 2). Because estradiol levels were meas-
ured as part of several blood measurements and small amounts of plasma were available, we
randomly missed total estradiol levels for 147 subjects. Thus, 412 subjects for the analyses
on total estradiol levels were included. Because of missing data on binding protein levels
(n=101), we had bioavailable and free-estradiol levels in 311 subjects. These 311 subjects with
bioavailable and free-estradiol levels were similar to the 248 subjects who were dropped from
these analyses for age, hippocampal volume, and delayed recall score.
Data analysis
All analyses were performed in women and men separately. We first investigated whether
there was a threshold in the relation between estradiol level and outcome by analysis of
covariance (ANCOVA). Tertiles of total, bioavailable, and free estradiol were the group vari-
able and we calculated adjusted mean hippocampal volumes and delayed recall scores in
each tertile. Three consecutive models were used. The first adjusted for age and —in the
hippocampal analyses— midsagittal area to account for intracranial volume.23 After separately
investigating several covariates, it appeared as if the BMI was the strongest confounder in the
associations so the second model was adjusted, in addition to age and midsagittal area, for
BMI. In the third model we additionally entered educational level, smoking, alcohol use, CES-
D score, APOE genotype, and, for women, age at menopause, type of menopause, and use
of ever taking HRT. Because the ANCOVA did not suggest a specific threshold in the relation
between estradiol levels and outcome, we performed a multivariate linear regression analysis
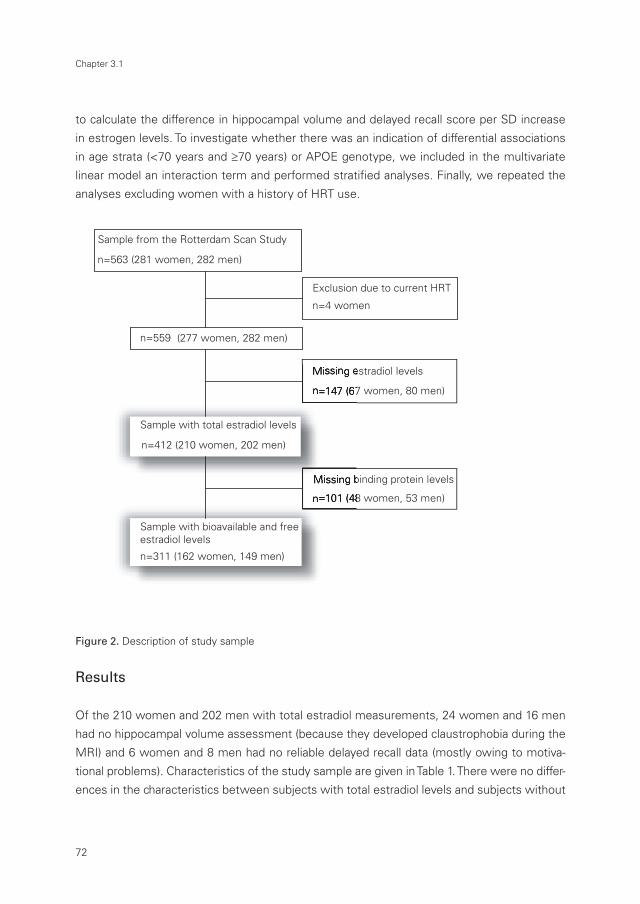
Chapter 3.1
72
to calculate the difference in hippocampal volume and delayed recall score per SD increase
in estrogen levels. To investigate whether there was an indication of differential associations
in age strata (<70 years and ≥70 years) or APOE genotype, we included in the multivariate
linear model an interaction term and performed stratifi ed analyses. Finally, we repeated the
analyses excluding women with a history of HRT use.
Figure 2. Description of study sample
Results
Of the 210 women and 202 men with total estradiol measurements, 24 women and 16 men
had no hippocampal volume assessment (because they developed claustrophobia during the
MRI) and 6 women and 8 men had no reliable delayed recall data (mostly owing to motiva-
tional problems). Characteristics of the study sample are given in Table 1. There were no differ-
ences in the characteristics between subjects with total estradiol levels and subjects without
�
������������������������������������ �
�������������������������� �
����������������������������
����������
������
�
��������������������
�
������������������������
�
������������������������
�
������� �
����� ���
����������������������������������
�
��������������������������
�
������������������������������
�
������������������������
�
�������� �
����� ���
�������������������������������������������������
�
��������������������������
�
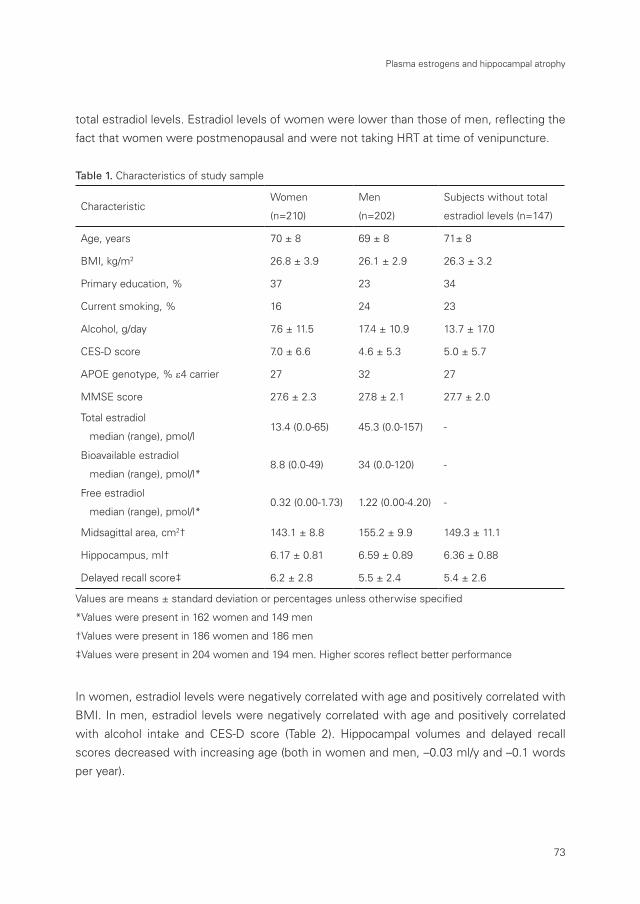
Plasma estrogens and hippocampal atrophy
73
total estradiol levels. Estradiol levels of women were lower than those of men, reflecting the
fact that women were postmenopausal and were not taking HRT at time of venipuncture.
Table 1. Characteristics of study sample
CharacteristicWomen
(n=210)
Men
(n=202)
Subjects without total
estradiol levels (n=147)
Age, years 70 ± 8 69 ± 8 71± 8
BMI, kg/m2 26.8 ± 3.9 26.1 ± 2.9 26.3 ± 3.2
Primary education, % 37 23 34
Current smoking, % 16 24 23
Alcohol, g/day 7.6 ± 11.5 17.4 ± 10.9 13.7 ± 17.0
CES-D score 7.0 ± 6.6 4.6 ± 5.3 5.0 ± 5.7
APOE genotype, % ε4 carrier 27 32 27
MMSE score 27.6 ± 2.3 27.8 ± 2.1 27.7 ± 2.0
Total estradiol
median (range), pmol/l13.4 (0.0-65) 45.3 (0.0-157) -
Bioavailable estradiol
median (range), pmol/l*8.8 (0.0-49) 34 (0.0-120) -
Free estradiol
median (range), pmol/l*0.32 (0.00-1.73) 1.22 (0.00-4.20) -
Midsagittal area, cm2† 143.1 ± 8.8 155.2 ± 9.9 149.3 ± 11.1
Hippocampus, ml† 6.17 ± 0.81 6.59 ± 0.89 6.36 ± 0.88
Delayed recall score‡ 6.2 ± 2.8 5.5 ± 2.4 5.4 ± 2.6
Values are means ± standard deviation or percentages unless otherwise specified
*Values were present in 162 women and 149 men
†Values were present in 186 women and 186 men
‡Values were present in 204 women and 194 men. Higher scores reflect better performance
In women, estradiol levels were negatively correlated with age and positively correlated with
BMI. In men, estradiol levels were negatively correlated with age and positively correlated
with alcohol intake and CES-D score (Table 2). Hippocampal volumes and delayed recall
scores decreased with increasing age (both in women and men, –0.03 ml/y and –0.1 words
per year).

Chapter 3.1
74
Figure 3. Adjusted hippocampal volumes (SE) (A and C) and delayed recall (SE) (B and D) across tertiles of
total, bioavailable, and free-estradiol levels in women and men, respectively. A and B, Means are adjusted
for age, educational level, BMI, alcohol, smoking, CES-D, type of menopause, age at menopause, ever
use of HRT, APOE genotype, and the hippocampal volumes–midsagittal area. Tertile ranges (in picomoles
per liter) were for total estradiol levels 0.0-7.3, 7.3-19, and 20-65; for bioavailable estradiol levels 0.0-5.2,
5.2-14, and 14-49; and for free-estradiol levels 0.00-0.19, 0.19-0.50, and 0.50-1.73. Asterisks indicate
statistically significantly (P<0.05) smaller than lowest tertile. C and D, Means are adjusted for age, edu-
cational level, BMI, alcohol, smoking, CES-D, APOE genotype, and the hippocampal volumes–midsagittal
area. Tertile ranges (in picomoles per liter) were for total estradiol level 0.0-36, 36-52, and 52-157; for
bioavailable estradiol level 0.0-27, 27-40, and 40-120; and for free-estradiol level 0.00-0.97, 0.97-1.49, and
1.49-4.20
�
���
���
���
���
���
���
� � ��������
���
��
���
���
���
���
����
�����������������������������������������������������������������������������������������
���
���
���
���
���
���
���
���
� � ��������
���
����
����
�����
���
�
� �
� �
���
��
���
���
���
���
����
��
���
���
���
���
���
���
� � ��������
���������������������������������������������������������������������������������������
���
���
���
���
���
���
���
���
���
����
����
�����
���
�
� � ��������
�
�
�
�

Plasma estrogens and hippocampal atrophy
75
Table 2. Correlations between several continuous variables in women (n=210) and in men (n=202)
Total estradiol Age Education BMIAlcohol
intakeCES-D
Age
(per year)
-0.49*
-0.62*
Education
(per grade)
-0.08 -1.02*
-0.87 -0.22
BMI
(per kg/m2)
0.97* 0.24 -0.05*
1.04 0.04 -0.06
Alcohol intake
(per grams/day)
0.01 -0.13* 0.01 -0.03
0.33* -0.04 -0.00 0.02
CES-D
(per point)
-0.27 0.20* -0.02 -0.04 0.02
0.77* -0.05 0.02 0.03 0.20
Midsagittal area
(per cm2)
0.23 -0.22* 0.02* 0.01 -0.05 -0.10*
0.14 -0.07 0.02 -0.01 -0.11 0.05
Values are unadjusted regression coefficients in women and in men (italic numbers). The variables in the
left column are the independent variables and the variables in the upper row the dependent variables.
*P<0.05
Women
Estradiol level and hippocampal volume
In women, the age- and midsagittal-adjusted mean hippocampal volumes decreased across
higher tertiles of total (SE) estradiol levels from 6.24 (0.10) ml to 6.22 (0.10) ml to 6.07 (0.10)
ml, but there were no significant differences between tertiles. When the BMI was included as
a covariate, the mean (SE) hippocampal volumes were 6.28 (0.10) ml; 6.21 (0.10) ml, and 6.04
(0.10) ml, respectively, but differences were again not statistically significant. Figure 3A shows
that after additional adjustments for all other covariates the negative association between
the total estradiol level and hippocampal volume became statistically significant (difference
between the highest and lowest tertile of total estradiol –0.29 ml [95% confidence interval
(CI), –0.57 to –0.00]). When we analyzed the total estradiol level as a continuous measure, we
found a nonsignificant decrease in hippocampal volume per SD increase in total estradiol level
(Table 3). There was a nonsignificant inverse relation between the bioavailable estradiol level
and hippocampal volumes (the age- and midsagittal-adjusted means of hippocampal volume
across higher bioavailable estradiol tertiles was 6.22 (0.12) ml, 6.17 (0.11) ml, and 6.00 (0.11)

Chapter 3.1
76
ml. When the BMI was included in the model, a significant smaller hippocampal volume was
found in women with bioavailable estradiol levels in the highest tertile of bioavailable estradiol
compared with the lowest tertile (difference, –0.37 ml [95% CI, –0.71 to –0.03]). Additional
adjustments did not change this inverse relation (Figure 3A). When we analyzed bioavailable
estradiol levels as a continuous measure, we found a nonsignificant decrease of hippocampal
volume of –0.09 ml (95% CI, –0.25 to 0.06) per SD (10-pmol/L) increase.
Table 3. Associations between total estradiol levels, hippocampal volumes and memory performance
Women Per increase of 1 SD (14 pmol/l) in total estradiol level
Adjusted for Hippocampal volume (ml) Delayed recall
Age, midsagittal area* -0.01 (-0.12 to 0.10) -0.1 (-0.4 to 0.3)
Age, midsagittal area*, BMI -0.04 (-0.16 to 0.08) -0.1 (-0.5 to 0.3)
Age, midsagittal area*, BMI,
education, alcohol intake,
smoking, CES-D, APOE
genotype, age and type of
menopause, ever use of HRT
-0.06 (-0.18 to 0.06) -0.1 (-0.5 to 0.3)
Men Per increase of 1 SD (23 pmol/l) in total estradiol level
Adjusted for Hippocampal volume (ml) Delayed recall
Age, midsagittal area* 0.02 (-0.10 to 0.15) -0.4 (-0.7 to –0.0)
Age, midsagittal area*, BMI -0.01 (-0.05 to 0.03) -0.4 (-0.7 to 0.0)
Age, midsagittal area*, BMI,
education, alcohol intake,
smoking, CES-D, APOE
genotype
0.04 (-0.09 to 0.18) -0.3 (-0.7 to 0.1)
Values are adjusted regression coefficients (95% CI) of the relation between total estradiol level and hip-
pocampal volume/delayed recall.
*Adjusted for only in the hippocampal analyses
The relation between free estradiol levels and hippocampal volumes was similar to that of
bioavailable estradiol levels (Figure 3A). The inverse associations between estradiol levels and
hippocampal volumes were primarily seen in the oldest age group (in age<70 years: per SD

Plasma estrogens and hippocampal atrophy
77
increase in total estradiol level the fully adjusted difference in hippocampal volumes was 0.07
ml [95% CI, –0.09 to 0.23]; in age ≥70 years: –0.24 ml [95% CI, –0.44 to –0.04]; P of interac-
tion term 0.04). The negative associations between estradiol level and hippocampal volumes
were more pronounced in APOE ε4 carriers than in non-APOE ε4 carriers, although the inter-
action term was not statistically significant (Table 4).
Table 4. Associations between total estradiol levels and hippocampal volumes and memory performance
in women according to APOE ε4 strata
Hippocampal volumes
Adjusted for Non-APOE ε4 carrier APOE ε4 carrier P interaction term*
Age, midsagittal area, BMI,
education, alcohol intake,
smoking, CES-D, age and type
of menopause, ever use of
HRT
0.01 (–0.16 to 0.17) –0.25 (–0.46 to –0.03) 0.07
Delayed recall
Adjusted for Non-APOE ε4 carrier APOE ε4 carrier P interaction term*
Age, BMI, education, alcohol
intake, smoking, CES-D, age
and type of menopause, ever
use of HRT
–0.10 (–0.61 to 0.41) 0.44 (–0.21 to 1.09) 0.29
Values are adjusted regression coefficients (95% CI) of the relation between total estradiol level (per 1
SD increase) and hippocampal volume/delayed recall
* P-value of interaction term (APOE strata x total estradiol level) in the multivariate linear regression
analysis
Estradiol level and memory
The age-adjusted delayed recall score decreased nonsignificantly across total estradiol tertiles
from 6.5 (0.3) to 6.1 (0.3) to 6.1 (0.3) words. Figure 3B shows that additional adjustments for
other covariates did not substantially change these results. The fully adjusted difference in
delayed recall words between the highest and lowest tertile of total estradiol levels was –0.4
(95% CI, –1.3 to 0.5). When we analyzed the total estradiol level as a continuous measure,

Chapter 3.1
78
we found a nonsignificant decrease in delayed recall words (Table 3). There was a significant
inverse relation between bioavailable estradiol tertiles and delayed recall (Figure 3B), although
when we analyzed bioavailable estradiol levels continuously, we found a nonsignificant de-
crease in delayed recall words of –0.2 (95% CI, –0.7 to 0.2) per SD increase. The results were
similar for the relation between the free estradiol level and delayed recall score (Figure 3B).
Again, the inverse associations between the estradiol level and memory were stronger in the
oldest age groups (data not shown). The associations were not different in APOE ε4 strata
(Table 4). Exclusion of women who had used HRT in the past (n=17) did not change any of
the above results.
Men
Estradiol level and hippocampal volume
In men, there was no association between estradiol levels and hippocampal volumes (age and
midsagittal-adjusted hippocampal volumes in total estradiol tertiles: 6.55 [0.11] ml, 6.68 [0.11]
ml, and 6.52 [0.11]) ml). Additional adjustments for the other covariates did not change these
estimates (Figure 3C and Table 3). There was also no association between bioavailable or free-
estradiol levels and hippocampal volume (Figure 3C). There were no differential associations
in age strata or in APOE ε4 strata (data not shown).
Estradiol level and memory
When we investigated the relation between estradiol levels and memory performance in
men, a similar pattern as in women emerged. The age-adjusted delayed recall scores de-
creased across increasing total estradiol tertiles from 6.1 (0.3) to 5.4 (0.3) to 5.1 (0.3) words.
When we analyzed the total estradiol level as continuous measure, we found a decrease in
delayed recall with increasing levels (Table 3). Additional adjustments for covariates did not
change this association (Figure 3D and Table 3). The association of delayed recall score with
bioavailable and free estradiol levels showed a similar pattern as with the total estradiol level
(Figure 3D). There were no differences in the associations in age strata or in APOE ε4 strata
(data not shown).
Discussion
In this population-based study in elderly subjects with no dementia, we could not support the
hypothesis that higher endogenous levels of estradiol are associated with larger hippocampal
volumes on MRI and better memory performance. Women with higher estradiol levels had
smaller hippocampal volumes and poorer memory performance than women with lower lev-
els. In men, there was no relation between estradiol level and hippocampal volumes, but

Plasma estrogens and hippocampal atrophy
79
memory performance was worse in those with higher levels of total estradiol compared with
those with lower levels.
The strengths of this study are that it is population based and involves a large number of
volumetric hippocampal assessments. Our study has several methodological limitations that
need to be discussed. First, owing to the small amounts of plasma available, we had a large
number of missing data on bioavailable and free-estradiol levels. Although these missing data
were random, the smaller sample size will have resulted in less precise estimates of the as-
sociations. Second, blood was drawn several years before MRI and memory performance. It
is difficult to determine if this influenced our results. It may have led to biased associations if
subjects with estradiol levels on one side of the distribution selectively died between blood
drawing and MRI measurement. This does not seem likely, however, because the interval be-
tween blood drawing and MRI was not long, and the relation between endogenous estradiol
levels and mortality is not strong.24 Third, HRT use in the Netherlands is infrequent compared
with, for example, the United States. Our results were based on observations in non-HRT
users and they may not be generalizable to HRT users.
The most consistent support for the hypothesis that estrogens prevent dementia comes
from animal studies that showed that estrogens protect against cell loss in the hippocam-
pus, increase neurite outgrowth, and have antioxidative properties.3, 25 In humans, observa-
tional studies on endogenous levels of estrogen in relation to cognitive function have been
inconclusive. Some reported negative effects of higher endogenous estrogen levels on de-
layed visual reproduction26 and attention tasks27 in women and on the results of the MMSE,
memory tasks,28 and spatial performance29 in men, while others showed in women posi-
tive effects of higher endogenous estrogen levels on verbal memory30 or cognitive decline.31
Population-based studies on exogenous estrogens showed that women who used HRT had a
reduced risk of AD1, 2, 32 but these studies may have been confounded by healthy-user effect.
Also, other studies did not confirm this observation.33-35 Recent randomized trials with HRT
in patients with AD showed no36-38 or a beneficial effect of exogenous estrogen on cognitive
decline.39 Together, the biological plausibility of the estrogen hypothesis in dementia is its
strongest plea, whereas studies in humans are far from conclusive. Our results are contrary
to what we expected in that we observed a small negative effect of higher estradiol levels on
both hippocampal volumes in women and memory performance in women and men. As yet,
we do not have a biological plausible explanation for these results. When interpreting these
data, one has to keep in mind that the endogenous levels in our study sample of postmeno-
pausal women are much lower than the levels obtained after supplemental use of exogenous
estrogens. Therefore, our data do not reject the possibility that exogenous estrogens are
related to larger hippocampal volumes and better memory performance.

Chapter 3.1
80
Conclusion
This study does not support the hypothesis that higher endogenous estrogen levels in older
women and men without dementia are associated with larger hippocampal volumes and
better memory performance.
References
1. Kawas C, Resnick S, Morrison A, et al. A prospective study of estrogen replacement therapy
and the risk of developing Alzheimer’s disease: the Baltimore Longitudinal Study of Aging. Neu-
rology 1997; 48:1517-21.
2. Tang MX, Jacobs D, Stern Y, et al. Effect of oestrogen during menopause on risk and age at
onset of Alzheimer’s disease. Lancet 1996; 348:429-32.
3. Behl C, Skutella T, Lezoualc’h F, et al. Neuroprotection against oxidative stress by estrogens:
structure- activity relationship. Mol Pharmacol 1997; 51:535-41.
4. Murphy DD, Cole NB, Greenberger V, Segal M. Estradiol increases dendritic spine density by
reducing GABA neurotransmission in hippocampal neurons. J Neurosci 1998; 18:2550-9.
5. Singh M, Meyer EM, Simpkins JW. The effect of ovariectomy and estradiol replacement on
brain-derived neurotrophic factor messenger ribonucleic acid expression in cortical and hippo-
campal brain regions of female Sprague-Dawley rats. Endocrinology 1995; 136:2320-4.
6. Österlund MK, Keller E, Hurd YL. The human forebrain has discrete estrogen receptor α mes-
senger RNA expression: high levels in the amygdaloid complex. Neuroscience 2000; 95:333-
42.
7. Convit A, De Leon MJ, Tarshish C, et al. Specific hippocampal volume reductions in individuals
at risk for Alzheimer’s disease. Neurobiol Aging 1997; 18:131-8.
8. Braak H, Braak E. Neuropathological stageing of Alzheimer-related changes. Acta Neuropathol
1991; 82:239-59.
9. Hofman A, Grobbee DE, de Jong PTVM, van den Ouweland FA. Determinants of disease and
disability in the elderly: the Rotterdam Elderly Study. Eur J Epidemiol 1991; 7:403-22.
10. Breteler MMB. Vascular involvement in cognitive decline and dementia. Epidemiologic evi-
dence from the Rotterdam Study and the Rotterdam Scan Study. Ann N Y Acad Sci 2000;
903:457-65.
11. Ott A, Breteler MMB, van Harskamp F, Stijnen T, Hofman A. Incidence and risk of dementia. The
Rotterdam Study. Am J Epidemiol 1998; 147:574-80.
12. de Groot JC, de Leeuw FE, Oudkerk M, et al. Cerebral white matter lesions and cognitive func-
tion: the Rotterdam Scan Study. Ann Neurol 2000; 47:145-51.

Plasma estrogens and hippocampal atrophy
81
13. Duvernoy HM. The human hippocampus: functional anatomy, vascularization and serial sec-
tions with MRI. Berlin: Springer-Verlag, 1998.
14. Folstein MF, Folstein SE, McHugh PR. “Mini-mental state”. A practical method for grading the
cognitive state of patients for the clinician. J Psychiatr Res 1975; 12:189-98.
15. Brand N, Jolles J. Learning and retrieval rate of words presented auditorily and visually. J Gen
Psychol 1985; 112:201-210.
16. Petersen RC, Jack CR, Jr., Xu YC, et al. Memory and MRI-based hippocampal volumes in aging
and AD. Neurology 2000; 54:581-7.
17. Petersen RC, Smith GE, Ivnik RJ, Kokmen E, Tangalos EG. Memory function in very early Alzhei-
mer’s disease. Neurology 1994; 44:867-72.
18. Södergård R, Backstrom T, Shanbhag V, Carstensen H. Calculation of free and bound fractions
of testosterone and estradiol- 17 beta to human plasma proteins at body temperature. J Steroid
Biochem 1982; 16:801-10.
19. van den Beld AW, de Jong FH, Grobbee DE, Pols HAP, Lamberts SW. Measures of bioavailable
serum testosterone and estradiol and their relationships with muscle strength, bone density,
and body composition in elderly men. J Clin Endocrinol Metab 2000; 85:3276-82.
20. Ruitenberg A, van Swieten JC, Witteman JCM, et al. Alcohol consumption and risk of demen-
tia: the Rotterdam Study. Lancet 2002; 359:281-6.
21. Radloff LS. The CES-D scale: a self-report depression scale for research in the general popula-
tion. Applied Psychological Measurement 1977; 1:385-401.
22. Slooter AJC, Cruts M, Kalmijn S, et al. Risk estimates of dementia by apolipoprotein E geno-
types from a population-based incidence study: the Rotterdam Study. Arch Neurol 1998; 55:964-
8 .
23. Cuenod CA, Denys A, Michot JL, et al. Amygdala atrophy in Alzheimer’s disease. An in vivo
magnetic resonance imaging study. Arch Neurol 1993; 50:941-5.
24. Barrett-Connor E, Goodman-Gruen D. Prospective study of endogenous sex hormones and
fatal cardiovascular disease in postmenopausal women. BMJ 1995; 311:1193-6.
25. Behl C, Manthey D. Neuroprotective activities of estrogen: an update. J Neurocytol 2000;
29:351-8.
26. Barrett-Connor E, Goodman-Gruen D. Cognitive function and endogenous sex hormones in
older women. J Am Geriatr Soc 1999; 47:1289-93.
27. Yaffe K, Grady D, Pressman A, Cummings S. Serum estrogen levels, cognitive performance,
and risk of cognitive decline in older community women. J Am Geriatr Soc 1998; 46:816-21.
28. Barrett-Connor E, Goodman-Gruen D, Patay B. Endogenous sex hormones and cognitive func-
tion in older men. J Clin Endocrinol Metab 1999; 84:3681-5.
29. Durante R, Lachman M, Mohr B, Longcope C, McKinlay JB. Is there a relation between hor-
mones and cognition in older men? Am J Epidemiol. 1997; 145 (Suppl):S2.

Chapter 3.1
82
30. Drake EB, Henderson VW, Stanczyk FZ, et al. Associations between circulating sex steroid
hormones and cognition in normal elderly women. Neurology 2000; 54:599-603.
31. Yaffe K, Lui LY, Grady D, Cauley J, Kramer J, Cummings SR. Cognitive decline in women in rela-
tion to non-protein-bound oestradiol concentrations. Lancet 2000; 356:708-12.
32. Henderson VW, Paganini-Hill A, Emanuel CK, Dunn ME, Buckwalter JG. Estrogen replacement
therapy in older women. Comparisons between Alzheimer’s disease cases and nondemented
control subjects. Arch Neurol 1994; 51:896-900.
33. Yaffe K, Sawaya G, Lieberburg I, Grady D. Estrogen therapy in postmenopausal women: effects
on cognitive function and dementia. JAMA 1998; 279:688-95.
34. LeBlanc ES, Janowsky J, Chan BKS, Nelson HD. Hormone replacement therapy and cognition:
systematic review and meta- analysis. JAMA 2001; 285:1489-99.
35. Seshadri S, Zornberg GL, Derby LE, Myers MW, Jick H, Drachman DA. Postmenopausal estro-
gen replacement therapy and the risk of Alzheimer disease. Arch Neurol 2001; 58:435-40.
36. Mulnard RA, Cotman CW, Kawas C, et al. Estrogen replacement therapy for treatment of mild
to moderate Alzheimer disease: a randomized controlled trial. JAMA 2000; 283:1007-15.
37. Henderson VW, Paganini-Hill A, Miller BL, et al. Estrogen for Alzheimer’s disease in women:
randomized, double-blind, placebo-controlled trial. Neurology 2000; 54:295-301.
38. Wang PN, Liao SQ, Liu RS, et al. Effects of estrogen on cognition, mood, and cerebral blood
flow in AD: a controlled study. Neurology 2000; 54:2061-6.
39. Asthana S, Baker LD, Craft S, et al. High-dose estradiol improves cognition for women with AD:
Results of a randomized study. Neurology 2001; 57:605-12.

83
Chapter 3.2
Estrogen receptor α polymorphisms, dementia and atrophy of the medial temporal lobe
The role of estrogens in Alzheimer’s disease is controversial. We investigated the association
between well-recognized, and potentially functional, polymorphisms in the estrogen recep-
tor (ER) α gene and risk of Alzheimer’s disease in a large prospective study of 6056 Cauca-
sian elderly aged 55 years and over. Furthermore, we performed a meta-analysis based on
published results of 5 other studies. In a subset of 468 non-demented elderly we assessed
volumes of the hippocampus and amygdala, which have a high density of ERα, by means of
brain magnetic resonance imaging (MRI). During a total of 35405 person-years of follow-up
(mean per persons 5.8 years), 312 new cases of dementia were detected of whom 230 were
diagnosed with Alzheimer’s disease. Neither the PvuII nor the XbaI polymorphism or haplo-
types thereof were associated with the risk of all-cause dementia or Alzheimer’s disease,
which was confirmed by the meta-analysis. In contrast, we found that non-demented women
who carried the PvuII p allele or haplotype ‘px’ had smaller amygdalar volumes on MRI in
an allele-dose dependent fashion. Further studies are required to investigate whether this
smaller amygdalar volume has functional significance.
Chapter 3.2
84
Introduction
In the last decade of the 20th century numerous cellular, molecular and epidemiological studies
suggested a protective effect of estrogen on Alzheimer’s disease. Estrogen protects against
neuronal death,1 improves survival of hippocampal neurones,2 acts as an antioxidant,3 and
stimulates cerebral blood flow.4 Observational studies reported that postmenopausal women
who used estrogen replacement therapy have a lower risk of dementia.5, 6 Conversely, a large
randomised trial on estrogen replacement therapy for preventing Alzheimer’s disease was
negative.7 This, in turn, is in line with findings from our group that higher endogenous estradiol
levels, if anything, are associated with a higher risk of dementia.8
Estrogens exert most of their effects through intracellular activation of estrogen receptors.
There are two known forms of estrogen receptors: the estrogen receptor α (ERα) and the
estrogen receptor ß, both expressed in the brain.3, 9 Several studies examined the PvuII and
XbaI polymorphisms in the gene for ERα in association to Alzheimer’s disease with different
results.10-16 Except for one prospective study,10 most reports were based on case-control se-
ries with inherent limitations of selection.11-16 The aim of the current study was to investigate
polymorphisms in the ERα gene and risk of dementia in a large prospective population-based
cohort study in the Netherlands. We included a meta-analysis of all published data. In a sub-
set of the cohort, MRI of the brain was made to assess volumes of the hippocampus and
amygdala. The hippocampus and amygdala are structures in the medial temporal lobe that
express ERα at relatively high levels.9 If ERα polymorphisms are associated with macroscopic
changes in brain volume, we would expect to find it for these two structures. An additional
rationale for studying these structures is that hippocampal and amygdalar atrophy on MRI are
seen early in Alzheimer’s disease.17, 18 The putative risk on Alzheimer’s disease associated with
ERα polymorphisms could be mediated through effects on the hippocampus and amygdala.
The ε4 allele of the apolipoprotein E (APOE) is a well-known genetic risk factor for Alzheimer’s
disease,19 and estrogens influence regulation of APOE synthesis.20 Previous reports suggest-
ed differential effects of the ERα genotype on risk of Alzheimer’s disease within APOE ε4 or
non-ε4 carriers,12, 14 therefore we performed stratified analyses according to APOE genotype.
Methods
Study population
This study is based on the Rotterdam Study, a large prospective population-based study in
7983 elderly aged 55 years or older that aims to assess determinants of diseases in later life.21
The Medical Ethics Committee of Erasmus Medical Center approved the study protocol and
participants gave written informed consent. Baseline examinations took place from 1990 to

Estrogen receptor α polymorphisms, dementia and atrophy
85
1993. A trained research assistant visited participants at home and obtained information on
medication use, medical history and determinants of diseases. Participants were invited to
visit the research center for clinical examinations by the research physicians. Re-examinations
were performed in 1993 to 1994 and 1997 to 1999. Of the 7983 participants at baseline, 7528
(94.3%) were screened and examined for prevalent dementia. There were 482 participants
diagnosed with prevalent dementia.22 Thus, 7046 participants comprised the cohort at risk for
dementia of whom 6934 were of Caucasian origin.
Dementia diagnosis
Participants were examined for presence of dementia at the research center at follow-up
visits. A three-step protocol was used as described in detail elsewhere.23 Briefly, all partici-
pants were screened with the Mini-Mental State Examination (MMSE) and the Geriatric Men-
tal State schedule (GMS), organic level. Screen positives (persons scoring below 26 on the
MMSE or more than 0 on the GMS) underwent cognitive testing with the Cambridge ex-
amination for mental disorders in the elderly, which included an informant interview. Persons
suspected of dementia were examined by a neurologist and underwent extensive neuropsy-
chological testing. In addition to this in-person screening,24 all participants were continuously
monitored for development of dementia through linkage of the general practitioners’ medical
record system to the database of the Rotterdam Study. We also consulted the Regional In-
stitute for Outpatient Mental Health Care (RIAGG) at a regular basis and checked all relevant
reports. Surveillance of the population through the general practitioner and RIAGG reports
continued up to December 31, 1999. A diagnosis of dementia and its subtypes were made
according to international standard criteria by a panel consisting of a neurologist, neuropsy-
chologist and study physician.25, 26
Subset with MRI examinations
In 1995 to 1996, we made a random selection of 965 living members of the cohort in strata
of age (5-years strata from 60 to 90) and sex for participation in the Rotterdam Scan Study,
designed to study age-related brain changes on MRI.27 As part of the eligibility criteria, we ex-
cluded persons who had developed dementia between baseline and time of selection (n=17)
and persons who had contraindications to undergo MRI (n=116). This left 832 participants
eligible. Complete MRI data, including a three-dimensional (3D) volumetric MRI sequence
covering the whole brain, was obtained in 511 persons.
MRI procedures
We reformatted coronal brain slices (contiguous 1.5-mm slices) and a middle sagittal slice
from the 3D MRI sequence. The coronal slices were orientated perpendicular to the long

Chapter 3.2
86
axis of the hippocampus. The procedure of segmenting the hippocampus and amygdala on
coronal slices has been described.28 The left and the right hippocampus and amygdala were
manually outlined on each slice with a mouse-driven cursor.29 Absolute volumes (ml) were
calculated by multiplying the areas on each slice by the slice thickness and left and right side
were summed. As a proxy for head size, we measured on a reformatted middle sagittal MRI
slice the intracranial cross-sectional area.29 We corrected for head size differences across
individuals by dividing the uncorrected volumes by the subject’s calculated head size area
and subsequently multiplying this ratio by the average head size area (men and women sepa-
rately).18, 30
ERα polymorphisms
Genomic DNA was isolated from peripheral leucocytes by standard procedures. Genotypes
were determined using the Taqman allelic discrimination assay. Primer and probe sequences
were optimized using the single nucleotide polymorphism assay-by-design service of Applied
Biosystems. For details see http://store.appliedbiosystems.com. Reactions were performed
on the Taqman Prism 7900HT 384 wells format. The coding for the ERα polymorphisms PvuII
and XbaI follows that of previous studies on the ERα polymorphisms. Capital “P” and “X”
stands for absence of a restriction site (indicating respectively nucleotide C and nucleotide
G) and lower case letter “p” and “x” stands for presence of restriction site (nucleotide T and
nucleotide A). Persons were classified as either non-carrier, heterozygous or homozygous for
the allele. To increase genetic resolution we created also PvuII-XbaI haplotypes as reported
previously.31 Haplotype alleles were coded as haplotype numbers 1 through 4 in order of de-
creasing frequency in the population (1=px, 2=PX, 3=Px, and 4=pX). We examined the poly-
morphisms PvuII and XbaI separately in relation to outcome to make our results comparable
with earlier studies on dementia and examined haplotype 1 based on previous work from our
group showing this to be the risk allele of osteoporosis.31
Analytical study samples
We missed genotyping of the ERα polymorphism in some persons because no blood was
drawn or there were problems in the technical processing of the blood samples. Of the 6934
members of the cohort at risk for dementia, we determined the PvuII and XbaI genotype in
6056. The 878 persons without genotype were on average 4.8 years older (P<0.001); and
more frequently women (67% versus 59%; P<0.001) compared to the 6056 participants with
genotype. Of the 511 participants in the subset with MRI examinations, we determined the
ERα genotype in 468 participants. The remaining 43 participants were similar in mean age
(P=0.31) but more frequently women (63% versus 48%, P=0.06) compared to the 468 par-
ticipants with genotype.
Estrogen receptor α polymorphisms, dementia and atrophy
87
Other measurements
At baseline examinations, we ascertained by interview or physical examination level of educa-
tion (primary versus lower vocational to university education), smoking status (current, former
or never), body mass index (weight divided by the square of the height), age at menopause
(either natural or surgically induced)32 and use of estrogen replacement therapy (ever versus
never). APOE genotype was determined in 5281 participants of the total cohort and in 404
participants of the subset with MRI examination.33 We classified participants into those with
or without the ε4 allele.
Data analysis
Analyses were done separately in men and women. We compared baseline characteristics in
ERα genotype using one-way analysis of variance or χ2 analysis in the total study cohort. The
hazard ratios of dementia and Alzheimer’s disease were estimated using a Cox proportional
hazard model in which time scale is the age of participants. Left truncation of the cohort was
accounted for by using the “counting process” notation available in S-Plus.34 In the subset
with MRI examinations, we used analysis of covariance to compute age adjusted means of
the brain volumes on MRI within genotype. Because preliminary analyses did not suggest
a dominant or recessive effect of the polymorphisms, we analyzed the association using an
allele-dose model. The genotype was entered as a linear term in the model to yield P-values of
the allele-dose trend. Besides age, we additionally included the following confounders in the
analyses that have previously been associated to dementia: level of education,22 body mass
index,35 smoking,36 age at menopause,37 and ever use of estrogen replacement therapy.38
Meta-analysis
We identified studies on the ERα polymorphisms and Alzheimer’s disease by searching
Medline (1966 to May 2003) using “Alzheimer’s disease” and “estrogen receptor” as key
words. The reference list of each paper was checked for additional studies. Seven papers
were identified10-16 of which five investigated Caucasian populations.10, 13-16 These five papers
reported on six independent case-control series and one prospective study. Odds ratios (OR)
of Alzheimer’s disease with 95% confidence interval (CI) were computed for each study. In
case a paper did not report results in men and women separately we contacted the authors
to provide these data. From one author we could not retrieve the data and this study was
excluded.16 The meta-analyses were based on the log odds ratios and their standard errors
and we used random effects models to compute the combined OR of Alzheimer’s disease
across ERα genotype.

Chapter 3.2
88
Results
Allele frequencies of the ERα polymorphisms were in Hardy-Weinberg equilibrium and similar
to frequencies found in other Caucasian populations (Table 1).39, 40
Table 1. ERα polymorphisms (PvuII and XbaI) in total study sample and in subset with MRI examina-
tions
Total sample (n=6056) Subset with MRI (n=468)
Men
(n=2483)
Women
(n=3573)
Men
(n=244)
Women
(n=224)
PvuII*
P 2326 (47) 3312 (46) 235 (48) 199 (44)
p 2640 (53) 3834 (54) 253 (52) 249 (56)
PP 539 (22) 780 (22) 58 (24) 39 (17)
Genotype Pp 1248 (50) 1752 (49) 119 (49) 121 (54)
pp 696 (28) 1041 (29) 67 (27) 64 (29)
Hardy-Weinberg† 0.64 0.40 0.72 0.16
XbaI*
X 1720 (35) 2487 (35) 183 (38) 157 (35)
x 3246 (65) 4759 (65) 305 (62) 291 (65)
XX 290 (12) 445 (13) 37 (15) 23 (10)
Genotype Xx 1140 (46) 1597 (45) 109 (45) 111 (50)
xx 1053 (42) 1531 (43) 98 (40) 90 (40)
Hardy-Weinberg† 0.49 0.37 0.47 0.19
*Numbers (%).
†P-value for test of Hardy-Weinberg equilibrium
Baseline characteristics of the total study sample and of the subset with MRI examinations
are given in Table 2. Characteristics across genotype were analyzed in the total study sample.
There were no significant differences in age, educational level, smoking, body mass index or
Allele
Allele

Estrogen receptor α polymorphisms, dementia and atrophy
89
ever use of hormone replacement therapy across genotype. Women with the pp genotype
had a 0.5 years later age of menopause compared to women with the PP genotype (P = 0.03),
which confirms our previous report in a smaller part of the cohort.32
Table 2. Baseline characteristics of the total study sample and of the subset with MRI examinations
Total sample (n=6056) Subset with MRI (n=468)
Characteristic
Men
(n=2483)
Women
(n=3573)
Men
(n=244)
Women
(n=224)
Age, yr 67.9 ± 7.9 69.8 ± 9.2 68.7 ± 7.8 68.7 ± 8.3
Primary education only, % 25 44 22 38
Current smoker, % 29 18 22 19
Body mass index, kg/m2 25.8 ± 3.7 26.8 ± 4.1 26.0 ± 2.7 26.7 ± 3.9
Age at menopause, yr - 48.8 ± 5.0 - 48.7 ± 5.1
Ever use of HRT, % - 10 - 9
APOE, ε4 carriers, % 28 28 31 28
MMSE, mean score 27.8 ± 1.7 27.5 ± 2.0 27.9 ± 1.8 27.7 ± 2.2
Values are means ± SD or percentages
The MMSE score at baseline was similar across genotype. After baseline, during 35405 per-
sons-years of follow-up (mean per person 5.8 years), 312 participants developed dementia.
A diagnosis of probable Alzheimer’s disease was made in 230 participants. We found no as-
sociation between ERα polymorphisms and risk of all-cause dementia or Alzheimer’s disease,
either in men or women (Table 3). This was corroborated by the meta-analysis (Figure 1).
Additional adjustments for educational level, smoking, body mass index, age at menopause
and use of estrogen replacement therapy did not change our findings. There was also no as-
sociation between the ER α polymorphisms and dementia when we separately looked within
APOE non-ε4 carriers or ε4 carriers (data not shown).

Chapter 3.2
90
Tab
le 3
. The
Pvu
II an
d X
baI E
Rα
pol
ymor
phis
m a
nd r
isk
of in
cide
nt d
emen
tia a
nd A
lzhe
imer
’s d
isea
se in
the
tot
al s
ampl
e (n
=60
56)
All-
caus
e de
men
tia (n
=31
2)A
lzhe
imer
’s d
isea
se (n
=23
0)
Men
(n=
109)
Wom
en (n
=20
3)M
en (n
=69
)W
omen
(n=
161)
Pvu
IIn
RR
(95%
CI)
nR
R (9
5% C
I)n
RR
(95%
CI)
nR
R (9
5% C
I)
PP
28 (5
)1.
041
(5)
1.0
14 (3
)1.
034
(4)
1.0
Pp
56 (5
)0.
90 (0
.72-
1.13
)96
(6)
1.02
(0.8
5-1.
23)
39 (3
)1.
06 (0
.78-
1.44
)74
(4)
0.99
(0.8
1-1.
21)
pp25
(4)
0.90
(0.7
8-1.
05)
66 (6
)1.
04 (0
.94-
1.15
)16
(2)
0.92
(0.7
6-1.
12)
53 (5
)1.
04 (0
.93-
1.17
)
Tren
d 0.
130.
430.
580.
55
Xba
In
RR
(95%
CI)
nR
R (9
5% C
I)n
RR
(95%
CI)
nR
R (9
5% C
I)
XX
15 (5
)1.
020
(5)
1.0
9 (3
)1.
016
(4)
1.0
Xx
47 (4
)0.
87 (0
.65-
1.17
)98
(6)
1.25
(0.9
8-1.
58)
31 (3
)0.
92 (0
.64-
1.34
)76
(5)
1.23
(0.9
4-1.
61)
xx47
(5)
1.00
(0.8
7-1.
14)
85 (6
)1.
01 (0
.91-
1.12
)29
(3)
0.99
(0.8
3-1.
17)
69 (5
)1.
02 (0
.91-
1.15
)
Tren
d0.
900.
820.
870.
70
Valu
es a
re n
umbe
r of
cas
es in
eac
h ge
noty
pe (%
with
in g
enot
ype)
, rel
ativ
e ris
k (R
R) (
95%
con
fiden
ce in
terv
al (C
I)) o
f de
men
tia c
ompa
red
to r
efer
-
ence
gen
otyp
e es
timat
ed w
ith C
ox p
ropo
rtio
nal h
azar
ds m
odel
s w
ith a
ge o
n th
e tim
e sc
ale.
P-v
alue
s fo
r tre
nd a
naly
ses
with
gen
otyp
e as
line
ar te
rm
in t
he m
odel

Estrogen receptor α polymorphisms, dementia and atrophy
91
Fig
ure
1. O
dds
ratio
(OR
) of A
lzhe
imer
’s d
isea
se fo
r the
ER
Pvu
II ge
noty
pe p
p or
pP
com
pare
d to
PP
gen
otyp
e an
d th
e X
baI g
enot
ype
xx o
r xX
com
-
pare
d to
XX
gen
otyp
e. E
rror
bar
s de
note
95%
con
fiden
ce in
terv
al. T
he a
reas
of
the
boxe
s ar
e pr
opor
tiona
l to
the
inve
rse
varia
nces
of
the
estim
ated
log
odds
rat
ios.
* fa
mili
al A
lzhe
imer
cas
es. N
A n
ot a
vaila
ble
due
to n
o co
ntro
ls o
r ca
ses
with
XX
gen
otyp
e
���
���
����
��
�����
���
����
�
���
���
����
��
�����
���
����
�
���
���
����
��
�����
����
����
��
���
���
����
��
�����
����
����
����������������
���
�����������
��������������������
���
����������������
����
��
����������������
���
��
����������������
���
���
�������������
���
����
�������������
���
����������������������
���
����������������
������
���
����������������
������
���
����������������
�����
���
����������������
�����
��
����������������
�����
���
��������������
�����
����
�������������
�����
����
�������������
�����
����
�����
����
���
����
�����
����
���
����
�����
����
���
����
�����
����
���
����
�����
����
���
����
�����
����
���
����
�����
����
���
����
�����
����
���
��

Chapter 3.2
92
In the subset with MRI examinations (n=468), we found smaller hippocampal and amygdalar
volumes on MRI in women with the pp or xx genotype compared to women with the PP or
XX genotype (Table 4). There was an allele dose effect: per allele copy of the “p” allele the
amygdala was –0.17 ml smaller (95% CI –0.30 to –0.05) and per allele copy of the “x” allele
–0.17 ml (95% CI –0.30 to –0.04). The explained variance in amygdalar volume by the PvuII
polymorphism above age was 3% (R square change 0.030, F (1,221)=7.11, P=0.008). There
were 25 cases of incident dementia in the subset with MRI and excluding them did not
change the results. There was no association between the ERα polymorphism and brain vol-
umes in men. Additional adjustments for educational level, smoking, body mass index, age at
menopause and use of estrogen replacement therapy did not change the results. There was
no difference in the results when we stratified by APOE genotype.
Table 4. The PvuII and XbaI ERα polymorphism and brain volumes on MRI in the subset (n=468)
Hippocampal volumes (ml) Amygdalar volumes (ml)
Men
(n=244)
Women
(n=224)
Men
(n=244)
Women
(n=224)
PvuII
PP 6.56 ± 0.12 6.32 ± 0.13 4.73 ± 0.10 4.50 ± 0.10
Pp 6.52 ± 0.08 6.22 ± 0.07 4.74 ± 0.07 4.45 ± 0.06
pp 6.56 ± 0.11 6.06 ± 0.10 4.82 ± 0.09 4.18 ± 0.08
Trend 0.99 0.10 0.49 0.008
XbaI
XX 6.38 ± 0.15 6.28 ± 0.16 4.72 ± 0.12 4.51 ± 0.13
Xx 6.57 ± 0.09 6.28 ± 0.08 4.73 ± 0.07 4.47 ± 0.06
xx 6.56 ± 0.09 6.06 ± 0.08 4.81 ± 0.07 4.24 ± 0.07
Trend 0.41 0.08 0.41 0.01
Values are age adjusted mean volumes (standard error) and P values for trend analyses
The haplotype 1 (px) genotype followed exactly the PvuII genotype and therefore the analyses
on haplotype 1 in association with outcome were similar as we report for the PvuII polymor-
phism.

Estrogen receptor α polymorphisms, dementia and atrophy
93
Discussion
In this report based on a large population-based study and meta-analysis we show no effect
of the PvuII and XbaI polymorphisms in the ERα gene on risk of dementia. However, we ob-
served women with the p or x allele or haplotypes thereof to have smaller amygdalar volumes
on MRI compared to women with the P or X allele. There was no differential effect according
to APOE genotype.
Potential dangers of genetic association studies are population stratification or heterogeneity.
This particularly holds for case-control studies in persons of mixed racial origin. In our study,
this has played no role since all subjects were of Dutch Caucasian origin and can be consi-
dered ethnically homogeneous. Furthermore, allele frequencies were similar to those found
in studies of other Caucasian subjects.40
The disruption of ERα in ER-null mice causes memory impairment,41 a proinflammatory phe-
notype of microglia localized in the hippocampus and amygdala,42 and abolishment of the
protective effect of estradiol on ischaemic brain injury.43 Furthermore, brains of patients with
Alzheimer’s disease have less hippocampal neurons stained with ERα indicating a poten-
tial role of dysfunctional ERα in the pathogenesis of Alzheimer’s disease.44 The PvuII-XbaI
polymorphisms in the ERα gene are attractive polymorphisms to investigate in association to
Alzheimer’s disease as they have been implicated in estrogen-related diseases such as oste-
oporosis,31 heart disease,45 and breast cancer.46 Also, we recently showed that women carry-
ing the px haplotype were shorter. Given that the PvuII and XbaI polymorphisms are in strong
linkage disequilibrium31 it is difficult to determine which of the two polymorphic sites is driving
the associations. Both of them have an intronic localization and functional consequences on
a biochemical level have still not been established. Interestingly though, Herrington et al.47 re-
cently showed that the T-allele of the PvuII polymorphism –corresponding to the “p” allele in
our analyses– lacks a binding site for the transcription factor bMyb, which might result in low-
er ERα transcription. Nuclear ERα receptors bind to estrogen response elements in promotor
regions of target genes which in turn stimulate expression of genes thought to be involved in
neuroprotection.48 Therefore, neurons expressing low ERα may be posed vulnerable to toxic
events. Moreover, women with the p allele have a later age of menopause as shown in the
current sample which extends our previous smaller sample32 and later age of menopause is
associated with a higher risk of Alzheimer’s disease.37 Our findings however did not support
the hypothesis that ERα PvuII-XbaI genotypes are associated to vulnerability to Alzheimer’s
disease. We did find the ERα PvuII-XbaI genotype to be associated to amygdalar volume in
women. This could be a false positive finding. However, the population-based design, the size
of the sample and the allele-dose effect of the relation supports a true association. Further-
more, genotype effects were similar, although weaker, for the hippocampus. This is in striking

Chapter 3.2
94
similarity with the higher density of ERα in the amygdala compared to the hippocampus.9, 49
Although amygdalar atrophy is found in early Alzheimer’s disease,18 exclusion of people who
developed Alzheimer’s disease during follow-up did not change the results. This limits the pos-
sibility that early Alzheimer’s disease accounted for the findings on the amygdala. Does this
smaller amygdalar volume then have any functional significance? The amygdala has several
functions in emotional behavior and fear conditioning and amygdalar atrophy is reported in
anxiety disorders.50-53 One may speculate that amygdalar atrophy could be the structural link
between recently reported associations of polymorphisms in the ERα gene and anxiety.50, 51,
54 Future studies should include both amygdala volume and psychometric assessments of
anxiety to test this hypothesis.
References
1. Behl C, Skutella T, Lezoualc’h F, et al. Neuroprotection against oxidative stress by estrogens:
structure- activity relationship. Mol Pharmacol 1997; 51: 535-541.
2. Singh M, Meyer EM and Simpkins JW. The effect of ovariectomy and estradiol replacement on
brain-derived neurotrophic factor messenger ribonucleic acid expression in cortical and hippo-
campal brain regions of female Sprague-Dawley rats. Endocrinology 1995; 136: 2320-2324.
3. Dhandapani KM and Brann DW. Protective effects of estrogen and selective estrogen receptor
modulators in the brain. Biol Reprod 2002; 67: 1379-1385.
4. Maki PM and Resnick SM. Effects of estrogen on patterns of brain activity at rest and during
cognitive activity: a review of neuroimaging studies. Neuroimage 2001; 14: 789-801.
5. Kawas C, Resnick S, Morrison A, et al. A prospective study of estrogen replacement therapy
and the risk of developing Alzheimer’s disease: the Baltimore Longitudinal Study of Aging.
Neurology 1997; 48: 1517-1521.
6. Tang MX, Jacobs D, Stern Y, et al. Effect of oestrogen during menopause on risk and age at
onset of Alzheimer’s disease. Lancet 1996; 348: 429-432.
7. Shumaker SA, Legault C, Thal L, et al. Estrogen plus progestin and the incidence of dementia
and mild cognitive impairment in postmenopausal women: the Women’s Health Initiative Mem-
ory Study: a randomized controlled trial. JAMA 2003; 289: 2651-2662.
8. Geerlings MI, Launer LJ, de Jong FH, et al. Endogenous estradiol and risk of dementia in
women and men: the Rotterdam Study. Ann Neurol 2003; 53: 607-615.
9. Österlund MK, Keller E and Hurd YL. The human forebrain has discrete estrogen receptor α
messenger RNA expression: high levels in the amygdaloid complex. Neuroscience 2000; 95:
333-342.
10. Yaffe K, Lui LY, Grady D, Stone K and Morin P. Estrogen receptor 1 polymorphisms and risk of
cognitive impairment in older women. Biol Psychiatry 2002; 51: 677-682.
Estrogen receptor α polymorphisms, dementia and atrophy
95
11. Isoe K, Ji Y, Urakami K, Adachi Y and Nakashima K. Genetic association of estrogen receptor
gene polymorphisms with Alzheimer’s disease. Alzheimer’s research 1997; 3: 195-197.
12. Ji Y, Urakami K, Wada-Isoe K, Adachi Y and Nakashima K. Estrogen receptor gene polymor-
phisms in patients with Alzheimer’s disease, vascular dementia and alcohol-associated demen-
tia. Dement Geriatr Cogn Disord 2000; 11: 119-122.
13. Maruyama H, Toji H, Harrington CR, et al. Lack of an association of estrogen receptor α gene
polymorphisms and transcriptional activity with Alzheimer disease. Arch Neurol 2000; 57: 236-
240.
14. Mattila KM, Axelman K, Rinne JO, et al. Interaction between estrogen receptor 1 and the ε4
allele of apolipoprotein E increases the risk of familial Alzheimer’s disease in women. Neurosci
Lett 2000; 282: 45-48.
15. Lambert JC, Harris JM, Mann D, et al. Are the estrogen receptors involved in Alzheimer’s dis-
ease? Neurosci Lett 2001; 306: 193-197.
16. Brandi ML, Becherini L, Gennari L, et al. Association of the estrogen receptor α gene polymor-
phisms with sporadic Alzheimer’s disease. Biochem Biophys Res Commun 1999; 265: 335-
338.
17. Convit A, De Leon MJ, Tarshish C, et al. Specific hippocampal volume reductions in individuals
at risk for Alzheimer’s disease. Neurobiol Aging 1997; 18: 131-138.
18. Callen DJ, Black SE, Gao F, Caldwell CB and Szalai JP. Beyond the hippocampus: MRI volumetry
confirms widespread limbic atrophy in AD. Neurology 2001; 57: 1669-1674.
19. Farrer LA, Cupples LA, Haines JL, et al. Effects of age, sex, and ethnicity on the association be-
tween apolipoprotein E genotype and Alzheimer disease. A meta-analysis. APOE and Alzhei-
mer Disease Meta Analysis Consortium. JAMA 1997; 278: 1349-1356.
20. Struble RG, Rosario ER, Kircher ML, et al. Regionally specific modulation of brain apolipoprotein
E in the mouse during the estrous cycle and by exogenous 17ß estradiol. Exp Neurol 2003;
183: 638-644.
21. Hofman A, Grobbee DE, de Jong PTVM and van den Ouweland FA. Determinants of disease
and disability in the elderly: the Rotterdam Elderly Study. Eur J Epidemiol 1991; 7: 403-422.
22. Ott A, Breteler MMB, van Harskamp F, et al. Prevalence of Alzheimer’s disease and vascular
dementia: association with education. The Rotterdam study. BMJ 1995; 310: 970-973.
23. Ott A, Breteler MMB, van Harskamp F, Stijnen T and Hofman A. Incidence and risk of dementia.
The Rotterdam Study. Am J Epidemiol 1998; 147: 574-580.
24. Ruitenberg A, Ott A, van Swieten JC, Hofman A and Breteler MMB. Incidence of dementia:
does gender make a difference? Neurobiol Aging 2001; 22: 575-580.
25. McKhann G, Drachman D, Folstein M, Katzman R, Price D and Stadlan EM. Clinical diagnosis
of Alzheimer’s disease: report of the NINCDS-ADRDA Work Group under the auspices of De-

Chapter 3.2
96
partment of Health and Human Services Task Force on Alzheimer’s Disease. Neurology 1984;
34: 939-944.
26. Román GC, Tatemichi TK, Erkinjuntti T, et al. Vascular dementia: diagnostic criteria for research
studies. Report of the NINDS-AIREN International Workshop. Neurology 1993; 43: 250-260.
27. Breteler MMB. Vascular involvement in cognitive decline and dementia. Epidemiologic evi-
dence from the Rotterdam Study and the Rotterdam Scan Study. Ann N Y Acad Sci 2000; 903:
457-465.
28. Hackert VH, den Heijer T, Oudkerk M, Koudstaal PJ, Hofman A and Breteler MMB. Hippocampal
head size associated with verbal memory performance in nondemented elderly. Neuroimage
2002; 17: 1365-1372.
29. den Heijer T, Vermeer SE, Clarke R, et al. Homocysteine and brain atrophy on MRI of non-de-
mented elderly. Brain 2003; 126: 170-175.
30. Cuenod CA, Denys A, Michot JL, et al. Amygdala atrophy in Alzheimer’s disease. An in vivo
magnetic resonance imaging study. Arch Neurol 1993; 50: 941-945.
31. van Meurs JB, Schuit SC, Weel AE, et al. Association of 5’ estrogen receptor alpha gene poly-
morphisms with bone mineral density, vertebral bone area and fracture risk. Hum Mol Genet
2003; 12: 1745-1754.
32. Weel AE, Uitterlinden AG, Westendorp IC, et al. Estrogen receptor polymorphism predicts the
onset of natural and surgical menopause. J Clin Endocrinol Metab 1999; 84: 3146-3150.
33. Slooter AJC, Cruts M, Kalmijn S, et al. Risk estimates of dementia by apolipoprotein E geno-
types from a population-based incidence study: the Rotterdam Study. Arch Neurol 1998; 55:
964-968.
34. Andersen PK, Borgan Ø, Gill RD and Keiding N. Statistical Models Based on Counting pro-
cesses. Springer-Verlag. Statistical Models Based on Counting processes, 1993.
35. Gustafson D, Rothenberg E, Blennow K, Steen B and Skoog I. An 18-year follow-up of over-
weight and risk of Alzheimer disease. Arch Intern Med 2003; 163: 1524-1528.
36. Ott A, Slooter AJC, Hofman A, et al. Smoking and risk of dementia and Alzheimer’s disease in a
population-based cohort study: the Rotterdam Study. Lancet 1998; 351: 1840-1843.
37. Geerlings MI, Ruitenberg A, Witteman JC, et al. Reproductive period and risk of dementia in
postmenopausal women. JAMA 2001; 285: 1475-1481.
38. Yaffe K, Sawaya G, Lieberburg I and Grady D. Estrogen therapy in postmenopausal women:
effects on cognitive function and dementia. JAMA 1998; 279: 688-695.
39. Lorentzon M, Lorentzon R and Nordstrom P. Vitamin D receptor gene polymorphism is asso-
ciated with birth height, growth to adolescence, and adult stature in healthy caucasian men: a
cross-sectional and longitudinal study. J Clin Endocrinol Metab 2000; 85: 1666-1670.
40. Albagha OM, McGuigan FE, Reid DM and Ralston SH. Estrogen receptor alpha gene polymor-

Estrogen receptor α polymorphisms, dementia and atrophy
97
phisms and bone mineral density: haplotype analysis in women from the United Kingdom. J
Bone Miner Res 2001; 16: 128-134.
41. Fugger HN, Foster TC, Gustafsson J and Rissman EF. Novel effects of estradiol and estrogen
receptor a and ß on cognitive function. Brain Res 2000; 883: 258-264.
42. Vegeto E, Belcredito S, Etteri S, et al. Estrogen receptor-α mediates the brain antiinflammatory
activity of estradiol. Proc Natl Acad Sci U S A 2003; 100: 9614-9619.
43. Dubal DB, Zhu H, Yu J, et al. Estrogen receptor α, not ß, is a critical link in estradiol-mediated
protection against brain injury. Proc Natl Acad Sci U S A 2001; 98: 1952-1957.
44. Hu XY, Qin S, Lu YP, Ravid R, Swaab DF and Zhou JN. Decreased estrogen receptor-α expres-
sion in hippocampal neurons in relation to hyperphosphorylated tau in Alzheimer patients. Acta
Neuropathol (Berl) 2003.
45. Shearman AM, Cupples LA, Demissie S, et al. Association between estrogen receptor α gene
variation and cardiovascular disease. JAMA 2003; 290: 2263-2270.
46. Shin A, Kang D, Nishio H, et al. Estrogen receptor alpha gene polymorphisms and breast cancer
risk. Breast Cancer Res Treat 2003; 80: 127-131.
47. Herrington DM, Howard TD, Brosnihan KB, et al. Common estrogen receptor polymorphism
augments effects of hormone replacement therapy on E-selectin but not C-reactive protein.
Circulation 2002; 105: 1879-1882.
48. McEwen BS. Invited review: Estrogens effects on the brain: multiple sites and molecular mech-
anisms. J Appl Physiol 2001; 91: 2785-2801.
49. Österlund MK, Gustafsson JA, Keller E and Hurd YL. Estrogen receptor ß (ERß) messenger ri-
bonucleic acid (mRNA) expression within the human forebrain: distinct distribution pattern to
ERα mRNA. J Clin Endocrinol Metab 2000; 85: 3840-3846.
50. Prichard Z, Jorm AF, Prior M, et al. Association of polymorphisms of the estrogen receptor gene
with anxiety-related traits in children and adolescents: a longitudinal study. Am J Med Genet
2002; 114: 169-176.
51. Westberg L, Melke J, Landen M, et al. Association between a dinucleotide repeat polymor-
phism of the estrogen receptor alpha gene and personality traits in women. Mol Psychiatry
2003; 8: 118-122.
52. Rauch SL, Shin LM and Wright CI. Neuroimaging studies of amygdala function in anxiety disor-
ders. Ann N Y Acad Sci 2003; 985: 389-410.
53. Massana G, Serra-Grabulosa JM, Salgado-Pineda P, et al. Amygdalar atrophy in panic disorder
patients detected by volumetric magnetic resonance imaging. Neuroimage 2003; 19: 80-90.
54. Comings DE, Muhleman D, Johnson P and MacMurray JP. Potential role of the estrogen recep-
tor gene (ESR1) in anxiety. Mol Psychiatry 1999; 4: 374-377.


99
Chapter 3.3
Diabetes mellitus and medial temporal lobe atrophy
Aim/hypothesis: Type 2 diabetes increases the risk not only of vascular dementia but also of
Alzheimer’s disease. The question remains whether diabetes increases the risk of Alzheimer’s
disease by diabetic vasculopathy or whether diabetes influences directly the development of
Alzheimer neuropathology. In vivo, hippocampal and amygdalar atrophy on brain MRI are good,
early markers of the degree of Alzheimer neuropathology. We investigated the association
between diabetes mellitus, insulin resistance and the degree of hippocampal and amygdalar
atrophy on magnetic resonance imaging (MRI) accounting for vascular pathology.
Methods: Data was obtained in a population-based study of elderly subjects without demen-
tia between 60 to 90 years of age. The presence of diabetes mellitus and, in non-diabetic
subjects, insulin resistance was assessed for 506 participants in whom hippocampal and
amygdalar volumes on MRI were measured. We assessed the degree of vascular morbidity
by rating carotid atherosclerosis, and brain white matter lesions and infarcts on MRI.
Results: Subjects with diabetes mellitus had more hippocampal and amygdalar atrophy on
MRI compared to subjects without diabetes mellitus. Furthermore, increasing insulin resis-
tance was associated with more amygdalar atrophy on MRI. The associations were not due to
vascular morbidity being more pronounced in persons with diabetes mellitus.
Conclusions/interpretation: Type 2 diabetes is associated with hippocampal and amygdalar
atrophy, regardless of vascular pathology. This suggests that type 2 diabetes directly influ-
ences the development of Alzheimer neuropathology.

Chapter 3.3
100
Introduction
Type 2 diabetes increases the risk of stroke1 and vascular dementia.2 Recently, patients with
type 2 diabetes were found to have an increased risk of the most common form of dementia,
Alzheimer’s disease.3, 4 The pathophysiological mechanism of the relation between diabetes
mellitus and Alzheimer’s disease is not clear. Diabetic vasculopathy can cause cerebrovascu-
lar brain damage, which is frequently found in patients with Alzheimer’s disease5 However,
other, more direct effects of diabetes on the development of Alzheimer neuropathology can
also be involved. Advanced glycation end products increase aggregation of proteins involved
in Alzheimer’s disease.6 Furthermore, dysfunction of insulin signalling in the brain has been
implicated in the pathogenesis of Alzheimer’s disease.7 The neuropathology of Alzheimer’s
disease occurs with greatest severity and in an early stage of the disease in the hippocampus
and amygdala, brain structures in the medial temporal lobe.8 In vivo assessment of hippocam-
pal volume on magnetic resonance imaging (MRI) of the brain provides a good estimate of the
degree of Alzheimer neuropathology, even in elderly subjects without clinical symptoms of
dementia.9 Several studies show that patients with mild Alzheimer’s disease have smaller vol-
umes of the hippocampus10-12 and amygdala13, 14 on MRI compared to healthy control subjects.
We examined the association between diabetes mellitus, insulin resistance and hippocampal
and amygdalar atrophy on MRI using these as early MRI markers of Alzheimer’s disease. We
accounted for atherosclerosis and cerebrovascular disease to examine whether any associa-
tion was caused by concomitant vascular disease.
Methods
Participants
The Rotterdam Study is a large population-based cohort study in the Netherlands that in-
vestigates the prevalence, incidence and determinants of chronic diseases in the elderly.15
Baseline examinations were done in 1990 to 1993. In 1995 to 1996, we randomly selected
965 living members (60-90 years of age) of the cohort in strata of sex and age (5 years) to
participate in the Rotterdam Scan Study, designed to investigate age-related brain abnormali-
ties on MRI.16 After excluding individuals who were demented (n=17)17 or had MRI contrain-
dications (n=116), 832 people were eligible and invited. Among these, 563 participants gave
their written informed consent and underwent MRI scanning of the brain (participation rate:
68 %). Participants were in general healthier than non-participants.18 The study protocol was
approved by the medical ethics committee of the Erasmus Medical Center, Rotterdam, the
Netherlands.

Diabetes mellitus and medial temporal lobe atrophy
101
Assessment of diabetes mellitus and insulin resistance
Presence of diabetes mellitus was assessed at the baseline of the Rotterdam Study (1990-
1993) and at time of MRI (1995-1996). Participants where considered to have diabetes mellitus
if they reported use of oral anti-diabetic treatment or of insulin, or if they had a random serum
glucose concentration greater than or equal to 11.1 mmol/l. In addition, if a post-load glucose
concentration (2 h after a glucose drink of 75 g in 200 ml water) at baseline was greater than
or equal to 11.1 mmol/l the participant was also considered to have diabetes mellitus. Glucose
concentrations were measured by the glucose hexokinase method. Insulin resistance in non-
diabetic subjects at baseline was assessed by the ratio of the post-load insulin concentration
(Medgenix, Brussels, Belgium) over post-load glucose concentration.
MRI procedures
In 1995 to 1996, standard T1, T2 and proton-density weighted MR sequences of the brain
were made using a 1.5 Tesla MR unit (VISION MR, Siemens, Erlangen, Germany).19 After
these sequences were finished, an additional custom-made three-dimensional MRI sequence
of the whole brain was acquired (named half-Fourier acquisition single-shot turbo spin echo 20). This three-dimensional MRI sequence was used for later volumetric assessments of the
hippocampus and amygdala. A total of 52 participants developed claustrophobia during the
MRI scanning period, leaving 511 participants with a completed three-dimensional MRI se-
quence.
Hippocampal and amygdalar volumes on MRI
For the 511 participants with a three-dimensional MRI sequence, we reformatted a series of
coronal brain slices (contiguous 1.5-mm slices) aligned to be perpendicular to the long axis of
the hippocampus and the middle sagittal slice. The procedure of segmenting the hippocam-
pus and amygdala has been described in detail.20 Briefly, we manually traced the boundaries
of the hippocampi and amygdalae using a mouse-driven pointer (Figure 1), which yielded
outlined areas (mm2). We proceeded from posterior to anterior, starting on the slice where
the crux of the fornices of the hippocampus was in full profile. We multiplied the summed
areas with slice thickness (1.5-mm) to calculate estimates of the left and right hippocampal
and amygdalar volume (ml). Total hippocampal and amygdalar volumes were calculated by
summing the left and right hippocampal volume and the left and right amygdalar volume. As
a proxy for head size, we measured on the middle sagittal MRI slice the intracranial cross-
sectional area.20, 21 We corrected for head size difference across the subjects as follows.13, 21
First, each subject’s hippocampal or amygdalar volumes were divided by their measured head
size area. Next, to obtain head size corrected, normalised volumes the ratios for each subject
were multiplied by the average head size area (men and women separately).

Chapter 3.3
102
Figure 1. Coronal MRI slice on which the hippocampus (H) and amygdala (A) are depicted
Other measurements
We interviewed and gave physical examinations to the participants to obtain information on
their: educational level (according to UNESCO22), BMI (weight divided by the square of the
height), pack-years of cigarette smoking, blood pressure and serum total cholesterol.23 Mem-
ory function was evaluated with a 15-word learning test which consisted of three immediate
learning trials and a delayed recall trial.19 For each participant, we calculated z-scores (individual
test score minus mean test score divided by the standard deviation). We constructed a com-
pound score for memory performance by averaging the z-score of the three immediate recall
trials and the delayed recall trial.19 Apolipoprotein E (APOE) genotyping yielded the following
alleles: ε2, ε3, and ε4.24 We classified participants into those with and without a ε4 allele be-
cause the ε4 allele is a strong risk factor of Alzheimer’s disease.25 Because the presence of
the ε2 allele can reduce the risk of Alzheimer’s disease,25 we excluded persons with genotype
ε2ε4 (n=9) in the analyses considering APOE genotype. To assess carotid atherosclerosis,
participants underwent ultrasonography of the carotid arteries.26 Presence of atherosclerotic
plaques was determined at the common carotid artery, the carotid bifurcation, and the internal
carotid artery at the left and right side and summed (range 0-6). The intima-media thickness
was measured by longitudinal two-dimensional ultrasound of the anterior and posterior wall of
both common carotid arteries. We calculated the mean of these four locations. Cerebral white

Diabetes mellitus and medial temporal lobe atrophy
103
matter lesions were assessed on proton-density weighted axial MR images and were scored
in the periventricular regions (range 0-9) and the subcortical regions (approximated volume).19
Brain infarcts were defined as focal hyperintensities on T2 weighted images, and, if present
in the white matter, with corresponding prominent hypointensity on T1.23
Data analysis
We missed information on the presence of diabetes mellitus in five participants, leaving a
total of 506 participants for the analyses. We used multiple linear regression modelling to
quantify the relation between diabetes, insulin resistance in non-diabetic subjects, and MRI
volumes. Adjustments were made for age and sex. Additional adjustments included BMI,
pack-years of cigarette smoking, blood pressure and serum cholesterol as co-variates. To in-
vestigate whether vascular disease was mediating any association between diabetes, insulin
resistance and MRI volumes, we adjusted for carotid atherosclerosis, white matter lesions
and brain infarcts on MRI. We repeated all analyses excluding subjects with infarcts on MRI.
Finally, because the effect of diabetes on the risk of dementia might differ across APOE geno-
types,4 we studied possible effect modification by APOE genotype through stratified analyses
(non-carrier of the ε4 allele versus carrier of the ε4 allele). Assumptions of the model were
verified by residual diagnostics. A P-value of less than 0.05 was considered to be statistically
significant.

Chapter 3.3
104
Results
Selected characteristics of the study cohort according to the presence of diabetes mellitus
are given in Table 1.
Table 1. Characteristics of participants with and without diabetes mellitus
Characteristic
No
diabetes
mellitus
(n=465)
Diabetes
mellitus
(n=41)
Adjusted difference*
Age, years 73±8 77±8 4 (1; 6)
Women, % 50 34 -17 (-33; -0.6)
Education, primary only % 30 38 7 (-8; 20)
Memory performance, Z-score 0.03±0.92 -0.51±0.80 -0.33 (-0.60; -0.06)
Body mass index, kg/m2 26.2±3.7 26.8±2.9 0.7 (-0.5; 1.8)
Pack-years of cigarette smoking 20±25 24±24 2 (-5; 10)
Diastolic blood pressure, mmHg 77±11 75±13 -1 (-5; 3)
Systolic blood pressure, mmHg 146±20 146±21 -1 (-8; 5)
Total cholesterol, mmol/l 5.8±1.0 5.9±1.3 0.2 (-0.2; 0.5)
Carotid plaques, total number 1.6±1.6 2.6±1.6 0.7 (0.2; 1.3)
Intima-media thickness, mm 0.86±0.14 0.93±0.13 0.04 (-0.01; 0.08)
Periventricular white matter lesions, grade 2.7±2.2 3.6 (2.2) 0.4 (-0.2; 1.1)
Subcortical white matter lesions, ml 1.7±3.4 2.3 (3.6) 0.01 (-1.0; 1.0)
Brain infarcts, % 27 44 11 (-3; 25)
APOE, ε4 carriers, % 27 31 5 (-11; 21)
Postload insulin, pmol/l† 422.0±312.6 - -
Insulin resistance, pmol/mmol† 65.1±40.1 - -
Values are means ± standard deviation or percentages
*Age and sex adjusted difference (95% CI) in characterstic between participants with and without dia-
betes mellitus
†Present for 405 participants without diabetes

Diabetes mellitus and medial temporal lobe atrophy
105
In total, 41 participants (8.1%) had diabetes mellitus. Twenty-six of them were treated with
anti-diabetic medication at time of MRI. Their median age when they were diagnosed with
diabetes mellitus was 64 years (range 43-84), suggesting that they all had type 2 diabetes. Of
note, although all participants were clinically free from dementia, persons with diabetes mel-
litus performed worse on memory tests (Table 1). Persons with diabetes mellitus had more
atherosclerotic plaques in the carotid arteries (Table 1). They also had more cerebral white
matter lesions on MRI, but this was not statistically significant after accounting for age and
sex differences. Brain infarcts were 1.7 times (95% CI 0.8 to 3.3) more frequent in subjects
with diabetes mellitus compared to those without diabetes mellitus, after adjusting for age
and sex.
Subjects with diabetes mellitus had smaller hippocampal and amygdalar volumes on MRI
(Figure 2). Diabetes mellitus had a similar effect on the left and the right-sided brain volumes
separately. Additional adjustments for BMI, pack-years of cigarette smoking, blood pressure
and cholesterol, did not change the results.
Figure 2. Hippocampal volumes and amygdalar volumes (+standard error) on brain MRI in participants
with diabetes (n=41) and without diabetes (n=465). Volumes are adjusted for age and sex and normalised
to average head size
Although subjects with diabetes mellitus had more vascular disease, accounting for markers
of vascular disease did not change the association between diabetes and hippocampal or
amygdalar volumes (Table 2). Exclusion of participants with infarcts (n=142) did not change
the results either. There was no difference in association between diabetes and MRI volumes
���
���
���
���
���
���
����������� ��������
���
��
���
���
���
���
����
��
���
���
���
���
���
���
����������� ��������
��
���
����
���
���
����
��
������� �������

Chapter 3.3
106
according to APOE strata. In non-carriers of the ε4 allele, the age and sex adjusted difference
in hippocampal volume between persons with and without diabetes mellitus was –0.30 (95%
CI –0.66 to 0.06). In carriers of the ε4 allele the difference in hippocampal volume was –0.31
(95% CI –0.84 to 0.21). In non-carriers of the ε4 allele, the age and sex adjusted difference in
amygdalar volume between persons with and without diabetes mellitus was –0.28 (95% CI
–0.58 to 0.01). In carriers of the ε4 allele the difference in amygdalar volume was –0.41 (95%
CI –0.86 to 0.04).
Table 2. Hippocampal and amygdalar volume on MRI in participants with and without diabetes mellitus
accounting for markers of vascular disease
Volume difference between participants with and without diabetes
mellitus, ml (95% CI)
Difference adjusted for Hippocampus* P Amygdala* P
Age and sex -0.28 (-0.55 to -0.01) 0.042 -0.33 (-0.55 to -0.11) 0.004
Age, sex, and carotid
atherosclerosis-0.27 (-0.55 to 0.00) 0.053 -0.32 (-0.54 to -0.10) 0.005
Age, sex, white matter le-
sions and infarcts on MRI-0.27 (-0.54 to 0.00) 0.053 -0.33 (-0.56 to -0.11) 0.003
Values are adjusted differences (95% CI and P-value) in MRI volumes (ml) between participants without
diabetes mellitus (n=465) and participants with diabetes mellitus (n=41)
*Volumes are normalised to average head size
In non-diabetic participants (n=465), post-load insulin concentrations and insulin resistance
were present for 405 participants. Persons with higher post-load insulin concentrations or
insulin resistance had smaller amygdalar volumes, but not smaller hippocampal volumes on
MRI (Table 3). Additional adjusting for BMI, pack-years of cigarette smoking, blood pressure,
cholesterol, carotid atherosclerosis, white matter lesions and infarcts did not change the as-
sociations, nor did excluding participants with infarcts. The association between insulin re-
sistance and amygdalar volumes on MRI was similar in APOE strata, although statistically
significant only in non-carriers of the ε4 allele [non-carriers: adjusted difference in amygdalar
volume per standard deviation increase in insulin resistance –0.11 (95% CI –0.19 to –0.04);
carriers: –0.02 (95% CI –0.18 to 0.15)].

Diabetes mellitus and medial temporal lobe atrophy
107
Table 3. Insulin resistance in participants without diabetes (n=405) in relation to hippocampal and
amygdalar volumes on MRI
Volume difference per SD increase in insulin concentrations and insulin
resistance, ml (95% CI)
Hippocampus* P Amygdala* P
Post-load insulin (per SD)
Adjusted for
Age and sex -0.02 (-0.11 to 0.06) 0.57 -0.08 (-0.14 to -0.01) 0.020
Age, sex and carotid athero-
sclerosis-0.03 (-0.11 to 0.05) 0.51 -0.08 (-0.14 to -0.01) 0.018
Age, sex, white matter le-
sions and infarcts on MRI-0.02 (-0.11 to 0.06) 0.56 -0.08 (-0.15 to -0.02) 0.013
Insulin resistance (per SD)
Adjusted for
Age and sex -0.00 (-0.09 to 0.08) 0.93 -0.08 (-0.15 to -0.02) 0.012
Age, sex and carotid athero-
sclerosis-0.01 (-0.10 to 0.07) 0.75 -0.09 (-0.15 to -0.02) 0.008
Age, sex, white matter le-
sions and infarcts on MRI-0.00 (-0.08 to 0.08) 0.95 -0.09 (-0.15 to -0.02) 0.008
Values are adjusted differences (95% CI and P-value) in MRI volumes (ml) per standard deviation (SD)
increase in post-load insulin concentration and insulin resistance
*Volumes are normalised to average head size
Discussion
We observed that people with type 2 diabetes had more hippocampal and amygdalar atrophy
on MRI than people without diabetes. Moreover, in persons without diabetes mellitus, insulin
resistance was associated to amygdalar atrophy on MRI. The presence of atherosclerosis or
cerebrovascular disease did not explain the associations.
The strengths of our study are its population-based design and the large sample with volu-
metric MRI. The prevalence of diabetes mellitus in our study was comparable to another
Dutch population study,27 leading to a moderate number of people with diabetes mellitus
studied in the sample. However, the associations were robust and statistically significant sug-

Chapter 3.3
108
gesting that we had sufficient power. A limitation of our study was the indirect assessment
of insulin resistance through calculating the ratio of post-load insulin concentrations with
glucose concentrations. This ratio however in non-diabetic subjects correlates well with the
degree of insulin resistance assessed with precise clamping techniques.28
Several studies have found an increased risk of Alzheimer’s disease in people with diabetes
mellitus.3, 4, 17, 29-31 Other studies did not find this association or merely an association between
diabetes mellitus and vascular dementia.32-35 Difficulties in diagnosing Alzheimer’s disease
in life and distinguishing it from vascular dementia could have resulted in different findings
across studies. Alzheimer’s disease is generally characterised by slow progression in clinical
symptoms which is thought to reflect gradual development of the specific Alzheimer pa-
thology over time.8 The pathological hallmarks of Alzheimer’ s disease, neurofibrillary tan-
gles and amyloid plaques, occur in the most early stage of the disease in the hippocampus
and amygdala8 causing neuronal loss and atrophy that can be visualised on MRI.36 At this
stage, dysfunction of the hippocampus could cause memory impairment, a well known early
neuropsychological sign of Alzheimer’s disease.37 In our study, we used hippocampal and
amygdalar atrophy on MRI in elderly subjects who were clinically free of dementia as mark-
ers of pre-clinical Alzheimer’s disease. Several studies including our own20 show that peo-
ple with hippocampal atrophy on MRI have lower verbal memory performance.38 Moreover,
besides memory impairment, people with hippocampal atrophy on MRI frequently develop
other symptoms of Alzheimer’s disease later in life.11, 12 To our knowledge, no study has pro-
spectively examined the specific role of amygdalar atrophy in Alzheimer’s disease. However,
patients with very mild Alzheimer’s disease have equal volume losses in the hippocampus
and amygdala on MRI compared to control subjects.13, 14 suggesting that atrophy of both hip-
pocampal and amygdalar are early MRI markers of incipient Alzheimer’s disease.
Three biological explanations support an association between diabetes mellitus and hip-
pocampal and amygdalar atrophy on MRI. First, diabetes mellitus leads to vasculopathy and
changes in lipid metabolism, which in turn could be associated to hippocampal and amygdalar
atrophy. Although we found a clear association between diabetes mellitus and carotid athero-
sclerosis, the relation between diabetes and cerebrovascular disease, as noted by the degree
of white matter lesions and brain infarcts on MRI, was not very strong. Moreover, when we
accounted for vascular disease the relation between diabetes mellitus and atrophy on MRI re-
mained the same. This is in line with a recent study in people free of cerebrovascular disease
that showed impaired glucose tolerance to relate to hippocampal atrophy on MRI.39 Thus, al-
though diabetes mellitus is a vascular risk factor, other non- vascular pathways seem to play a
role in the findings. A second biological explanation is that hyperglycaemia in diabetic patients
is directly associated to hippocampal and amygdalar atrophy. A prospective study found that
subjects with diabetes mellitus have increased amyloid plaques and neurofibrillary tangles

Diabetes mellitus and medial temporal lobe atrophy
109
in the hippocampus at autopsy,4 though another post-mortem study did not.40 In diabetic
subjects, accelerated formation of advanced glycation endproducts can cross-link amyloid
proteins leading to aggregation into the amyloid plaques.6, 41 In addition, glycation of the mi-
crotubule associated protein-tau could lead to formation of neurofibrillary tangles.42 Pointing
to a third biological explanation was the finding that peripheral insulin resistance was associ-
ated to amygdalar atrophy on MRI. Insulin resistance is characterised by high plasma insulin
concentrations and relatively normal glucose concentrations. Patients with Alzheimer’s dis-
ease have higher plasma insulin concentrations compared with control subjects43, 44 but lower
cerebrospinal-fluid insulin concentrations.44 This suggests that insulin transport from plasma
to the brain is diminished in Alzheimer patients.44 Other investigations report that dysfunction
of insulin signal transduction is involved in Alzheimer’s disease.7, 45 Genetic variability in genes
encoding for components of the insulin-signalling pathway is associated to Alzheimer’s dis-
ease.46 Insulin regulates metabolism of amyloid proteins, prevents tau phosphorylation7 and
promotes neuronal survival,47 all actions that in case of dysfunction of the insulin pathway can
lead to Alzheimer’s disease. Furthermore, the insulin-degrading enzyme is, in addition to its
role in degrading insulin, important in cleaving amyloid protein in the brain.48 Mice with hypo-
function of this enzyme have increased accumulation of amyloid in the brain and increased
plasma insulin concentrations, further supporting a connection between insulin and Alzhei-
mer’s disease.49 It is postulated that patients with Alzheimer’s disease try to compensate for
impaired insulin signalling by increasing the amount of insulin receptors.50 Interestingly, we
found a restricted relation between insulin resistance and amygdalar atrophy on MRI. Higher
plasma insulin concentrations or insulin resistance were not related to hippocampal atrophy
on MRI, in agreement with others.39 The hippocampus and amygdalar differ according to the
amount of insulin receptors, the hippocampus having a higher density.51 A speculative expla-
nation for the absence of a relation between insulin concentrations and hippocampal volumes
is that the high density of insulin receptors in combination with high plasma insulin concentra-
tions compensates for dysfunctions in the insulin-signalling pathway. However, the differential
effects of insulin on the hippocampus and amygdala have yet to be confirmed.
In summary, in this community sample we found that people with type 2 diabetes have
smaller hippocampal and amygdalar volumes on MRI, supporting the view that diabetes is a
risk factor for Alzheimer’s disease. Since atherosclerosis or cerebrovascular disease were not
explaining the associations, it is likely that direct metabolic effects of diabetes mellitus are
involved. Our finding that insulin resistance was associated to amygdalar atrophy on MRI is
in line with suggestions that dysfunction of insulin signalling is involved in the pathogenesis
of Alzheimer’s disease.

Chapter 3.3
110
References
1. Goldstein LB, Adams R, Becker K, et al. Primary prevention of ischemic stroke: A statement
for healthcare professionals from the Stroke Council of the American Heart Association. Circu-
lation 2001; 103:163-82.
2. Hébert R, Lindsay J, Verreault R, Rockwood K, Hill G, Dubois MF. Vascular dementia : incidence
and risk factors in the Canadian study of health and aging. Stroke 2000; 31:1487-93.
3. Ott A, Stolk RP, van Harskamp F, Pols HAP, Hofman A, Breteler MMB. Diabetes mellitus and the
risk of dementia: The Rotterdam Study. Neurology 1999; 53:1937-42.
4. Peila R, Rodriguez BL, Launer LJ. Type 2 diabetes, APOE gene, and the risk for dementia and
related pathologies: The Honolulu-Asia Aging Study. Diabetes 2002; 51:1256-62.
5. Snowdon DA, Greiner LH, Mortimer JA, Riley KP, Greiner PA, Markesbery WR. Brain infarction
and the clinical expression of Alzheimer disease. The Nun Study. JAMA 1997; 277:813-7.
6. Vitek MP, Bhattacharya K, Glendening JM, et al. Advanced glycation end products contribute to
amyloidosis in Alzheimer disease. Proc Natl Acad Sci U S A 1994; 91:4766-70.
7. Gasparini L, Netzer WJ, Greengard P, Xu H. Does insulin dysfunction play a role in Alzheimer’s
disease? Trends Pharmacol Sci 2002; 23:288-93.
8. Braak H, Braak E. Neuropathological stageing of Alzheimer-related changes. Acta Neuropathol
1991; 82:239-59.
9. Gosche KM, Mortimer JA, Smith CD, Markesbery WR, Snowdon DA. Hippocampal volume as
an index of Alzheimer neuropathology: findings from the Nun Study. Neurology 2002; 58:1476-
82.
10. Convit A, De Leon MJ, Tarshish C, et al. Specific hippocampal volume reductions in individuals
at risk for Alzheimer’s disease. Neurobiol Aging 1997; 18:131-8.
11. Jack CR, Jr., Petersen RC, Xu YC, et al. Prediction of AD with MRI-based hippocampal volume in
mild cognitive impairment. Neurology 1999; 52:1397-403.
12. Schott JM, Fox NC, Frost C, et al. Assessing the onset of structural change in familial Alzheim-
er’s disease. Annals of Neurology 2003; 53:181-188.
13. Callen DJ, Black SE, Gao F, Caldwell CB, Szalai JP. Beyond the hippocampus: MRI volumetry
confirms widespread limbic atrophy in AD. Neurology 2001; 57:1669-74.
14. Krasuski JS, Alexander GE, Horwitz B, et al. Volumes of medial temporal lobe structures in
patients with Alzheimer’s disease and mild cognitive impairment (and in healthy controls). Biol
Psychiatry 1998; 43:60-8.
15. Hofman A, Grobbee DE, de Jong PTVM, van den Ouweland FA. Determinants of disease and
disability in the elderly: the Rotterdam Elderly Study. Eur J Epidemiol 1991; 7:403-22.
16. Breteler MMB. Vascular involvement in cognitive decline and dementia. Epidemiologic evi-

Diabetes mellitus and medial temporal lobe atrophy
111
dence from the Rotterdam Study and the Rotterdam Scan Study. Ann N Y Acad Sci 2000;
903:457-65.
17. Ott A, Stolk RP, Hofman A, van Harskamp F, Grobbee DE, Breteler MMB. Association of diabe-
tes mellitus and dementia: the Rotterdam Study. Diabetologia 1996; 39:1392-7.
18. de Leeuw FE, de Groot JC, Oudkerk M, et al. A follow-up study of blood pressure and cerebral
white matter lesions. Ann Neurol 1999; 46:827-33.
19. de Groot JC, de Leeuw FE, Oudkerk M, et al. Cerebral white matter lesions and cognitive func-
tion: the Rotterdam Scan Study. Ann Neurol 2000; 47:145-51.
20. Hackert VH, den Heijer T, Oudkerk M, Koudstaal PJ, Hofman A, Breteler MMB. Hippocam-
pal head size associated with verbal memory performance in nondemented elderly. Neuroim-
age 2002; 17:1365-72.
21. Maunoury C, Michot JL, Caillet H, et al. Specificity of temporal amygdala atrophy in Alzheimer’s
disease: quantitative assessment with magnetic resonance imaging. Dementia 1996; 7:10-14.
22. UNESCO. International Standard Classification of Education (ISCED). Document 19C/3. Paris,
1976.
23. Vermeer SE, den Heijer T, Koudstaal PJ, Oudkerk M, Hofman A, Breteler MMB. Incidence and
risk factors of silent brain infarcts in the population-based Rotterdam Scan Study. Stroke 2003;
34:392-6.
24. Slooter AJC, Cruts M, Kalmijn S, et al. Risk estimates of dementia by apolipoprotein E geno-
types from a population-based incidence study: the Rotterdam Study. Arch Neurol 1998; 55:964-
8.
25. Farrer LA, Cupples LA, Haines JL, et al. Effects of age, sex, and ethnicity on the association be-
tween apolipoprotein E genotype and Alzheimer disease. A meta-analysis. APOE and Alzhei-
mer Disease Meta Analysis Consortium. JAMA 1997; 278:1349-56.
26. Bots ML, Hoes AW, Koudstaal PJ, Hofman A, Grobbee DE. Common carotid intima-media
thickness and risk of stroke and myocardial infarction: the Rotterdam Study. Circulation 1997;
96:1432-7.
27. Mooy JM, Grootenhuis PA, de Vries H, et al. Prevalence and determinants of glucose intoler-
ance in a Dutch caucasian population. The Hoorn Study. Diabetes Care 1995; 18:1270-3.
28. Laakso M. How good a marker is insulin level for insulin resistance? Am J Epidemiol 1993;
137:959-65.
29. Leibson CL, Rocca WA, Hanson VA, et al. The risk of dementia among persons with diabetes
mellitus: a population-based cohort study. Ann N Y Acad Sci 1997; 826:422-7.
30. Brayne C, Gill C, Huppert FA, et al. Vascular risks and incident dementia: results from a cohort
study of the very old. Dement Geriatr Cogn Disord 1998; 9:175-80.
31. Yoshitake T, Kiyohara Y, Kato I, et al. Incidence and risk factors of vascular dementia and Alzhei-

Chapter 3.3
112
mer’s disease in a defined elderly Japanese population: the Hisayama Study. Neurology 1995;
45:1161-8.
32. Luchsinger JA, Tang MX, Stern Y, Shea S, Mayeux R. Diabetes mellitus and risk of Alzheimer’s
disease and dementia with stroke in a multiethnic cohort. Am J Epidemiol 2001; 154:635-41.
33. MacKnight C, Rockwood K, Awalt E, McDowell I. Diabetes mellitus and the risk of dementia,
Alzheimer’s disease and vascular cognitive impairment in the Canadian Study of Health and
Aging. Dement Geriatr Cogn Disord 2002; 14:77-83.
34. Curb JD, Rodriguez BL, Abbott RD, et al. Longitudinal association of vascular and Alzheimer’s
dementias, diabetes, and glucose tolerance. Neurology 1999; 52:971-5.
35. Tariot PN, Ogden MA, Cox C, Williams TF. Diabetes and dementia in long-term care. J Am Geri-
atr Soc 1999; 47:423-9.
36. Bobinski M, de Leon MJ, Wegiel J, et al. The histological validation of post mortem magnetic
resonance imaging- determined hippocampal volume in Alzheimer’s disease. Neuroscience
2000; 95:721-5.
37. Petersen RC, Smith GE, Ivnik RJ, Kokmen E, Tangalos EG. Memory function in very early Alzhei-
mer’s disease. Neurology 1994; 44:867-72.
38. Petersen RC, Jack CR, Jr., Xu YC, et al. Memory and MRI-based hippocampal volumes in aging
and AD. Neurology 2000; 54:581-7.
39. Convit A, Wolf OT, Tarshish C, De Leon MJ. Reduced glucose tolerance is associated with poor
memory performance and hippocampal atrophy among normal elderly. Proc Natl Acad Sci
U S A 2003; 100:2019-2022.
40. Heitner J, Dickson D. Diabetics do not have increased Alzheimer-type pathology compared with
age-matched control subjects. A retrospective postmortem immunocytochemical and histoflu-
orescent study. Neurology 1997; 49:1306-11.
41. Münch G, Schinzel R, Loske C, et al. Alzheimer’s disease - synergistic effects of glucose deficit,
oxidative stress and advanced glycation endproducts. J Neural Transm 1998; 105:439-61.
42. Ledesma MD, Bonay P, Colaco C, Avila J. Analysis of microtubule-associated protein tau glyca-
tion in paired helical filaments. J Biol Chem 1994; 269:21614-9.
43. Kuusisto J, Koivisto K, Mykkänen L, et al. Association between features of the insulin resis-
tance syndrome and Alzheimer’s disease independently of apolipoprotein ε4 phenotype: cross
sectional population based study. BMJ 1997; 315:1045-9.
44. Craft S, Peskind E, Schwartz MW, Schellenberg GD, Raskind M, Porte D, Jr. Cerebrospinal fluid
and plasma insulin levels in Alzheimer’s disease: relationship to severity of dementia and apoli-
poprotein E genotype. Neurology 1998; 50:164-8.
45. Frölich L, Blum-Degen D, Bernstein HG, et al. Brain insulin and insulin receptors in aging and
sporadic Alzheimer’s disease. J Neural Transm 1998; 105:423-38.
46. Liolitsa D, Powell J, Lovestone S. Genetic variability in the insulin signalling pathway may con-

Diabetes mellitus and medial temporal lobe atrophy
113
tribute to the risk of late onset Alzheimer’s disease. J Neurol Neurosurg Psychiatry 2002;
73:261-6.
47. Zhao WQ, Alkon DL. Role of insulin and insulin receptor in learning and memory. Mol Cell En-
docrinol 2001; 177:125-34.
48. Kurochkin IV. Insulin-degrading enzyme: embarking on amyloid destruction. Trends Biochem Sci
2001; 26:421-5.
49. Farris W, Mansourian S, Chang Y, et al. Insulin-degrading enzyme regulates the levels of insulin,
amyloid ß-protein, and the ß-amyloid precursor protein intracellular domain in vivo. Proc Natl
Acad Sci U S A 2003; 100:4162-7.
50. Frölich L, Blum-Degen D, Riederer P, Hoyer S. A disturbance in the neuronal insulin receptor
signal transduction in sporadic Alzheimer’s disease. Ann N Y Acad Sci 1999; 893:290-3.
51. Schulingkamp RJ, Pagano TC, Hung D, Raffa RB. Insulin receptors and insulin action in the
brain: review and clinical implications. Neurosci Biobehav Rev 2000; 24:855-72.


Chapter 4
Clinical correlates of brain atrophy on MRI


117
Chapter 4.1
Hippocampal atrophy and memory performance
The hippocampus plays a crucial role in the consolidation of memory. Anatomically, the hip-
pocampal head, body, and tail are connected to separate regions of the entorhinal cortex,
which conveys processed information from the association cortices to the hippocampus. Lit-
tle is known, however, about the functional segregation along its longitudinal axis. In the
present study, we investigated whether the hippocampal head, body, or tail is selectively
involved in verbal memory performance. A total of 511 nondemented participants, aged 60-
90 years, underwent a three-dimensional HASTE brain scan in a 1.5-T MRI unit. Hippocampal
volumes were measured by manual tracing on coronal slices. Segmentation was performed
in anterior-posterior direction on the basis of predefined cut-offs allocating 35, 45, and 20%
of slices to the head, body, and tail, respectively. Memory performance was assessed by a
15-word learning test including tasks of immediate and delayed recall. To analyze the associa-
tion between head, body, and tail volumes and memory performance, we used multiple linear
regression, adjusting for age, sex, education, and midsagittal area as a proxy for intracranial
volume. Participants with larger hippocampal heads scored significantly higher in the memory
test, most notably in delayed recall [0.41 words per SD increase in left hippocampal head
(95% CI 0.16, 0.67), 0.33 words per SD increase in right hippocampal head (95% CI 0.06,
0.59)]. Our data suggest selective involvement of the hippocampal head in verbal memory,
and add to recent findings of functional segregation along the longitudinal axis of the hip-
pocampus.

Chapter 4.1
118
Introduction
The hippocampus is generally assumed to play a key role in the consolidation of memory,
i.e. the integration of relevant new information and its transfer from short-term to long-term
memory.1 A host of magnetic resonance imaging (MRI) studies have found positive asso-
ciations between total hippocampal volume and memory performance.2-5 Anatomically, the
hippocampus can be divided into three distinct segments: (a) an anterior part, or head, (b)
an intermediate part, or body, and (c) a posterior part, or tail.6 These subdivisions are recipro-
cally connected to separate regions of the entorhinal cortex.7 In addition, a number of studies
suggest that the hippocampal head, body, and tail may have different functions. Presentation
of novel information, for instance, was associated with activity in the left anterior hippocam-
pus during functional MRI (fMRI),8 while a positron emission tomography (PET) study found
memory impairment in amnesiacs and in Alzheimer patients to be associated with decreased
glucose metabolism in the hippocampal head.9 A recent small volumetric MRI study demon-
strated that impaired verbal memory in first-degree relatives of schizophrenic patients was
associated with lower volumes in the anterior part of the hippocampus.10 The goal of our study
was to investigate, in a large sample of nondemented elderly participants, whether MRI vol-
umes of hippocampal head, body, and tail are differentially associated with verbal memory
performance.
Methods
Participants
The Rotterdam Study is a large population-based cohort study in the Netherlands that started
in 1990 and investigates the prevalence, incidence and determinants of various chronic dis-
eases among elderly participants.11 From 1995 to 1996, we randomly selected 965 living mem-
bers (aged 60-90 years) of this cohort in strata of sex and age (5 years) for participation in the
Rotterdam Scan Study.12 After exclusion of individuals who were demented, blind, or had MRI
contraindications, the number of eligible participants was 832. Subjects with dementia were
excluded based on a stepwise approach as used in the Rotterdam Study.13 Subjects were
screened using the Mini-Mental State Examination (MMSE)14 and the Geriatric Mental State
Schedule (GMS). Those scoring below 26 on the MMSE or more than 0 on the GMS were
additionally assessed by means of the CAMDEX interview.15 Subjects suspected of dementia
based on the CAMDEX were examined by a neurologist. Finally, an expert panel reviewing all
relevant information decided whether an individual was to be considered demented or not,
based on the criteria of the DSM-IIIR. Among the 832 eligible, 563 participants gave their
written informed consent to participate in the present study (response rate: 68%), which

Hippocampal atrophy and memory
119
included undergoing a MRI brain scan. The study
was approved by the medical ethics committee
of the Erasmus Medical Center, Rotterdam, the
Netherlands.
Magnetic resonance imaging acquisition
Brain scans were performed using a 1.5-Tesla
MRI System (VISION MR, Siemens AG, Erlan-
gen, Germany). The protocol included, in the
following order, a) a sequence of proton-density
images b) a sequence of T2-weighted images c)
a sequence of T1-weighted images.16 Finally, for
volumetric measurements of the hippocampus,
a custom-made, inversion recovery - double con-
trast 3D half-Fourier acquisition single-shot turbo
spin echo (HASTE) sequence was included (inver-
sion time 440 ms, [TR] 2800 ms, 128 contiguous
sagittal slices of 1.2-mm, matrix 192x256, field
of view 256x256). Two HASTE modules were
sequentially acquired after the inversion pulse
(effective TEs of 29 ms and 440 ms), the first of
that was used for the volume measurements.
Fifty-two participants developed claustrophobia
during MRI acquisition. Thus, complete MRI data
were available from a total of 511 participants.
Hippocampal volume measurement
For each participant, we reconstructed a se-
ries of coronal brain slices (contiguous 1.5 mm
slices) based on the 3D HASTE sequence,
aligned to be perpendicular to the long axis of
the hippocampus. All reconstructed slices were
transferred to a Siemens Magic View 1000 work-
station for volumetric assessment of the left and
right hippocampus.
Figure 1. Hippocampal head (H), body (B) and tail (T) manually outlined on coronal images

Chapter 4.1
120
Referencing to an anatomical atlas,6 we manually traced the boundaries of both hippocampi
on each slice by means of a mouse-driven pointer (Figure 1). We proceeded from posterior
to anterior, starting on the slice where the crux of the fornices was in full profile. Segmenta-
tion of the hippocampal head from the overlying amygdala was facilitated by identifying the
alveus, which demarcated the undulating superior surface of the hippocampal head. The intra-
plane hippocampal boundaries were defined to include the CA1 through CA4 sectors of the
hippocampus proper, the dentate gyrus, and the subiculum. The number of slices measured
ranged from 16 to 31 (left hippocampus, median = 25) and from 18 to 31 (right hippocampus,
median = 25) per individual. Entering the outlined surface areas (in mm2) into a spreadsheet
program (Microsoft Excel 97), we multiplied the summed surface areas on each side with
slice thickness to yield estimates of the left and right hippocampal volume (ml). We also re-
constructed a midsagittal slice (thickness 3.0 mm). The midsagittal area, which we used as
a proxy for intracranial volume, was measured by tracing the inner table of the skull. The 511
scans were randomly split between two raters who were blinded to any participant-related
clinical information. Studies performed on 14 random scans to evaluate intra- and interrater
correlation showed good overall agreement. Intrarater intraclass correlation coefficients were
r = 0.93 for the left and r = 0.90 for the right hippocampus, whereas interrater intraclass cor-
relation coefficients were r = 0.87 and r = 0.83, respectively. For the midsagittal area, intra-
and interrater intraclass correlation coefficients were 0.995 and 0.96, respectively. To obtain
separate volumes for the hippocampal head, body, and tail, we subdivided the hippocampus
into three segments, such that the anterior 35% of coronal slices (or any rounded integer of
slices closest to this cut-off) included the head with the hippocampal digitations, while the
intermediate 45% represented the body of the hippocampus, and the remaining 20% the tail
(Figure 2). These cut-offs were based on photographs of histological preparations.6 Grouping
hippocampi by length (i.e. by number of slices), and plotting graphs of mean cross-sectional
volumes over the anterior-posterior extent of the hippocampus, we confirmed that the 35%
cut-off was a stable proxy for the boundary between head and body over the whole range of
hippocampal lengths, as it invariably fell into, or near, the region of steepest slope correspond-
ing to the anterior bend of the hippocampus. The cut-off between body and tail coincided well
with the region where cross-sectional hippocampal volumes reached a minimum.
Measurement of memory function
Memory was assessed by means of a 15-word learning test, which is used to evaluate the
ability to acquire and retain new verbal learning information based on Rey’s auditive recall of
words.17 To test immediate recall, participants were presented three times with a sequence
of 15 words and subsequently asked to recall as many of these words as possible. Free de-
layed recall was tested 15 minutes later. Outcome variables were the mean of the number of

Hippocampal atrophy and memory
121
words recalled over the first three trials (as a summary score for immediate recall), and the
number of words remembered after the 15-minute delay (as a score for free delayed recall).
Immediate and delayed recall scores were normally distributed. The frequency of the highest
and lowest scores (i.e., 0 and 15) was less than 3%. Therefore, no ceiling or floor effects were
observed. As a measure of global cognitive function we used the MMSE.14
Figure 2. A. Sketch of right hippocampus as seen from above. Hippocampal head, body, and tail (dashed
lines represent 35% and 20% cut-offs for the boundaries between head and body, and body and tail,
respectively) are depicted.
B. Mean coronal volumes plotted over the anterior-posterior extent of the hippocampus (graph is based
on hippocampi with a longitudinal extent of 25 slices.
����
����
����
��� ��� ����������� ���������
����
����
����
����
����
����
����
����
����
� � � � � � � � � � �� �� �� �� �� �� �� �� �� �� �� �� �� �� �� ��
������������
��
���
���
���
�
�

Chapter 4.1
122
Other measurements
Level of education according to UNESCO was obtained.18 The presence of depressive
symptoms was determined by the Center of Epidemiologic Studies on Depression (CES-D)
scale.19
Data analysis
To assess the association between hippocampal head, body and tail volumes and memory,
we first constructed simple x,y scatter plots. As the scatter plots suggested approximately
linear associations we decided to use multivariable linear regression for our analyses. We
included all factors that were significantly correlated with hippocampal volumes (age, sex,
education, midsagittal area) in our model. Thus, our model was represented by the following
equation: memory performance = B0 + B1 X age + B2 X sex+ B3 X education+ B4 X mid-
sagittal area + B5 X hippocampal head volume (SD) + B6 X hippocampal body volume (SD) +
B7 X hippocampal tail volume (SD). The regression coefficients of the hippocampal volumes
(B5-B7) reflect the average difference in number of words recalled between individuals for
a given volume difference of 1 SD. Appropriate checks revealed no indication of nonlinearity.
To confirm regional patterns of association and to check whether the association between
the volumes of head, body and tail and performance in the 15-word learning test was inde-
pendent of our chosen cut-off points, we performed additional slice-by-slice analyses. For
this purpose, we transformed the number of slices to a standard of 20 for all hippocampi by
means of linear interpolation. Thus, slice volumes were calculated for 5% intervals, given a
relative length of 100% for all hippocampi. Each of the 20 slices was individually assessed for
its potential association with memory performance, adjusting for age, sex, level of education,
midsagittal area, and the volume of the remaining 19 slice locations combined.

Hippocampal atrophy and memory
123
Results
Relevant characteristics of all 511 participants are summarized in Table 1.
Table 1. Characteristics of the study sample (n=511)
Age, years 73 ± 8
Sex, % women 49
Highest education, %
Primary 31
Intermediate/Higher 60
College/University 9
Depressive symptoms (CES-D), range 0-31 5.6 ± 6.1
15-Word Learning Test
Immediate Recall, mean over three trials 6.57 ± 1.81
Delayed Recall 5.78 ± 2.63
MMSE score 27.7 ± 2.1
Midsagittal area, cm2 149.1 ± 11.1
Total hippocampus, ml
Left 3.15 ± 0.46
Right 3.22 ± 0.44
Hippocampal head, ml
Left 1.46 ± 0.22
Right 1.52 ± 0.24
Hippocampal body, ml
Left 1.18 ± 0.23
Right 1.19 ± 0.21
Hippocampal tail, ml
Left 0.51 ± 0.12
Right 0.52 ± 0.11
Values are unadjusted means ± standard deviation or percentages

Chapter 4.1
124
Volumes of the left and right hippocampus were highly correlated with each other (r = 0.88;
P < 0.001). Volumes of hippocampal head, body and tail were positively and moderately cor-
related with each other (correlation between head and body r = 0.45 (left) and r = 0.48 (right),
between head and tail r = 0.30 (left) and r = 0.21 (right), and between body and tail r = 0.57
(left) and r = 0.63 (right)). The number of immediate words recalled decreased 0.08 per year
and of delayed recall words 0.11 per year.
Table 2 shows the association between hippocampal head, body and tail volumes and vari-
ables that may confound the association with memory performance. Age, sex, education
and midsagittal area were significantly associated with subdivisional volumes. Slice-by-slice
analysis revealed that the association between age and hippocampal volume was strongest
in the region between 20% and 35%, corresponding to the posterior part of the hippocampal
head.
Table 2. Association between several variables and hippocampal head, body and tail
Head (ml) Body (ml) Tail (ml)
Left Right Left Right Left Right
Age
(per 10 years)
-0.07
(<0.001)
-0.08
(<0.001)
-0.05
(<0.001)
-0.06
(<0.001)
-0.03
(<0.001)
-0.03
(<0.001)
Sex* -0.07
(0.002)
-0.07
(0.001)
-0.00
(0.85)
0.00
(0.90)
0.03
(0.007)
0.03
(0.002)
Education (range 0-7) 0.01
(0.02)
0.02
(0.008)
0.00
(0.44)
0.00
(0.10)
-0.00
(0.37)
0.00
(0.34)
Depressive symptoms
(per 10)†
-0.02
(0.14)
-0.03
(0.14)
0.01
(0.50)
0.00
(0.96)
0.00
(0.99)
-0.00
(0.66)
Midsagittal area
(per 10 cm2)
0.06
(<0.001)
0.08
(<0.001)
0.04
(<0.001)
0.04
(<0.001)
0.01
(0.15)
0.01
(0.03)
Values given are regression coefficients (P-values in parentheses)
*Regression coefficient adjusted for midsagittal area. Minus sign denotes that volume is smaller in wo-
men. Positive sign denotes that volume is smaller in men
†Score on the CES-D, range 0-31

Hippocampal atrophy and memory
125
Total hippocampus and memory
Table 3 summarizes the results of our multivariable linear regression analysis which demon-
strated a strong positive and highly significant association between total hippocampal vol-
umes and performance in the 15-word learning test, in both immediate recall and delayed
recall.
Table 3. Association between total hippocampal volume and number of words recalled
Immediate recall Delayed recall
Difference per SD (95% CI) P Difference per SD (95% CI) P
Left hippocampus 0.21 (0.05, 0.36) 0.008 0.41 (0.19, 0.64) <0.001
Right hippocampus 0.22 (0.06, 0.38) 0.006 0.47 (0.23, 0.70) <0.001
Values are adjusted difference in number of words recalled per standard deviation of hippocampal vol-
ume, with 95% confidence intervals (CI), and P-values. Adjusted for age, sex, education, and midsagittal
area.
Table 4. Association between volume of hippocampal head (cut-off 35%), body (45%), and tail (20%) and
number of words recalled
Immediate recall Delayed recall
Difference per SD (95% CI) P Difference per SD (95% CI) P
Left Hippocampus
Head 0.26 (0.09, 0.44) 0.003 0.41 (0.16, 0.67) 0.002
Body -0.08 (-0.29, 0.14) 0.49 -0.03 (-0.35, 0.28) 0.83
Tail 0.11 (-0.08, 0.31) 0.26 0.19 (-0.09, 0.48) 0.19
Difference per SD (95% CI) P Difference per SD (95% CI) P
Right Hippocampus
Head 0.19 (0.01, 0.37) 0.035 0.33 (0.06, 0.59) 0.015
Body 0.01 (-0.22, 0.20) 0.94 0.06 (-0.25, 0.36) 0.71
Tail 0.12 (-0.07, 0.31) 0.22 0.24 (-0.04, 0.51) 0.10
Values are adjusted estimates of the change in number of words recalled per increase in standard de-
viation of volume, with 95% confidence intervals (CI), and P-values. Adjusted for age, sex, education
midsagittal area.

Chapter 4.1
126
Hippocampal head, body, and tail and memory
Table 4 shows the association between volume of the hippocampal head, body, and tail and
test performance. Individuals with larger hippocampal heads performed significantly better in
the 15-word learning test, most notably in delayed recall. Estimates for the left hippocampal
head tended to be slightly higher than estimates for the right hippocampal head. No significant
associations were observed for the hippocampal body or hippocampal tail. The hippocampal
head was the only region associated to the MMSE score [per SD 0.27 (95% CI 0.05-0.48) for
the left hippocampal head; per SD 0.23 (95% CI 0.02-0.45) for the right hippocampal head].
Hippocampal body and tail were not associated to MMSE score. Slice-by-slice analyses of
delayed recall performance revealed significant associations only for the most anterior part of
the hippocampus (i.e., the first three slices of the left and right hippocampus), the region cor-
responding to the anterior half of the hippocampal head (Figure 3). No significant associations
were observed at any other slice location.
Figure 3. Association between left (top) and right (bottom) regional hippocampal volumes and number of
words recalled in the delayed recall test (x-axis: location percentiles along the longitudinal axis of the hip-
pocampus, y-axis: difference in the number of words recalled per standard deviation of hippocampal slice
volume; * significant at the P=0.05 level). Adjusted for age, sex, educational level and midsagittal area
����������������������������������������������������
����
����
����
����
�
���
���
���
���
� �� �� �� �� �� �� �� �� �� �� �� �� �� �� �� �� �� �� ���
������������������
���������������������������������������������������
����
����
����
�
���
���
���
���
� �� �� �� �� �� �� �� �� �� �� �� �� �� �� �� �� �� �� ���
������������������
��
����
����
����
����
���
�����
�����
����
��
��
����
����
����
����
���
�����
�����
����
��
���
�
� �
Hippocampal atrophy and memory
127
Discussion
We found that a larger volume of the hippocampal head, rather than the hippocampal body
or tail, was significantly associated with better verbal memory performance, in tasks of both
immediate and delayed recall.
Our large number of participants and the regional approach are obvious strengths of our
study. Nevertheless, some methodological issues remain to be addressed. First, no precise
definitions for the boundaries between hippocampal head, body and tail on MRI exist, and
hence the cut-offs we chose are somewhat arbitrary. However, our slice-by-slice analysis sug-
gested that the associations did not depend on the choice of cut-offs. Second, the method
we used to define the hippocampal subdivisions was implicitly based on the assumption that
all individual hippocampi, irrespective of their shape or length, share the same proportions
regarding the longitudinal extent of the hippocampal head, body, and tail (i.e., 35%, 45%, and
20%, respectively). Although this assumption was mostly met, our subdivisions in volume
were likely to be affected by some degree of random misclassification, leading to a weaken-
ing of the associations we found.
The observation that larger hippocampal volume is associated with better verbal memory is
in keeping with numerous MRI studies,2-5 even though surprisingly some studies found an
inverse association.20, 21 More specifically, our study showed that hippocampal involvement in
verbal memory performance may be limited to the head region. Few MRI studies investigated
subdivisions of the hippocampus in relation to function. A study in taxi drivers showed the
posterior hippocampus to be associated with spatial memory.22 Another study in psychopaths
showed the posterior hippocampus to be associated with the degree of psychopathology.23
A volumetric MRI study assessed the role of longitudinal subdivisions of the hippocampus
in verbal memory in first-degree relatives of schizophrenic patients.10 This study found that
amygdalar and anterior hippocampal volumes were significantly associated with delayed ver-
bal recall, whereas no such association was shown for the posterior hippocampus. Most
PET studies discussed in a review of medial temporal lobe (MTL) activation in fMRI and PET
studies of episodic encoding and retrieval reported anterior medial temporal lobe activation,
while the fMRI studies reviewed found activation mainly in the posterior part of the MTL.24
A recent fMRI study observed activation of the left anterior hippocampus in participants pre-
sented with novel verbal stimuli, suggesting that the anterior hippocampus plays a crucial role
in novelty encoding.8 No activation was observed in the posterior hippocampal region. A PET
study measuring glucose metabolism in amnesic patients and in patients with Alzheimer’s
disease revealed that both groups had a significantly decreased glucose metabolism in the
hippocampal head in comparison to controls.9 Again, no association was observed for the
hippocampal tail or body.

Chapter 4.1
128
Memory is acquired through the processing of incoming information by the association cor-
tices which, by way of the parahippocampal and perirhinal cortex, send their output to the
entorhinal cortex. Cells in the entorhinal cortex supply most of the fibers that enter the hip-
pocampal formation through the perforant pathway, while most efferent connections from
the hippocampus project back to the entorhinal cortex.25 A recent study has shown that the
perforant pathway is characterized by a topographical organization along the longitudinal axis
of the hippocampal formation, such that a medial-to-lateral gradient in the entorhinal cortex
corresponds to an anterior-posterior gradient in the hippocampal formation.7 This special archi-
tecture may be the underlying substrate for the functional segregation between hippocampal
head, body, and tail that we and others have found.
The effect of hippocampal volume on number of words recalled may seem small and not clini-
cally relevant. However, it is important to realize that these are not differences on an individual
level, but average differences across groups of nondemented persons and adjusted for pos-
sible confounders. The effect size per SD increase in hippocampal volume in words recalled
approximately equaled the effect of a 4-year age increase.
One explanation that would fit our data is that people with better memory have larger hip-
pocampal heads. However, we also found a relation between hippocampal head volume and
the MMSE score, which is a more global cognitive measure. This suggests that individuals
who do not fulfill criteria of dementia but do have slight impairment of verbal memory or
global cognitive function may have selective atrophy of the hippocampal head. Whether they
are destined to develop clinically evident dementia is yet unclear. MRI in early Alzheimer’s
disease showed patients’ hippocampi to be smaller than those of controls, while hippocampal
head size in Alzheimer patients seems to be inversely related to disease severity.26 Prospec-
tive studies suggested that smaller total hippocampal volume may predict dementia.5, 27, 28
Possibly, subdividing the hippocampus into head, body or tail or even smaller subdivisions
may show atrophy in regions specific for imminent Alzheimer’s disease. Prospective follow-up
investigations of the individuals participating in our study will enable us to confirm whether
there is early - and possibly selective - involvement of the hippocampal head region in Alz-
heimer’s disease. If this is the case, hippocampal head volume – in combination with other
variables – may help to refine prediction of dementia and enhance the identification of at-risk
individuals who might benefit from early intervention.
References
1. Markovitch HJ. Neuroanatomy of memory. In: Tulving E, Craik FIM, eds. The Oxford Handbook
of Memory. New York: Oxford University Press, 2000:465-484.
2. Tisserand DJ, Visser PJ, van Boxtel MP, Jolles J. The relation between global and limbic brain

Hippocampal atrophy and memory
129
volumes on MRI and cognitive performance in healthy individuals across the age range. Neuro-
biol Aging 2000; 21:569-76.
3. Laakso MP, Lehtovirta M, Partanen K, Riekkinen PJ, Soininen H. Hippocampus in Alzheimer’s
disease: a 3-year follow-up MRI study. Biol Psychiatry 2000; 47:557-61.
4. Petersen RC, Jack CR, Jr., Xu YC, et al. Memory and MRI-based hippocampal volumes in aging
and AD. Neurology 2000; 54:581-7.
5. Jack CR, Jr., Petersen RC, Xu YC, et al. Prediction of AD with MRI-based hippocampal volume
in mild cognitive impairment. Neurology 1999; 52:1397-403.
6. Duvernoy HM. The human hippocampus: functional anatomy, vascularization and serial sec-
tions with MRI. Berlin: Springer-Verlag, 1998.
7. Witter MP, Wouterlood FG, Naber PA, Van Haeften T. Anatomical organization of the parahip-
pocampal-hippocampal network. Ann N Y Acad Sci 2000; 911:1-24.
8. Strange BA, Fletcher PC, Henson RN, Friston KJ, Dolan RJ. Segregating the functions of human
hippocampus. Proc Natl Acad Sci U S A 1999; 96:4034-9.
9. Ouchi Y, Nobezawa S, Okada H, Yoshikawa E, Futatsubashi M, Kaneko M. Altered glucose me-
tabolism in the hippocampal head in memory impairment. Neurology 1998; 51:136-42.
10. O’Driscoll GA, Florencio PS, Gagnon D, et al. Amygdala-hippocampal volume and verbal mem-
ory in first-degree relatives of schizophrenic patients. Psychiatry Res 2001; 107:75-85.
11. Hofman A, Grobbee DE, de Jong PTVM, van den Ouweland FA. Determinants of disease and
disability in the elderly: the Rotterdam Elderly Study. Eur J Epidemiol 1991; 7:403-22.
12. Breteler MMB. Vascular involvement in cognitive decline and dementia. Epidemiologic evi-
dence from the Rotterdam Study and the Rotterdam Scan Study. Ann N Y Acad Sci 2000;
903:457-65.
13. Ott A, Breteler MMB, van Harskamp F, Stijnen T, Hofman A. Incidence and risk of dementia. The
Rotterdam Study. Am J Epidemiol 1998; 147:574-80.
14. Folstein MF, Folstein SE, McHugh PR. “Mini-mental state”. A practical method for grading the
cognitive state of patients for the clinician. J Psychiatr Res 1975; 12:189-98.
15. Roth M, Huppert FA, Tym E. Camdex, The Cambridge examination for mental disorders of the
elderly. Cambridge: Cambridge University Press, 1988.
16. de Groot JC, de Leeuw FE, Oudkerk M, et al. Cerebral white matter lesions and cognitive func-
tion: the Rotterdam Scan Study. Ann Neurol 2000; 47:145-51.
17. Brand N, Jolles J. Learning and retrieval rate of words presented auditorily and visually. J Gen
Psychol 1985; 112:201-210.
18. UNESCO. International Standard of Classification of Education (ISCED). Document IgC/3. Paris:
UNESCO, 1976.
19. Radloff LS. The CES-D Scale: a self-report depression scale for research in the general popula-
tion. Applied Psychological Measurement 1977; 1:385-401.

Chapter 4.1
130
20. Chantôme M, Perruchet P, Hasboun D, et al. Is there a negative correlation between explicit
memory and hippocampal volume? Neuroimage 1999; 10:589-95.
21. Köhler S, Black SE, Sinden M, et al. Memory impairments associated with hippocampal versus
parahippocampal- gyrus atrophy: an MR volumetry study in Alzheimer’s disease. Neuropsycho-
logia 1998; 36:901-14.
22. Maguire EA, Gadian DG, Johnsrude IS, et al. Navigation-related structural change in the hip-
pocampi of taxi drivers. Proc Natl Acad Sci U S A 2000; 97:4398-403.
23. Laakso MP, Vaurio O, Koivisto E, et al. Psychopathy and the posterior hippocampus. Behav
Brain Res 2001; 118:187-93.
24. Schacter DL, Wagner AD. Medial temporal lobe activations in fMRI and PET studies of episodic
encoding and retrieval. Hippocampus 1999; 9:7-24.
25. Zola SM, Squire LR. The medial temporal lobe and the hippocampus. In: Tulving E, Craik FIM,
eds. The Oxford Handbook of Memory. New York: Oxford University Press, 2000:485-500.
26. Jack CR, Jr., Petersen RC, Xu YC, et al. Medial temporal atrophy on MRI in normal aging and
very mild Alzheimer’s disease. Neurology 1997; 49:786-94.
27. Csernansky JG, Wang L, Joshi S, et al. Early DAT is distinguished from aging by high-dimen-
sional mapping of the hippocampus. Dementia of the Alzheimer type. Neurology 2000; 55:1636-
43.
28. Marquis S, Moore MM, Howieson DB, et al. Independent predictors of cognitive decline in
healthy elderly persons. Arch Neurol 2002; 59:601-6.

131
Chapter 4.2
Hippocampal, amygdalar atrophy and inicident dementia
Background: Patients with Alzheimer’s disease have pronounced atrophy of the hippocam-
pus and amygdala on magnetic resonance imaging (MRI). In persons with mild cognitive im-
pairment, hippocampal atrophy predicts conversion to dementia. Whether atrophy is evident
even before symptom onset is unclear. We studied the longitudinal relation between atrophy
on MRI and incident dementia in a population-based cohort accounting for neuropsychological
performance.
Methods: We obtained volumetric MRI assessments of the hippocampus and amygdala at
baseline in a cohort of 511 elderly free of dementia (age 60-90 years). Each participant was
asked about memory problems in daily life and cognitive performance was assessed. The
cohort was followed for possible development of dementia by in-person screening and moni-
toring of medical records.
Results: During a total of 3043 person-year of follow-up (mean per person 6.0 years), we
detected 35 incident dementia cases (26 with Alzheimer’s disease). Those who developed
Alzheimer’s disease had on average 10% smaller volumes of the hippocampus and amygdala
on MRI. The risk to develop dementia was higher in persons with hippocampal or amygdalar
atrophy (age, sex and education adjusted relative risk per standard deviation decrease 2.99
(95% CI 1.96-4.57) for the hippocampus and 2.06 (95% CI 1.46-2.90) for the amygdala. In per-
sons without memory complaints or cognitive impairment at baseline, the relation between
atrophy on MRI and incident dementia was similar as that in the total population.
Conclusions: Atrophy of the hippocampus and amygdala on MRI predict dementia over a 6-
year follow-up even in cognitively intact elderly.

Chapter 4.2
132
Introduction
Alzheimer’s disease is the most common cause of dementia in late life.1 Strategies to prevent
or delay the disease are under development.2 Once available, it will be important to identify
people at high risk to develop dementia who may benefit from such therapies. Magnetic
resonance imaging (MRI) of the brain provides one potential tool for detecting the preclinical
stages of the disease. Pathologically, Alzheimer’s disease is characterized by dense accumu-
lation of neurofibrillary tangles and amyloid plaques in the medial temporal lobe,3 leading to
neuronal loss that is visible as atrophy on MRI.4 Several studies have shown in patients with
Alzheimer’s disease5-7 pronounced reductions in hippocampal and amygdalar volumes on MRI
compared to healthy elderly. Patients with mild cognitive impairment (MCI), at high risk of de-
veloping Alzheimer’s disease,8 have also smaller hippocampal volumes than healthy elderly.9-15
It is unclear whether in persons destined to develop dementia, atrophy on MRI is observed
even before persons would be designated as having MCI. We focused on this question by
studying the longitudinal relation between volumes of the hippocampus and amygdala on
MRI and incident dementia in a population dwelling in the community. By taking into account
memory complaints and neuropsychological performance at baseline we sought to investi-
gate whether atrophy on MRI predicts dementia even in people without cognitive problems.
We used data from the population-based Rotterdam Scan Study in whom 511 non-demented
elderly had volumetric MRI assessments of the hippocampus and amygdala and whom we
followed for an average period of 6 years.
Methods
Subjects
The Rotterdam Study is a large population-based cohort study in the Netherlands that started
in 1990 and investigates the prevalence, incidence and determinants of chronic diseases
among elderly participants.16 From 1995 to 1996, we randomly selected 965 living members
(aged 60 to 90 years) of this cohort in strata of sex and age (5 years) for participation in the
Rotterdam Scan Study, a study on age-related brain changes on MRI.17 As part of the eligibility
criteria we excluded individuals who were demented,18 blind, or had MRI contraindications.
This left 832 persons eligible for participation. Among these, 563 persons gave their written
informed consent to participate in the present study (response rate: 68%). Complete MRI
data, including a three-dimensional (3D) MRI sequence, was obtained in 511 persons.19 The
study was approved by the medical ethics committee of the Erasmus Medical Center, Rot-
terdam, the Netherlands.

Hippocampal, amygdalar atrophy and dementia
133
MRI assessments
At baseline examinations in 1995 to 1996, a three-dimensional (3D) MRI sequence covering
the whole brain was made using a 1.5 Tesla MRI unit.19 We reformatted coronal slices (1.5-mm
contiguous slices) from this 3D MRI sequence in such a way that they were perpendicular
to the long axis of the hippocampus. The left and the right hippocampus and amygdala were
manually outlined on each slice with a mouse-driven cursor.19 Absolute volumes (ml) were cal-
culated by multiplying the areas on each slice by the slice thickness. We summed the left and
right side to yield total volumes because the analyses did not suggest laterality of effects. As
a proxy for head size, we measured on a reformatted middle sagittal MRI slice the intracranial
cross-sectional area.19 We corrected for head size differences across individuals by dividing
the uncorrected volumes by the subject’s calculated head size and subsequently multiplying
this ratio by the average head size area (men and women separately).7, 20
Ascertainment of incident dementia
All participants were free of dementia at baseline and we followed the cohort for incident de-
mentia.18 Briefly, participants were screened at follow-up visits (1997-1999, 1999-2000, 2002-
2003) with the Mini Mental State Examination (MMSE) and the Geriatric Mental Schedule
and when screen positive assessed with the Cambridge Examination for Mental Disorders
of the Elderly interview.21 Participants suspected of dementia were examined by a neurolo-
gist and underwent extensive neuropsychological testing. The MRI at baseline was not used
in the diagnosis of dementia. In addition to these examinations in-person, we continuously
monitored the medical records of all participants at the general practitioners’ offices and the
Regional Institute for Ambulatory Mental Health Care to obtain information on diagnosed
dementia until January 1, 2003. A diagnosis of dementia and AD was made by a panel of a
neurologist, neuropsychologist and research physician that used standard criteria.22, 23 The on-
set of dementia was defined as the date on which clinical symptoms allowed the diagnosis of
dementia. Duration of follow-up for each participant was calculated from baseline examination
until death, diagnosis of dementia or the end of follow-up whichever came first.
Other measurements
As memory impairment is the first detectable neuropsychological sign of incipient Alzhei-
mer’s disease,24 we questioned persons on memory complaints (by a single question), and
assessed memory performance (by a 15-word verbal learning task).25 For each participant, we
calculated z scores based on the results of the memory test (z score =individual test score
minus mean test score divided by the standard deviation). We constructed a compound score
for memory performance by averaging the z scores of the total of the three immediate recall
trials and the delayed recall trial of the 15-word verbal learning task.25 In accordance with cur-

Chapter 4.2
134
rent criteria, we defined MCI as having a memory score <1.5 standard deviation (SD) of age
and education specific means and memory complaints.26 To further reduce the possibility that
the associations were only present in persons with low memory performance at baseline we
also defined a group with a score of <1 SD below age and education specific means. Additio-
nally we administered tests that assess psychomotor speed25 and used a cut-off of <1 SD be-
low age- and education adjusted means to indicate low performance of psychomotor tasks.
We measured other characteristics on brain MRI that have previously been associated to
dementia.18 White matter lesions were considered present if visible as hyperintense on pro-
ton-density and T2 weighted axial images, without prominent hypointensity on T1 weighted
scans. Periventricular white matter lesions were scored semi-quantitatively from 0-9.25 We
defined infarcts as focal hyperintensities on T2 weighted images. Infarcts in the white matter
also had to have corresponding hypointensities on T1 weighted images in order to distinguish
them from white matter lesions. Subcortical brain atrophy was calculated by averaging the
ventricle-to-brain ratio on T1 weighted images at the frontal horns, the occipital horns and the
caudate nucleus.
Data analysis
With Cox proportional hazards models we calculated the adjusted relative risk of dementia
per SD decrease in volumes on MRI. We made also age- and sex specific tertiles of volumes,
which we denote as severe, moderate and no atrophy. Adjusted volume differences at base-
line between those developing Alzheimer’s disease and those remaining free of dementia
were computed from these Cox models. We plotted this difference against the time after
MRI that the diagnosis of Alzheimer’s disease was made in three equally sized groups of time
after MRI. In the basic model we adjusted for age, sex and level of education. Additional ad-
justments included periventricular white matter lesions, brain infarcts and subcortical atrophy
on MRI.18 Analyses were repeated after excluding persons with memory complaints, with a
MMSE<26, with a low performance on psychomotor tasks (<1 SD below age and education
adjusted means), with a low performance on memory tasks (<1 or <1.5 SD below age and
education adjusted means) or MCI at baseline.

Hippocampal, amygdalar atrophy and dementia
135
Results
Table 1 gives the baseline characteristics of the study sample. Sixteen persons fulfilled criteria
of MCI at baseline (3%), a prevalence in line with other studies.27
Table 1. Baseline characteristics of the study sample
Characteristic n=511
Age, y 73.4 ± 8.0
Sex, % women 49
Primary education, % 31
MMSE, score 27.7 ± 2.1
Memory complaints, % 31
Speed performance
<1 SD*, % 15
Memory performance
<1 SD*, % 17
<1.5 SD*, % 6
MCI†, % 3
Hippocampal volume, ml 6.38 ± 0.88
Amygdala volume, ml 4.57 ± 0.72
Values are mean (± SD) or percentages
*Defined as scoring less than 1 or 1.5 SD below the age and education
adjusted means
†Presence of memory complaints and memory performance <1.5 SD
below the age and education adjusted means in memory tests26
During a total of 3043 person-years of follow-up (mean per person 6.0 years), there were 35
persons who developed dementia of whom 26 received a clinical diagnosis of Alzheimer’s
disease. Persons with severe atrophy of the hippocampus or amygdala had the highest risk
to develop dementia, independent of other brain MRI measures (table 2 and 3). In people
with no hippocampal atrophy, the incidence rate of dementia was 4.8 per 1000 person-years,
whereas in people with severe hippocampal atrophy the incidence rate was 21.6 per 1000
person-years. For the amygdala we found in people with no atrophy an incidence rate of 2.9

Chapter 4.2
136
per 1000 person-years and in people with severe atrophy 19.4 per 1000 person-years.
Table 2. Baseline hippocampal atrophy on MRI and risk of dementia
Relative risk (RR)
Adjusted for age, sex and
education
Adjusted for age, sex, educa-
tion and other MRI measures*
Atrophy severity† Dementia RR 95% CI RR 95% CI
No atrophy (n=169) 5 1.00 Ref 1.00 Ref
Moderate atrophy (n=173) 9 1.81 0.61-5.39 1.87 0.63-5.60
Severe atrophy (n=169) 21 4.53 1.70-12.1 3.89 1.45-10.46
P trend 0.001 0.004
Values are adjusted relative risks (RR) of dementia with 95% confidence interval (CI) compared to no
atrophy and P-value of trend analysis
*The MRI measures adjusted for were severity of periventricular white matter lesions, brain infarcts, and
severity of subcortical atrophy
†Based on age- and sex specific tertiles
Table 3. Baseline amygdalar atrophy on MRI and risk of dementia
Relative risk (RR)
Adjusted for age, sex and
education
Adjusted for age, sex, educa-
tion and other MRI measures*
Atrophy severity† Dementia RR 95% CI RR 95% CI
No atrophy (n=170) 3 1.00 Ref 1.00 Ref
Moderate atrophy (n=171) 13 4.42 1.26-15.54 4.17 1.18-14.72
Severe atrophy (n=170) 19 7.33 2.15-24.96 6.01 1.74-20.77
P trend 0.001 0.003
Values are adjusted relative risks (RR) of dementia with 95% confidence interval (CI) compared to no
atrophy and P-value of trend analysis
*The MRI measures adjusted for were severity of periventricular white matter lesions, brain infarcts, and
severity of subcortical atrophy
†Based on age- and sex specific tertiles

Hippocampal, amygdalar atrophy and dementia
137
In the whole population, we found per SD decrease in hippocampal volume an age, sex and
education adjusted relative risk of 2.99 (95%CI 1.96-4.57) and in amygdalar volume 2.06 (95%
CI 1.46-2.90). This effect was similar after exclusion of persons with memory complaints, a
low MMSE, low performance on psychomotor speed, low memory performance or MCI at
baseline (Figure 1).
Figure 1. Relative risk of dementia with smaller hippocampal and amygdalar volumes on MRI (per SD
decrease with 95% confidence interval). Analyses were done in the whole population and in persons
without memory complaints, without a MMSE<26, without a low performance on psychomotor tasks (<1
SD below age and education adjusted means) without a low memory performance (<1 or 1.5 SD below
age and education adjusted means) and without MCI at baseline. Adjustments were made for age, sex
and education
��� � ��
����������������������������������������
�����������
��������
�������������������������������������������������������
���������������������������������������������������������������
�����������������������������������������
���������������������������������������������������������������
���������������������������������������������
���������������������������������������������������������������
�������������������������������������

Chapter 4.2
138
Figure 2 shows that incident Alzheimer cases had significantly smaller hippocampal and
amygdalar volumes at baseline than persons without incident dementia. Age, sex and educa-
tion adjusted volumes were on average –10.7 % (95% CI –19.3 to –2.1) smaller for the hip-
pocampus and –10.3 % (95% CI –19.9 to –0.8) smaller for the amygdala. Atrophy was also
evident at baseline in people who received a diagnosis of Alzheimer’s disease more than 5
years after the MRI but this was less pronounced.
Figure 2. Volume difference at baseline MRI in hippocampus (left panel) and amygdala (right panel) of per-
sons who developed AD (n=26) at different time points after baseline compared to the volume of people
who were free of dementia and alive. We made tertiles according to time after baseline the diagnosis was
made and plotted the differences (with standard error) at the median time point in these tertiles. Adjust-
ments were made for age, sex and education. *P<0.05
Discussion
In this large cohort study in elderly people dwelling in the community, we found atrophy of
the hippocampus and amygdala on MRI to predict dementia and Alzheimer’s disease over a
6-year follow-up even in persons without memory complaints or low cognitive performance
at baseline.
Despite our large cohort only few people developed clinical symptoms of dementia, as ex-
pected based on incident rates in the general population.28 Vascular dementia could therefore
not be analyzed as a separate entity. Clinical studies however suggest that patients with vas-
cular dementia have a degree of hippocampal atrophy that lies between healthy elderly and
���
���
���
���
��
�
� � � � � � � ��������������������������������������
��
���
���
����
���
����
�����������
���
���
���
���
��
�
� � � � � � � �
��
���
���
����
���
����
��������
�������������������������������������
�
�
�

Hippocampal, amygdalar atrophy and dementia
139
Alzheimer patients.29 Another issue is that we only assessed the hippocampus and amygdala
while recently some investigators propose that atrophy of the entorhinal cortex on MRI has
a greater ability to predict Alzheimer’s disease than the hippocampus.30 However, difficulties
in outlining the boundaries of the entorhinal cortex due to anatomic ambiguity make this as-
sessment not easily applicable.14
As the neuropathology of Alzheimer’s disease is found first, and remains most severe, in
the hippocampal region, attention of imaging studies in Alzheimer’s disease has been drawn
to the hippocampus. Moreover, the in-vivo use of MRI of the hippocampus in Alzheimer’s
disease has been histologically correlated to neuronal loss and Alzheimer pathology.4, 31, 32
After early MRI studies showing atrophy of the hippocampus in patients with dementia of
moderate severity,5, 6 later studies found atrophy also in patients with milder dementia.9, 15, 20
Atrophy on MRI is also observed before the diagnosis of dementia is made in high-risk popula-
tions such as MCI patients9-15 or persons at risk of autosomal dominant familial AD.33, 34 Within
MCI patients, hippocampal atrophy severity predicts conversion to dementia independent of
neuropsychological performance.26, 30, 35 We found that hippocampal and amygdalar atrophy
on MRI predict dementia over a long follow-up period even when people have no memory
complaints or cognitive impairment. This suggests that atrophy of structures in the medial
temporal lobe is detectable several years before symptom onset. Although pathological stu-
dies suggested that the amygdala is affected slightly later in the Alzheimer process than the
hippocampus,3 we found amygdalar atrophy to a similar extent as hippocampal atrophy in
persons who develop dementia. Cross-sectional studies in mild AD patients also showed hip-
pocampal and amygdalar atrophy to an equal degree.12, 20 Concerning the extent of atrophy,
we found on average 10% smaller volumes in those destined to develop dementia. In persons
with mild to moderate AD, volume reductions are between 25% and 40%36 suggesting that
atrophy accelerates in incipient AD.13 In a study in 5 middle-aged persons who developed
familial AD within 3 years, a 16% volume difference in medial temporal lobe structures with
healthy controls was observed.34 In our elderly sample, the medial temporal lobe could be
less affected by Alzheimer pathology as comorbid cerebrovascular disease may have contri-
buted to the cognitive decline pushing people earlier over the threshold of dementia.18, 37-39
Our results were not changed when we took into account concurrent vascular brain changes
on MRI suggesting that vascular brain pathology and atrophy on MRI reflect different underly-
ing processes that both independently predict dementia in late life.
The emergence of potentially disease-modifying therapies for Alzheimer’s disease urges the
need to identify high-risk persons who may benefit from such therapies. Treatment or preven-
tion might have the largest effect early in the disease process, in a stage where brain damage
is not extensive and there are no or only few symptoms. A small hippocampus or amygdala
on MRI in people without memory complaints or cognitive impairment may be indicative of

Chapter 4.2
140
such a high-risk group early in the disease. However, we must bear in mind that the majority
of people with atrophy do not develop dementia. Future studies are challenged to investigate
whether other regions on MRI or other modalities can distinguish those with a small brain
volume who are in the process of developing dementia and those who are not.
References
1. Ott A, Breteler MMB, van Harskamp F, Stijnen T, Hofman A. Incidence and risk of dementia. The
Rotterdam Study. Am J Epidemiol 1998; 147:574-80.
2. Scarpini E, Scheltens P, Feldman H. Treatment of Alzheimer’s disease: current status and new
perspectives. Lancet Neurol 2003; 2:539-47.
3. Braak H, Braak E. Neuropathological stageing of Alzheimer-related changes. Acta Neuropathol
1991; 82:239-59.
4. Bobinski M, de Leon MJ, Wegiel J, et al. The histological validation of post mortem magnetic
resonance imaging- determined hippocampal volume in Alzheimer’s disease. Neuroscience
2000; 95:721-5.
5. Kesslak JP, Nalcioglu O, Cotman CW. Quantification of magnetic resonance scans for hippo-
campal and parahippocampal atrophy in Alzheimer’s disease. Neurology 1991; 41:51-4.
6. Jack CR, Jr., Petersen RC, O’Brien PC, Tangalos EG. MR-based hippocampal volumetry in the
diagnosis of Alzheimer’s disease. Neurology 1992; 42:183-8.
7. Cuenod CA, Denys A, Michot JL, et al. Amygdala atrophy in Alzheimer’s disease. An in vivo
magnetic resonance imaging study. Arch Neurol 1993; 50:941-5.
8. Ritchie K, Touchon J. Mild cognitive impairment: conceptual basis and current nosological sta-
tus. Lancet 2000; 355:225-8.
9. Jack CR, Jr., Petersen RC, Xu YC, et al. Medial temporal atrophy on MRI in normal aging and
very mild Alzheimer’s disease. Neurology 1997; 49:786-94.
10. Convit A, De Leon MJ, Tarshish C, et al. Specific hippocampal volume reductions in individuals
at risk for Alzheimer’s disease. Neurobiol Aging 1997; 18:131-8.
11. De Leon MJ, George AE, Golomb J, et al. Frequency of hippocampal formation atrophy in nor-
mal aging and Alzheimer’s disease. Neurobiol Aging 1997; 18:1-11.
12. Krasuski JS, Alexander GE, Horwitz B, et al. Volumes of medial temporal lobe structures in
patients with Alzheimer’s disease and mild cognitive impairment (and in healthy controls). Biol
Psychiatry 1998; 43:60-8.
13. Jack CR, Jr., Petersen RC, Xu Y, et al. Rates of hippocampal atrophy correlate with change in
clinical status in aging and AD. Neurology 2000; 55:484-89.
14. Xu Y, Jack CR, Jr., O’Brien PC, et al. Usefulness of MRI measures of entorhinal cortex versus
hippocampus in AD. Neurology 2000; 54:1760-7.

Hippocampal, amygdalar atrophy and dementia
141
15. Du AT, Schuff N, Amend D, et al. Magnetic resonance imaging of the entorhinal cortex and hip-
pocampus in mild cognitive impairment and Alzheimer’s disease. J Neurol Neurosurg Psychia-
try 2001; 71:441-7.
16. Hofman A, Grobbee DE, de Jong PTVM, van den Ouweland FA. Determinants of disease and
disability in the elderly: the Rotterdam Elderly Study. Eur J Epidemiol 1991; 7:403-22.
17. Breteler MMB. Vascular involvement in cognitive decline and dementia. Epidemiologic evi-
dence from the Rotterdam Study and the Rotterdam Scan Study. Ann N Y Acad Sci 2000;
903:457-65.
18. Vermeer SE, Prins ND, den Heijer T, Hofman A, Koudstaal PJ, Breteler MMB. Silent brain in-
farcts and the risk of dementia and cognitive decline. N Engl J Med 2003; 348:1215-22.
19. den Heijer T, Vermeer SE, Clarke R, et al. Homocysteine and brain atrophy on MRI of non-de-
mented elderly. Brain 2003; 126:170-5.
20. Callen DJ, Black SE, Gao F, Caldwell CB, Szalai JP. Beyond the hippocampus: MRI volumetry
confirms widespread limbic atrophy in AD. Neurology 2001; 57:1669-74.
21. Roth M, Huppert FA, Tym E. Camdex, The Cambridge examination for mental disorders of the
elderly. Cambridge: Cambridge University Press, 1988.
22. McKhann G, Drachman D, Folstein M, Katzman R, Price D, Stadlan EM. Clinical diagnosis of
Alzheimer’s disease: report of the NINCDS-ADRDA Work Group under the auspices of
Department of Health and Human Services Task Force on Alzheimer’s Disease. Neurology 1984;
34:939-44.
23. Román GC, Tatemichi TK, Erkinjuntti T, et al. Vascular dementia: diagnostic criteria for research
studies. Report of the NINDS-AIREN International Workshop. Neurology 1993; 43:250-60.
24. Petersen RC, Smith GE, Ivnik RJ, Kokmen E, Tangalos EG. Memory function in very early Alz-
heimer’s disease. Neurology 1994; 44:867-72.
25. de Groot JC, de Leeuw FE, Oudkerk M, et al. Cerebral white matter lesions and cognitive func-
tion: the Rotterdam Scan Study. Ann Neurol 2000; 47:145-51.
26. Jack CR, Jr., Petersen RC, Xu YC, et al. Prediction of AD with MRI-based hippocampal volume
in mild cognitive impairment. Neurology 1999; 52:1397-1403.
27. DeCarli C. Mild cognitive impairment: prevalence, prognosis, aetiology, and treatment. Lancet
Neurol 2003; 2:15-21.
28. Miech RA, Breitner JCS, Zandi PP, Khachaturian AS, Anthony JC, Mayer L. Incidence of AD
may decline in the early 90s for men, later for women: The Cache County study. Neurology
2002; 58:209-218.
29. Laakso MP, Partanen K, Riekkinen P, et al. Hippocampal volumes in Alzheimer’s disease, Par-
kinson’s disease with and without dementia, and in vascular dementia: An MRI study. Neurol-
ogy 1996; 46:678-81.
Chapter 4.2
142
30. Killiany RJ, Hyman BT, Gomez-Isla T, et al. MRI measures of entorhinal cortex vs hippocampus
in preclinical AD. Neurology 2002; 58:1188-96.
31. Gosche KM, Mortimer JA, Smith CD, Markesbery WR, Snowdon DA. Hippocampal volume as
an index of Alzheimer neuropathology: findings from the Nun Study. Neurology 2002; 58:1476-
82.
32. Jack CR, Jr., Dickson DW, Parisi JE, et al. Antemortem MRI findings correlate with hippocampal
neuropathology in typical aging and dementia. Neurology 2002; 58:750-7.
33. Fox NC, Warrington EK, Freeborough PA, et al. Presymptomatic hippocampal atrophy in Alz-
heimer’s disease. A longitudinal MRI study. Brain 1996; 119:2001-7.
34. Schott JM, Fox NC, Frost C, et al. Assessing the onset of structural change in familial Alzhei-
mer’s disease. Annals of Neurology 2003; 53:181-188.
35. Visser PJ, Verhey FR, Hofman PA, Scheltens P, Jolles J. Medial temporal lobe atrophy predicts
Alzheimer’s disease in patients with minor cognitive impairment. J Neurol Neurosurg Psychia-
try 2002; 72:491-7.
36. Lehericy S, Baulac M, Chiras J, et al. Amygdalohippocampal MR volume measurements in the
early stages of Alzheimer disease. AJNR Am J Neuroradiol 1994; 15:929-37.
37. de la Torre JC. Alzheimer disease as a vascular disorder: nosological evidence. Stroke 2002;
33:1152-62.
38. Kuller LH, Lopez OL, Newman A, et al. Risk factors for dementia in the cardiovascular health
cognition study. Neuroepidemiology 2003; 22:13-22.
39. Snowdon DA, Greiner LH, Mortimer JA, Riley KP, Greiner PA, Markesbery WR. Brain infarction
and the clinical expression of Alzheimer disease. The Nun Study. JAMA 1997; 277:813-7.

143
Chapter 4.3
Brain atrophy and incident depression
Cross-sectional studies have suggested links between late-life depression and hippocampal,
amygdalar and frontal atrophy on MRI. It is unclear whether atrophy in these structures could
precede onset of depression. We followed a population-based sample of 459, non-demented,
non-depressed elderly a baseline, over a three-year period during which 24 developed a de-
pression. At baseline, MRI of the brain was made on which volumes of the hippocampus and
amygdala and a score of frontal atrophy were assessed. Frontal atrophy, but not hippocampal
or amygdalar atrophy, was associated with an increased risk of depression (per point increase
odds ratio 2.0, (95% CI 1.1-3.8)).
Chapter 4.3
144
Introduction
Several cross-sectional clinical studies found hippocampal, possibly amygdalar, and frontal
lobe atrophy on magnetic resonance imaging (MRI) in patients with depression (reviewed by
Sheline1). It has been suggested that atrophy in these regions is a consequence of elevated,
and neurotoxic, glucocorticoid levels accompanying the depression. However, atrophy could
also be a cause of depression, as these structures have a role in mood regulation.1 To inves-
tigate the latter hypothesis, we prospectively examined hippocampal, amygdalar and frontal
brain atrophy on MRI in relation to risk of depression in the elderly.
Methods
Subjects
This study is based on the Rotterdam Scan Study, a population-based cohort study designed
to investigate brain abnormalities on MRI.2 The study protocol was approved by the Medical
Ethics Committee of Erasmus Medical Center and participants gave written informed con-
sent. The cohort consists of 1,077 non-demented elderly persons age 60 to 90 years (mean
age 73, 49% women) who were examined at baseline in 1995-1996 and underwent brain MRI
in a 1.5 T scanner (VISION MR). During sample selection, we carefully excluded demented pa-
tients using a stepwise protocol.3 Axial T1 MRI sequences were made in all 1,077 participants.
In 511 persons, we additionally obtained a three-dimensional (3D) MR sequence covering the
whole brain. These 511 persons did not differ in several demographics from the original cohort
of 1,077 persons.2
Incident depression
At baseline MRI, we excluded 43 participants with depressive symptoms based on the use
of antidepressant medications or based on a score ≥16 on the Centre for Epidemiologic Stu-
dies Depression scale (CES-D), a cut-off widely used and highly sensitive for depression.4
This left 468 participants at risk of incident depression. Incident depression was detected
in two ways. First, we invited all living members of the cohort for follow-up examinations
in 1999-2000. From the total 432 living members, 334 (77%) agreed to participate and they
were screened with the CES-D. Persons who refused (n=98) were on average 3.9 years older
(T-test, P<0.001) but were similar with respect to sex distribution, CES-D score at baseline,
and MRI assessments compared to participants. Persons with a CES-D score ≥16 at follow-up
examinations were visited at home by a psychiatrist. The psychiatrist evaluated these partici-
pants with the Present State Examination, a semi-structured psychiatric interview,5 and made
a diagnosis of major depression, minor depression, or dysthymia according to DSM-IV criteria.

Brain atrophy and depression
145
As depression can occur between baseline and follow-up examinations and in persons who
refused follow-up examinations, a second way to detect incident depression was through
checking of medical records by two raters of all 468 participants at the general practitioners’
offices for reports on treated depression until March 1st 2000. Five persons with no informa-
tion from medical records and four persons with anxiety or other psychiatric disorders were
excluded, leaving 459 participants for the analyses.
MRI acquisition and measurements
The MRI acquisition parameters are reported elsewhere.2 Coronal MRI slices (contiguous
1.5-mm slices) were reformatted from the 3D MR sequence. The procedure of segmenting
the hippocampus and amygdala has been described.2 Briefly, we manually outlined on coronal
slices the hippocampi and amygdalae on both sides with a mouse-driven cursor. Volumes were
calculated by summing the areas multiplied by slice thickness. As a proxy for head size, we
measured on the middle sagittal slice the intracranial area by tracing the inner skull. Volumes
were divided by the intracranial area and the resulting ratio was standardized towards average
head size (men and women separately). As one volumetric assessment was time-consu-
ming (1-hour), the 459 scans were equally divided between two raters. Intra- and interrater
studies based on 14 subjects done by both raters showed intraclass correlation coefficients
to exceed r=0.77. We rated frontal cortical atrophy semi-quantitatively on axial T1 MRI slices.
Two raters scored independently all the scans and gave a score of 0 (no atrophy) to 3 (severe
atrophy) based on the average widening of the sulci of the frontal lobe and in comparison to
reference scans. The central sulcus was the delimiter between the frontal and parietal lobe.
In case of disagreement of more than 1 point between the raters a consensus reading was
held, otherwise the mean score was calculated. Weighted kappa values of intra- and interrater
agreement were 0.57 and 0.71 based on 200 scans. Other regions were similarly assessed
for severity of atrophy (insular region, parietal lobe, occipital lobe and temporal lobe).
Data analysis
First, we used multiple linear regression modeling to compare hippocampal and amygdalar
volumes and frontal atrophy score between persons with and without incident depression.
Because the associations were similar for left or right-sided hippocampal or amygdalar vol-
umes, we summed the left and right side to yield total volumes. Second, we calculated odds
ratios (95% confidence interval CI) of incident depression by baseline MRI variables with
logistic regression using the non-depressed as reference group. Adjustments were made for
age and sex and additionally for baseline CES-D. Additionally, we excluded persons with a his-
tory of a depression before baseline (based on medical records), and persons who developed
dementia in follow-up.3

Chapter 4.3
146
Results
Hippocampal and amygdalar volumes on baseline MRI were similar in participants who deve-
loped a depression during follow-up (n=24 of whom 8 diagnosed by medical records) compared
to those who did not (n=435) (Table 1). The corresponding odds ratios of incident depression
were 0.9 (95% CI 0.6-1.4,P=0.6) per standard deviation (SD) decrease in hippocampal volume
and 1.3 (95% CI 0.8-2.0,P=0.2) per SD decrease in amygdalar volume. In contrast, there
was significantly more frontal atrophy in persons who developed depression during follow-up
compared to persons who did not (Table 1); corresponding odds ratio per point increase 2.0
(95% CI 1.1-3.8,P=0.031). Adjusting for baseline CES-D did not change these results. Other
regions for which we assessed cortical atrophy were not associated with depression. Persons
with a history of depression at baseline (n=14) had not more frontal atrophy (adjusted differ-
ence compared to people with no history 0.10, 95% CI –0.23;0.42,P=0.57). Excluding them,
of whom 4 developed a depression during follow-up, or persons with incident dementia (n=15
of whom 2 developed a depression) did not substantially change the association with frontal
atrophy (odds ratio for frontal atrophy 2.2 (95% CI 1.1-4.4,P=0.030) and 1.8 (95% CI 0.9-3.5,
P=0.088), respectively).
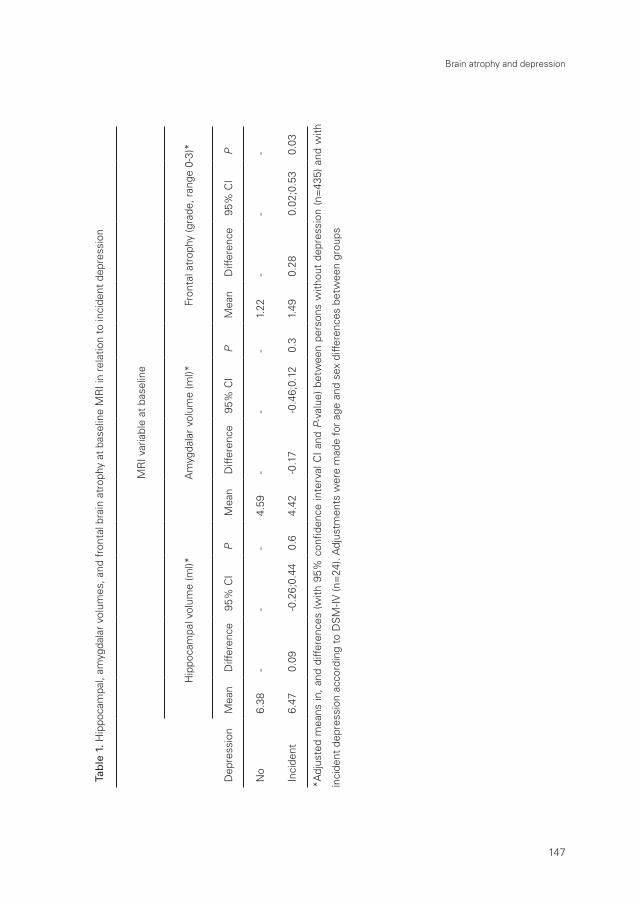
Brain atrophy and depression
147
Tab
le 1
. Hip
poca
mpa
l, am
ygda
lar
volu
mes
, and
fro
ntal
bra
in a
trop
hy a
t ba
selin
e M
RI i
n re
latio
n to
inci
dent
dep
ress
ion
MR
I var
iabl
e at
bas
elin
e
Hip
poca
mpa
l vol
ume
(ml)*
Am
ygda
lar
volu
me
(ml)*
Fron
tal a
trop
hy (g
rade
, ran
ge 0
-3)*
Dep
ress
ion
Mea
n D
iffer
ence
95%
CI
PM
ean
Diff
eren
ce
95%
CI
PM
ean
Diff
eren
ce95
% C
IP
No
6.38
--
-4.
59-
--
1.22
--
-
Inci
dent
6.
470.
09-0
.26;
0.44
0.6
4.42
-0.1
7-0
.46;
0.12
0.3
1.49
0.28
0.02
;0.5
30.
03
*Adj
uste
d m
eans
in,
and
diffe
renc
es (
with
95%
con
fiden
ce in
terv
al C
I an
d P
-val
ue)
betw
een
pers
ons
with
out
depr
essi
on (
n=43
5) a
nd w
ith
inci
dent
dep
ress
ion
acco
rdin
g to
DS
M-IV
(n=
24).
Adj
ustm
ents
wer
e m
ade
for
age
and
sex
diffe
renc
es b
etw
een
grou
ps

Chapter 4.3
148
Discussion
In this community-sample in the elderly, we observed no relation between hippocampal or
amygdalar volumes on MRI and the risk of depression. Conversely, frontal brain atrophy was
associated with an increased risk of depression.
A limitation of our study was the small number of incident depression cases, which explains
the wide confidence intervals around the estimates. Furthermore, we recognize that currently
more sophisticated, volumetric, assessments of the frontal lobe and specific regions in the
frontal lobe are available6, 7 than at baseline in 1995. However, the fact that we found an asso-
ciation between our crude frontal atrophy assessment and incident depression suggests that
we had enough power to detect associations between MRI variables and incident depression,
strengthening the negative finding for the hippocampus and amygdala.
A reduced hippocampal or amygdalar volume on MRI in patients with late life depression has
been observed though results are mixed.1 Two explanations for this association have been
proposed. First, a smaller hippocampal volume may be a consequence of depression due to
associated hypercortisolemia. Elevated cortisol levels are neurotoxic to the hippocampus,8
but possibly this effect plays a role especially in early onset depression. A second explana-
tion may be that volume reduction in the hippocampus and amygdala precedes onset of
depression, given that these structures are involved in mood regulation.1 In this report, we
showed that neither hippocampal nor amygdalar atrophy on MRI increased the risk to develop
depression. This observation strongly challenges the idea that atrophy of the hippocampus
or amygdala precedes depression in later life. Consistent with this idea is a recent study that
showed no hippocampal atrophy on MRI in persons with a first episode of depression, sug-
gesting that reductions in hippocampal volume do not precede illness onset.9 Furthermore,
persons with a longer disease duration have smaller hippocampal volume suggesting that vol-
umes decrease after disease onset.9, 10 Longitudinal clinical studies should focus on whether
hippocampal and amygdalar volume decrease in patients with depression, possibly due to
lasting hypercortisolemia.
Most clinical studies in patients with late life major or minor depression found reductions in
the frontal lobes on MRI.1 Functional imaging studies have also implicated hypometabolism of
the frontal lobes in depression.11 The prefrontal cortex has high concentrations of glucocorti-
coid receptors potentially rendering it vulnerable to hypercortisolemic damage.1 This suggests
that damage to the frontal lobe is a result of depression. However, we observed that frontal
atrophy on MRI is detectable before disease onset, and non-depressed persons with a history
of depression had no increased frontal atrophy. This suggests that frontal atrophy indicates an
increased vulnerability to develop depression in late life.

Brain atrophy and depression
149
References
1. Sheline YI. Neuroimaging studies of mood disorder effects on the brain. Biol Psychiatry 2003;
54:338-52.
2. den Heijer T, Vermeer SE, Clarke R, et al. Homocysteine and brain atrophy on MRI of non-de-
mented elderly. Brain 2003; 126:170-5.
3. Vermeer SE, Prins ND, den Heijer T, Hofman A, Koudstaal PJ, Breteler MMB. Silent brain in-
farcts and the risk of dementia and cognitive decline. N Engl J Med 2003; 348:1215-22.
4. Beekman AT, Deeg DJ, Van Limbeek J, Braam AW, De Vries MZ, Van Tilburg W. Criterion valid-
ity of the Center for Epidemiologic Studies Depression scale (CES-D): results from a commu-
nity-based sample of older subjects in The Netherlands. Psychol Med 1997; 27:231-5.
5. World Health Organisation. SCAN Schedules for Clinical Assessment in Neuropsychiatry, Ver-
sion 2.1. Distribution from Training Centers, World Health Organisation, Geneva, 1997. World
Health Organisation Division of Mental Health.
6. Kumar A, Jin Z, Bilker W, Udupa J, Gottlieb G. Late-onset minor and major depression: early
evidence for common neuroanatomical substrates detected by using MRI. Proc Natl Acad Sci
U S A 1998; 95:7654-8.
7. Lee SH, Payne ME, Steffens DC, et al. Subcortical lesion severity and orbitofrontal cortex vol-
ume in geriatric depression. Biol Psychiatry 2003; 54:529-33.
8. Sapolsky RM. Glucocorticoids and hippocampal atrophy in neuropsychiatric disorders. Arch
Gen Psychiatry 2000; 57:925-35.
9. MacQueen GM, Campbell S, McEwen BS, et al. Course of illness, hippocampal function, and
hippocampal volume in major depression. Proc Natl Acad Sci U S A 2003; 100:1387-92.
10. Sheline YI, Sanghavi M, Mintun MA, Gado MH. Depression duration but not age predicts hip-
pocampal volume loss in medically healthy women with recurrent major depression. J Neuro
sci 1999; 19:5034-43.
11. Oda K, Okubo Y, Ishida R, et al. Regional cerebral blood flow in depressed patients with white
matter magnetic resonance hyperintensity. Biol Psychiatry 2003; 53:150-6.


Chapter 5
General discussion


General discussion
153
This thesis presents studies on causes and correlates of brain atrophy on MRI in non-de-
mented elderly. Studying causes of atrophy on MRI has potential advantages for unraveling
the etiology of Alzheimer’s disease compared to traditional studies associating risk factors
to clinical Alzheimer’s disease. First, as we focus on the preclinical period, we study factors
that could initiate brain changes involved in the early pathogenesis of Alzheimer’s disease.
Second, the degree of brain atrophy on MRI is a continuous outcome in contrast to clinical
Alzheimer’s disease, and we have increased power to detect associations. Third, our study
examined cognitively intact people and may therefore suffer less from selective attrition com-
pared to studies based on patients with Alzheimer’s disease.
Before we started to investigate potential causes of brain atrophy on MRI there was some indi-
cation that atrophy on MRI, in particular of the hippocampus and amygdala, could be observed
in the preclinical period of Alzheimer’s disease. However, we wanted to validate and quantify
in our study sample the association between atrophy on MRI and future clinical symptoms of
Alzheimer’s disease. We further examined whether atrophy also predicted depression. In this
chapter, I will first discuss a few methodological considerations. Then, I will discuss the main
findings, the implications of our findings, and suggestions for future research.
Methodological considerations
The specific limitations of each study have been discussed in the previous chapters. In this
part I will discuss two general issues, which pertain to all studies performed.
Study design
The studies described in this thesis were done as part of the Rotterdam Scan Study.1 This is
a population-based prospective study among 1,077 non-demented elderly between 60-90
years of age that started in 1995-1996. In all 1,077 persons, we had assessments of global
brain atrophy on MRI. In 511 persons, we additionally had volumetric assessments of the hip-
pocampus and amygdala. A specific feature of this design is that we invited people randomly
from the general population. This is in contrast to clinical studies which use a selection of
people who have memory problems and have taken the step to visit a physician. In etiological
research we are interested in what triggers the first pathological signs, as the pathology starts
before symptom onset. For this purpose, population studies are more suitable than clinical
studies. Inherent to our approach is the fact that only a few people develop dementia, as
expected in a low risk population. To investigate whether atrophy on MRI predicts dementia,
we therefore needed a long follow-up duration and a large cohort in order to detect enough
incident cases of dementia.
In 1995-1996, we assessed potential risk factors in persons at the same time that we made

Chapter 5
154
the brain MRI on which we assessed atrophy. This cross-sectional design is a limitation that
needs further discussion. In cross-sectional analyses, one cannot invariably draw the conclu-
sion that the risk factor under study really is a cause of brain atrophy. Because we have no
information on whether the risk factor preceded brain atrophy or vice versa, brain atrophy may
have also resulted in physiological changes. When genetic determinants are concerned, this
is not an issue as atrophy will not induce point mutations in DNA. However, in the analyses
on alcohol intake and plasma homocysteine levels, which depend on folate and vitamin B12
intake, persons with brain atrophy and self-noticed cognitive decline could have changed food
intake behavior. This in turn may induce associations between alcohol intake or homocysteine
levels and brain atrophy. Although we tried to account for several confounding parameters,
residual confounding is still possible. To resolve or limit the possibility that atrophy induced
the change in a physiological marker, follow-up studies are needed where the baseline risk
factor is associated with change in atrophy over time. These analyses are on the other hand
limited by the fact that atrophy has developed over years due to lifetime cumulative exposure
of determinants whereas the relation between determinant and change in atrophy over time
may be less outspoken.
Brain atrophy as preclinical marker of Alzheimer’s disease
Our studies were based on the major assumption that atrophy on MRI is a preclinical bio-
marker of Alzheimer’s disease. To what extent does this assumption hold? Several studies
have shown that patients with Alzheimer’s disease have severe hippocampal, amygdalar and
global brain atrophy on MRI compared to healthy elderly.2 Preclinically, there are studies in
at-risk patients such as those with genetic mutations3 or with mild cognitive impairment4 that
show brain atrophy on MRI before a diagnosis of Alzheimer’s disease can be made. Our own
data (chapter 4.2) also indicated that even when there are no cognitive symptoms of incipi-
ent Alzheimer’s disease, hippocampal and amygdalar atrophy on MRI predict a diagnosis of
Alzheimer’s disease several years later. These observations all favor the idea that atrophy on
MRI can indeed be considered a relatively early preclinical marker of Alzheimer’s disease.
However, not every person with atrophy on MRI will later express clinical symptoms of Alz-
heimer’s disease. Some will die before they have the chance to develop clinical symptoms
of Alzheimer’s disease. In others, a small brain volume on MRI may have been present since
adulthood instead of being indicative of an underlying Alzheimer process. Finally, in several
other diseases besides Alzheimer’s disease, atrophy can occur such as in temporal lobe epi-
lepsy (hippocampal/amygdalar atrophy)5 or anxiety (amygdalar atrophy).6 Therefore, when we
identify a risk factor for brain atrophy on MRI, we have to be careful to interpret this as being
a risk factor for the development of clinical Alzheimer’s disease without further evidence. In
chapter 3.2, we found that estrogen receptor α polymorphisms were associated with hippo-

General discussion
155
campal and amygdalar atrophy on MRI yet not with dementia. Risk factors of atrophy should
always be seen in light of evidence concerning these risk factors in Alzheimer’s disease.
Studies on risk factors for atrophy should not replace research of risk factors for clinical Alz-
heimer’s disease but rather complement it in order to increase the understanding of what
could elicit the preclinical brain changes.
Main findings
I will first discuss the main findings on putative causes of brain atrophy on MRI (chapter 2 and
3). Then, I discuss the clinical correlates of brain atrophy on MRI (chapter 4).
Causes of brain atrophyDespite intensive research, the etiology of Alzheimer’s disease remains largely unclear. Two
aspects of the disease complicate etiological research. First, once symptoms of Alzheimer’s
disease are clearly evident, a long prodromal phase has been passed in which the brain pa-
thology has accumulated. Physiological factors present at time of diagnosis of Alzheimer’s
disease, may not be the ones that effectuated the brain damage in the preclinical period. Sec-
ond, late-onset Alzheimer’s disease is pathologically a heterogeneous disease.7 The brain of
a person who died with clinical symptoms of Alzheimer’s disease is often destructed by vari-
ous pathologies: besides neurofibrillary tangles and amyloid plaques in gray matter, lacunar
infarcts and ischemia in the white matter are also frequently visible.8 Among individuals with
clinical symptoms of Alzheimer’s disease, the extent to which each pathology contributed to
symptoms may differ, as well as the key mechanisms underlying these brain changes. We
took the approach of investigating risk factors of brain atrophy on MRI in vivo, which is evident
in the preclinical phase, and reflects a relatively distinct pathology. By doing so, we hoped to
further increase insight into which risk factors contribute to the development of Alzheimer’s
disease. The risk factors we studied were not arbitrarily chosen but selected because of their
putative role in Alzheimer’s disease.
Vascular risk factors
A great deal of research over the last decade has added to the idea that vascular factors
contribute to the development of clinical Alzheimer’s disease in late life.9 Vascular factors
can cause cerebrovascular damage, which enhances cognitive decline in a brain with exist-
ing Alzheimer pathology.10 However, cerebral ischemia can also upregulate amyloid-ß in the
hippocampi of rats11 supporting a more direct link with Alzheimer’s disease. We investigated
several vascular risk factors in relation to brain atrophy on MRI.
A high blood pressure level is a well-recognized cardio- and cerebrovascular risk factor. The

Chapter 5
156
relation between blood pressure and Alzheimer’s disease is less clear.12 Both mid-life high,13,
14 and late-life low15 blood pressure levels have been associated with the risk of clinical Alzhei-
mer’s disease. In line with these earlier observations, we found that both a high and a low or
decreasing blood pressure level were associated with medial temporal lobe and global brain
atrophy (chapter 2.1 and 2.2). Cerebrovascular damage as quantified by the extent of white
matter lesions on MRI coexisted with severe hippocampal and amygdalar atrophy. One possi-
bility is that cerebrovascular disease and brain atrophy have common shared risk factors such
as high blood pressure levels. However, adjusting for blood pressure levels did not change
this correlation. Possibly, microangiopathy of arterioles supplying the medial temporal lobe,
visible as white matter lesions on MRI, may reduce cerebral blood flow leading to ischemia in
the hippocampus and amygdala.16 The association between low blood pressure and atrophy
on MRI as well as that between low blood pressure and Alzheimer’s disease is difficult to
interpret. Several regions of the brain, including the hippocampus and amygdala, are involved
in blood pressure regulation and brain atrophy due to an Alzheimer process could have re-
duced blood pressure levels.17, 18 Alternatively, a low blood pressure level in persons with a bad
cerebral autoregulation could also cause cerebral ischemia, and thereby actually lead to the
development of Alzheimer pathology.19
A high plasma homocysteine level has recently been suggested as a risk factor for Alzheimer’s
disease.20 In the Rotterdam Scan Study, we previously found that a high homocysteine level
may cause cerebrovascular damage such as silent brain infarcts and white matter lesions,21
pointing towards one potential explanation for the association between homocysteine levels
and clinical Alzheimer’s disease. In chapter 2.3 we report that a high homocysteine level also
has effects on both hippocampal and global brain atrophy, on MRI, which were not reduced
when accounting for cerebrovascular disease. This is in line with in vitro studies showing toxic
effects of homocysteine on cortical and hippocampal neurons.22, 23
A light-to-moderate alcohol intake may reduce cerebrovascular disease24 and vascular demen-
tia.25 Concerning the risk of Alzheimer’s disease, the effect of alcohol intake is less certain and
a putative reduced risk may be confined to apolipoprotein (APOE) ε4 carriers who consume
alcohol in light-to-moderate amounts.25 Since we have assessments on MRI of both cerebro-
vascular disease (white matter lesions and infarcts) and findings more specific of Alzheimer
pathology (hippocampal and amygdalar atrophy) in the Rotterdam Scan Study, we decided
to study this issue further. Our data in chapter 2.4 showed, as expected, a reduced effect of
alcohol on cerebrovascular disease in general. There was only a beneficial effect of light-to-
moderate alcohol intake on hippocampal and amygdalar atrophy in APOE ε4 carriers further
strengthening the idea that alcohol has an effect on the risk of Alzheimer’s disease only in
APOE ε4 carriers.
One of the strongest risk factor for Alzheimer’s disease is carrying an APOE ε4 allele.26 The

General discussion
157
neurobiologic mechanism through which the ε4 allele confers an increased risk of Alzheimer’s
disease is not well understood. Some studies suggest that persons with the ε4 allele have
increased cerebrovascular pathology27 but the bulk of evidence suggests that APOE ε4 leads
to clinical disease mainly via the specific Alzheimer pathology.28 In vitro studies suggest that
the ε4 protein isoform enhances aggregation of amyloid-ß and formation of neurofibrillary
tangles. APOE ε4 carriers have higher numbers of neurofibrillary tangles and amyloid plaques
in the hippocampus compared to non-ε4 carriers.29 Our finding that atrophy in the medial
temporal lobe was more pronounced in ε4 carriers compared to persons with the APOE ε3ε3
genotype gave further support to our assumption that atrophy on MRI reflects Alzheimer
pathology (chapter 2.5).
Taken together, we found several classical or more recently identified vascular risk factors
to be associated to brain atrophy on MRI. This supports the idea that vascular factors could
specifically trigger Alzheimer pathology in the preclinical phase.
Endocrine risk factors
Besides vascular risk factors, other risk factors have been suggested to be involved in the
development of Alzheimer’s disease.
A substantial body of evidence in animal studies suggest that estrogens have antioxidative
properties30 and beneficial effects on hippocampal neurons.31 Therefore in theory, a high
estrogen level in the brain could reduce the risk of Alzheimer’s disease. On the other hand,
observational data in humans are far from conclusive on the role of estrogens in Alzheimer’s
disease. Before menopause, women have high endogenous estrogen levels and it could
therefore be hypothesized that women with a long reproductive period, and hence a high
lifetime cumulative exposure to estrogen, would have a lower risk of Alzheimer’s disease.
However, in the Rotterdam Study it was found that their risk to develop Alzheimer’s disease
was higher compared to those with shorter reproductive periods.32 After menopause,
endogenous estrogen levels drop and in older women with a relatively high endogenous
estradiol level the risk to develop dementia was highest.33 In line with this finding, we showed
in chapter 3.1 that higher endogenous levels of estrogens are not associated with a larger
volume of the hippocampus on MRI or better memory performance. Endogenous levels after
menopause are, however, far below levels obtained after estrogen replacement therapy and
it could be that “supranatural” estrogen levels protect against Alzheimer’s disease. Recent
trials on estrogen replacement therapy in preventing or slowing of Alzheimer’s disease do
not support this idea.34, 35 In fact, elderly women who receive a combination of estrogen and
progestin have a two times increased risk to develop Alzheimer’s disease compared to women
on placebo.34 A similar kind of discrepancy between findings of basic sciences (estrogen is
protective)36 and randomized trials (estrogen is harmful)37 has been observed in cardiovascular

Chapter 5
158
research. In this field it has been suggested that genetic variations in the gene encoding
for estrogen receptor α render some women more susceptible to the beneficial or harmful
effects of estrogen.38 Effects of estrogen replacement therapy on lipid profile are different
across genotype39 and polymorphisms in the estrogen receptor α are associated with risk of
cardiovascular disease.40 We found that polymorphisms in the estrogen receptor α gene are
not associated with the risk of Alzheimer’s disease (chapter 3.2). This makes it less plausible,
though not impossible, that estrogen replacement therapy will have a beneficial effect on risk
of dementia in women with a certain variation in the estrogen receptor α gene.
Other endocrine factors that we examined were diabetes mellitus and insulin resistance (chap-
ter 3.3). Although these factors could also be categorized as vascular risk factors, evidence in
Alzheimer research suggests that it is not the vascular risk component of diabetes mellitus
and insulin resistance that causes the increased risk of Alzheimer’s disease. Instead, a high
glucose level or altered insulin signaling could have direct effects on the development of amy-
loid plaques and neurofibrillary tangles in the brain.41, 42 In line with this idea, we showed that
persons with diabetes mellitus have increased atrophy of the hippocampus and amygdala on
MRI. Of interest, the relation between diabetes mellitus and cerebrovascular disease was not
strong and did not account for the associations with atrophy. The mechanisms that underlie
the associations between diabetes mellitus and atrophy could be manifold. First, advanced
glycation endproducts, of which persons with diabetes have increased levels, could trigger
the aggregation of amyloid proteins into amyloid plaques.41 Second, glycation of the microtu-
bule associated protein-tau could lead to formation of neurofibrillary tangles.43 With respect to
insulin, evidence from several lines of research has supported links with Alzheimer’s disease.
Insulin receptors are densely distributed in the brain44 and once activated lead to a cascade of
events that promote neuronal survival and prevent tau phosphorylation.42 Dysfunction of this
pathway may therefore lead to Alzheimer’s disease and genetic variations in the genes en-
coding for proteins in this insulin pathway have been associated to Alzheimer’s disease.42, 44, 45
Plasma insulin levels may secondarily increase to compensate for this loss of receptor func-
tion. Furthermore, the insulin-degrading enzyme (IDE) is present in the brain and, in addition
to insulin, also degrades amyloid proteins, thereby preventing plaque formation. Mice with
hypofunction of this enzyme have more amyloid plaques and high insulin plasma levels46 and
variations in the gene encoding IDE have been found in patients with Alzheimer’s disease.47 In
our study, interestingly, we found a specific effect of insulin resistance on amygdalar atrophy
on MRI but not on hippocampal atrophy.

General discussion
159
Specificity of measures of brain atrophy on MRI
We investigated putative causes of several different measures of brain atrophy on MRI (hip-
pocampal, amygdalar, cortical and subcortical brain atrophy). Sometimes we found that a risk
factor was specifically associated with one brain atrophy measure while not with the other
atrophy measures. The APOE ε4 allele for example was associated with hippocampal and
amygdalar atrophy yet not with global brain atrophy. One possible source for different as-
sociations may be that global brain atrophy was less precisely measured (semi-quantitative)
than the hippocampus and amygdala (volumetric). However, a more likely explanation is that
anatomically different structures are under study or that the MRI measures have different
pathological substrates.
Though frequently observed in Alzheimer patients,48 there is no firmly defined pathological
basis of global brain atrophy on MRI, which can be divided in cortical (sulcal widening) and
subcortical (ventricular enlargement) atrophy. Although the name “cortical” atrophy would
imply neuronal loss, there is only little neuronal loss with aging.49 Sulcal widening may be the
result of reduction of myelinated nerve fibers underneath the cortex in the white matter.49
The nerve fibers that are lost presumably originate from the projecting pyramidal cells in the
cortex. However, if there is little loss of cortical neurons, then the projecting myelinated ax-
ons must degenerate without the loss of the parental cell body. Subcortical atrophy indicates
ventricular enlargement at the expense of white matter around the ventricles (hydrocephalus
ex vacuo). Volumetric MRI studies have shown that brain white matter volume decreases
with age50 most likely due to loss of myelin with relative preservation of axons. Given that we
do not have a pathological validation of global brain atrophy on MRI, it remains uncertain on
which places (cortex or white matter) risk factors act. High blood pressure or homocysteine
levels could for example induce neurofibrillary tangles and shrinkage of neurons in the cor-
tex. However, effects such as ischemia in the white matter regions and loss of white matter
volume could also be involved in the associations with global brain atrophy on MRI. Detailed
segmentation of the brain in gray matter, white matter and cerebrospinal fluid volume and
separately investigating the correlations with vascular factors could resolve this problem.
Compared to global brain atrophy on MRI, there is a stronger histological validation for hip-
pocampal and amygdalar atrophy on MRI. Volumes of these structures on MRI are strongly
positively correlated with neuronal count,51, 52 and negatively with the extent of the specific
Alzheimer pathology, i.e. neurofibrillary tangles and amyloid plaques.53 The risk factors that we
found for hippocampal and amygdalar atrophy act therefore specifically on neurons of these
brain structures or on the development of Alzheimer pathology for which these structures are
highly susceptible. From the risk factors we studied blood pressure levels, homocysteine,
alcohol intake, APOE gene, estrogen receptor α polymorphism and diabetes mellitus were
more or less similarly associated with hippocampal and amygdalar atrophy on MRI. A notable
Chapter 5
160
difference was insulin resistance, which was strongly associated with amygdalar atrophy but
absolutely not with hippocampal atrophy on MRI (chapter 3.3). A recent study also found no
association between insulin resistance and hippocampal volumes on MRI54 but that study
did not assess the amygdala. The biochemical properties of the Alzheimer pathology are,
to my knowledge, similar in both structures and develop approximately at the same time in
the process of Alzheimer’s disease.55 This suggests that differences between neurons of the
hippocampus and amygdala result in differential effects of insulin resistance. The density of
insulin receptors on hippocampal and amygdalar neurons are slightly different with the hip-
pocampus having a higher density.56 Possibly, the hippocampus is less sensitive for effects of
insulin resistance than the amygdala due to its higher receptor density.
Clinical correlates of brain atrophyThe work we described on risk factors of brain atrophy on MRI started based on the belief
that brain atrophy on MRI can be observed early in the process of Alzheimer’s disease. To
investigate the functional significance of brain atrophy on MRI in the preclinical period, we
addressed the relation between brain atrophy and memory performance since memory im-
pairment is the first preclinical neuropsychological sign of Alzheimer’s disease.57 Additionally,
we quantified the association between brain atrophy on MRI and risk of dementia and risk of
depression.
In chapter 4.1 we report that hippocampal atrophy on MRI of non-demented elderly correlates
with worse memory performance. Persons with smaller volumes of the hippocampus on
MRI, particularly of the head portion, performed worse on a verbal memory task. Since 1957,
the medial temporal lobe has been identified to play an important role in memory function.
Selective memory impairment was described after bilateral surgical removal of the medial
temporal lobe in patient H.M.58 However, the medial temporal lobe is a large region that in-
cludes the hippocampus, the amygdala and adjacent cortical areas. The precise contribution
of each of these structures in memory function is just starting to be disentangled. More-
over, even within a structure, there may exist functional segregation. Response to novelty
is, for example, mapped on the head portion of the hippocampus59 whereas spatial memory
is probably located in the posterior hippocampus.60 The early observable verbal memory de-
cline in incipient Alzheimer’s disease is by most researchers attributed to the accumulation
of Alzheimer pathology in the hippocampus.61 Damage to the hippocampus in this stage may
go hand-in-hand with complaints of worse memory function and low memory performance.
However, whether a person complains or not will also depend on personality traits or social
factors. In chapter 4.2 we show that hippocampal atrophy on MRI predicts dementia even
when a person did not report memory complaints or had a lower than average memory
performance. This suggests that although the Alzheimer process already accumulates in the

General discussion
161
hippocampus and can be detectable as atrophy on MRI, persons do not necessarily com-
plain of bad memory or perform worse on memory tests. We found that amygdalar atrophy
on MRI also predicts dementia. It is unclear whether in the preclinical phase of Alzheimer’s
disease amygdalar atrophy has functional correlates. Experiments in monkeys demonstrated
that amygdalar damage does not impair memory.62 In line, we found no pronounced amy-
gdala atrophy in persons with worse verbal memory (chapter 2.5). The amygdala consists of
several nuclei which all could have separate functions but, in general, the amygdala functions
in emotional information processing and fear conditioning.63 In Japanese Alzheimer patients,
worse memory of a traumatic event arising emotion (earthquake) was stronger correlated to
amygdalar atrophy than to hippocampal atrophy on MRI.64 Other studies showed increased
anxiety in Alzheimer patients, which could possibly be contributed to damage of the amygdala
by the Alzheimer process.65
Clinical studies have shown atrophy of the hippocampus, the frontal lobe and sometimes
amygdala in patients with depression compared to healthy controls.66 Most consistently, this
is observed in patients with a long duration of depression. The observation could be caused
by hypercortisolemia which is neurotoxic and is present in patients with major depression.
However, as the hippocampus, amygdala and frontal lobe, as part of the limbic system, are
involved in emotion regulation it may also be that the presence of atrophy poses people at
risk of mood disorders or a depression. We studied this latter hypothesis by investigating the
longitudinal relation between atrophy and depression in persons who were non-depressed at
baseline. While both hippocampal and amygdalar atrophy were not associated with incident
depression, frontal atrophy was. These data make it unlikely that atrophy of the hippocampus
and amygdala precedes a depression in late-life. In line, a recent clinical study showed no hip-
pocampal atrophy in persons who entered the hospital with a first episode of depression but
hippocampal atrophy was prominent in persons with multiple episodes of depression.67 The
frontal lobe, in particular the orbitofrontal cortex (gyrus rectus), has a connection to the limbic
system and reductions in the gray matter of this area are observed in persons with depres-
sion.68 What actually leads to this gray matter loss is unknown. Most researchers currently
adhere to the “vascular depression hypothesis” of late life depression, stating that brain in-
farcts and white matter damage destruct brain pathways important for normal mood regula-
tion. Hyperintensities in the basal ganglia coexist with a smaller orbitofrontal cortex volume
suggesting a common, possibly vascular pathway of both pathologies.68

Chapter 5
162
Implications
Our findings were based on persons dwelling in the community who as a group are healthier
than patients seen in clinical practice. However, I do think that our findings could have clinical
implications. We showed that atrophy on MRI of the hippocampus and amygdala is a strong
predictor of dementia independent of neuropsychological performance. In line, clinical studies
in patients with mild cognitive impairment previously showed that atrophy of the hippocam-
pus on MRI could predict progression to dementia.4 In case of finding a high degree of atro-
phy on MRI as of yet there is no therapeutical intervention available. However, these patients
and caregivers can be advised and frequently followed. On the other hand, when finding no
atrophy, patients may be reassured that their risk of progressing to dementia is low.4 Assess-
ing MRI volumes by manual outlining of structures will be too labor intensive to implement
in a normal diagnostic work-up. Visually rating of atrophy may be a good alternative69 or auto-
mated segmentation methods70 can be used.
We identified several risk factors for brain atrophy including vascular risk factors. Currently, it
is not common knowledge that brain atrophy on MRI could have vascular determinants. Most
frequently, brain atrophy on MRI is regarded as being normal with ageing and only when
extensive be reported as indicative of neurodegeneration. Our findings suggest that persons
with brain atrophy on MRI should at least be screened for potentially treatable risk factors
such as high blood pressure level, diabetes mellitus and possibly high plasma homocysteine
levels. It remains however to be demonstrated in clinical trials that treatment of these risk
factors reduces the incidence of cognitive decline or dementia.
Suggestions for future research
The research described in this thesis was done in the framework of etiological research on
Alzheimer’s disease. The approach we took to investigate putative causes of a preclinical
biomarker of Alzheimer’s disease, in our case brain atrophy on MRI, has not been frequently
pursued before. I think that this approach deserves further exploration. The following ques-
tions come to mind: which study sample to use? What biomarkers to use? What to do when
we have identified a high-risk group?
Particular population-based samples could yield valuable information on the earliest preclini-
cal changes. Clinical study samples are based on people with cognitive impairment and, as
such, are further along the process of dementia than persons dwelling in the community.
Because twenty-five percent of persons at age of 40 already have some neurofibrillary tan-
gles in the brain,71 it is important to include persons in this young age range. A drawback of
including middle-aged persons is that the incidence of dementia in this age group is very low.

General discussion
163
Therefore, in a longitudinal setting, repeated measures of neuropsychological tests should be
administered to detect subtle cognitive decline.
The biomarkers tested in the preclinical period can be manifold. Peripheral markers such as
plasma amyloid-ß levels72 or inflammatory markers73 should be examined. Brain imaging could
identify specific brain markers. We only addressed hippocampal, amygdalar and generalized
brain atrophy on MRI whereas brain structures such as the entorhinal cortex may be affected
by Alzheimer pathology even earlier.55 Before jumping into assessing this structure by manual
outlining, it will be more time-efficient to use automated protocols to label the entire brain.74
In this way, we might also find other brain regions that previously have been unnoticed in
the early development of Alzheimer’s disease. For this purpose, high-resolution 3D MRI se-
quences should be administered on which, besides gray matter, also white matter lesions
and brain infarcts can be quantified. Currently, it is beyond the resolution of MRI to visualize
amyloid plaques or tangles and we merely see the consequences of these pathologies in
terms of macroscopic volumes loss. Promising results have been made in postmortem tis-
sue with high field strength MRI and binding molecules to detect amyloid plaques.75 Another
interesting imaging tool is functional MRI (fMRI) which visualizes functional changes in the
brain. In ‘at-risk’ persons, differences in regional blood flow to brain regions during cognitive
testing have been reported.76 However, the development of paradigms used for fMRI is dif-
ficult and results will depend on how sensitive these paradigms are for specific changes in
the preclinical phase.
To the extent that preclinical biomarkers predict Alzheimer’s disease, they can be used as spe-
cific outcome measures in etiologic research. We found several environmental and genetic
factors to be associated with brain atrophy on MRI. An interesting lead to further explore
is the role of insulin metabolism in the etiology of Alzheimer’s disease. In our study, insulin
resistance was specifically associated with amygdalar atrophy on MRI but not with hippocam-
pal atrophy or cerebrovascular disease. This suggests that Alzheimer patients with insulin re-
sistance77 might be a certain subgroup of patients with particularly severe amygdalar atrophy
with less pronounced hippocampal atrophy or cerebrovascular disease. Genetic factors likely
play a large role in the development of Alzheimer’s disease. In interpreting genetic associa-
tions with brain volumes at late life, it must be kept in mind that identified genetic variations
are present since conception. Some genetic factors may be involved in the development of
the brain yet not in the etiology of Alzheimer’s disease. The genetic variation in the estrogen
receptor α polymorphism in association with amygdalar volumes on MRI may be examined in
young populations, as this variation was not associated with Alzheimer’s disease.
If we can reliably identify the preclinical period by a combination of biomarkers and neu-
ropsychological tests, disease-modifying drugs, currently under development, could be tried
in these people. Biomarkers could help in tracing the effects of treatment. Recently, a ran-

Chapter 5
164
domized trial showed less pronounced hippocampal volume reduction on MRI over time in
dementia patients using donepezil.78 Before disease-modifying drugs are fully developed, clin-
ical trials may study the effect of interventions in vascular risk profile in certain risk groups.
References
1. Breteler MMB. Vascular involvement in cognitive decline and dementia. Epidemiologic evi-
dence from the Rotterdam Study and the Rotterdam Scan Study. Ann N Y Acad Sci 2000;
903:457-65.
2. Scheltens P, Fox N, Barkhof F, De Carli C. Structural magnetic resonance imaging in the practical
assessment of dementia: beyond exclusion. Lancet Neurol 2002; 1:13-21.
3. Fox NC, Warrington EK, Freeborough PA, et al. Presymptomatic hippocampal atrophy in Alz-
heimer’s disease. A longitudinal MRI study. Brain 1996; 119:2001-7.
4. Jack CR, Jr., Petersen RC, Xu YC, et al. Prediction of AD with MRI-based hippocampal volume
in mild cognitive impairment. Neurology 1999; 52:1397-1403.
5. Bonilha L, Kobayashi E, Rorden C, Cendes F, Li LM. Medial temporal lobe atrophy in patients
with refractory temporal lobe epilepsy. J Neurol Neurosurg Psychiatry 2003; 74:1627-30.
6. Rauch SL, Shin LM, Wright CI. Neuroimaging studies of amygdala function in anxiety disorders.
Ann N Y Acad Sci 2003; 985:389-410.
7. Iqbal K, Grundke-Iqbal I. Alzheimer disease is multifactorial and heterogeneous. Neurobiol Ag-
ing 2000; 21:901-2; discussion 903-4.
8. Pathological correlates of late-onset dementia in a multicentre, community-based population
in England and Wales. Neuropathology Group of the Medical Research Council Cognitive Func-
tion and Ageing Study (MRC CFAS). Lancet 2001; 357:169-75.
9. de la Torre JC. Alzheimer disease as a vascular disorder: nosological evidence. Stroke 2002;
33:1152-62.
10. Snowdon DA, Greiner LH, Mortimer JA, Riley KP, Greiner PA, Markesbery WR. Brain infarction
and the clinical expression of Alzheimer disease. The Nun Study. JAMA 1997; 277:813-7.
11. de la Torre JC, Pappas BA, Prevot V, et al. Hippocampal nitric oxide upregulation precedes
memory loss and A beta 1-40 accumulation after chronic brain hypoperfusion in rats. Neurol
Res 2003; 25:635-41.
12. Skoog I. Highs and lows of blood pressure:a cause of Alzheimer’s disease? Lancet Neurol
2003; 2:334.
13. Launer LJ, Ross GW, Petrovitch H, et al. Midlife blood pressure and dementia: the Honolulu-
Asia aging study. Neurobiol Aging 2000; 21:49-55.
14. Kivipelto M, Helkala EL, Laakso MP, et al. Midlife vascular risk factors and Alzheimer’s disease
in later life: longitudinal, population based study. BMJ 2001; 322:1447-51.

General discussion
165
15. Guo Z, Viitanen M, Fratiglioni L, Winblad B. Low blood pressure and dementia in elderly people:
the Kungsholmen project. BMJ 1996; 312:805-8.
16. Waldemar G, Christiansen P, Larsson HB, et al. White matter magnetic resonance hyperinten-
sities in dementia of the Alzheimer type: morphological and regional cerebral blood flow cor-
relates. J Neurol Neurosurg Psychiatry 1994; 57:1458-65.
17. Burke WJ, Coronado PG, Schmitt CA, Gillespie KM, Chung HD. Blood pressure regulation in
Alzheimer’s disease. J Auton Nerv Syst 1994; 48:65-71.
18. Skoog I, Andreasson LA, Landahl S, Lernfelt B. A population-based study on blood pressure and
brain atrophy in 85-year- olds. Hypertension 1998; 32:404-9.
19. de la Torre JC. Critically attained threshold of cerebral hypoperfusion: the CATCH hypothesis of
Alzheimer’s pathogenesis. Neurobiol Aging 2000; 21:331-42.
20. Seshadri S, Beiser A, Selhub J, et al. Plasma homocysteine as a risk factor for dementia and
Alzheimer’s disease. N Engl J Med 2002; 346:476-83.
21. Vermeer SE, Van Dijk EJ, Koudstaal PJ, et al. Homocysteine, silent brain infarcts, and white
matter lesions: the Rotterdam Scan Study. Annals of Neurology 2002; 51:285-289.
22. Lipton SA, Kim WK, Choi YB, et al. Neurotoxicity associated with dual actions of homocysteine
at the N- methyl-D-aspartate receptor. Proc Natl Acad Sci U S A 1997; 94:5923-8.
23. Kruman II, Culmsee C, Chan SL, et al. Homocysteine elicits a DNA damage response in neu-
rons that promotes apoptosis and hypersensitivity to excitotoxicity. J Neurosci 2000; 20:6920-
6.
24. Berger K, Ajani UA, Kase CS, et al. Light-To-Moderate Alcohol Consumption and the Risk of
Stroke among U.S. Male Physicians. N Engl J Med 1999; 341:1557-1564.
25. Ruitenberg A, van Swieten JC, Witteman JCM, et al. Alcohol consumption and risk of demen-
tia: the Rotterdam Study. Lancet 2002; 359:281-6.
26. Farrer LA, Cupples LA, Haines JL, et al. Effects of age, sex, and ethnicity on the association be-
tween apolipoprotein E genotype and Alzheimer disease. A meta-analysis. APOE and Alz-
heimer Disease Meta Analysis Consortium. JAMA 1997; 278:1349-56.
27. DeCarli C, Reed T, Miller BL, Wolf PA, Swan GE, Carmelli D. Impact of apolipoprotein E ε4 and
vascular disease on brain morphology in men from the NHLBI twin study. Stroke 1999; 30:1548-
53.
28. Bennett DA, Wilson RS, Schneider JA, et al. Apolipoprotein E ε4 allele, AD pathology, and the
clinical expression of Alzheimer’s disease. Neurology 2003; 60:246-52.
29. Ghebremedhin E, Schultz C, Thal DR, et al. Gender and age modify the association between
APOE and AD-related neuropathology. Neurology 2001; 56:1696-701.
30. Behl C, Skutella T, Lezoualc’h F, et al. Neuroprotection against oxidative stress by estrogens:
structure- activity relationship. Mol Pharmacol 1997; 51:535-41.

Chapter 5
166
31. Singh M, Meyer EM, Simpkins JW. The effect of ovariectomy and estradiol replacement on
brain-derived neurotrophic factor messenger ribonucleic acid expression in cortical and hippo-
campal brain regions of female Sprague-Dawley rats. Endocrinology 1995; 136:2320-4.
32. Geerlings MI, Ruitenberg A, Witteman JC, et al. Reproductive period and risk of dementia in
postmenopausal women. JAMA 2001; 285:1475-81.
33. Geerlings MI, Launer LJ, de Jong FH, et al. Endogenous estradiol and risk of dementia in
women and men: the Rotterdam Study. Ann Neurol 2003; 53:607-15.
34. Shumaker SA, Legault C, Thal L, et al. Estrogen plus progestin and the incidence of dementia
and mild cognitive impairment in postmenopausal women: the Women’s Health Initiative Mem-
ory Study: a randomized controlled trial. JAMA 2003; 289:2651-62.
35. Mulnard RA, Cotman CW, Kawas C, et al. Estrogen replacement therapy for treatment of mild
to moderate Alzheimer disease: a randomized controlled trial. JAMA 2000; 283:1007-15.
36. Hodgin JB, Maeda N. Minireview: estrogen and mouse models of atherosclerosis. Endocrinol-
ogy 2002; 143:4495-501.
37. Beral V, Banks E, Reeves G. Evidence from randomised trials on the long-term effects of hor-
mone replacement therapy. Lancet 2002; 360:942-4.
38. Herrington DM, Howard TD, Hawkins GA, et al. Estrogen-receptor polymorphisms and effects
of estrogen replacement on high-density lipoprotein cholesterol in women with coronary dis-
ease. N Engl J Med 2002; 346:967-74.
39. Herrington DM, Howard TD, Brosnihan KB, et al. Common estrogen receptor polymorphism
augments effects of hormone replacement therapy on E-selectin but not C-reactive protein.
Circulation 2002; 105:1879-82.
40. Shearman AM, Cupples LA, Demissie S, et al. Association between estrogen receptor α gene
variation and cardiovascular disease. JAMA 2003; 290:2263-70.
41. Vitek MP, Bhattacharya K, Glendening JM, et al. Advanced glycation end products contribute to
amyloidosis in Alzheimer disease. Proc Natl Acad Sci U S A 1994; 91:4766-70.
42. Gasparini L, Netzer WJ, Greengard P, Xu H. Does insulin dysfunction play a role in Alzheimer’s
disease? Trends Pharmacol Sci 2002; 23:288-93.
43. Ledesma MD, Bonay P, Colaco C, Avila J. Analysis of microtubule-associated protein tau glyca-
tion in paired helical filaments. J Biol Chem 1994; 269:21614-9.
44. Frölich L, Blum-Degen D, Bernstein HG, et al. Brain insulin and insulin receptors in aging and
sporadic Alzheimer’s disease. J Neural Transm 1998; 105:423-38.
45. Liolitsa D, Powell J, Lovestone S. Genetic variability in the insulin signalling pathway may con-
tribute to the risk of late onset Alzheimer’s disease. J Neurol Neurosurg Psychiatry 2002;
73:261-6.
46. Farris W, Mansourian S, Chang Y, et al. Insulin-degrading enzyme regulates the levels of insulin,

General discussion
167
amyloid ß-protein, and the ß-amyloid precursor protein intracellular domain in vivo. Proc Natl
Acad Sci U S A 2003; 100:4162-7.
47. Prince JA, Feuk L, Gu HF, et al. Genetic variation in a haplotype block spanning IDE influences
Alzheimer disease. Hum Mutat 2003; 22:363-71.
48. Forstl H, Zerfass R, Geiger-Kabisch C, Sattel H, Besthorn C, Hentschel F. Brain atrophy in normal
ageing and Alzheimer’s disease. Volumetric discrimination and clinical correlations. Br J Psy-
chiatry 1995; 167:739-46.
49. Peters A. The effects of normal aging on myelin and nerve fibers: a review. J Neurocytol 2002;
31:581-93.
50. Liu RS, Lemieux L, Bell GS, et al. A longitudinal study of brain morphometrics using quantitative
magnetic resonance imaging and difference image analysis. Neuroimage 2003; 20:22-33.
51. Bobinski M, de Leon MJ, Wegiel J, et al. The histological validation of post mortem magnetic
resonance imaging- determined hippocampal volume in Alzheimer’s disease. Neuroscience
2000; 95:721-5.
52. Scott SA, DeKosky ST, Sparks DL, Knox CA, Scheff SW. Amygdala cell loss and atrophy in
Alzheimer’s disease. Ann Neurol 1992; 32:555-63.
53. Jack CR, Jr., Dickson DW, Parisi JE, et al. Antemortem MRI findings correlate with hippocampal
neuropathology in typical aging and dementia. Neurology 2002; 58:750-7.
54. Convit A, Wolf OT, Tarshish C, De Leon MJ. Reduced glucose tolerance is associated with poor
memory performance and hippocampal atrophy among normal elderly. Proc Natl Acad Sci
U S A 2003; 100:2019-2022.
55. Braak H, Braak E. Neuropathological stageing of Alzheimer-related changes. Acta Neuropathol
1991; 82:239-59.
56. Schulingkamp RJ, Pagano TC, Hung D, Raffa RB. Insulin receptors and insulin action in the
brain: review and clinical implications. Neurosci Biobehav Rev 2000; 24:855-72.
57. Petersen RC, Smith GE, Ivnik RJ, Kokmen E, Tangalos EG. Memory function in very early Alz-
heimer’s disease. Neurology 1994; 44:867-72.
58. Scoville WB, Milner B. Loss of recent memory after bilateral hippocampal lesions. J Neuro
chem 1957; 20:11-21.
59. Strange BA, Fletcher PC, Henson RN, Friston KJ, Dolan RJ. Segregating the functions of human
hippocampus. Proc Natl Acad Sci U S A 1999; 96:4034-9.
60. Maguire EA, Gadian DG, Johnsrude IS, et al. Navigation-related structural change in the hip-
pocampi of taxi drivers. Proc Natl Acad Sci U S A 2000; 97:4398-403.
61. Fox NC, Warrington EK, Seiffer AL, Agnew SK, Rossor MN. Presymptomatic cognitive defi-
cits in individuals at risk of familial Alzheimer’s disease. A longitudinal prospective study. Brain
1998; 121:1631-9.

Chapter 5
168
62. Squire LR, Zola-Morgan S. The medial temporal lobe memory system. Science 1991; 253:1380-
6.
63. Hamann S, Monarch ES, Goldstein FC. Impaired fear conditioning in Alzheimer’s disease. Neu-
ropsychologia 2002; 40:1187-95.
64. Mori E, Ikeda M, Hirono N, Kitagaki H, Imamura T, Shimomura T. Amygdalar volume and emo-
tional memory in Alzheimer’s disease. Am J Psychiatry 1999; 156:216-22.
65. Lopez OL, Becker JT, Sweet RA, et al. Psychiatric symptoms vary with the severity of dementia
in probable Alzheimer’s disease. J Neuropsychiatry Clin Neurosci 2003; 15:346-53.
66. Sheline YI. Neuroimaging studies of mood disorder effects on the brain. Biol Psychiatry 2003;
54:338-52.
67. MacQueen GM, Campbell S, McEwen BS, et al. Course of illness, hippocampal function, and
hippocampal volume in major depression. Proc Natl Acad Sci U S A 2003; 100:1387-92.
68. Lee SH, Payne ME, Steffens DC, et al. Subcortical lesion severity and orbitofrontal cortex vol-
ume in geriatric depression. Biol Psychiatry 2003; 54:529-33.
69. Visser PJ, Verhey FR, Hofman PA, Scheltens P, Jolles J. Medial temporal lobe atrophy predicts
Alzheimer’s disease in patients with minor cognitive impairment. J Neurol Neurosurg Psychia-
try 2002; 72:491-7.
70. Duchesne S, Pruessner JC, Collins DL. Appearance-based segmentation of medial temporal
lobe structures. Neuroimage 2002; 17:515-31.
71. Braak H, Braak E. Frequency of stages of Alzheimer-related lesions in different age categories.
Neurobiol Aging 1997; 18:351-7.
72. Mayeux R, Honig LS, Tang MX, et al. Plasma Aß40 and Aß42 and Alzheimer’s disease: relation
to age, mortality, and risk. Neurology 2003; 61:1185-90.
73. Sun YX, Minthon L, Wallmark A, Warkentin S, Blennow K, Janciauskiene S. Inflammatory mar-
kers in matched plasma and cerebrospinal fluid from patients with Alzheimer’s disease. Dement
Geriatr Cogn Disord 2003; 16:136-44.
74. Fischl B, Salat DH, Busa E, et al. Whole brain segmentation: automated labeling of neuroana-
tomical structures in the human brain. Neuron 2002; 33:341-55.
75. Poduslo JF, Wengenack TM, Curran GL, et al. Molecular targeting of Alzheimer’s amyloid
plaques for contrast-enhanced magnetic resonance imaging. Neurobiol Dis 2002; 11:315-29.
76. Bookheimer SY, Strojwas MH, Cohen MS, et al. Patterns of brain activation in people at risk for
Alzheimer’s disease. N Engl J Med 2000; 343:450-6.
77. Kuusisto J, Koivisto K, Mykkänen L, et al. Association between features of the insulin resis-
tance syndrome and Alzheimer’s disease independently of apolipoprotein ε4 phenotype: cross
sectional population based study. BMJ 1997; 315:1045-9.
78. Krishnan KR, Charles HC, Doraiswamy PM, et al. Randomized, placebo-controlled trial of the

Summary


Summary
171
Alzheimer’s disease is a common disorder in the elderly that is clinically characterized by an in-
sidious onset of memory decline followed by progressive decline in other cognitive domains.
The cause of the disease is still largely unknown. From pathological studies it has become
clear that damage to the brain occurs long before the onset of symptoms. Therefore, the em-
phasis of the studies described in this thesis was on brain changes during this preclinical pe-
riod as visualized with magnetic resonance imaging (MRI) of the brain. The studies performed
are part of the Rotterdam Scan Study, a population-based study among almost 1100 elderly
who had no symptoms of dementia at time of MRI. On the MRI scans, we visualized the
extent of brain atrophy, both generalized brain atrophy and of the hippocampus and amygdala,
structures highly affected by Alzheimer pathology early in the disease. By establishing deter-
minants of brain atrophy, we hoped to provide some clues on the pathogenesis of Alzheimer’s
disease. Addtionally, we studied whether brain atrophy on MRI is clinically characterized by a
decline in memory function, and whether it indicates an increased risk of developing clinically
evident Alzheimer’s disease and depression.
Chapter 2.1 and 2.2 illustrate the relationship between blood pressure and brain atrophy
on MRI, both generalized atrophy and regional atrophy of the hippocampus and amygdala.
Either a high or low diastolic blood pressure level was associated with increased brain atro-
phy. The biological mechanisms for these associations are still unknown, we provide some
possible explanations. Chapter 2.3 focuses on plasma homocysteine levels, as high levels
of this amino acid have been associated with clinical Alzheimer’s disease. Elderly with high
plasma homocysteine levels were found to have more hippocampal and global brain atrophy
on MRI. Chapter 2.4 addresses the association between alcohol intake and both cerebro-
vascular disease and hippocampal and amygdalar atrophy on MRI. Light-to-moderate alcohol
consumers have a lower risk of dementia compared to abstainers, particularly of vascular
dementia. In accordance, we found a lower prevalence of cerebrovascular disease on MRI in
light-to-moderate alcohol consumers compared to abstainers. Overall there was no effect of
the degree of alcohol intake on hippocampal and amygdalar atrophy on MRI. However, within
apolipoprotein E (APOE) ε4 carriers, light-to-moderate alcohol consumers had less atrophy
compared to abstainers. This finding is in agreement with recent reports that APOE ε4 carri-
ers who consume light-to-moderate amounts of alcohol have a reduced risk of Alzheimer’s
disease compared to ε4 carriers who abstain. In chapter 2.5, we studied the effect of the
APOE genotype on degree of brain atrophy on MRI. Individuals with the ε4 allele, which is the
risk allele in Alzheimer’s disease, had more hippocampal and amygdalar atrophy but not more
global brain atrophy compared to persons with the common ε3ε3 genotype.
In chapter 3.1, a study on plasma estradiol levels and hippocampal atrophy on MRI and mem-
ory performance is described. Based on animal studies showing beneficial effects of estrogen
on hippocampal neurons, we formed the hypothesis that higher estradiol levels would be

Summary
172
associated with less hippocampal atrophy and better memory performance. This hypothesis
was however not confirmed. The effect of polymorphisms in the estrogen receptor α gene
on atrophy and risk of dementia is investigated in chapter 3.2. While the polymorphism was
not associated with the risk of dementia, we found that women with certain genetic varia-
tions had smaller amygdalar volume on MRI. Chapter 3.3 reports on the association between
diabetes mellitus, insulin resistance and atrophy of the hippocampus and amygdala on MRI.
Persons with diabetes mellitus had more atrophy on MRI compared to persons without dia-
betes mellitus. Furthermore, in non-diabetic persons, insulin resistance was associated with
amygdalar atrophy on MRI.
Chapter 4.1 provides evidence that persons with more hippocampal atrophy on MRI perform
worse on memory performance tasks. In particular, smaller hippocampal head volume was
associated with decreased performance on a verbal learning task. In chapter 4.2 we validated
in our sample the assumption that atrophy on MRI could be observed in the preclinical period
of Alzheimer’s disease. Atrophy on MRI of either the hippocampus or amygdala predicted the
development of clinical dementia within six years, even when persons were cognitively intact
at time of MRI. In contrast, in chapter 4.3 we show that hippocampal and amygdalar atrophy
do not predict depression. However, frontal atrophy was associated with an increased risk of
depression.
Finally, in chapter 5, methodological issues, the main findings and their implications, and sug-
gestions for further research are discussed.

Samenvatting


Samenvatting
175
De ziekte van Alzheimer is een veelvoorkomende ziekte in ouderen. Patiënten met de ziekte
van Alzheimer merken een sluipende achteruitgang in geheugenfunctie waarna verslechtering
van andere cognitieve functies volgt. De oorzaak van de ziekte is nog grotendeels onbekend.
Uit pathologische studies is gebleken dat schade aan de hersenen reeds lang voor het begin
van symptomen aanwezig is. We legden daarom in dit proefschrift de nadruk op veranderingen
in de hersenen tijdens deze preklinische periode, zichtbaar gemaakt met behulp van “mag-
netic resonance imaging” (MRI) van de hersenen. De studies in dit proefschrift maken deel uit
van de Rotterdam Scan Study, een studie onder bijna 1100 ouderen die ten tijde van de MRI
geen klinische symptomen van dementie hadden. Op de MRI kwantificeerden we zowel ge-
generaliseerde hersenatrofie, als atrofie van de hippocampus en amygdala, hersenstructuren
die vroeg in het beloop van de ziekte van Alzheimer zijn aangedaan. Door het vinden van risi-
cofactoren voor hersenatrofie, hoopten wij meer inzicht te krijgen in de ontstaanswijze van de
ziekte van Alzheimer. Daarnaast bestudeerden we de vraag of hersenatrofie op MRI klinisch
gekenmerkt wordt door geheugenachteruitgang, en of het een verhoogd risico op het krijgen
van klinische symptomen van de ziekte van Alzheimer of een depressie aangeeft.
Hoofdstuk 2.1 en 2.2 illustreren het verband tussen bloeddruk en hersenatrofie, zowel ge-
generaliseerde atrofie als specifieke atrofie van de hippocampus en amygdala. Een hoge- en
een lage diastolische bloeddruk stonden beide in verband met meer hersenatrofie. De pre-
cieze mechanismen van deze associaties zijn nog onbekend, we geven enkele mogelijke ver-
klaringen. Hoofdstuk 2.3 bestudeert het plasma homocysteine gehalte aangezien een hoge
concentratie van dit aminozuur mogelijk een verhoogd risico van de ziekte van Alzheimer
geeft. Ouderen met hogere plasma homocysteine concentraties hebben meer hippocampus
en gegeneraliseerde hersenatrofie op MRI. Hoofdstuk 2.4 kijkt naar de associatie tussen
alcohol consumptie en zowel cerebrovasculaire schade als hippocampus en amygdala atrofie.
Ouderen die licht tot matig alcohol consumeren hebben een lager risico van dementie in
vergelijking met geheel onthouders, in het bijzonder van vasculaire dementie. In dit kader
vonden wij eveneens minder cerebrovasculaire schade op MRI in mensen die licht tot matig
alcohol consumeren. Er was geen verband tussen alcohol consumptie en ernst van hippo-
campus of amygdala atrofie op MRI. Echter, in mensen die het ε4 allel van het apolipopro-
tein E (APOE) gen hebben, is lichte tot matige alcohol consumptie geassocieerd met minder
atrofie. In hoofdstuk 2.5 bestuderen we het effect van het APOE genotype op de mate van
hersenatrofie op MRI. Ouderen met het ε4 allel, het risico allel in de ziekte van Alzheimer,
hebben meer hippocampus en amygdala atrofie, maar niet meer gegeneraliseerde atrofie, in
vergelijking met ouderen met het ε3ε3 genotype.
In hoofdstuk 3.1 beschrijven we een studie naar het verband tussen plasma oestrogenen
concentratie, hippocampus atrofie en geheugen functie. Dierexperimenteel onderzoek heeft
veelal positieve effecten van oestrogenen op neuronen in de hippocampus laten zien, dus

Samenvatting
176
we formuleerden de hypothese dat ouderen met hogere plasma oestrogenen concentraties
minder hippocampus atrofie zouden hebben, en beter zouden presteren op geheugen taken.
Deze hypothese konden we echter niet bevestigen. Het effect van een genetische variatie in
het gen van de oestrogeenreceptor α op atrofie en risico van dementie werd onderzocht in
hoofdstuk 3.2. Alhoewel deze genetische variant niet met het risico van dementie in verband
staat, hebben vrouwen met een bepaalde genetische variatie kleinere amygdala volumes.
Hoofdstuk 3.3 laat het verband zien tussen diabetes mellitus, insuline resistentie en hip-
pocampus atrofie op MRI. Ouderen met diabetes mellitus hebben meer atrofie op MRI in
vergelijking met ouderen zonder diabetes mellitus. In personen zonder diabetes mellitus, is
insuline resistentie een risico factor voor amygdala atrofie.
Hoofdstuk 4.1 laat zien dat ouderen met meer hippocampus atrofie op MRI slechter pres-
teren op geheugen taken. Specifiek atrofie van het “head” gedeelte van de hippocampus
staat in verband met verminderde prestaties op een verbale geheugen taak. In hoofdstuk 4.2
bestudeerden wij onze assumptie dat atrofie op MRI tijdens de preklinische periode van de
ziekte van Alzheimer aanwezig is. Atrofie van de hippocampus of amygdala op MRI voorspelt
de ontwikkeling van dementie zes jaar later, zelfs wanneer ouderen ten tijde van de MRI cog-
nitief goed functioneren. In hoofdstuk 4.3 tonen wij aan dat hippocampus of amygdala atrofie
geen voorspeller is van een depressie. Echter, de aanwezigheid van frontale atrofie op MRI
geeft een verhoogd risico van depressie aan.
In hoofdstuk 5 worden enkele methodologische aspecten, de belangrijkste bevindingen en
hun implicaties, en suggesties voor verder onderzoek besproken.

177

178
Dankwoord
Dit proefschrift zou er nooit gekomen zijn zonder de inzet en steun van vele mensen die ik
hierbij wil bedanken.
Alle deelnemers van de Rotterdam Scan Studie wil ik graag bedanken voor hun geheel be-
langeloze deelname aan alle onderzoeken.
Mijn promotoren Prof. dr. M.M.B. Breteler en Prof. dr. A. Hofman. Beste Monique, ik ben
blij dat je me zes jaar geleden als jong studentje hebt aan durven nemen voor dit onderzoek.
Terwijl ik soms nog met mijn hoofd bij de co-schappen zat, stuurde je me altijd snel en ge-
focust weer de juiste richting van het onderzoek in. Ik heb ontzettend veel van je geleerd in
al die jaren en hoop met je te kunnen blijven samenwerken in de nog grotere MRI studie.
Beste Bert, de colleges tijdens mijn geneeskunde studie gaf je zo gedreven dat ik eens op
de 21ste verdieping ben gaan kijken. Vele goede jaren op jouw afdeling volgden, waarbij je
dit enthousiasme voor het onderzoek bleef uitstralen en geïnteresseerd mijn manuscripten
beoordeelde.
Prof. dr. P.J. Koudstaal, het snelle, en ook nog eens erg nuttige, commentaar op manuscripten
was fantastisch. Ik verheug me erop door jou en Prof. dr. P.A.E. Sillevis Smit te worden opge-
leid tot neuroloog.
Prof.dr. M. Oudkerk wil ik graag bedanken voor het beschikbaar stellen van de MRI unit om
alle mensen te scannen. Bart en Peter bleven onverstoorbaar alle deelnemers in de avond-
uren en weekenden scannen. Dr. Eric Achten wil ik bedanken voor zijn hartelijke ontvangst in
Gent, waar hij mij het meten van de hippocampus heeft geleerd. Freek Hoebeek, jij hebt je
ontpopt tot ware “hippocampus meetexpert”. Bedankt dat je door het zetten van de vele, vele
rondjes op de MRI scans mij voor RSI hebt behoed.
I would like to thank dr. Ingmar Skoog for the hospitality of his institute in Göteborg, Sweden
and the nice collaboration. Prof. dr. M.S. Albert, Prof. dr. J.G.G. Borst, Dr. L.J. Launer, Prof.dr.
H.A.P. Pols, thank you for sitting in my thesis committee. All co-authors of the papers in this
thesis: thank you for the numerous valuable comments.
Het opnieuw zien van alle deelnemers op de onderzoekscentra liep zeer soepel door de grote
inzet van Saskia Hoornweg, Bernadette van Ast, Els Halbmeijer en Ingrid van Vuuren. Anneke
en Joke waren op de onderzoekscentra in Ommoord en Zoetermeer aanwezig voor de warme
ontvangst van de deelnemers.
De mannen van de automatisering en data management: Eric, Nano, René, Frank, René en
Marcel waren onmisbaar voor de dagelijkse computerhulp en het opzetten van het compu-
tersysteem in Zoetermeer. Theo, Maria, Lidia, Bettina en Maarten, bedankt dat ik altijd even
kon binnenlopen voor een statistische vraag. Marga en Marti, dank jullie voor het vele werk
verricht op het secretariaat.

179
Het afwisselen tussen co-schappen en onderzoek was niet altijd even makkelijk, maar op de
afdeling Epidemiologie & Biostatistiek voelde ik me snel weer thuis bij de gezelligheid van
vele collega’s. Als student kwam ik terecht op een kamer met Jan Cees de Groot, Frank-Erik
de Leeuw en Sanjay Harhangi. JeCe en FE hebben me van koffiezet student tot ware sigaar-
roker en whiskydrinker gemaakt. JeCe, jouw uitspraak “Als het makkelijk was zou iedereen
het doen” heb ik tijdens mijn onderzoek vele malen in mijn hoofd gehad. Sarah Vermeer
kwam op de kamer om samen met mij het vervolgonderzoek op te zetten. Sarah, dank je voor
je strakke organisatie en lijstjes, zonder welke ik waarschijnlijk nu nog niet begonnen was met
het zien van alle mensen. Ik kijk er naar uit om weer je collega op de neurologie te worden.
Leuk dat je nu bij mij paranimph bent! Ingrid, gezellig dat je een tijd op onze kamer bleef
hangen om alle papieren te ordenen, helaas zijn nu echt de plantjes dood... Met de komst
van Ewoud van Dijk en Niels Prins veranderde de kamer weer in een mannenkamer met de
bijbehorende sfeer. De artsenkamer op de neurologie wordt vast zo gezellig met jullie. Finally,
Bess Leroy; I have never seen someone stalk for information so kindly as you do, thanks also
for revising the English of the manuscripts.
Buiten de kamergenoten waren er ook nog vele andere mede-promovendi en collegae die de
goede sfeer op de afdeling maakten. Een aantal wil ik hierbij noemen. Natuurlijk de mede-
neuroten: Sandra, Annemieke, Monika, Marianne, Henning, Mirjam, Frank-Jan, Lonneke,
Marjolein, Marieke en Michiel waarmee ik de liefde voor de hersenen kon delen. Het loopje
naar de genetische epidemiologie op de 22e verdieping leidde altijd tot leuke discussies met
Gerwin Roks onder het genot van een kop koffie. Gerwin, ik geef je nu toch gelijk; het is
amyloid en niet tau! De genepi opvolgers Anna, Kristel, Marie-Josee en Ingrid hebben me
ingewijd in de vele thee smaken. Ingrid bedankt dat ik tijdens mijn co-schap in Breda een
logeerplekje had. Met Hok, Simone en Stephanie heb ik naast vele borrels ook nog de laatste
promotieperikelen meegemaakt.
Jeroen, hoewel ik geen Apple kocht, was je gelukkig toch bereid vele uren te steken in de lay-
out van mijn boekje. Gwenda, bedankt voor de prachtige tekening op de cover.
Pap en mam, dank voor jullie onvoorwaardelijke steun ondanks dat jullie je wel eens afvroegen
wanneer ik nou gewoon arts werd. Mijn broers Rik, Wouter en Koen geweldig dat jullie totaal
iets anders dan geneeskunde doen, helaas kunnen jullie niet alle drie naast me staan tijdens
de verdediging.
Lieve Martine, de afgelopen jaren waren niet altijd even makkelijk maar jij stond altijd voor me
klaar wanneer het nodig was. Bedankt voor alles buiten dit proefschrift.

180

181
Publications
den Heijer T, Launer LJ, de Groot JC, de Leeuw F-E, Oudkerk M, van Gijn J, Hofman A,
Breteler MMB. Serum carotenoids and cerebral white matter lesions: The Rotterdam Scan
Study. Journal of American Geriatrics Society 2001;49:642-646.
den Heijer T, Oudkerk M, Launer LJ, van Duijn CM, Hofman A, Breteler MMB. Hippocam-
pal, amygdalar and global brain atrophy in different apolipoprotein E genotypes. Neurology
2002;59:746-748.
den Heijer T, Vermeer SE, Clarke R, Oudkerk M, Koudstaal PJ, Hofman A, Breteler MMB.
Homocysteine and brain atrophy on MRI of non-demented elderly. Brain 2003;126:170-175.
den Heijer T, Skoog I, Oudkerk M, de Leeuw FE, de Groot JC, Hofman A, Breteler MMB.
Association between blood pressure levels over time and brain atrophy in the elderly. Neuro-
biology of Aging 2003;24:307-313
den Heijer T, Geerlings MI, Hofman A, de Jong FH, Launer LJ, Pols HAP, Breteler MMB.
Higher estrogen levels are not associated with larger hippocampi and better memory per-
formance. Archives of Neurology 2003;60:213-220.
den Heijer T, Vermeer SE, van Dijk EJ, Prins ND, Koudstaal PJ, Hofman A, Breteler MMB.
Type 2 diabetes and atrophy of medial temporal lobe structures on brain MRI. Diabetologia
2003;46:1604-1610.
Hackert VH, den Heijer T, Oudkerk M, Koudstaal PJ, Hofman A, Breteler MMB. Hippocampal
head size associated with verbal memory performance in nondemented elderly. NeuroImage
2002; 17:1365-1372.
Prins ND, den Heijer T, Hofman A, Koudstaal PJ, Jolles J, Clarke R, Breteler MMB. Homo-
cysteine and cognitive function in the elderly. The Rotterdam Scan Study. Neurology 2002;
59:1375-1380.
Sijens PE, den Heijer T, de Leeuw F-E, de Groot JC, Achten E, Heijboer RJJ, Hofman A,
Breteler MMB, Oudkerk M. MR spectroscopy detection of lactate and lipid signals in the
brains of healthy elderly people. European Radiology 2001;11:1495-1501.

182
Sijens PE, den Heijer T, de Leeuw F-E, de Groot JC, Achten E, Heijboer RJJ, Hofman A,
Breteler MMB, Oudkerk M. Human brain chemical shift imaging at age 60-90: analysis of
the causes of the observed sex differences in brain metabolites. Investigative Radiology
2001;36:597-603.
Sijens PE, den Heijer T, Origgi D, Vermeer SE, Breteler MMB, Hofman A, Oudkerk M. Brain
Changes with Aging: MR Spectroscopy at Supraventricular Plane Shows Differences be-
tween Women and Men. Radiology 2003; 226:889-896.
Vermeer SE, den Heijer T, Koudstaal PJ, Oudkerk M, Hofman A, Breteler MMB. Incidence
and risk factors of silent brain infarcts in the population-based Rotterdam Scan Study. Stroke
2003;34:392-396.
Bakker SLM, de Leeuw FE, den Heijer T, Hofman A, Koudstaal PJ, Breteler MMB. Cerebral
hemodynamics in the elderly. Neuroepidemiology (in press).
Prins ND, van Dijk EJ, den Heijer T, Vermeer SE, Hofman A, Koudstaal PJ, Breteler MMB. Cer-
ebral small vessel disease and dementia. Archives of Neurology (in press).
Vermeer SE, Prins ND, den Heijer T, Hofman A, Koudstaal PJ, Breteler MMB. Silent brain
infarcts and the risk of dementia and cognitive decline. New England Journal of Medicine
2003;348:1215-1222.

183
About the author
Tom den Heijer was born on February 9, 1976 in Rotterdam. He attended secondary school at
the Blaise Pascal in Spijkenisse, which he passed in 1994. That same year, he started medical
school at Erasmus University, Rotterdam. He obtained a Master’s degree in Medicine in 1999
and started the work described in this thesis at the Department of Epidemiology & Biostatis-
tics of Erasmus University, Rotterdam (Prof. dr. M.M.B. Breteler and Prof. dr. A. Hofman). As
part of this project he visited the Institute of Clinical Neuroscience, University of Göteborg,
Sweden (head Dr. I. Skoog). In 2001, he obtained a Master of Science degree in Clinical Epi-
demiology at the Netherlands Institute for Health Sciences for which he followed courses at
Tufts University, Boston, USA. In February 2003, he became a medical doctor. March 1, 2004,
he started his neurology training at Erasmus MC, Rotterdam (head: Prof. dr. P.A.E. Sillevis
Smitt).