catalytic coal gasification in a draft-tube spouted bed … archive/files... · · 2006-02-09this...
TRANSCRIPT

CATALYTIC COAL GASIFICATION IN A DRAFT-TUBE SPOUTED BED BY USING CERAMIC PARTICLES AS A THERMAL MEDIUM
Yoshimitsu Uemura. Masahiko Miyauchi, Shigeho Tanaka. Kazuya Ijichi. Yasuhiko Tanaka. Desmond F. King* and Yasuo Hatate
Department of Applied Chemistry and Chemical Engineering. Kagoshima University, Kohrimoto. Kagoshima 890. Japan Chevron Research & Engineering Company, 100 Chevron Way, Richmond, 94802 California, USA
Keywords: Coal, Gasification, Spouted bed, Draft tube, Ceramic
INTRODUCTION
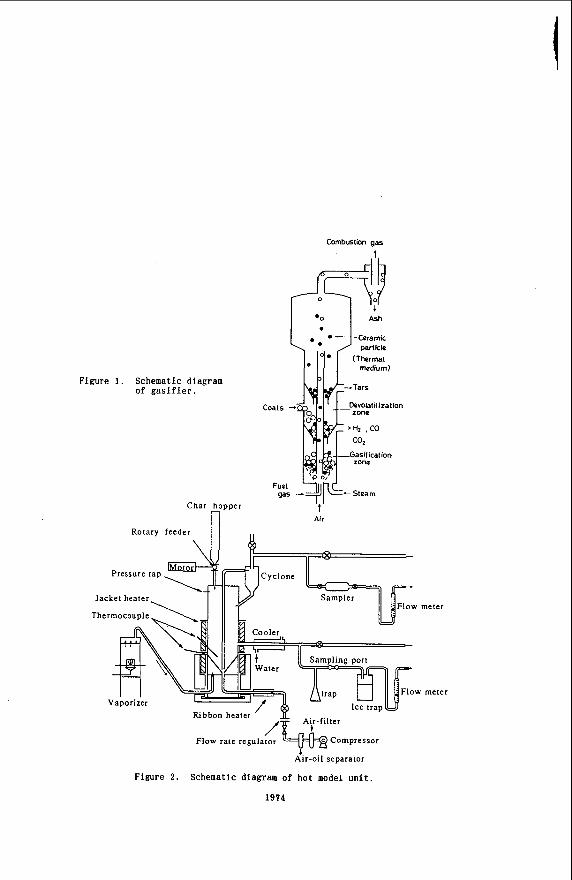
Steam gasification of coal is thought to be an important future process for production of hydrogen, which is a nonpolluting energy. We have proposed a draft-tube spouted bed type reactor as a catalytic coal gasifier to produce hydrogen.(L) Some minor modifications have been applied to concept of the gasifier. The schematic diagram of the gasifier is illustrated in Fig. 1. In this apparatus, coal i s fed to the devolatilization zone in the annulus section. After devolatilization, the char falls into next zone and is gasified by steam supplied from bottom conical section. The heat of gasifi- cation is supplied mainly from circulating ceramic particles. which obtains thermal energy from burning gas within the draft tube and returns to the annulus top.
In previous studies (u), cold model experiments were carried out by using an acrylic cylindrical apparatus and by using an acrylic semi-cylindrical one. From the results, flow regimes in a spouted bed with a draft tube were clarified, and several correlations concerning the annulus gas velocity and particles circulation rate were proposed for each flow regime. In next step (4). a cold model apparatus, which has the same dimensions as those of the hot model apparatus used in this study, was constructed and was employed to obtain basic data for the hot model operation.
In this paper, we present the results obtained by operating a hot model apparatus of a spouted bed with a draft tube at 1073 K. The hot model unit was heated by electric furnace in the present study, while the unit was designed in consideration of mass and heat balance.
EXPERIMENTAL
Catalytic steam gasification was carried out in a spouted bed with a draft tube shown in Fig. 2 . Figure 3 is the photograph of the unit. The bed was heated by four pieces of electric furnace, which surrounded the bed as shown in Fig. 4 . The unit includes a stainless steel spouted bed (150 mm I.D.) with a stainless steel coaxial draft tube (10.9 mm I.D.). The draft tube spacing above the gas inlet nozzle (10.9 mm I.D.) was 3 mm. Air was intro- duced from the nozzle to spout and recirculate solid particles. The bottom of the column was a conical section with a cone angle of n / 3 rad. Steam was introduced through 40 holes (2.0 mm in diameter) located in the conical section. Figure 5 shows the top view of the bottom conical section before assembly. on the conical section. Draft tube was assembled as shown in Fig. 6 .
Steam inlet holes (20x2) are found to be arranged concentrically
1972
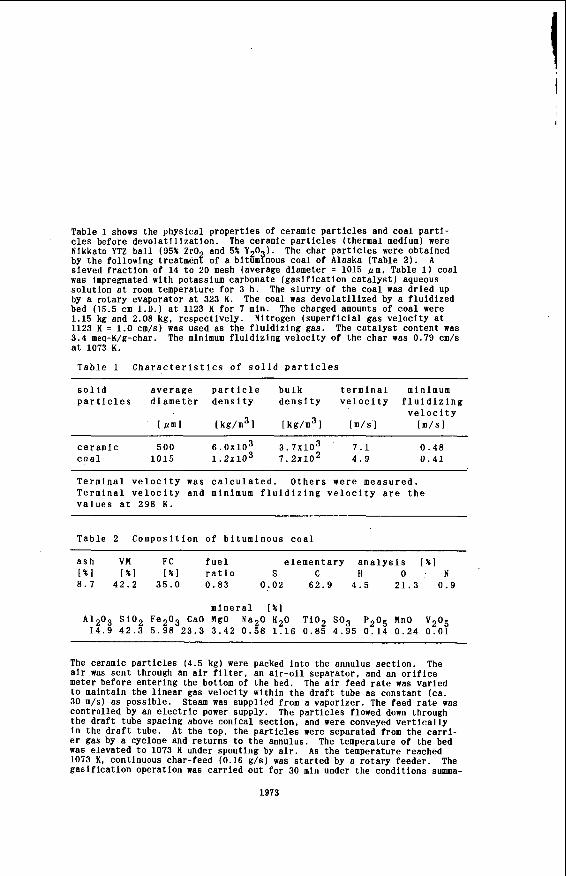
Table 1 shows the physical properties of ceramic particles and coal parti- cles before devolatilization. The ceramic particles (thermal medium) were Nikkato YTZ ball (95% ZrO and 5% Y 0 1. The char particles were obtained by the following treatmen2 of a bit&o?nous coal of Alaska (Table 2). sieved fraction of 14 to 20 mesh (average diameter = 1015 /.tu!, Table 1) coal was impregnated with potassium carbonate (gasification catalyst) aqueous solution at room temperature for 3 h. by a rotary evaporator at 323 K. bed (15.5 cm I . D . ) at 1123 K for 7 min. The charged amounts of coal were 1.15 kg and 2.08 kg. respectively. Nitrogen (superficial gas velocity at 1123 K = 1.0 cm/s) was used as the fluidizing gas. The catalyst content was 3.4 meq-K/g-char. The minimum fluidizing velocity of the char was 0.79 cm/s at 1073 K.
A
The slurry of the coal was dried up The coal was devolatilized by a fluidized
Table 1 Characteristics of s o l i d particles
solid average particle bulk terminal minimum particles diameter density density velocity fluidizing
velocity [ uml [kg/m31 [kg/m31 [ m / s l [m/sl
ceramic 500 6 . 0 ~ 1 0 ~ 3 . 7 ~ 1 0 ~ 7.1 0.48 coal 1015 1 . 2 ~ 1 0 ~ 7 . 2 ~ 1 0 ~ 4.9 0.41
Terminal velocity was calculated. Others were measured. Terminal velocity and minimum fluidizing velocity are the values at 298 K.
Table 2 Composition of bituminous coal __ ~~~~~ ~ ~
ash VM FC fuel elementary analysis [%I [ % I [ % I [%I ratio S C H 0 N 8 . 7 42.2 35.0 0.83 0.02 62.9 4.5 21.3 0.9
mineral [ % ] A1203 Si02 Fe2O3 CaO MgO NaZO K20 TiOZ SO3 P205 MnO V205 14.9 42.3 5.98 23.3 3.42 0.58 1.16 0.85 4.95 0.14 0.24 0.01
The ceramic particles (4.5 kg) were packed into the annulus section. The air was sent through an air filter, an air-oil separator, and an orifice meter before entering the bottom of the bed. The air feed rate was varied to maintain the linear gas velocity within the draft tube as constant (ca. 30 m/s) as possible. Steam was supplied from a vaporizer. The feed rate was controlled by an electric power supply. The particles flowed down through the draft tube spacing above conical section, and were conveyed vertically in the draft tube. At the top, the particles were separated from the carri- er gas by a cyclone and returns to the annulus. was elevated to 1073 K under spouting by air. As the temperature reached 1073 K, continuous char-feed (0.16 g/s) was started by a rotary feeder. The gasification operation was carried out for 30 min under the conditions summa-
1373
The temperature of the bed

rized In Table 3 . f Table 3 Experimental conditions
Gasification temperature 980-1100 K Packed amounts of ceramic particles Circulating rate of ceramic particles Feed rate of, char Feed rate of air Feed rate of steam Tube-cone clearance 3 ~ 1 0 - ~ m
Z;:O" kg/s 1 . 6 ~ 1 0 - ~ kg/s 2.8 N-m3/h 0.99 N-m3/h
RESULTS AND DISCUSSION
Flgure 7 shows the results of temperature and gas composition. The annulus bed temperature decreased with time. while the external temperature (between upper and lower jacket heater) was maintained at almost constant temperature (990 K). This means poor thermal conduction within the movlng bed of the annulus. The gaseous products were hydrogen, carbon monoxide. carbon diox- ide and methane as shown in Fig. 7 . Hydrogen and carbon monoxide were major products. Since the ratio Is unity approximately, the following reaction 1s thought to be major.
C(char) + H20 -> CO + HZ
The molar rate of (CO+CO2+CH4) produced was about 7 ~ 1 0 - ~ mol/s during the gasification operation. About half of the product gas was exhausted from the outlet of the annulus. Carbon feed rate was 8.5~10- mol/s, which was calculated from the char feed rate. 0.16 g/s. and carbon content of the char, 64wtX. From these values, we obtained the carbon conversion, ca. 80 Y .
The experimental data shows that the draft-tube spouted bed type gasifier Is superior to product hydrogen, while poor thermal conduction is a signifi- cant problem. Another problem is the bypassing of the product gas to the cyclone.
pother half was exhausted from the cyclone.
REFERENCES
1. Hatate, Y.; Uemura, Y.; Churei. S.; Imamura, S.; Ijichi, K . ; Tanaka. Y. and King. D.F.. Proceedings of Second Aslan Conference on Fluidized-Bed and Three-phase Reactors, 1990. 45.
2. Uemura, Y.: Churei, S.; Miyauchi, M.; Imamura. S.; Ijlchi. K . ; Tanaka, Y.; King, D.F. and Hatate. Y.."Circulating Fluidized Bed Technology 111". Pergamon Press, 1991, 645.
3 . Hatate, Y.: Uemura. Y.; Churei. S.; Miyauchi, M.; Ijichi, K . ; Tanaka. Y. and King, D.F., Conference Papers Fourth China-Japan Fluidization Symposium. 1991, 236.
4. Uemura, Y.; Miyauchi. M.; Tanaka, S.; Usukubo, M.: Ijichi, K . ; Tanaka, Y.; King. D.F. and Hatate, Y., Proceedings of Thlrd Asian Conference on Fluidlzed-Bed and Three-phase Reactors 1992. 45.
c
Combustion gas *
Figure 1. Schematic diagram of gasifier.
Coals
Fuel gas
Char hopper n
* O Ash
Air
Jacket heater
4 Air-oil separator
Figure 2. Schematic diagram of hot model unit.
1914

Figure 3 . Photograph of Figure 4 . Photograph of h o t model hot model u n i t . u n i t (under c o n s t r u c t i o n ) .
F igure 5 . Photograph o f bottom Figure 6 . Photograph o f bottom c o n i c a l c o n i c a l s e c t i o n . s e c t i o n w i t h d r a f t tube .
1975

L external temp.
900 -
particles bed of annulus
700
' O O r 80
6ol 40 I
A
co
Figure 7. Temperature and gas composition.
1976

6 CO + 3 H20 + C2HsOH + 4 C o p 2 C02 + 6 H2 + C2H5OH + 3 H20 4 CO + 2 H20 + CH3COOH + 2 COP 2 GO2 + 4 H2 + CH3COOH + 2 H20
BIOLIQUEFACTION OF COAL SYNTHESIS GAS
K. T. Klasson, M. D. Ackerson, E. C . Clausen, J. L. Gaddy Department of Chemical Engineering
University of Arkansas Fayetteville. AR 72701
Keywords: synthesis gas, ethanol, coal bioliquefaction
INTRODUCTION
Synthesis gas, a mixture of primarily CO, H2 and C o g . is a major building block in the production of fuels and chemicals. several sources, including coal, oil shale, tar sands, heavy residues, biomass or natural gas. of natural gas, although the partial oxidation of heavy liquids is also practiced (1). Only a small percentage of the synthesis gas currently produced is by gasification of solid fuels. reserves of coal in the United States (300 year supply at the current consumption rate (2)), synthesis gas production from coal will become an important technology in the future.
CO, C02 and H2 in synthesis gas may be used as substrates for the biological production of fuels and chemicals. The bacterium Rhodospirillum rubrum uses CO and water in producing H2 and C02 ( 3 , 4 ) . Peptostreptococcus productus (5) and Eubacterium limosum (6) convert GO, C o p and H2 to acetate. Butyribacterium methylotrophicum (7) and ethanol may be produced from GO, C02 and H2 by Clostridium ljungdahlii ( 8 , 9 ) .
The anaerobic bacterium C. ljungdahlii produces ethanol and acetate from GO, C02 and H2 by the equations ( 9 ) :
The gas may be produced from
Most synthesis gas is produced today by catalytic reforming
However, because of the large
Bacteria such as
Butanol may be produced from CO using the bacterium
The bacterium was isolated from animal waste, with the "wild" strain producing predominantly acetate in favor of ethanol. In fact, early studies showed an ethanol to acetate product ratio of 0.05 mol/mol and an ethanol concentration of less than 0.1 g/L ( 9 ) . A major research effort was undertaken to improve the product ratio and increase the ethanol concentration. Studies at decreased pH (to 4.0) and with yeast extract removed from the liquid medium resulted in product ratios of 0.8 and an ethanol concentration of 1.8 g/L in the CSTR (10).
The purpose of this paper is to present results of continuous laboratory studies with C. ljungdahlii in converting GO, GO2 and H2 in synthesis gas t o ethanol. substrate uptake are presented and discussed.
In addition, the effects of the sulfur gas H2S on growth and
1977
MATERIAIS AND WETHODS
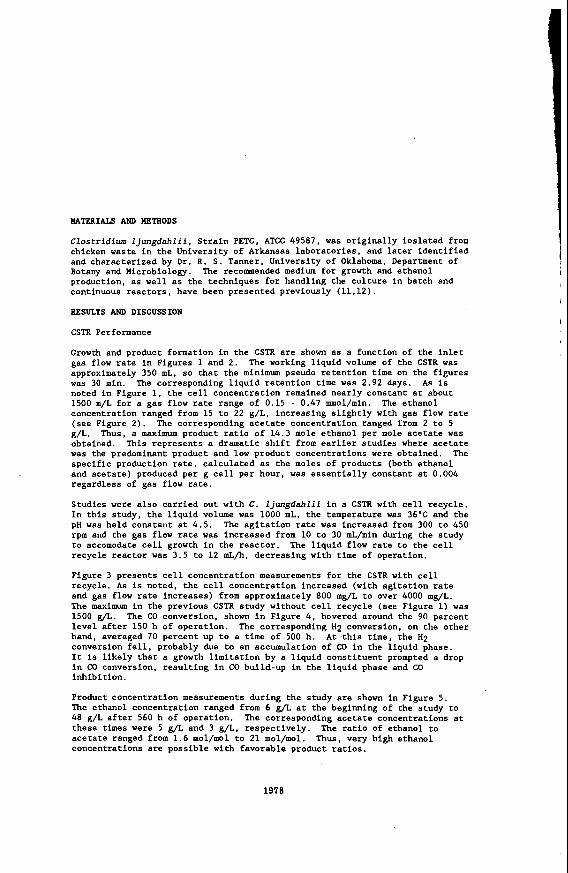
Clostridium ljungdahlii, Strain PETC, ATCC 49587, was originally ioslated from chicken waste in the University of Arkansas laboratories, and later identified and characterized by Dr. R. S. Tanner, University of Oklahoma, Department of Botany and Microbiology. production, as well as the techniques for handling the culture in batch and continuous reactors, have been presented previously (11,lZ).
RESULTS AND DISCUSSION
CSTR Performance
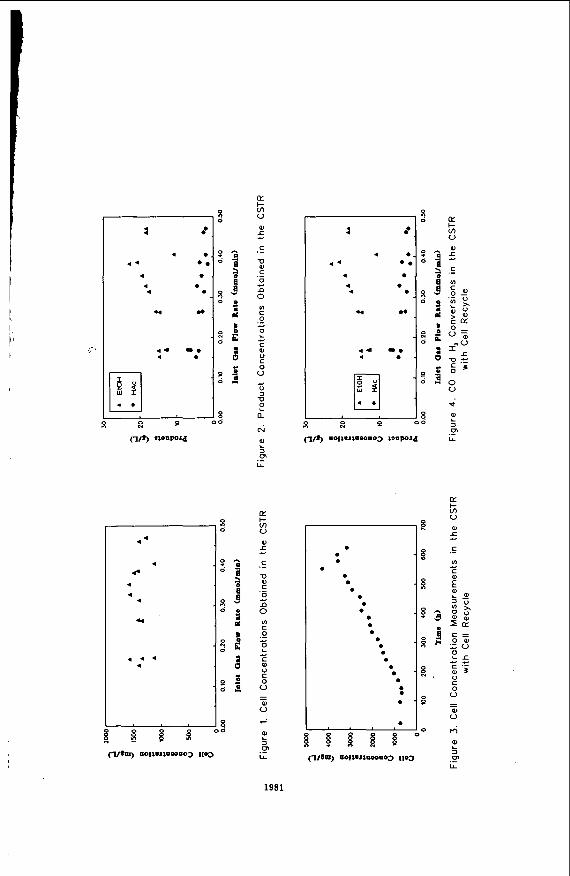
Growth and product formation in the CSTR are shown as a function of the inlet gas flow rate in Figures 1 and 2. approximately 350 mL, so that the minimum pseudo retention time on the figures was 30 min. noted in Figure 1, the cell concentration remained nearly constant at about 1500 m/L for a gas flow rate range of 0.15 - 0.47 mmol/min. The ethanol concentration ranged from 15 to 22 g/L, increasing slightly with gas flow rate (see Figure 2). g/L. obtained. was the predominant product and low product concentrations were obtained. specific production rate, calculated as the moles of products (both ethanol and acetate) produced per g cell per hour, was essentially constant at 0.004 regardless of gas flow rate.
Studies were also carried out with C. ljungdahlii in a CSTR with cell recycle. In this study, the liquid volume was 1000 mL, the temperature was 36'C and the pH was held constant at 4.5. The agitation rate was increased from 300 to 450 rpm and the gas flow rate was increased from 10 to 30 mL/min during the study to accomodate cell growth in the reactor. recycle reactor was 3.5 to 12 mL/h, decreasing with time of operation.
Figure 3 presents cell concentration measurements for the CSTR with cell recycle. As is noted, the cell concentration increased (with agitation rate and gas flow rate increases) from approximately 800 mg/L to over 4000 mg/L. The maximum in the previous CSTR study without cell recycle (see Figure 1) was 1500 g/L. The CO conversion, shown in Figure 4. hovered around the 90 percent level after 150 h of operation. The corresponding Hq conversion, on the other hand, averaged 70 percent up to a time of 500 h. At.this time, the Hp conversion fell, probably due to an accumulation of CO in the liquid phase. It is likely that a growth limitation by a liquid constituent prompted a drop in CO conversion, resulting in CO build-up in the liquid phase and CO inhibition.
Product concentration measurements during the study are shown in Figure 5. The ethanol concentration ranged from 6 g/L at the beginning of the study to 48 g/L after 560 h of operation. The corresponding acetate concentrations at these times were 5 g/L and 3 g/L, respectively. acetate ranged from 1.6 mol/mol to 21 mol/mol. concentrations are possible with favorable product ratios.
The recommended medium for growth and ethanol
The working liquid volume of the CSTR was
The corresponding liquid retention time was 2.92 days. As is
The corresponding acetate concentration ranged from 2 to 5 Thus, a maximum product ratio of 14.3 mole ethanol per mole acetate was
This represents a dramatic shift from earlier studies where acetate The
The liquid flow rate to the cell
The ratio of ethanol to Thus, very high ethanol
1978

I
Sulfur Gas Tolerance of C. ljungdahlii
Many bacterial cultures capable of converting CO to products have been found to be quite tolerant of the sulfur gases H2S and COS (13,14). Peptostreptococcus productus. for example, which converts CO to acetate, is able to successfully convert CO to acetate in the presence of 19.7 percent H2S or COS after culture acclimation. The methanogen Hethanobacterium formicicum, on the other hand, is able to tolerate only 6.6 percent H2S or COS. even this latter result is encouraging, since typical coal-derived synthesis gas contains only 1-2 percent sulfur gases, mainly as H2S.
C. ljungdahlii, grown in the presence of Na2S in place of cysteine-HC1 as the reducing agent for several weeks, was evaluated for its tolerance to H2S in batch bottle experiments. medium devoid'of yeast extract and adjusted to pH 4.3, were first gassed with synthesis gas to a pressure of 10.7 psig. The desired amount of H2S or COS (2.5 mL-20 mL) at 1 atm was then added. equilibrate overnight. As a final step, 10 mL of C. ljungdahlii were added prior to incubation at 34'C.
The effects of H2S on growth and substrate uptake by C. ljungdahlii are shown in Figures 6 and 7, respectively. As is noted in Figure 6, growth was not significantly slowed at H2S concentrations below 5.2 percent. Upon the addition of 9.9 percent H2S, however, growth essentially stopped. Similar results are noted with substrate uptake in the presence of H2S (see Figure 7). The presence of H2S slowed the rates of substrate uptake only slightly up to an H2S concentration at 5.2 mole percent. concentrations of COS up to 5.2 percent.
These concentrations are far in excess of maximum sulfur gas concentrations possible in coal synthesis gas. effects can be obtained with prolonged sulfur gas acclimation. for example, was only marginally tolerant of H2S and COS in initial studies. Concentrations up to 20 percent were tolerated after a period of acclimation to the sulfur gases.
CONCLUSIONS
Clostridium ljungdahlii was shown to grow on synthesis gas with the production of high concentrations of ethanol and acetic acid. The relative amounts of ethanol and acetate can be controlled by nutritional factors, substrate gas supply, and pH. of substrate gas. and minimal medium all favor ethanol production. cell recycle system has been shown to be effective in permitting the cell concentrations necessary for high concentrations of ethanol. concentration of 47 g/L with a corresponding acetate of 2 g/L has been attained. in concentrations exceeding typical levels in synthesis gas.
However,
The 155 mL bottles containing 50 mL of liquid
This batch system was allowed to
Similar results were obtained with
It should also be realized that dramatic P. productus,
Low pH (4.0 to 4.5). high mass transfer of an adequate supply A CSTR
An ethanol
Finally, C. ljungdahlii has been shown to be tolerant of H2S or COS
1979

ACKNOWLEDGMENT
Financial support for this research was provided by the U. S . Department of Energy, Pittsburgh Energy Technology Center, on contract DE-AC22-89PC898976,
LIST OF REFERENCES
1.
2 . 3.
4.
5.
6.
7.
8 .
9.
10.
11.
12.
13.
14.
Graboski, M. S . (1984), In Catalytic Conversion of Synthesis Gas and Alcohols to Chemicals, R. G . Herman (ed.) Plenum Press, New York, pp. 37- 50, Specks, R. and Klussmann, A . (1982). Energy Progress, 2, 60-65. Dashekvicz. M. P. and Uffen, R. L. (1979), J . Syst. Bacteriol.. 2, 145- 148. Klasson, K. T., Lundback. L. M. O . , Clausen, E. C.. and Gaddy, J . L. (1992). "Kinetics of Light Limited Growth and Biological Hydrogen Production from Carbon Monoxide and Water by Rhodospirillum rubrum," submitted for publication, J . Biotechnol. Lorowitz, W. H. and Bryant, M. P. (1984), Appl. Environ. Microbiol., u, 9 61 - 964. Genthner, 8. R. S . and Bryant, M. P. (1982), Appl. Environ. Microbiol., - 4 3 , 70-74. Grethlein, A . J . , Worden. R. M., Jain, M. K., and Datta, R. (1990), Appl. Biochem. Biotechnol., 24/25, 875-884. Barik, S . , Prieto, S . , Harrison, S . B., Clausen, E. C., and Gaddy, J. L, (1988), Appl. Biochem. Biotechnol., le, 363-378. Vega, J. L.. Prieto, S . , Elmore, B. B., Clausen, E. C., and Gaddy, J . b. (1989). Appl. Biochem. Biotechnol., 20/21, 781-797. Clausen, E. C., Ackerson. M. D., and Gaddy, J . L. (1991), "Biological Production of Ethanol from Coal," Quarterly Report 2-4-91, June- September, Contract No. DE-AC22-89PC89876. Klasson, K. T., Ackerson, M. D., Clausen, E. C., and Gaddy, J . L. (1992), Proceedings, American Chemical Society, Division of Fuel Chemistry, x, No. 1, 464. Phillips, J . R., Klasson, K. T.. Clausen, E. C.. and Gaddy, J . L. (1992), "Biological Production of Ethanol from Coal Synthesis Gas: Medium Development Studies," presented at the 14th Symposium on Biotechnology for Fuels and Chemicals, Gatlinburg, TN. Vega, J . L., Klasson, K. T.. Kimmel, D. E., Clausen, E. C., and Gaddy, J . L. (1990), Appl. Biochem. Biotechnol., 24/25, 329. Smith, K. D., Klasson, K. T., Ackerson, M. D., Clausen, E. C., and Gaddy, J . L. (1991), Appl. Biochem. Biotechnol., u, 797.
1980
. . - A: oo
4 . . 4
4
4 4
44
. . * 4
LL I- v, 0 al 5 C
U C 0
.-
._
7; 0 v)
0 .- c
2 c C 0 0
0 0
0
U
c
e a hl
0
3 (r
L
L
.-
E I- v, 0 W r
C
U W C
0
#
.-
.- 7; 0
v) C
0
0
C 0
C 0 0
W 0
.- c
L +
- -
- W
3 m
LL
L
.-
1981
, pj 1: 0
0 0 0 R
- 3
- 3
- ?
- g
- 8
- 8

.. ..- ..
ui 0 0
LL
MINERAL LIBERATION OF ILLINOIS COALS E.J. Hippo, N. Blankenship, S.C. Yen, E. Newton, C. Lia, H. JaO
Mechanical Engineering and Energy Processes Southern Illinois University
CARBONDALE, IL. 62901
INTRODUCTION
Extensive studies of coal structure and utilization have been conducted on every known aspect of coal for many decades in an attempt to produce a more efficient and less polluting energy source. The first priority toward this energy goal is to deep clean coal prior to combustion, gasification, or liquefaction. Deep cleaning coal requires the liberation of pyrite and other minerals to facilitate high recovery of clean product. High recovery is necessary to make any cleaning process economically feasible. The high degree of liberation necessary for deep cleaning suggests that the physical properties of coal/mineral interaction be considered during comminution. techniques use random fracture to reduce coal to roughly a cubic or spherical shape which simplifies the prediction of combustion rates in various types of furnaces[l]. This type of grinding does not significantly aid in exposing minerals for possible liberation. In particular, current grinding processes have never been able to effectively liberate microcrystalline pyrite from coal. Studies have shown that 60 to 80% of the mineral content in coal is located in the bedding planes[l]. These interfacial areas, separating relatively clean coal bands, are zones of weakness which contain porosity, fractures, and poorly bonded minerals[2][3].
This paper is a summary of research efforts to utilize bedding plane interfacial areas as a means to improve liberation of pyrite and other minerals in the final product. By cleaving large coal particles along the interfacial boundaries, relatively clean coal particles would be produced that have the majority of the mineral matter coating the exterior of each particle. Subsequent grinding would attrite the outer surface into ultrafine size distributions that allow separation of minerals and macerals particles. from the clean coal by sieving.
Over the past few years, low temperature studies have been conducted to determine the relationships between the fracture resistance of coal treated at low temperature and the effectiveness of coal grinding, to investigate the effect of cryogenic temperature treatment on the effectiveness of coal grinding and potential of selective pyrite liberation[4][5]. This work indicated that brittleness after rewarming increases with decreasing cryogenic treatment temperature. Experimental data has shown that the effect of cryogenic temperature does increase friability, mean particle size is significantly reduced, and pyrite/mineral liberation increased. This was the result of increased crack propagation and decreased microhardness[6][7]. Several methods of preconditioning are currently being investigated: thermal, mechanical, and chemical.
Most grinding
These particles would then be separated
1983
1
In thermal treatments, coals are being exposed to cyclic freezing and thawing at equilibrium moisture contents. The freeze/thaw cycling is bases on using the expansion property of freezing water to place pressure on fracture ends in the hope to expand and propagate cracking with the particle. preconditioning, literature indicates that roll crushing yields particles that are plate-like or flakes and have a high aspect ratio[1][8]. Roll crushing and stage roll crushing of raw and cryogenic samples were examined to determine if this mechanical step would enhance liberation in subsequent ball milling. Solvent swelling of coal during mild extraction has been examined as a preconditioner. extraction and remove the soluble organic. The organic soluble phase may be responsible for the thermoplastic matrix of coal and reduced mineral liberation rates.
EXPERIMENTAL
The main coal used in this research is Illinois Basin Herrin #6 coal. This is do to its local economic importance and unique microdispersed pyrite particles. These microdispersed pyrite particles are the most difficult to liberate and separate of all the Illinois Basin coals. Wyodak and Pittsburgh coal is also currently being tested.
Knoop microhardness testing after rewarming was employed to examine brittleness of coal and the effect of cryogenic temperature on its microhardness[l][6][7]. Analyzer connected with an optical microscope was used to obtain pyrite liberation and particle size distributions for samples ground by a Fritsch centrifugal ball mill. Surface artifacts were examined by scanning electron microscopy (SEM) and optical microscopy.
The desired cryogenic temperatures were obtained using liquid nitrogen as a refrigerant to cool a flowing gaseous nitrogen stream which was in actual contact with the specimen. Detailed experimental setup and procedures for cryogenic treatment are given elsewhere[5][6].
Using the thermal expansion of water when frozen, coal samples were mixed with various weight percents of distilled water: 5, 10, and 20 grams. The samples were sealed into plastic freezer bags with all excess air removed. These samples were frozen and thawed for various cycles that range from 5 to 20 times.
Mechanical preconditioning of the coal was conducted using a roll crusher with its rollers set at staging widths of various increments : 0.1" , 0.7", 0.5", and 0.3". Untreated and cryogenic coal samples were used in these experiments.
An evaluation of THF extraction as a means of preconditioning the unextractable residue is currently being conducted.
In mechanical
The reason is to enlarge pores during
An Automated Image
1984
RESULTS AND DISCUSSION
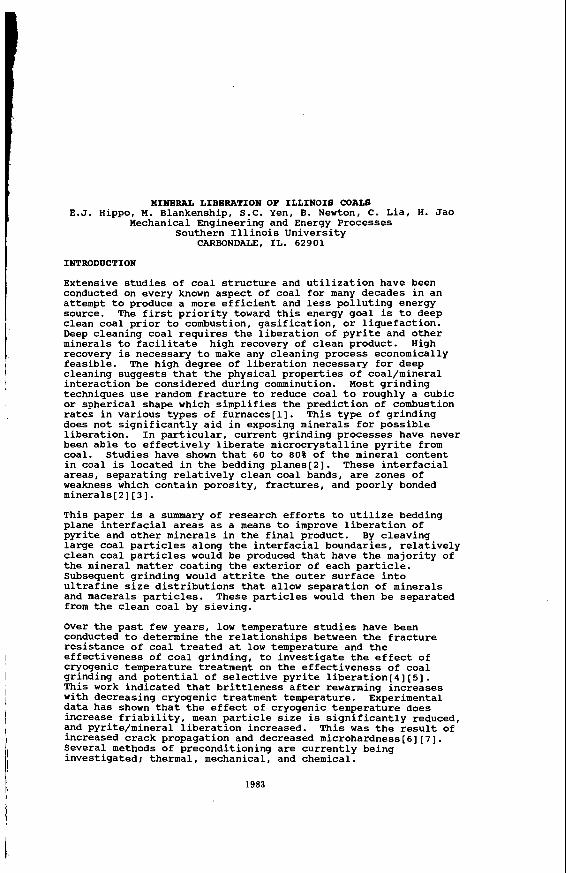
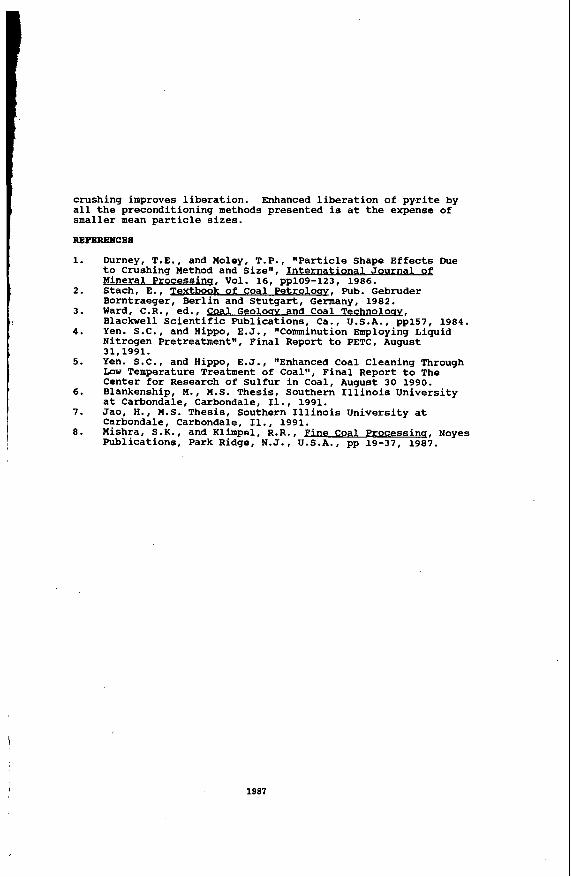
Figure 1 includes information on three coals; Herrin Illinois #6, Wyodak, and Pittsburgh. Data from these samples of untreated and cryogenically treated coals are included. Rate of particle size reduction is greater for cryogenic coals. For a given grinding time, pyrite liberation is greater for cryogenically treated coals, but this is obtained by reduced particle size and not by enhanced selective liberation. The untreated coals give similar shape curves. The slope of liberation changes during treatment. During initial particle size reduction, the liberation is slow. When particle size distribution reaches 70 to 100 pm, a jump in liberation occurs. This is followed by a period in which coal becomes fine in size but liberation remains static. For the cryogenically treated coals, particle size reduction is faster and the initial slow period is not observed. A relatively high rate of liberation occurs as the mean particle size distribution is reduced from 90 to about 40 pm. The rate of liberation is relatively linear until the mean size approaches 10 to 12 pm and begins to level off as 100% liberation is approached. The earlier liberation is more selective for the untreated coals, but a maximum liberation level is observed. The liberation of cryogenically treated coals reaches a higher limit. Although the selectivity of untreated coals is higher, the extent of liberation is not sufficient to be of commercial interest. Even though the amount of pyrite and the particle size distribution of pyrite vary for the three untreated coals, the extent of liberation approaches the same limit (~84%) and the same mean particle size of 20 pm. The untreated Pittsburgh coal has a larger pyrite size distribution than the Illinois coal which results in a higher rate and selectivity of pyrite liberation as expected[6]. Thus cryogenic treatments are helpful in increasing the ultimate liberation. This is probably due to two factors. One is enhanced cracking around pyrite. The second is enhanced fracture, flaw generation, in the coal matrix[6]. This allows for the coal to be reduced in size as compared to untreated coals. Even with cryogenic treatments, ultrafine particle sizes must be obtained to reach sufficient levels for deep cleaned coal.
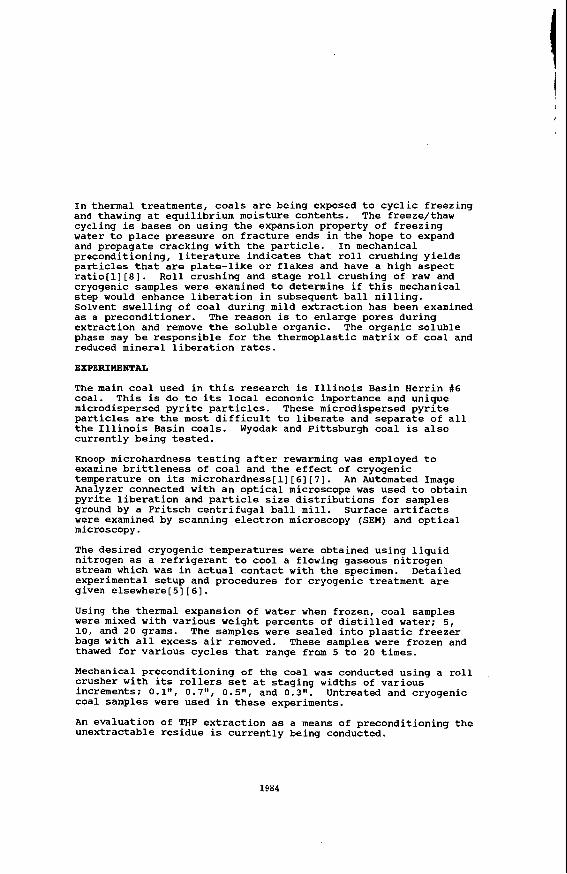
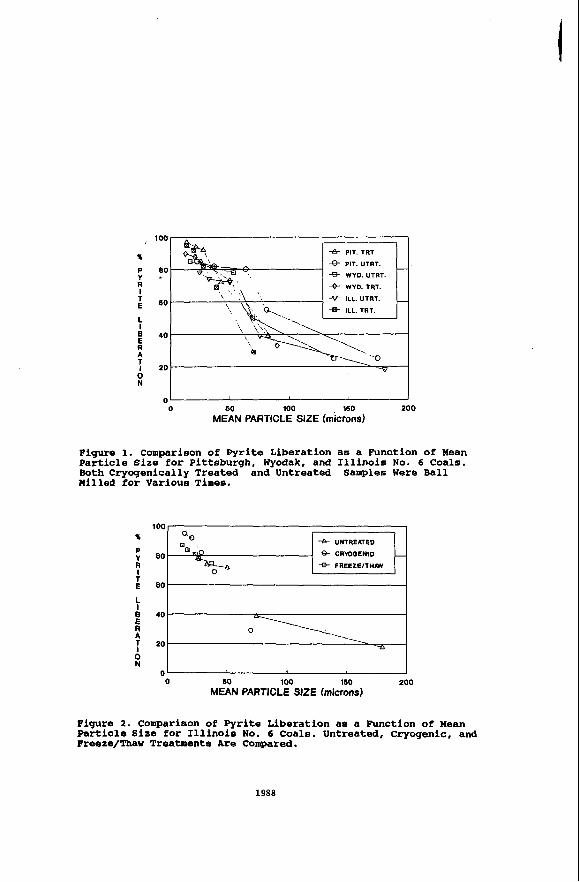
Economic considerations of cryogenic treatments makes it a less than desirable method for liberation. For this reason freezephaw cycling was studied as an alternative. Figure 2 is a comparison of pyrite liberation to the mean particle size for untreated, cryogenically treated, and freeze/thaw treated Illinois coal samples after ball milling. The points of each plot represent a grinding time, from left to right, of 1, 3, 5, 7, and 10 minutes. As discussed in figure 1, the rate of liberation for the untreated coal is slow until a mean size of about 70 pm is reached. A large jump in liberation occurs until a mean size of about 50 pm is reached. liberation becomes nearly stationary. appears to be a extension of the untreated plot and increases to about 84%. Rapid particle mean size reduction is very evident with the freeze/thaw treatment. Three minutes of ball milling of freeze/thaw sample yields about the same size distribution as ten minutes ball milling of the untreated sample. Freeze/thaw
At that time the Freeze/thaw liberation
1985
1
cycling improves the upper level of liberation compared to the untreated. However, cryogenic treatment yields 93% pyrite liberation while freeze/thaw yields 84%.
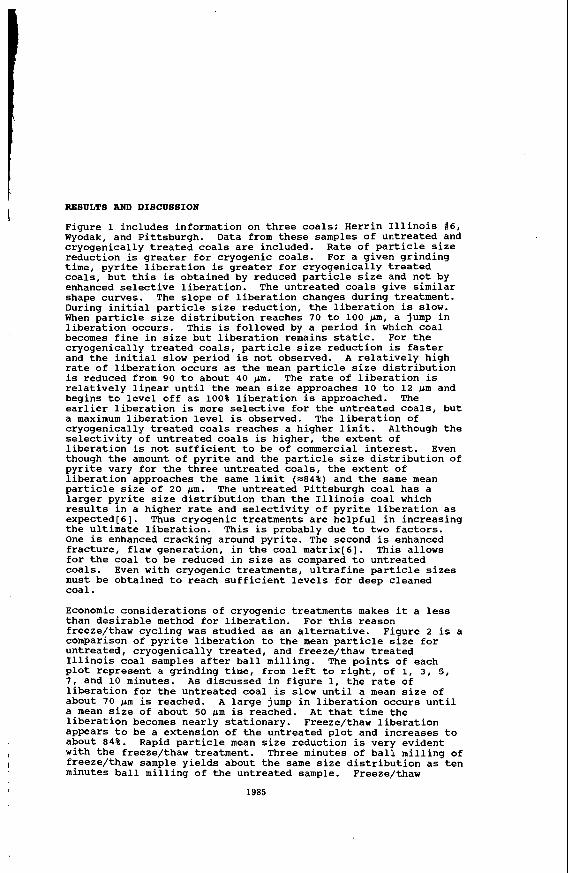
Figure 3 compares freeze/thaw, cryogenic roll crushed, untreated, and untreated roll crushed Illinois coal samples after subsequent ball milling for pyrite liberation at various mean particle sizes. The points of each plot represent a grinding time, from left to right, of 1, 3, 5, 7, and 10 minutes. All three plots show significantly improved liberation compared to the untreated sample. The BG-CRY0 is cryogenically treated for five minutes, compared to 10 minutes in Figure 2, and staged crushed from 0.1" to 0.05". At five minute exposure time, the cryogenic liberation does not approach the level attained by freeze/thaw. This would indicate that freeze/thaw results are better than 5 minute cryogenic exposure but falls short of 10 minute cryogenic exposure results. The freeze/thaw sample, was thermally cycled 10 times with 10% by weight distilled water added. This sample shows a nearly linear increase in liberation to about 87%. It may be concluded that the mechanical and thermal treatment increases liberation above that attainable by untreated samples ball ground in an identical manner.
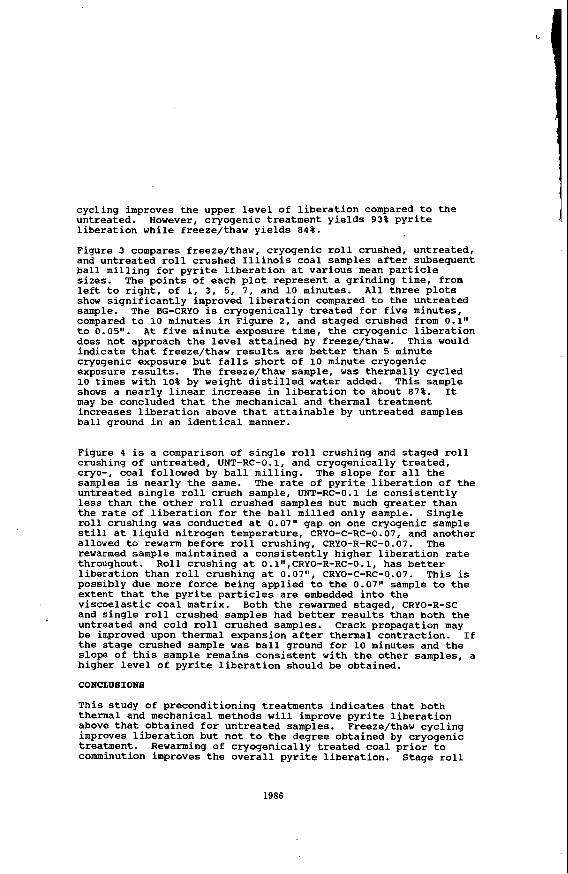
Figure 4 is a comparison of single roll crushing and staged roll crushing of untreated, UNT-RC-0.1, and cryogenically treated, cryo-, coal followed by ball milling. The slope for all the samples is nearly the same. The rate of pyrite liberation of the untreated single roll crush sample, UNT-RC-0.1 is consistently less than the other roll crushed samples but much greater than the rate of liberation for the ball milled only sample. Single roll crushing was conducted at 0.07" gap on one cryogenic sample still at liquid nitrogen temperature, CRYO-C-RC-0.07, and another allowed to rewarm before roll crushing, CRYO-R-RC-0.07. The rewarmed sample maintained a consistently higher liberation rate throughout. Roll crushing at O.llv,CRYO-R-RC-O.l, has better liberation than roll crushing at 0.07", CRYO-C-RC-O..07. This is possibly due more force being applied to the 0.07" sample to the extent that the pyrite particles are embedded into the viscoelastic coal matrix. Both the rewarmed staged, CRYO-R-SC and single roll crushed samples had better results than both the untreated and cold roll crushed samples. Crack propagation may be improved upon thermal expansion after thermal contraction. If the stage crushed sample was ball ground for 10 minutes and the slope of this sample remains consistent with the other samples, a higher level of pyrite liberation should be obtained.
CONCLUBIONB
This study of preconditioning treatments indicates that both thermal and mechanical methods will improve pyrite liberation above that obtained for untreated samples. Freeze/thaw cycling improves liberation but not to the degree obtained by cryogenic treatment. comminution improves the overall pyrite liberation. Stage roll
Rewarming of cryogenically treated coal prior to
1986
crushing improves liberation. all the preconditioning methods presented is at the expense of smaller mean particle sizes.
REFERENCES
Enhanced liberation of pyrite by
1.
2.
3.
4.
5.
6.
7.
8.
Durney, T.E., and Moley, T.P., "Particle Shape Effects Due to Crushing Method and Size", Jntern ational J ournal oc Mineral Process inq, Vol. 16, pp109-123, 1986. Stach, E., Textbook of Coal Petroloqy, Pub. Gebruder Borntraeger, Berlin and Stutgart, Germany, 1982. Ward, C.R., ed., Coal Ge olouv and Coal Technolouy, Blackwell Scientific Publications, Ca., U.S.A., pp157, 1984. Yen. S.C., and Hippo, E.J., "Comminution Employing Liquid Nitrogen Pretreatment", Final Report. to PETC, August
Yen. S.C., and Hippo, E.J., "Enhanced Coal Cleaning Through Low Temperature Treatment of Coal", Final Report to The Center for Research of Sulfur in Coal, August 30 1990. Blankenship, M., M.S. Thesis, Southern Illinois University at Carbondale, Carbondale, 11.. 1991. Jao, H., M . S . Thesis, Southern Illinois University at Carbondale, Carbondale, Il., 1991. Mishra, S.K., and Klimpel, R.R., Fine Coal Processinq, Noyes Publications, Park Ridge, N.J., U.S.A., pp 19-37, 1987.
31,1991.
\
1987
P Y
I T E
L I B E
A
I 0 N
100
8- PIT. UTRT.
8 WYD.UTRT. 80
WYD. TRT.
8 ILL. UTRT. 60
40
20
0 0 60 100 160 200
MEAN PARTICLE SIZE (microns)
Figure 1. Comparison of Pyrite Liberation a s a Function of Mean Part ic le S i z e for Pittsburgh, Wyodak, and I l l i n o i s N o . 6 Coals. Both Cryogenically Treated and Untreated Samples Were Ball Hil led for Various T i m e s .
-+ UNTREATED
80 -8 CRYOQENIC
L I B 40 E R 0 A
20 - -fh
0 60 100 160 200 MEAN PARTICLE SIZE (microns)
Figure 2 . Comparison of Pyrite Liberation a s a Function of Mean P a r t i c l e S i z e for I l l i n o i s N o . 6 Coals. Untreated, Cryogenic, and Freeze/Thaw Treatments A r e Compared.
1988

0 00 100 160 200 MEAN PARTICLE SIZE (microns)
Figure 3. Comparison of Pyrite Liberation as a Function of Wean Particle Size for Illinois No. 6 Coals. Data Includes Roll Crushing, Freeze/Thaw, and Cryogenic Treatments.
I 0 N
A- EALLMILLEO
e UNT-RC-01
8 CRYO-C-RC-0 1
4 CRYO-R-RC-0 1
8 CRYO-R-RC-0 07
8 CRYO-C-RC-0 0 7
* CRYO-A-SC
-4+ CRYO-EM
20 h r
0 2 4 6 8 10 12 GRINDING TIME (mins)
F igure 4. Pyrite Liberation as a Function of Grinding Time for IllhOi8 No. 6 Coals with Various Nechanical and Thermal Pretreatments.
1989

COAL FWTATION WITH IBS/OIL FROTE
Edwin J. Hippo, Deepak Tandon, Michael E. Blankenship and Seema Khan
Mechanical Engineering and Energy Processes Southern Illinois University, Carbondale
Illinois 62901
INTRODUCTION
I n te rna t i ona l coal markets are expected t o grow i n the near fu tu re [l]. U.S. has s u f f i c i e n t coal ' reserves t h a t w i l l l a s t f o r centuries, bu t a major problem i n coal u t i l i z a t i o n i s su l fu r . most coals i s i n the form o f py r i t e , and i f t h i s p y r i t i c s u l f u r can be removed by advanced phys ica l coal c leaning techniques, s u l f u r d iox ide (S02) emissions i n the U.S. could be cu t by as much as 50% [2]. a l t e r n a t i v e f o r t he prevent ion o f SO2 emissions i s post-combustion scrubbing, but i s t oo c o s t l y and consumes as much as 5% o f t he power s ta t i on ' s output (adding t o COP emissions). Therefore, incent ives e x i s t s t o explore pre-combustion c leaning. order t o l i b e r a t e p y r i t e and other minerals from the organic components. A t t h i s f i n e p a r t i c l e s i ze a t t r a c t i v e forces between p a r t i c l e s are much greater than the d i f f e rences i n the g r a v i t y forces exerted on the p a r t i c l e s , and thus the g r a v i t y separat ion based conventional coal c leaning processes become i n e f f i c i e n t [3].
O f the e x i s t i n g f i n e coal c leaning techniques f r o t h f l o t a t i o n i s most e f fec t i ve , but i s i n e f f i c i e n t i n making good separation w i t h u l t r a f i n e coal [4]. preparat ion i n these process, f o r improved process e f f i c i e n c i e s and t o meet s t r i c t e r environmental standards [ 5 ] . This makes process con t ro l very complex. A t u l t r a f i n e sizes, the small mass and momentum o f c lay p a r t i c l e s , i s the primary cause o f t h e i r phys ica l entrainment and t ranspor ta t i on i n t o t h e f ro th. This lowers the e f f i c i e n c y o f t he f r o t h f l o t a t i o n process when excessive amounts o f c lay are present. The entrained ash can be washed from t h e f ro th by counter-current washing as i n column f l o t a t i o n , but a t the same t ime i t may rup tu re the bubble and reduce the recovery.
Coal f l o t a t i o n by I n t r i n s i c Bubble Separation has shown t o circumvent surface phenomena which reduce the e f f i c i e n c i e s o f the conventional c leaning processes [3]. t h e organic f rac t i on o f t he coal . d i r e c t l y on the organic coal p a r t i c l e s , e l im ina t i ng the bubb le -pa r t i c l e c o l l i s i o n and attachment p r o b a b i l i t i e s . bubbles, assuring 100% bubb le -pa r t i c l e contact. Thus, f l o t a t i o n can be h igh l y se lec t i ve . minimizes free bubble format ion and enhances the cleaning o f high ash coals.
Washabil i ty curves are the graphs showing the ash-density d i s t r i b u t i o n . These curves are i n d i c a t i v e o f the maximum cleaning po ten t i a l o f any physical coal c leaning process f o r a p a r t i c u l a r coal sample. curves were obtained f o r f o u r coals from the I l l i n o i s Basin Coal Sample Program (IBC 101, 102, 104, and 106). Southern I l l i n o i s Un ive rs i t y a t
F i f t y f i v e t o 80% o f the s u l f u r i n
Presently, the
Coal has t o be grounded t o -325 mesh i n
There i s a wide range o f chemicals t h a t are requi red f o r coal
This process takes t h e advantage o f the na tu ra l po ros i t y o f
The nonporous minerals do n o t form
I n t h i s approach bubbles are formed
Since the bubbles form from the pore openings, t h i s
Washabil i ty
1990
Carbondale has developed a method for r a p i d l y and accurate ly evaluat ing f i ne and u l t r a f i n e coal l i b e r a t i o n using Density Gradient Cen t r i f uga t ion (DGC), Micro S u l f u r and Thermgrav imetr ic Analysis (TGA) methods t o es tab l i sh washabi l i ty curves [3]. the l i b e r a t i o n o f minerals between -100 and -400 mesh mate r ia l . The ash y i e l d s went through a minimum w i t h increasing densi ty , i n d i c a t i n g t h a t the i n e r t i n i t e and the l i p t i n i t e macerals have higher inherent ash y i e l d s than the v i t r i n i t e s . the 102 Coal but had much h igher ash y i e l d s which i nd i ca ted t h a t even a t u l t r a - f i n e s ize there i s substant ia l amount o f un l iberated minerals i n these coals [6] .Previous r e s u l t s on i n t r i n s i c bubble format ion process showed t h a t pressure, i n general, increased the hydrophobicity o f the organic p o r t i o n o f the coal. Except f o r Octanol, add i t i ves d i d not have any p o s i t i v e e f f e c t on the process. Lower pHs seem t o favor the process. e f f e c t i v e l y on weathered coals and pulp dens i t i es as high as 20% [21 .
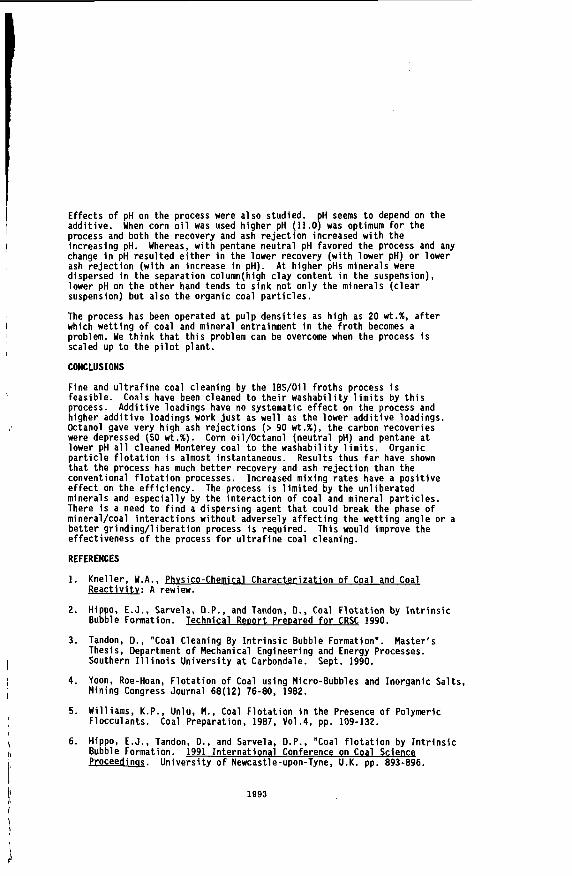
A l l t he IBC coals a t -32 mesh have been cleaned t o t h e i r respect ive -100 mesh washabi l i ty l i n e s . Results from the h igh c l a y I B C 104 coal are the best thus f a r . For t h i s coal substant ia l ash (> 90%) and s u l f u r r e j e c t i o n (> 80%)have been obtained. These r e s u l t s compare q u i t e favorably w i t h those o f the I l l i n o i s State Geological Survey Aggregate F l o t a t i o n process (Fig. 1)
Recoveries and ash r e j e c t i o n s w i t h t h i s process compared very favorably w i t h other processes. F l o t a t i o n k i n e t i c s are much fas te r . There were some problems w i t h the we t t i ng o f coal a t h igh pulp dens i t i es (> 20 wt.%) which were overcome by us ing a b igger mixing chamber and two 10,000 rpm mix ing motors. This h igh mix ing r a t e should he lp i n breaking some o f the mixed phase mineral/coal p a r t i c l e s which caused problems i n the e a r l y phases o f t h i s p ro jec t .
EXPERIMENTAL PROCEDURES
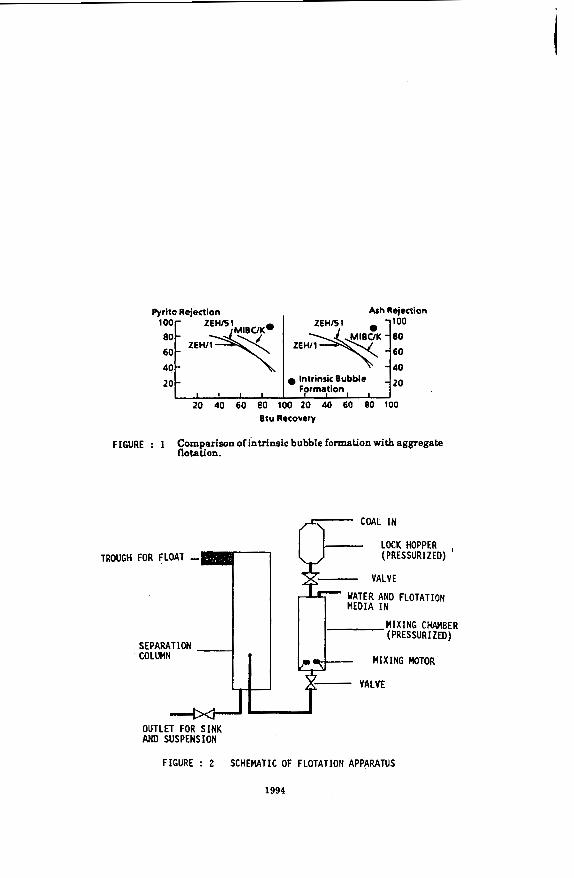
The coals selected f o r use i n t h i s research were I B C 101, 102, 104 and 106 from the I l l i n o i s Basin Coal Sample Program (IBCSP) and a Her r i n # 6 coal from the Monterey #2 mine located near S t . Louis. The choice o f these coals was made on the bas is o f t h e i r d i f f e r i n g rank ( re f lectance) , ash y i e l d s and pyr i te /organic s u l f u r r a t i o s ( 3 ) . The p a r t i c l e sizes used f o r the I B C coal samples were -32, -100,-400 mesh and f o r the Monterey coal -400 mesh sample was used. determined by wet sieving, and t h a t f o r -400 mesh was performed using the Microt rack analyzer. Washabil i ty curves were p l o t t e d f o r -100 and -400 mesh samples. A schematic o f the experimental setup used i s shown i n f i gu re 2. Dr ied coal i s f ed i n t o the l ock hopper where i t i s pressurized using a i r . Water and the f l o t a t i o n media used are fed i n t o the mix ing chamber and are pressurized t o the same pressure as the coal. Coal i s then dumped i n the mixing chamber, mix ing s t a r t s simultaneously (two 10,000 rpm motors are used f o r mixing). A p lug valve i s used for s l u r r y output a t t he bottom o f t he mixer and f o r depressur izat ion con t ro l . The o u t l e t p ipe i s immersed i n a separation column w i t h a water cushion. Coal s l u r r y depressurizes through a nozzle i n the separation column; f l o a t f r o t h r i s e s t o the top and i s co l l ec ted i n a t rough attached t o the separation column. The l i q u i d l e f t i n the column i s termed as the suspension and the so l i ds s e t t l e d a t the bottom are c a l l e d the s ink. Recovery and ash values are determined on each o f t he co l l ec ted f rac t i ons . Runs w i t h good recovery and separation are subjected t o add i t i ona l analyses.
For the IBC 102 coal there was small d i f f e rence i n
Washabil i ty curves f o r the IBC 101 and 106 coals were l i k e
The process works
[61*
The p a r t i c l e s i ze d i s t r i b u t i o n f o r -32 and -100 mesh were
1991
I n i t i a l runs, t o study the e f f e c t s o f var ious condit ions, were performed w i t h IBC coals. on the three mesh s izes of these coals . and HC1. (NE, C02, and A i r ) on the process were studied. various add i t i ves t o assess t h e i r e f f e c t on recovery and separation. t he e f f e c t of mix ing ra te , mix ing time, pu lp densi ty , and weathering (ox idat ion) on c l e a n a b i l i t y and recovery were s tud ied [6].
Ef fec ts o f add i t i ves (Octanol, Corn o i l , Pentane, and var ious dispersants), pH (2.3 t o 11.0) and pu lp dens i t y on the Monterey coal were studied. These runs were performed a t 60 p s i g and 5% pulp dens i t y (-400 mesh samples), i n the new apparatus shown i n F ig . : 2. Various loadings o f add i t i ves were used t o study the effect o f t he a d d i t i v e loadings.
RESULTS AND DISCUSSION
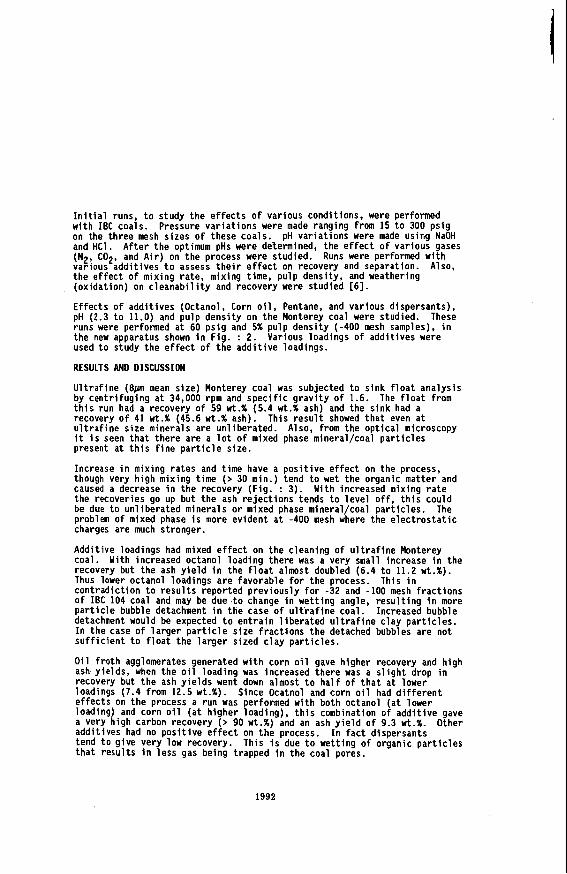
U l t r a f i n e (8pn mean s ize) Monterey coal was subjected t o s ink f l o a t analys is by cen t r i f ug ing a t 34,000 rpm and s p e c i f i c g r a v i t y o f 1.6. t h i s run had a recovery o f 59 w t . % (5.4 w t . % ash) and the s ink had a recovery o f 41 w t . % (45.6 w t . % ash). Th is r e s u l t showed t h a t even a t u l t r a f i n e s i ze minerals are un l iberated. Also, from the o p t i c a l microscopy i t i s seen t h a t t he re are a l o t o f mixed phase mineral/coal p a r t i c l e s present a t t h i s f i n e p a r t i c l e size.
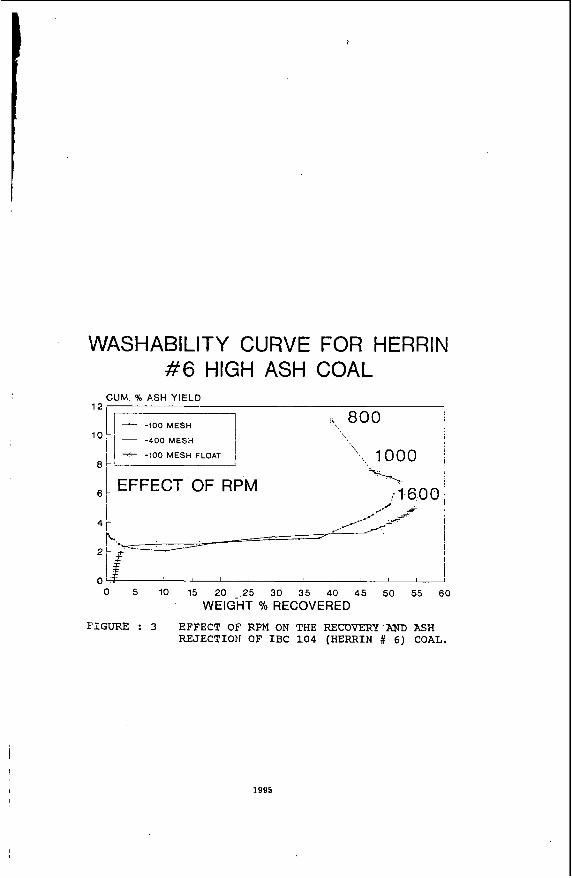
Increase i n mix ing r a t e s and t ime have a p o s i t i v e e f f e c t on the process, though very h igh mix ing t ime (> 30 min.) tend t o wet the organic mat ter and caused a decrease i n the recovery (Fig. : 3). the recoveries go up but the ash r e j e c t i o n s tends t o l e v e l o f f , t h i s could be due t o un l i be ra ted minera ls o r mixed phase mineral/coal pa r t i c l es . The problem o f mixed phase i s more ev ident a t -400 mesh where the e l e c t r o s t a t i c charges are much stronger.
Addi t ive loadings had mixed e f f e c t on the c leaning o f u l t r a f i n e Monterey coal. With increased octanol l oad ing there was a very small increase i n the recovery but the ash y i e l d i n the f l o a t almost doubled (6.4 t o 11.2 wt.96). Thus lower octanol loadings are favorable f o r the process. This i n con t rad i c t i on t o r e s u l t s repor ted prev ious ly f o r -32 and -100 mesh f r a c t i o n s of IBC 104 coal and may be due t o change i n we t t i ng angle, r e s u l t i n g i n more p a r t i c l e bubble detachment i n the case o f u l t r a f i n e coal. Increased bubble detachment would be expected t o e n t r a i n l i b e r a t e d u l t r a f i n e c l a y p a r t i c l e s . I n t h e case o f l a r g e r p a r t i c l e s i ze f r a c t i o n s the detached bubbles are n o t su f f i c i en t t o f l o a t t he l a r g e r s ized c l a y p a r t i c l e s .
O i l f r o th agglomerates generated w i t h corn o i l gave h igher recovery and h igh ash y ie lds , when the o i l loading was increased there was a s l i g h t drop i n recovery but the ash y i e l d s went down almost t o h a l f o f t h a t a t lower loadings (7.4 from 12.5 wt.%). Since Ocatnol and corn o i l had d i f f e r e n t e f fects on the process a run was performed w i t h both octanol ( a t lower loading) and corn o i l ( a t h igher loading) , t h i s combination o f a d d i t i v e gave a very h igh carbon recovery (> 90 wt.%) and an ash y i e l d o f 9.3 wt.%. Other addi t ives had no p o s i t i v e e f f e c t on t h e process. I n f a c t dispersants tend t o g i ve very low recovery. This i s due t o wet t ing o f organic p a r t i c l e s t h a t r e s u l t s i n less gas being trapped i n the coal pores.
Pressure v a r i a t i o n s were made ranging from 15 t o 300 p s i g pH va r ia t i ons were made u s i r q NaOH
Also,
A f t e r t he optimum pHs were determined, the e f f e c t o f var ious gases Runs were performed w i t h
The f l o a t from
With increased mixing r a t e
1992
Ef fec ts o f pH on the process were a l so studied. addi t ive. When corn o i l was used h igher pH (11.0) was optimum f o r the process and both the recovery and ash r e j e c t i o n increased w i t h the increas ing pH. Whereas, w i t h pentane neu t ra l pH favored the process and any change i n pH resu l ted e i t h e r i n the lower recovery (w i th lower pH) o r lower ash r e j e c t i o n (w i th an increase i n pH). dispersed i n the separation column(high c l a y content i n the suspension), lower pH on the other hand tends t o s i n k not on l y the minerals ( c lea r suspension) bu t a l so the organic coal p a r t i c l e s .
The process has been operated a t pu lp dens i t i es as h igh as 20 wt.%, a f t e r which we t t i ng o f coal and mineral entrainment i n the f r o t h becomes a problem. We t h i n k t h a t t h i s problem can be overcome when the process i s scaled up t o the p i l o t p lant .
CONCLUSIONS
Fine and u l t r a f i n e coal cleaning by the IBS/Oil f r o t h s process i s feasible. Coals have been cleaned t o t h e i r washabi l i ty l i m i t s by t h i s process. Add i t i ve loadings have no systematic e f f e c t on the process and higher add i t i ve loadings work j u s t as we l l as the lower a d d i t i v e loadings. Octanol gave very h igh ash re jec t i ons (> 90 wt.%), t he carbon recover ies were depressed (SO wt.%). Corn oi l /Octanol (neutra l pH) and pentane a t lower pH a l l cleaned Monterey coal t o the washab i l i t y l i m i t s . p a r t i c l e f l o t a t i o n i s almost instantaneous. Results thus f a r have shown t h a t the process has much b e t t e r recovery and ash r e j e c t i o n than the conventional f l o t a t i o n processes. Increased mix ing ra tes have a p o s i t i v e e f f e c t on the e f f i c i ency . The process i s l i m i t e d by the un l i be ra ted minerals and espec ia l l y by the i n t e r a c t i o n o f coal and mineral p a r t i c l e s . There i s a need t o f i n d a d ispers ing agent t h a t could break the phase o f mineral/coal i n te rac t i ons wi thout adversely a f f e c t i n g the we t t i ng angle o r a b e t t e r g r i nd ing / l i be ra t i on process i s required. e f fect iveness o f t he process f o r u l t r a f i n e coal cleaning.
REFERENCES
pH seems t o depend on the
A t h igher pHs minerals were
Organic
This would improve the
1.
2.
3.
4 .
5 .
6.
Knel ler , W.A., Phvsico-Chemical Character izat ion o f Coal and Coal- Reac t i v i t y : A rewiew.
Hippo, E.J., Sarvela, O.P., and Tandon, D., Coal F l o t a t i o n by I n t r i n s i c Bubble Formation. Technical Reoort PreDared f o r CRSC 1990.
Tandon, O., "Coal Cleaning By I n t r i n s i c Bubble Formation". Master's Thesis, Department o f Mechanical Engineering and Energy Processes. Southern I l l i n o i s Un ive rs i t y a t Carbondale. Sept. 1990.
Yoon, Roe-Hoan, F l o t a t i o n o f Coal using Micro-Bubbles and Inorganic Salts, Mining Congress Journal 68(12) 76-80, 1982.
Wil l iams, K.P., Unlu, M., Coal F l o t a t i o n i n the Presence o f Polymeric F locculants . Coal Preparation, 1987, Vol.4, pp. 109-132.
Hippo, E.J., Tandon, D., and Sarvela, D.P., "Coal f l o t a t i o n by I n t r i n s i c Bubble Formation. 1991 In te rna t i ona l Conference on Coal Science Proceedings. Un ive rs i t y o f Newcastle-upon-Tyne, U.K. pp. 893-896.
1993
I r'
Fyrite Reiection Ash Reiection 100
40 20
Z E H B 1 Z E H 6 1 1 i o MIBUK.
40
20 40 60 eo 100 20 40 60 80 100 Btu Recovery
FIGURE : 1 Comparison of intrinsic bubble formation with aggregate flotation.
LOCK HOPPER (PRESSURIZED) ' &!I VALVE
WATER AND FLOTATION MEDIA I N
TROUGH FOR FLOAT -
MIXING CHAMBER (PRESSURIZED)
OUTLET FOR S INK AND SUSPENSION
FIGURE : 2 SCHEMATIC OF FLOTATION APPARATUS
1994
WASHABILITY CURVE FOR HERRIN
12
10
8
6
4
2
0
#6 HIGH ASH COAL UM. % ASH YIELD
I j - -100 MESH
i -400 MESH I ?L -100 MESH FLOAT I
EFFECT OF RPM
"\, 800
"... 1 0 0 0
0 5 10 15 20 25 30 35 40 45 50 55 60 WEIGHT yo RECOVERED
FIGURI: : 3 EFFECT OF RPM ON THE R E F O V E H P ' ~ I I ASH REJECTION O F I B C 1 0 4 (HERRIN # 6) COAL.
1995
I
A NEW SOLUTION-BASED COAL-UPGRADING PROCESS
David L. Morgan Division of Energy Technology: CSlR
P.O. Box 217, Pretoria, 0001, South Africa
Key words: coal, solvent extraction, upgrading
INTRODUCTION
The development of effective means o f upgrading the organic part of coal by separating it from the inorganic part has long been the goal of coal chemists and engineers, with several processes having been studied in recent years. Amongst these are the removal of mineral components by hot-alkali dissolution 11.21. the removal of minerals and some organic sulphur by treatment with perchlor- ethylene 131. and the high-severity extraction of the organics by coal-derived and supercritical solvents 141. Relatively milder extraction with refluxing N-methyl-pyrrolidone (NMP) has also enjoyed attention t51, although the degree of solubilization obtained has been less than 50%. The aim of these studies has been to develop processes suitable for the manufacture of clean fuels or, after carbonization, of electrode carbons. The low value of these products places great pressure on the economics of the process.
The development of a new purification process has been prompted by the observation that rela- tively small additions of sodium hydroxide allow very high solubilization of certain high-rank bituminous coals into relatively cheap N,N-dimethylformamide (DMF) and similar solvents. A patent has been granted in South Africa t61, allowed in the USA and applied for in a number of other countries. The purified dissolved organics may be recovered from solution as 'Refcoal' but the coal solution itself may be exploited to prepare products of much greater value than fuel or electrodes.
EXPERIMENTAL
Small-scale extractions
The extractions were performed at room temperature in stainless-steel tubes (80 mP volume) fitted with screw caps and PTFE seals. Typically coal (7 g), solvent (70 g) and alkali were introduced together with a stainless-steel slug (1 cm by 1 cm diameter). Air was displaced by nitrogen and the tubes sealed. Up to 12 tubes were placed in a tumbling apparatus and rotated end-over-end at 60 r/min for 24 hours at room temperature. The extract was filtered through No. 3 sintered- glass filter. washed once with solvent (70 e), then exhaustively with water to remove residual solvent and dried under vacuum at 60 O C . The residue was weighed, the carbon content determined and the degree of carbon extraction calculated using the formula:
% Carbon extraction = (wt cod extr. x % C in coal - w1 em. residue x % C in residue) x lOQ wt. coal e m . x % C in mal
The repeatability. particularly for high degrees of extraction, was high. The figures shown are averages of at least two determinations.
Bench-scale extractions The extraction apparatus consisted of a jacketed stainless-steel reactor 240 mm x 81 mm'I.D., fitted with internal baffles and a flat stirrer 40 x 40 mm driven by a variable-speed motor capable of 1 500 rlmin. The extractions were conducted under an argon atmosphere. Oil or water from a thermostat was pumped through the jacket to provide temperature control. The reactor was
1996
loaded with coal (70 g) and solvent (700 ml) and heated to operating temperature. Alkali was added and the extraction commenced. Samples of slurry were taken as required and the degree of extraction measured.
Monitoring the degree of extraction Slurry samples (= 1 ml) were centrifuged at 3 000 rlmin for 5 minutes, then 0.1 g of supernatant was weighed rapidly into a volumetric flask and diluted to 50 ml with solvent. The absorbance at 600 nm was measured on a Unicam SP 1700 spectrophotometer.
Minerals removal Extracts were centrifuged at 6 000 rlmin for 30 minutes in 1 -e buckets and the supernatant filtered under vacuum through polypropylene filter cloth. The removal of minerals was monitored by XRF analysis of recovered Refcoal.
Refcoal recovery and alkali removal The bulk of the solvent was removed by vacuum distillation at 90 'C. The product was washed with boiling water to remove residual solvent and alkali, and then dried to give Refcoal.
RESULTS AND DISCUSSION
Small-scale axtractions The effect of adding potassium hydroxide (coa1:solvent:KOH ratio 10:100:1,6) on the carbon extractabilities into NMP of various South African coals is shown in Table 1. Coals of higher and lower dry, ash-free carbon content showed much lower extractabilities. Clearly the vitrinite concentrates were much more soluble than the corresponding inertinites. Coal B - a flotation concentrate rich in vitrinite - showed a remarkably high extractibility considering the mild conditions employed.
The suite of Argonne Premium coal samples I71 was similarly extracted using the same coal: solvent:KOH ratio. The results are given in Table 2 where a similar rank effect is seen. It should be noted that southern African coals have experienced a very different history to those of North America and that direct comparisons based on particular rank parameters should be approached with caution.
The effectiveness of numerous solvents was examined using Coal A and potassium hydroxide in the same ratios as above. The results are given in Table 3. Amide solvents are seen to be generally effective, with dimethyl sulfoxide somewhat less so. Pyridine alone or wi th KOH was ineffective but the addition of the phase-transfer catalyst 18-crown-6 gave greatly increased extraction when five consecutive extractions were done. Hexamethyl phosphoric triamide was ineffective, even on addition of crown ether.
Various amine, ether, polyether and alcohol solvents showed no great increase in solubility on the addition of potassium hydroxidelcrown ether.
Similar results in both NMP and DMF were found when an equivalent amount of sodium hydroxide was used in place of potassium hydroxide. Lithium hydroxide was very much less effective.
The most significant points arising from these results are:
(1) (2) (3)
The organic part of a variety of coals can be very effectively solubilized. Relatively cheap and volatile DMF may be used. Relatively cheap sodium hydroxide may be used.
1997

Bench-scale extractions Numerous bench-scale experiments aimed at defining process conditions for the extraction of Coal B have been done using DMF and NMP. The extraction curves found show, in some cases after an induction period, a steadily decreasing rate of extraction until a final plateau is reached.
In summary the more significant observations are:
The effect of air. The extraction is severely affected, with approximately half the potential extraction being obtained.
The effect of temperature. The rate increases rapidly with temperature. In NMP the time to completion ranges from 10 minutes at 180 "C to 17 hours at 30 'C. In DMF the time ranges from 60 minutes at 150 "C to 24 hours at 30 "C. An induction period is seen a t lower temperatures.
The effect of alkali. Potassium hydroxide, in equivalent amounts, gives marginally faster extraction.
The form of the sodium hydroxide is important. In NMP and DMF the extraction rate increases with the use of finer NaOH. The induction period becomes shorter. Sodium hydroxide solution gives rapid dissolution, but in DMF the final plateau of extraction is much lower than that found for solid. The addition of more NaOH solution leads to further extraction. Reaction of the base with the solvent must be occurring before the coal is fully solubilized.
The quantity of sodium hydroxide required for maximum extraction in both solvents is about 10% of the mass of the coal.
The effect of phase-transfer catalyst. The addition of as little as 0,7% (of the mass of coal) of poly- ethyleneglycol 400 increases the rate of extraction noticeably. The addition of 5% polyethylene- glycol 400 decreases the time to maximum extraction a t 90 OC in DMF from 200 to 60 minutes. The catalyst clearly assists alkali mass transfer.
The effect of stirring rate. The extraction rate increases with the stirring rate, but plateaus in the bench apparatus at about 1500 rlmin.
The effect of particle size. In both NMP and DMF there is a moderate effect at 30 OC and no difference at 90 OC when comparing coals -500 pm +212 pm and -160 pm in size.
Solution properties
The solutions are dark brown in colour. The DMF solution ranges in viscosity from 1 .E cp at 90 O C
to 3.5 cp at 30 "C. Solutions in both solvents are unstable when exposed to atmospheric water and carbon dioxide. The NMP solutions have an indefinite stability when in closed containers, but the DMF solutions gel after a few weeks. The addition of acid or other solvents miscible with DMF and NMP leads to immediate precipitation of the coal-derived material.
Monitoring the degree of extraction The absorbtion measured correlated extremely well with the degree of carbon extraction determined gravimetrically in a series of partial extractions done'in the smatl-scale extraction apparatus on various coals. The absorbance per gram of coal dissolved remained constant, independent of the degree of extraction for each coal, but differed widely from coal to coal.
1998

Minerals removal
The undissolved coal present in the extraction slurry is highly swollen with solvent end very sticky. Filtration is difficult. Centrifugation at 6000 r/min of the solution directly from the hot extraction vessel gave the best results. Table 4 compares the ash analyses of Coal B with those of a series of unwashed Refcoals prepared from a solution of this coal centrifuged at various speeds. Increased speed is clearly important.
Refcoal recovery and alkali removal Vacuum distillation of DMF solutions proceeded smoothly at 1 0 mbar pressure and 9 0 OC bath temperature, but removal of NMP was difficult and slow. Complete removal of either solvent was not possible but, based on nitrogen analysis. can be brought down to about 10% for DMF and 16% for NMP. Hot-water washing brings these percentages down to < 1 % and about 3% respectively. Sodium is also removed by water washing, from 3% in the vacuum-dried product to less than 100 ppm. The final product is a dry, free-flowing granular material. Analysis of Refcoal gave values very close to those found for the coal used in its preparation. Nitrogen increased 0.1 - 0.2%. representing 0.5 - 1.0% DMF, while sulphur was halved, representing removal of pyrite.
Exploitation Several uses for coal solutions and Refcoal show promise. Refcoal would be a very clean fuel. The carbonization yield of Refcoal prepared from Coal 8 is 75% at 1100 "C making it an efficient carbon source. Some control of the degree of ordering of the carbon formed appears possible. The low viscosity of the solutions makes it attractive as an impregnation medium. Higher-valued uses are being investigated - fibres can be spun from suitably treated solution and the solution can be used as a source of carbon of high reactivity for the carbothermal preparation of metal carbides and nitrides.
LITERATURE CITED
1.
2. Waugh, A.B. and Bowling, K.M. EP 0302864/81/ 1991.
3.
4.
Chriswell. C.D.. Shah, N.D. and Markuszewska, R. Sept. Sci. and Tech. 1991 m 9 6 1 .
Fullerton, K.L., Lee, S. and Kulik. C.J. Fuel Science and Eng. Int'l. 1991. 9121 873.
Pullen. J.R. in Coal Science, Vol. 2. p. 259 ed. McGorbaty, J.W. Lanen and I. Wender, Academic Press, 1983.
Renagnathan, K., Zondlo, J.W.. Minty, F.A., Kneisl, P. and Stiller, A.H. Fuel Proc. Tech. 1988 273.
Morgan, D.L. SA Patent No. 90/7606, Coalsolubililarion. 1991, ENERKOM (Pty) Ltd.
5.
6.
7. Vorres, K.S. Energy and Fuels, 1990 a 420.
ACKNOWLEDGEMENTS
The author wishes to thank:
The South African Department of Mineral and Energy Affairs for funding these studies. Dr J Dekker for helpful discussions. Char1 Fourie, Stefanie McMenamin and Alpheus Bokaba for technical assistance.
1999
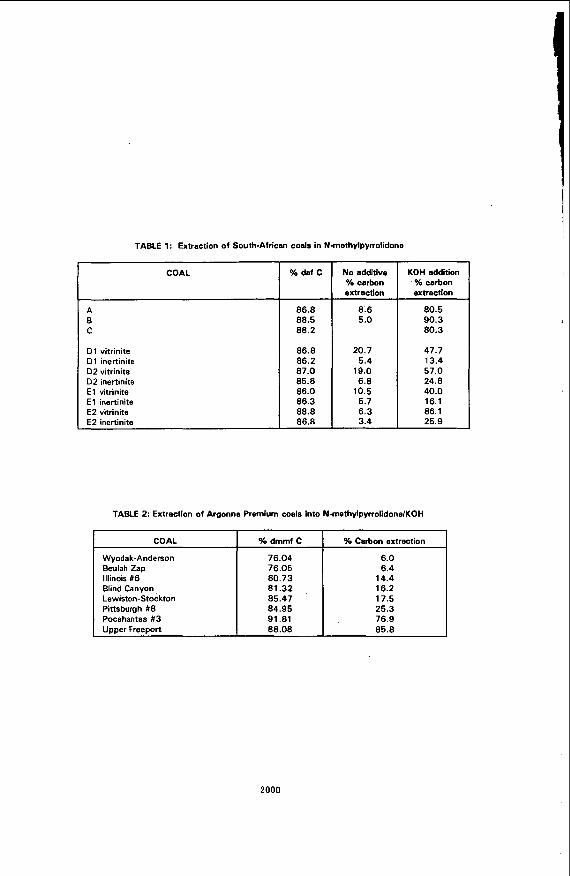
TABLE 1: Extraction of South-African coals in Nmethylpynolidona
% dat C COAL No additive YO carbon extraction
A 8 C
01 vitrinite Dl inertinite D2 vitrinite 02 inertinite E l vitrinite E l inertinite E2 vitrinite E2 inertinite
COAL
Wyodak-Anderson Beulah Zap Illinois U6 Blind Canyon Lewiston-Stockton Pittsburgh #8 Pocahantas U3 Umer FreeDort
Oh dmrnf C
76.04 76.05 80.73 81.32 85.47 84.95 91 .a1 88.08
86.2 87.0 85.8 86.0 10.5 86.3 5.7 88.8 6.3 86.8 3.4
KOH addition % carbon extraction
80.5 90.3 80.3
47.7 13.4 57.0 24.8 40.0 16.1 86.1 25.9
TABLE 2 Extraction of Argonne Premium coals into Nmathylpyrrolidone/KOH
% Carbon extraction
6.0 6.4
14.4 16.2 17.5 25.3 76.9 85.8
2000

TABLE 3: Extraction of Coal A in various solvents (Coa1:solvent:KOH ratio 10:100:1,6)
OXIDE COAL
SO, 4.2% AI203 2.1 b o , 0.43 CaO 0.28 K*O 0.13 TiO, 0.18 MgO 0.10 Total 7.4
SOLVENT
N-methylpyrrolidinone Dimethylformarnide Dimethylacetamide Tetramethylurea Dirnethylimidazolidinone Dirnethyltetrahydropyrimidinone Dimethylsulphoxide Hexamethylphosphoric triamide Pyridine Pyridine + 18-crown-6 + KOH (70 ml: 0.5 a:0.22 a)
CENTRIFUGE SPEED (r/rnin)
2000 4000 6000
0.14% 0.11% 0.10% 0.15 0.04 0.03 0.006 0.01 0.005 0.004 0.008 0.004 0.003 0.04 0.02 0.01 5 0.03 0.02 0.02 0.38 0.20 0.17
% CARBON EXTRACTION
80.5 82.5 79.4 56.7 83.1 63.8 62.2
8 6.5 (5 consecutive extractions)
16.9 (1 extraction) 84.5 (5 consecutive extractions)
I 2001

PRE-OXIDATION AND PERCHLOROETHYLENE (PCE) DESULFURIZATION OF ILLINOIS COALS M.4. M. Chou, J.M. Lytle, R.R. Ruch, C.W. Kruse, and C. Chaven, Illinois State Geological Survey, Champaign, IL 61 820; D.H. Buchanan, Dept. of Chemistry, Eastern Illinois University, Charleston, IL 61920
INTRODUCTION
A pre-combustion coal desulfurization process using perchloroethylene (PCE) at 120°C to remove up to 70% of the organic sulfur has been claimed by the Midwest Ore Processing Co. (MWOPC). The importance of oxidation and drying conditions as well as temperature control is stressed by the developers (Lee et al., 1991; Leehe and Sehgal, 1988). According to MWOPC, this process gives higher organic sulfur removal from Ohio and Indiana coals than from Illinois coals.
Over the past few years, the ISGS and Eastern Illinois University (EIU) have jointly developed analytical methods t o measure forms of sulfur in PCE extracts of high-sulfur Illinois coals (Buchanan et al., 1990). Some elemental sulfur and limited amounts of organic sulfur have been removed from oxidized Illinois coals during these studies; however, these sulfur removals were much lower than those reported by MWOPC. Several hypotheses may explain these differences, but to date, limited data addressing these hypotheses have been reported. MWOPC postulated that the organic sulfur removed was mainly aliphatic, and that the organic sulfur in Illinois coals may contain less aliphatic sulfur than other coals tested. We have hypothesized that errors in interpreting data from American Society for Testing and Materials analysis methods (ASTM) may account for the higher organic sulfur removal reported by the MWOPC. For example, elemental sulfur extracted by the PCE can be derived from the pre- oxidation of pyrite, but this elemental sulfur will be erroneously reported as organic sulfur by the ASTM analysis. Furthermore, the high chlorine content in the PCE-treated material could decrease its suitability for combustion.
One goal of this study was to independently confirm the organic sulfur removal from high- sulfur Illinois coals with the PCE desulfurization process reported by the MWOPC. Another goal was to verify the forms-of-sulfur determination using the ASTM method for evaluation of the MWOPC process. The overall commercial value of this process also depends on removal of the chlorine from the PCE-treated coal residue. Chlorine up-take during PCE desulfurization, and techniques for removal of chlorine from the process residue, also were investigated.
EXPERIMENTAL
Samples - A n oxidized Ohio 516 coal was provided by Mr. C. Kulik of Electric Power Research Institute. Coals identified as IBC-101, -102, -104, -106 were obtained from the Illinois Basin Coal Sample Program (Kruse. et al.. 199 1 ). Mineral pyrite was provided by Mr. R.H. Shiley, an ISGS staff member.
Procedures Ambient oxidation (laboratory weathering) - During ambient oxidation, samples (IBC-104 coal and mineral pyrite) were stored in a container under room air at laboratory conditions for periods of both 2 weeks and greater than 5 years for coal and for more than 3 years for a pyrite sample.
2002

PCE extraction of oxidized samples of coals IBC-104 and Ohio 5/6 - Azeotropic drying was conducted prior t o each PCE extraction. This was accomplished by adding the sample to well- stirred PCE at 70 to 100°C in an open flask, heating the mixture until all of the water was removed and the temperature in the flask rose t o 121 "C. The temperature was maintained at 121 OC for 30 minutes to complete the extraction. The residue coals from PCE extraction were isolated by hot filtration. The feeds and products from these operations were subjected to both ASTM and X-ray absorption near edge structure (XANES) analyses. The PCE extracts were analyzed for elemental sulfur by high performance liquid chromatography (HPLC).
Short-term air oxidationlPCE extraction - Oxidation in air in the presence of PCE was conducted by bubbling filtered air through a coallPCE slurry with and without water at a specified temperature for a selected length of time. After oxidation, the temperature was increased to 121°C and maintained for 3 0 minutes. The extracts produced from PCE extraction were then isolated from the residues by hot filtration. After purification, the PCE extracts were analyzed by HPLC for elemental sulfur contents.
ASTM forms-of-sulfur analysis - In the ASTM D-2492 procedure (1 991 1, the sample (-60 mesh) is first digested with a dilute HCI solution. The acidic solution is filtered and sulfatic sulfur is precipitated and quantified as BaSO,. After washing with distilled water, the HCI-free residue is digested with dilute HNO,. The solution is filtered and the valume adjusted for atomic absorption (AA) determination of iron, which is then calculated as pyritic sulfur. A t this point, all the iron from pyrite (FeS,) should have been removed and analyzed. To obtain total sulfur, a separate split of coal sample is combusted in a Leco model SC32 total sulfur analyzer equipped with an on-line IR detector which is used to monitor SO, production. Organic sulfur is obtained by taking the difference between total Sulfur content and the sum of pyritic and sulfatic sulfur contents. Any elemental sulfur present appears as organic sulfur since it is not reported as pyritic or sulfatic sulfur.
Elemental sulfur determination - Elemental sulfur in the PCE extract was first purified by passing the solution through a Florisil column. Sulfur was then determined with a Perkin- Elmer Model LC65 HPLC with an ultraviolet - visible light (UV-VIS) detector.
X-ray absorption near-edge structure (XANES) analysis - This method has been developed (Huffman et al., 1991) for the quantitative determination of all major forms of sulfur in coal, both organic and inorganic. The method is based on a least-squares analysis of the X-ray absorption near-edge structure (XANES). This analysis produces a series of peaks that represent I s - n p photoelectron transitions. Because the major sulfur forms occurring in coal (pyrite, elemental sulfur, organic sulfide, thiophene, sulfoxide, sulfone, and sulfate) have characteristic s -. p transition energies, the relative peak areas contributed to the XANES spectrum by each sulfur species can be determined. Aliphatic sulfur is represented by organic sulfide, aromatic compounds by thiophene, and oxidized organic sulfur species by sulfoxide and sulfone. These peak areas are converted to weight percentages of sulfur using calibration constants derived from XANES data from standard compound mixtures. Since XANES derives the signal from the bulk of the sample, detailed information concerning the aliphatic, aromatic, and oxidized forms of organic sulfur removed during PCE desulfurization can be obtained.
Dechlorination and chlorine analysis -Procedures for chlorine removal from the PCE-extracted coals were examined. A n ISGS proprietary method was used t o remove chlorine from the processed residues. The chlorine contents of the treated products were determined by a Leco CL350 chlorine analyzer.
2003
A
RESULTS AND DISCUSSION
PCE desulfurization and sulfur analyses by ASTM and HPLC methods - PCE desulfurization was conducted on short-term ( 2 weeks) and long-term (> 5 years) air-oxidized IBC-104 coal samples and an oxidized Ohio 5/6 coal sample. The results of the ASTM analyses of the desulfurization products and the HPLC analyses of the PCE extracts are shown in Table 1. Coal oxidation before PCE extraction produces more elemental sulfur t o be extracted. The ASTM data also show a reduction in both total sulfur and organic sulfur after PCE extraction of the highly oxidized coal samples.
The sample from t w o weeks oxidation indicates no total sulfur reduction with an undetectable amount of elemental sulfur by HPLC analysis of the PCE extract. The increase in organic sulfur content of this sample as shown by ASTM analysis appears to be an error of the ASTM analysis. Considering the ASTM forms-of-sulfur determination (ASTM D-2492, 1991). the error in organic sulfur determination is associated with the errors from sulfate, pyrite, and total sulfur determinations. The changes in the two-week oxidized sample after PCE extraction may be too small t o offset these errors. However, the sample from a long- term (> 5 years) ambient oxidation shows a noticeable reduction in both total sulfur (20%) and organic sulfur (10%). and a noticeable amount of elemental sulfur (0.07%) obtained by PCE extraction. Similar reductions in sulfur content of the residues and increases in extracted elemental sulfur were obtained for the highly oxidized Ohio 516 sample. The reduction in total sulfur was 20% and in organic sulfur was 2 1 % . and 0.10% elemental sulfur was obtained by PCE extraction.
PCE desulfurization and sulfur analyses by XANES and ASTM methods - Least-squares sulfur K-edge XANES analysis was utilized to resolve organic sulfur into aliphatic, aromatic, and oxidized forms. To take the most precise data on sulfur forms, the data from XANES analysis were combined with w t % pyritic sulfur in coal from the ASTM analysis. The results are listed in Table 2. The data show that two-week oxidation has little effect on elemental sulfur extraction, which is consistent with the HPLC analysis result. However, these data do not identify any form of organic sulfur reduction.
The five-year oxidized sample (Table 2) differs significantly from the two-week oxidized sample in that 35% of the pyritic sulfur has been oxidized to sulfate and to a small amount of elemental sulfur. In addition, the principal forms of organic sulfur appear to be 10% lower in the five-year oxidized sample than in the two-week oxidized sample, suggesting that organic sulfur has been oxidized to some extent. Oxidized organic sulfur (0.1 3%) observed by the XANES analysis supports the indication that organic sulfur has been partially oxidized during this long-term air oxidation. The XANES data also indicate that PCE treatment removes all the elemental sulfur and about half of the oxidized organic sulfur. The apparent difference in sulfate content before and after PCE extraction is attributed t o water washing after the PCE treatment, which removes soluble sulfates.
The Ohio 516 sample behaves similarly to the IBC-104 coal in that the PCE treatment removes all the elemental sulfur and 71 % of the oxidized organic sulfur. The treatment has tittle or no effect on other forms of sulfur. As was the case wi th the coal previously discussed, the large decline in sulfate content is attributed to aqueous washing after PCE extraction.
Overall, the results indicate that oxidation is important to subsequent PCE desulfurization.
2004

I
I
The effects of process conditions (time, temperature, and oxidation) on the amounts of elemental sulfur obtained by PCE extraction - In addition t o ambient oxidation, various short- term, air-oxidation effects (achieved by varying the amount of water, temperature, and time) were examined. As indicated in Table 3 for a partially oxidized coal 0-IBC-101. bubbling air through a suspension of coal in hot PCE with water present produces more elemental sulfur (0.10%) in the extract than the run conducted under the same condition without water present (0.06%). Without water present, as seen in the t w o runs of 0-IBC-101 coals, bubbling air at 90°C for t w o hours does not produce additional elemental sulfur. A similar trend is observed for e fresh sample of IBC-104 (F-IBC-104). The run that was conducted with water present (at 90°C bubbling air for t w o hours) shows a 2-fold increase in elemental sulfur production (0.02%). whereas, the run that was conducted without water present (at 24OC bubbling air for two hours) shows no change in elemental sulfur production. Among all the IBC-104 coal samples, the sample which underwent long-term ambient oxidation has the most elemental sulfur (0.07%).
The results of this investigation indicate that the presence of water during oxidation enhances elemental sulfur production. This implies that the oxidation process can be speeded up by maintaining moist conditions during oxidation.
Dechlorination - A steam-stripping technique has been reported to give a PCE residue from Illinois Herrin (No. 6) coal with a chlorine content of 0.9% (Atwood and Leehe, 1991 ). This level of chlorine in the treated coal would be considered unacceptable by coal users.
Various methods for chlorine removal from the PCE process residues were examined. The amount of chlorine remaining in the PCE-extracted coals was determined. Without any washing, a PCE-extracted coal had a chlorine content as high as 4.68%. as indicated in Table 4. An ISGS proprietary method was developed t o remove excess PCE. This method can totally remove PCE and give PCE-extracted coal with a chlorine content as low as 0.03%.
ASTM forms of sulfur in fresh and oxidized coal samples - Four coals from the Illinois Basin Coal Sample Program (IBCSP) were oxidized under ambient conditions. The forms of sulfur in coals with and without oxidation were then analyzed by the ASTM method. The analyses were performed at the same time with the same instrumental calibration, and by the same operator. The results (Table 5) indicated that the oxidized samples show a noticeable decrease in pyritic sulfur, a noticeable increase in sulfatic sulfur, and a slight increase in "organic sulfur". Total sulfur content in the coals remains unchanged, but the decrease in the amount of pyritic sulfur appears to be equal to the sum of the increases in the amount of sulfatic and organic sulfur. This variation is consistent for all four coal samples analyzed.
In a separate study, a sample of oxidized pyrite (OPY) was extracted wi th PCE. The OPY was prepared by subjecting a pure sample of pyrite to ambient oxidation for more than three years. The oxidized sample was mixed with inert celite for the purpose of diluting the sample for analysis. The diluted sample was then used for PCE extraction. The ASTM analysis of the oxidized sample shows 0.28% "organic sulfur," 0.32% of sulfatic sulfur, and 3.53% of pyritic sulfur (Table 6). After PCE extraction, this ASTM "organic sulfur" disappears, and the PCE extract shows elemental sulfur (0.03%) from HPLC analysis. These data suggest that during oxidation, pyrite in the coal is oxidized. Part of the pyritic sulfur is converted to a sulfatic form and part to the elemental form. Perchloroethylene is known t o be an efficient solvent for elemental sulfur extraction. Thus, the elemental sulfur removed by PCE extraction apparently originated with oxidation of pyrite. This elemental sulfur will be credited as
2005
"organic sulfur'' by the ASTM analysis. This explains why an increase in "organic sulfur" content was observed by ASTM analysis of the oxidized coal samples, and why over- estimation of "organic sulfur" removal by PCE desulfurization of highly oxidized coal samples could occur. Overall, the results of these oxidation studies confirm the hypothesis that oxidation produces elemental sulfur that complicates the interpretation of data on organic sulfur removal by PCE desulfurization obtained from ASTM forms-of-sulfur analyses.
CONCLUSIONS
Oxidation of coals was found to affect subsequent PCE desulfurization. Not only pyritic sulfur but also some of the organic sulfur in coal is oxidized. Elemental sulfur produced from pyrite oxidation and some oxidized forms of organic sulfur are amenable to removal by PCE desulfurization.
The uncertainty in an organic sulfur content calculated by the ASTM method includes the separate errors of the sulfate, pyrite, and total sulfur determinations. A high value for ASTM organic sulfur results from oxidation of coal. Air oxidation of pyrite in coal produces PCE- extractable elemental sulfur. This elemental sulfur is interpreted as "organic sulfur" using the ASTM method for forms-of-sulfur determination.
The data indicate that the ASTM-2492 analytical method for forms-of-sulfur determination is inadequate for interpreting "organic sulfur'' removal by PCE desulfurization.
ACKNOWLEDGEMENT
This work has received direct financial support from the Illinois Department of Energy and Natural Resources (IDENR), through its Coal Development Board and the Center for Research on Sulfur in Coal (CRSC), and from the United States Department of Energy (DOE) through CRSC. However, any opinions, findings, conclusions or recommendations expressed herein are those of the author(s1 and do not necessarily reflect the views of IDENR, CRSC, and DOE. The authors wish to acknowledge Dr. G.P. Huffman and Dr. F.E. Huggins, University of Kentucky, Lexington, KY, for XANES analysis.
REFERENCES
American Society for Testing and Materials, Annual Book of ASTM Sfandards, D-2492, Forms of Sulfur in Coal. 1991. p. 289-294.
Atwood. G.. and H. Leehe. 1991. 'Perchloroethylene Coal Cleaning,' J. Coal Preparafion. Vol. 11, p. 77-86. Buchanan. D.H.. C. Chaven, K. Puharich. L.C. Warfel, K.C. Hackley. C.W. Kruse. and K.K. Ho. 1990. "Organic
Sulfur Removal from Illinois Coal,' Final Technical Repori io ihe Center for Research on Sulfur in Coal, September 1989 to August 1990.
Kruse. C.W.. C. Chaven, L.B. Kohlenberger, H.P. Ehrlinger Ill. D.M. Rapp, J.M. Lytle, and K.S. Vorres. 1991. *Illinois Basin Coal Sample Program," Annual Report to fhe Center for the Research on Sulfur in Coal, September 1990 to August 1991.
Lee, S., K.L. Fullerton, S.K. Kesavan, €.A. Berthinee. and S.W. Watson. 1991. "Process Engineering Studies of the Perchloroethylene Coal Cleaning Process," Proceedings: Sixfeenth Annual Conference on Fuel Science and Conversion, EPRI, Palo Alto, CA. May.
Leehe. H.H.. and R.S. Sehgal. 1988. "Pyritic and Organic Sulfur Removal From Coal With Perchloroethylene,' Proceedings: 1987 Work Shop on Coal Struciure, Electric Power Research Institute, EPRI ER-6099-SR. pp. 8:l-18, November.
Huffman, G.P., S. Mitra. F.E. Huggins, N. Shah, S. Vaidya, and F. Lu. 1991. "Cluantitative Analysis of All Major Forms of Sulfur in Coal by XAFS Spectroscopy,' Energy and Fuel. 1991, Vol. 5 , No. 4, p. 574-581.
2006

Table 1. Elemental sulfur from FCE extraction and ASTM forms of sulfur in short-term and oxidized coals before and after PCE extraction.
long-term air
ii
~ ~~
Oxidized Ohio 5/6. before PCE extract 0.63 0.79 2.08 3.50
dechlorination Oxidized Ohio 516. after PCE extract and 0.28 0.87 1 . 6 4 2 1 ~ 2.79-
.m, % of reduction in total sulfur or organic sulfur; SO. elemental sulfur in PCE extracts by HPLC analysis. in w t % on moisture-free. whole-coal basis.
Table 2. Analysis of sulfur forms by XANES in three oxidized coals before and after R E desulfurization.
' All data were obtained from least-squares sulfur K-edge XANES analysis with the exception of pyritic sulfur which was obtained from the ASTM analysis: oxid., sulfoxide and sulfone.
2007

Table 3. The effects of oxidation conditions on the amount of elemental Sulfur removed by K E extraction
F-IBC-104, un-oxidized IBC-104 coal; 0-IBC-101, slightly ambient-oxidized IBC-101 coal; S', elemental sulfur by HPLC analysis of PCE extracts, in wt%, moisture-free, whole-coal basis.
Table 4. Results of chlorine removal from PCE-extracted residues of an un-oxidized IF-IBC-104-PCE) and an oxidized (O-IEC-104-PCEI coal.
_ _ _ _ - - - _ _ _ _ _ _ _ _ _ _ _ _ _ _ _ _ _ _ _ _ = = = = = = = = = = = = = = = - - - - - - _ _ _ _ _ _ _ - - _ - - - _ _ _ _ _ - - -
Sample Method of washing Total Chlorine ( % I
F-IBC-104 0.03 F-IBC-104-PCE NONE 4.68 F-IBC-104-PCE Water 2.96 F-IBC-104-PCE Proprietary A 0.17 F-IBC-104-PCE Proprietary B 0.03 0-IBC-104-PCE Proprietary B 0.03 0-IBC-104-PCE Proprietary B 0.03
Total chlorine contents are in weight percent, moisture-free, whole-coal basis. - - - - - - _ _ _ _ _ _ _ _ - _ _ _ - _ _ _ _ - _ - - - - - - _ _ _ _ _ - - - - _ _ - _ _ _ _ _ _ _ _ _ _ _ _ _ _ _ _ _ _ _ _ _ _ _ _ _ _ _ _ _ _ _
2008

Table 5. ASTM forms of sulfur in oxidized and un-oxidized IECSP coal samples.
Sample
Oxidized pyrite', before PCE extraction
Oxidized pyrite, after PCE extraction
ASTM forms of sulfur (weight %. moisture free, whole-coal basis)
Sulfatic Pvritic Oraanic Total Coal Sample I
ASTM forms of sulfur weight %. moisture-free, Celite-diluted sample
Sulfatic Pyritic Organic Total
0.32 3.53 0.28 4.13
0.35 3.68 0.01 4.04
4.38
I ,4.35 I A 0.05 1.20 3.10
B 0.54 0.54 3.30 IBC-101
IBC-102
0.03 2.40 4.13
0.84 2.00 4.17
0.02 1.80 1 .so 3.72
0.57 1 .oo 2.25 3.82
IEC-104
IBC-106
A, un-oxidized, preserved under nitrogen; B, oxidized.
Table 6. Sulfur in an oxidized pyrite before and after PCE extraction.
2009

POZZOLANIC REACTMTY AND COMPRESSIVE STBENGTH OF GASIFIED COAL SLAG ADDED WITH LIMESTONE FLUX
Yoshihiko Ninomiya*’, Mitsuho Hirato and Atsushi Sate*' Department of Chemical Engineering
Tokyo University of Agriculture and Technology Koganei, Tokyo 184 Japan
*1) Department of Industrial Chemistry Chubu University
Kasugai, Aichi 487 Japan
INTRODUCTION
In recent years, an entrained flow gasification of coal, which has several advantages over other gasification processes including high throughput per reactor volume and flexibility in coal types, has attracted special interest in many countries. The gasifier involves wet ash removal. The liquid slag formed has suitable viscosity for tapping and is withdrawn at the bottom of the reactor without promoting the corrosion in the reactor insulation. To operate the gasifier stably and to maintain high gasification efficiency, it is necessary to control ash melting temperature by adding limestone which causes decrease in ash melting temperature and slag viscosity(l). The use of the slag/lime mixture as a partial replacement in slag portland cements is of interest, because of utilization of w a s t e slag. Slag portland cements with higher slag contents a r e used for mass concrete because of their low heat evolution. And those with lower slag content are used as a substitute of portland cement. Japanese Industrial Standard (JIS) has permitted the addition of slag or other latent hydraulic or pozzolanic materials to the portland cements.
In this paper, characterization on coal gasification slag loaded with limestone additive obtained from a laboratory-scale entrained bed gasifier was performed in order to obtain the relation between the character of the glass phase, pozzolanic reactivity and compressive strength of the blending component.
EXPERIMENTAL
Two sorts of Blair Athol slag, gasified slag A and B, were obtained from a laboratory-scale entrained bed gasifier@). Limestone was added to the coal as a flux to control operation temperature of the gasifier. The CaO content of the slag was relatively high and, therefore, the melting temperature of the slag was much lower than that of original slag. Important characters of the slag are shown in Table 1.
Infrared spectrum of v stretching vibration of Si-0 bond in slag w a s measured by FT-IR method. 30% CaSOH)z and 10% CaS04.2HzO as activator were added-to each slag. The slag was mixed with water solid ratio of 0.5 and cured at 313K for 1, 7 and 28 days. Hydration reactivity of the blending component w a s evaluated from its hydration degree, amount of combined water and reacted Ca(0H)Z. Hydration degree of the blending component was determined by XRD after heating and recrystallizing hydrated sample at 1273K for half an hour. Amount of combined water and reacted Ca(OH)Z was measured by ignition loss and TG method, respectively@). Compressive strengths of the blending component and the slag cements containing 25 to 75wt% of portland cement were measured in conformity to the JIS (Japanese Industry Standard) method.
2010
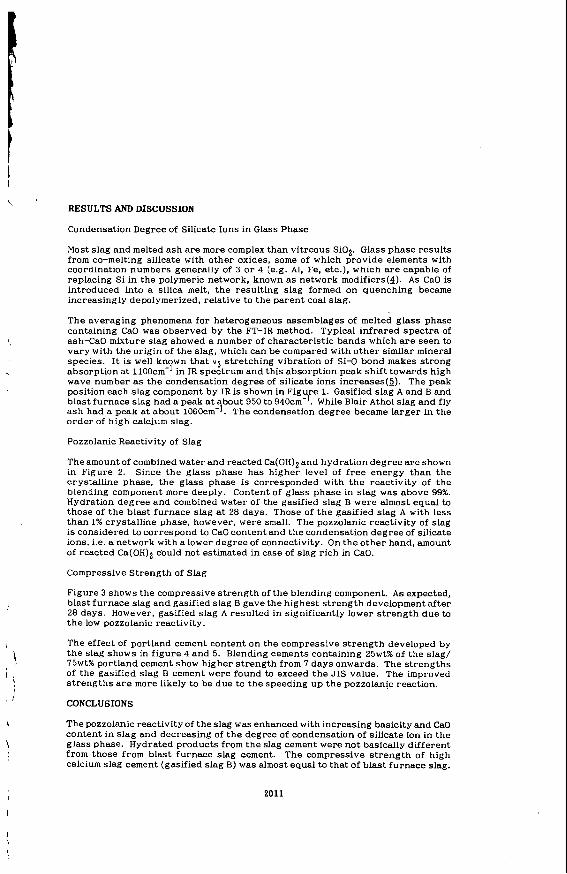
RESULTS AND DISCUSSION \ \ ’
\
t I .’
, i \
\
Condensation Degree of Silicate Ions in Glass Phase
Most slag and melted ash are more complex than vitreous Si02. Glass phase results from co-melting silicate with other oxides, some of which provide elements with coordination numbers generally of 3 o r 4 (e.g. Al, Fe, etc.), which a re capable of replacing Si in the polymeric network, known as network modifiers@). A s CaO is introduced into a silica melt, the resulting slag formed on quenching became increasingly depolymerized, relative to the parent coal slag.
The averaging phenomena for heterogeneous assemblages of melted glass phase containing CaO was observed by the FT-IR method. Typical infrared spectra of ash-Ca0 mixture slag showed a number of characteristic bands which a re seen to vary with the origin of the slag, which can be compared with other similar mineral species. I t is well known that v 3 stretching vibration of Si-0 bond makes strong absorption at 1100cm-I in IR spectrum and this absorption peak shift towards high wave number as the condensation degree of silicate ions increases(?). The peak position each slag component by I R is shown in Figure 1. Gasified slag A and Band blast furnace slag had a peak at about 950 to 940cm-’. While Blair Athol slag and fly ash had a peak at about 1060~m-~. The condensation degree became larger in the order of high calcium slag.
Pozzolanic Reactivity of Slag
Theamount of combined water and reacted Ca(OH)Z and hydration degree a re shown in Figure 2. Since the glass phase has higher level of f ree energy than the crystalline phase, the glass phase is corresponded with the reactivity of the blending component more deeply. Content of glass phase in slag w a s above 99%. Hydration degree and combined water of the gasified slag B were almost equal to those of the blast furnace slag at 28 days. Those of the gasified slag A with less than 1% crystalline phase, however, were small. The pozzolanic reactivity of slag is considered to correspond to CaO content and the condensation degree of silicate ions, i.e. a network with a lower degree of connectivity. On the other hand, amount of reacted Ca(OH)2 cbuld not estimated in case of slag rich in CaO.
Compressive Strength of Slag
Figure 3 shows the compressive strength of the blending component. A s expected, blast furnace slag and gasified slag B gave the highest strength developmentafter 2 8 days. However, gasified slag A resulted in significantly lower strength due to the low pozzolanic reactivity.
The effect of portland cement content on the compressive strength developed by the slag shows in figure 4 and 5. Blending cements containing 25wt% of the slag/ 75Wt% portland cement show higher strength from 7 days onwards. The strengths Of the gasified slag B cement were found to exceed the JIS value. The improved strengths a re more likely to be due to the speeding up the pozzolanic reaction.
CONCLUSIONS
The pozzolanic reactivity of the slag was enhanced with increasing basicity and CaO content in slag and decreasing of the degree of condensation of silicate ion in the glass phase. Hydrated products from the slag cement were not basically different from those from blast furnace slag cement. The compressive strength of high calcium slag cement (gasified slag B) was almost equal to that of blast furnace slag.
2011

REFERENCES 1) M.Hirato and Y.Ninomiya: Study of Fusibility of Coal Ash with Additives -
Estimation of Ash Fusion Temperature and Fusion Behavior of Blending Coal Ashes-, J. of Fuel Society of Japan, 68, 5,393-398 (1989)
2) S.-Y. Lin, S.Kameyama, Y.Ninomiya and M.Hirato: Study on Entrained Flow Gasification of Coal under Ash Fusion Controlling ( I ) , J. of Fuel Society of Japan, 69, 3, 191-199 (1990)
3 ) M.Hirato and Y.Ninomiya: Fundamental Studies on the Cement Material of Coal Gasification Slag with Limestone Additive, J. of Japan Instituteof Energy, 71, 3 , 181-188 (1992)
4) R.T.Hemmings and E.E.Berry: O n the Glass in Coal fly Ashes -Recent Advances-, P.3-38, Symposium Proceedings 113, "Fly Ash and Coal Conversion By- Products: Characterization, Utilization and Disposal IV", ed. G.J. McCarthy et.al., Material Research Society (1988)
5) H.Uchikawa, S.Uchida and S.Hanehara: Effect of Character of Glass Phase in B lending Components on their Reactivity in Calcium Hydroxide Mixture, J. Research of Onoda Cement Company, Vol.116, (1987)
Blair Athol Slag 0 Gasified slag A 0 Gasified slag B
Blast furnace slag
Table 1 C h a r a c t e r i s t i c s of s l a g s used i n t h i s s t u d y
0
0 0
G a s i f i e d s l a g A
( X ) 4 6 . 5
( % ) 2 . 1 2 ( X ) 1 7 . 3 4
MgO ( % ) 0 . 2 4
Fly ash
G a s i f i e d B l a s t F ly a s h s l a g B f u r n a c e
s l a g
0 I
3 9 . 4 6 3 2 . 6 7 5 4 . 1 0 1 4 . 6 1 1 2 . 4 3 2 1 . 0 3
2 . 9 4 0 . 5 6 4 . 7 1 3 5 . 5 6 4 4 . 5 0 1 0 . 4 1
0 . 3 2 5 . 5 6 1 . 2 4
ST (K) 1 6 1 0 1 5 4 0 - - HT (K) 1660 1 5 8 0 - - FT (K) 1 7 0 0 1 6 1 0 - -
c/s 0 . 3 7 0 . 9 0 1 . 3 6 0 . 1 9 (C+M)/S 0 . 3 8 0 . 9 1 1 . 5 3 0 . 2 2 (C+M)/(S+A) 0 . 2 6 0 . 6 6 1.11 0 . 1 6 ( C t M t A ) / S 0 . 8 4 1 . 2 8 1 . 9 1 0 . 6 0 Content o f g l a s s phase 1 % ) 0 . 9 9 0 . 9 9 0 . 9 9 0 . 7 0
A:A1203, C:CaO. M:MgO, S :S i02 ________________________________________---------_-------
Condensation degree 01 silicate ion
Si02 , Siol. polymer ' monomer
Wave number [cm']
Figure 1 Peak position of infrared absorption spectrum of blending component 2012
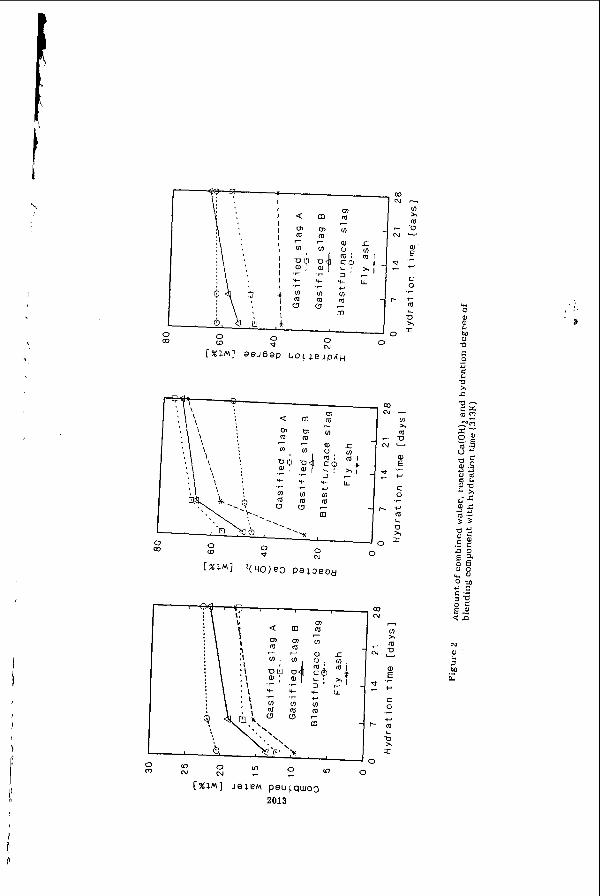
YI
al
M
a E
2
.- E a x -c
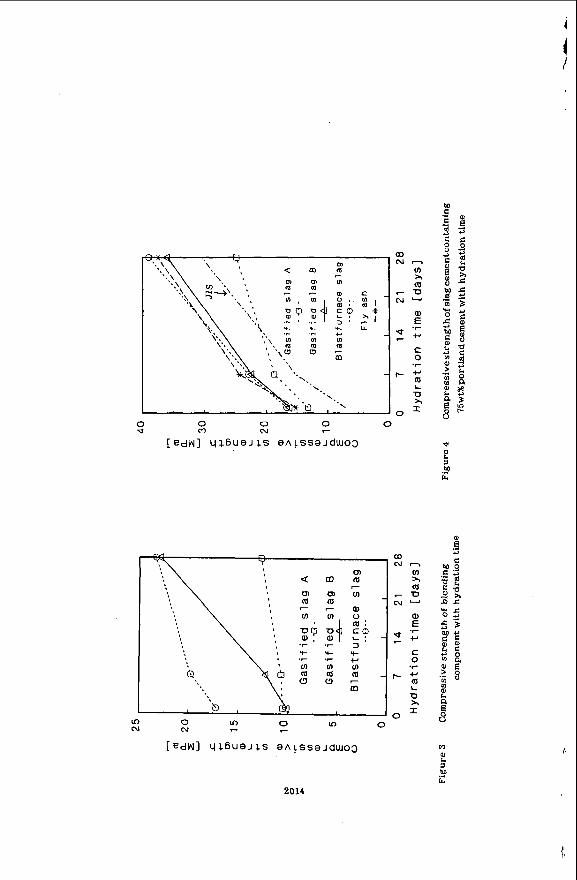
.- .- Y
m N r , *
x a
.-u C U -
E 2 s
F ;
o r
C 0 .I-
L U >I
2014
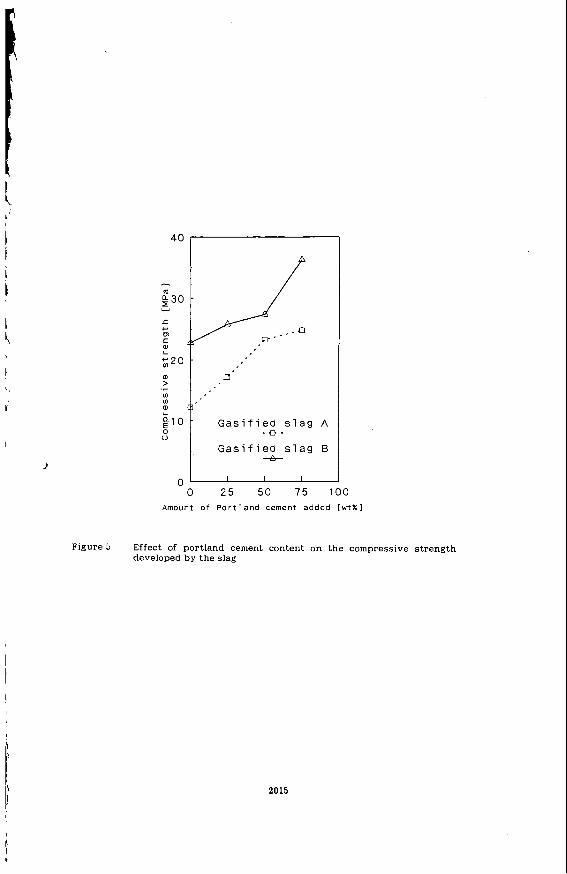
E l 0 Gasified s 0 - 0 -
Gasified s
-
0
-A-
0 2 5 50 75 100 Amount o f Portland cement added [ w t % l
Figure 5 Effect of portland cement content on the compressive strength developed by the slag
2015