catalysts precursors, reactants and solvents were obtained ... · s1.1. catalyst preparation ... 16...
TRANSCRIPT

S1
ELECTRONIC SUPPORTING INFORMATION FOR
Supported nickel-rhenium catalysts for selective hydrogenation of methyl esters to
alcohols
Kaituo Liua,‡, James Pritcharda,‡, Li Lub, Robbert van Puttena, M.W.G.M. (Tiny) Verhoevena,
Mike Schmitkampc, Xiaoming Huanga, Laurent Lefortc, Christopher J. Kielyb, Emiel J. M.
Hensena*, Evgeny A. Pidkoa,d*
a Inorganic Materials Chemistry group, Schuit Institute of Catalysis, Eindhoven University of Technology, P.O. Box 513, 5600 MB Eindhoven, the Netherlands b Department of Materials Science and Engineering, Lehigh University, 5 East Packer Avenue, Bethlehem, PA 18015, U.S.A. c DSM Innovative Sciences, Synthesis BV, P.O. Box 18, 6160 MD Geleen, The Netherlands. d ITMO University, Lomonosova str. 9, St. Petersburg 191002, Russia
* Corresponding authors:
Emiel J.M. Hensen, Tel: +31 40 247 51 78, e-mail: [email protected]
Evgeny A. Pidko, Tel: +31-40-247-2189, e-mail: [email protected]
Electronic Supplementary Material (ESI) for ChemComm.This journal is © The Royal Society of Chemistry 2017

S2
Contents S1. Experimental detals ........................................................................................................... 3
S1.1. Catalyst Preparation ....................................................................................................... 3
S1.2. Catalyst characterisation................................................................................................. 3
S1.2.1. Transmission electron microscopy (TEM).................................................................... 3
S1.2.2. X-ray Energy Dispersive Spectroscopy (XEDS). .......................................................... 3
S1.2.3. Temperature-programmed reduction (TPR) .................................................................. 4
S1.2.4. X-ray photoelectron spectroscopy (XPS)...................................................................... 4
S1.3 Catalyst activity measurements ........................................................................................... 4
S2. Supplementary results ........................................................................................................ 5
S2.1. Catalytic activity testings .................................................................................................. 5
S2.2. STEM-HAADF characterisation........................................................................................ 8
S2.3. X-ray Energy Dispersive Spectroscopy ............................................................................ 12
S2.4. Temperature-programmed reduction (TPR) ...................................................................... 15
S2.5. X-ray photoelectron spectroscopy (XPS).......................................................................... 16
S2.6. Supplementary activity measurements ............................................................................. 18
S2.7. Supplementary bright-field TEM catalyst characterization ................................................ 19

S3
S1. Experimental detals S1.1. Catalyst Preparation Catalysts precursors, reactants and solvents were obtained from Sigma Aldrich: perrhenic acid, HReO4
(75 wt.%, aqueous), nickel nitrate hexahydrate, Ni(NO3)2·6H2O, methyl hexanoate (99.9%), ethyl
hexanoate (99.9%), methyl benzoate (99.9%), hexanoic acid (99.9%) and hexane (99%) were used as
received without additional purification. Catalyst supports were obtained from the following sources:
α-Al2O3 (Condea), Carbon (RX-3, Norit), CeO2 (Sigma Aldrich), SiO2 (Grace), TiO2 (P-25, Degussa).
Supported 3 wt% Ni-x wt% Re catalysts were synthesized by wet-impregnation with all quantities listed
per gram of catalyst. Re contents in the prepared catalysts were:
Ni:Re molar ratio (5:1) (5:2) (2:1) (1:1) (1:2) (1:4) wt.% Re 1.9 3.8 4.8 9.5 19 38.1
In a typical procedure, HReO4 (34-169 µL) was added to a solution of Ni(NO3)2·6H2O (0.1486 g). The
appropriate amount of support (125-250 µm) was then added to the solution while stirring at 80 °C. The
material was dried (110 °C, 16 h), ground using a pestle and mortar and reduced at 300 °C in 10% H2/He
(100 ml/min) for 2 h.
S1.2. Catalyst characterisation S1.2.1. Transmission electron microscopy (TEM)
Transmission electron micrographs were acquired on a FEI Tecnai 20 transmission electron microscope
at an acceleration voltage of 200 kV with a LaB6 source. Typically, a small amount of the sample was
ground and suspended in pure ethanol, sonicated and dispersed over a Cu grid with a holey carbon film.
Samples were first reduced in 10 vol.% H2 in He (total flow 100 mL min-1) at 300 °C for 2 hours,
followed by passivation in 1 vol.% O2 in He for 2 h. Materials for analysis by scanning transmission
electron microscopy (STEM) were dry dispersed onto a holey carbon TEM grid. The catalyst samples
were examined using high angle annular dark field (HAADF) imaging mode in an aberration corrected
JEOL ARM-200CF TEM/STEM operating at 200 kV. This microscope was also equipped with a
Centurio silicon drift detector (SDD) system for X-ray energy dispersive spectroscopy (XEDS)
analysis.
S1.2.2. X-ray Energy Dispersive Spectroscopy (XEDS).
Quantification of the XEDS spectra was carried out via the Thermo NORAN System SIX (NSS)
software using the Cliff-Lorimer method assuming no X-ray absorption.[S1]The Ni Kα (peak range:
7331-7623 eV) and Re Lα (peak range: 8496-8806 eV) were used to quantify the relative proportions
of the two elements in the areas analyzed. Standardless Gaussian fitting was applied to the two
characteristic peaks, with the k-factors pre-determined by the NSS software (kNi Kα=1.217, kRe Lα=2.652)
[S1] G. Cliff and G. Lorimer, the quantitative analysis of thin specimens. [J. Microsc. 1975, 103, 203.]

S4
S1.2.3. Temperature-programmed reduction (TPR)
H2-TPR experiments were performed in a Micromeritics Autochem II 2920 equipped with a fixed-bed
reactor, a computer-controlled oven, and a thermal conductivity detector. Typically, 50 mg catalyst was
loaded in a tubular quartz reactor. The sample was reduced in 4 vol.% H2 in N2 at a flow rate of 10
mL/min, while heating from room temperature up to 700 °C at a ramp rate of 2 °C/min. The H2 signal
was calibrated using a CuO/SiO2 reference catalyst.
S1.2.4. X-ray photoelectron spectroscopy (XPS)
XPS measurements were carried out with a Thermo Scientific K-Alpha, equipped with a
monochromatic small-spot X-ray source and a 180° double focusing hemispherical analyzer with a 128-
channel detector. Spectra were obtained using an aluminium anode (Al Kα = 1486.6 eV) operating at
72 W and a spot size of 400 µm. Survey scans were measured at a constant pass energy of 200 eV and
region scans at 50 eV. The background pressure was 2 x 10⁻⁹ mbar and during measurement 3 x 10⁻⁷
mbar Ar because of the charge compensation by the dual-beam low energy electron / Arion source.
Data analysis was performed using CasaXPS software. The binding energy was corrected for surface
charging by taking the C 1s peak of adventitious carbon as a reference at 284.6 eV.
S1.3 Catalyst activity measurements All hydrogenation experiments were prepared inside a large, two-hand glove bag (AtmosBag
with zipper lock, Sigma Aldrich). The glove bag was purged five times with nitrogen after which a
constant flow rate was applied to give a suitable working over-pressure. A pre-reduced catalyst (3–18
mg) was then loaded into a small stainless steel autoclave followed by the addition of solvent (3.5 mL),
substrate (0.44 mmol) and internal standard (dodecane, 35.2 µL) after which the autoclave was sealed
and removed from the glove bag. The catalytic reactions were carried in the absence of any source of
light. The autoclave was subsequently purged five times with hydrogen (2 MPa) before filling the vessel
to the desired pressure (5 MPa). Using a hot plate equipped with magnetic stirring capability, the
autoclave was gradually heated to 180 oC (unless otherwise stated) before stirring at 1000 rpm was
commenced (1-8 h). On completion of the reaction, both heating and stirring were stopped, the
autoclave was removed from the hot plate and then cooled in ice-cold water. Once cooled, the contents
of the autoclave were filtered using an organic-based polymer frit and a sample was prepared for GC-
FID analysis (Shimadzu GC-FID equipped with RX-5 carbowax column). Calibration was performed
using known concentrations of all reactants and products in order to determine correct response factors.

S5
S2. Supplementary results S2.1. Catalytic activity testings
THF Hexane 1,2-DME 1,4-Dioxane0
20
40
60
80
100
% C
onve
rsio
n
0
20
40
60
80
100
% S
elec
tvity
Figure S1 Effect of solvent on the performance of Ni-Re (1:2)/TiO2 catalysts in the hydrogenation of
methyl hexanoate. Conditions: Catalyst (18 mg), methyl hexanoate (0.44 mmol), hexane (3.5 mL),
dodecane (35.2 µL), 180 °C, 50 bar H2, 8 h, 1000 rpm.
TiO2 CeO2 Al2O3 Carbon Silica0
20
40
60
80
100
% C
onve
rsio
n
0
20
40
60
80
100
% S
elec
tivity
Figure S2 Effect of catalyst support on the performance of Ni-Re (1:2) catalysts in the hydrogenation
of methyl hexanoate. Conditions: Catalyst (18 mg), methyl hexanoate (0.44 mmol), hexane (3.5 mL),
dodecane (35.2 µL), 180 °C, 50 bar H2, 8 h, 1000 rpm.

S6
3 mg 10 mg 18 mg0
20
40
60
80
100%
Con
vers
ion
Catalyst Mass
0
20
40
60
80
100
% S
elec
tivity
Figure S3 Effect of catalyst loading on the performance of Ni-Re (1:2)/TiO2 catalysts in the
hydrogenation of methyl hexanoate. Conditions: Catalyst (3-18 mg), methyl hexanoate (0.44 mmol),
hexane (3.5 mL), dodecane (35.2 µL), 180 °C, 50 bar H2, 8 h, 1000 rpm.
0 2 4 6 80
20
40
60
80
100
% C
onve
rsio
n
Time (h)
0
20
40
60
80
100
% S
elec
tivity
Figure S4 Time-on-line analysis of the conversion of methyl hexanoate in hexane solvent and its
selectivity to hexanol for Ni-Re (1:2)/TiO2 catalysts. Conditions: Catalyst (18 mg), methyl hexanoate
(0.44 mmol), hexane (3.5 mL), dodecane (35.2 µL), 180 °C, 50 bar H2, 2-8 h, 1000 rpm.

S7
150 160 170 1800
20
40
60
80
100%
Con
vers
ion
Temperature (oC)
0
20
40
60
80
100
% S
elec
tivity
Figure S5 Effect of reaction temperature on the performance of Ni-Re (1:2)/TiO2 catalysts in the
hydrogenation of methyl hexanoate. Conditions: Catalyst (18 mg), methyl hexanoate (0.44 mmol),
hexane (3.5 mL), dodecane (35.2 µL), 180 °C, 50 bar H2, 8 h, 1000 rpm.

S8
S2.2. STEM-HAADF characterisation
Figure S6 Representative STEM-HAADF micrographs of the Ni /TiO2 catalyst. (a) shows a lower
magnification view in which 2-3 nm Ni containing particles are primarily visible similar to the BF-
TEM images presented in Figure 2. Some of the particles appear disordered in nature (a,b) while others
are clearly more crystalline (c, d, e). More detailed analysis of the lattice fringe spacings and intersection
angles suggest the latter are primarily NiO. These Ni-containing particles exhibit relatively low contrast
in these HAADF images due to the similarity in atomic number between Ti (z = 22) and Ni (z = 28).
The much stronger contrast shown by Re atoms in the subsequent HAADF images presented in Figures
S7 and S8 is due to the significantly higher mass of Re (z = 75).
(a) (b) (c)
(d) (e)
S9
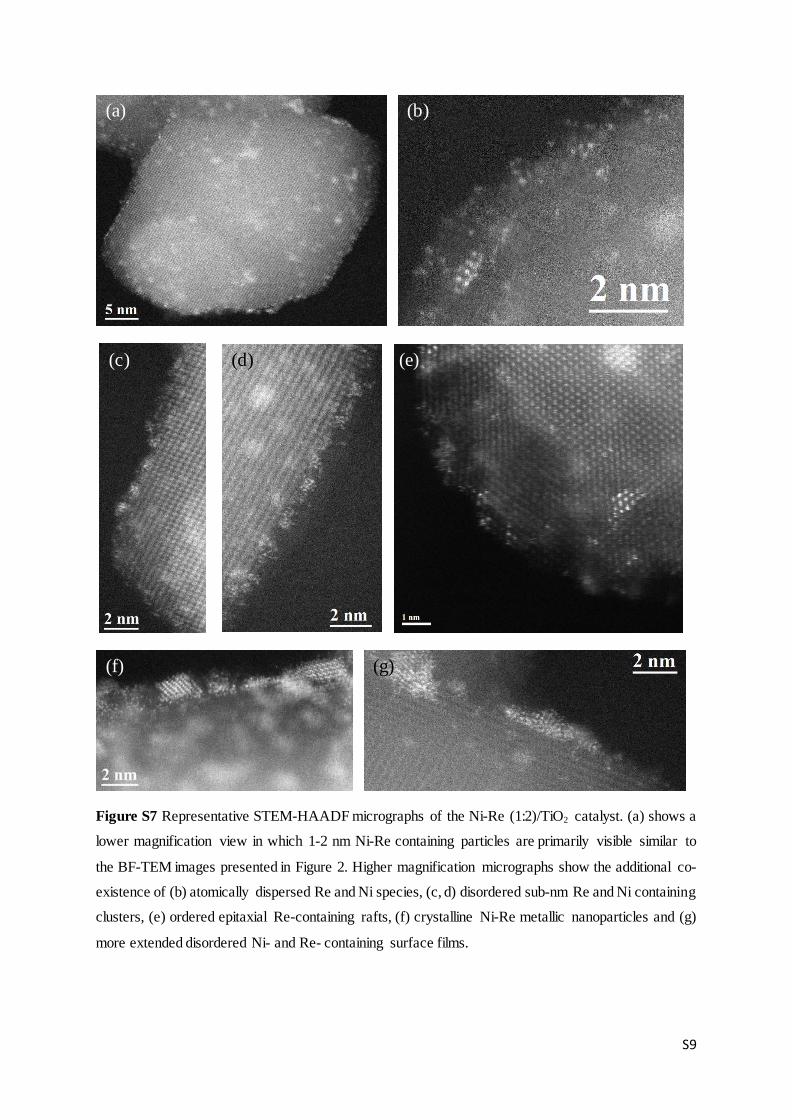
Figure S7 Representative STEM-HAADF micrographs of the Ni-Re (1:2)/TiO2 catalyst. (a) shows a
lower magnification view in which 1-2 nm Ni-Re containing particles are primarily visible similar to
the BF-TEM images presented in Figure 2. Higher magnification micrographs show the additional co-
existence of (b) atomically dispersed Re and Ni species, (c, d) disordered sub-nm Re and Ni containing
clusters, (e) ordered epitaxial Re-containing rafts, (f) crystalline Ni-Re metallic nanoparticles and (g)
more extended disordered Ni- and Re- containing surface films.
(a) (b)
(c) (d) (e)
(f) (g)
S10
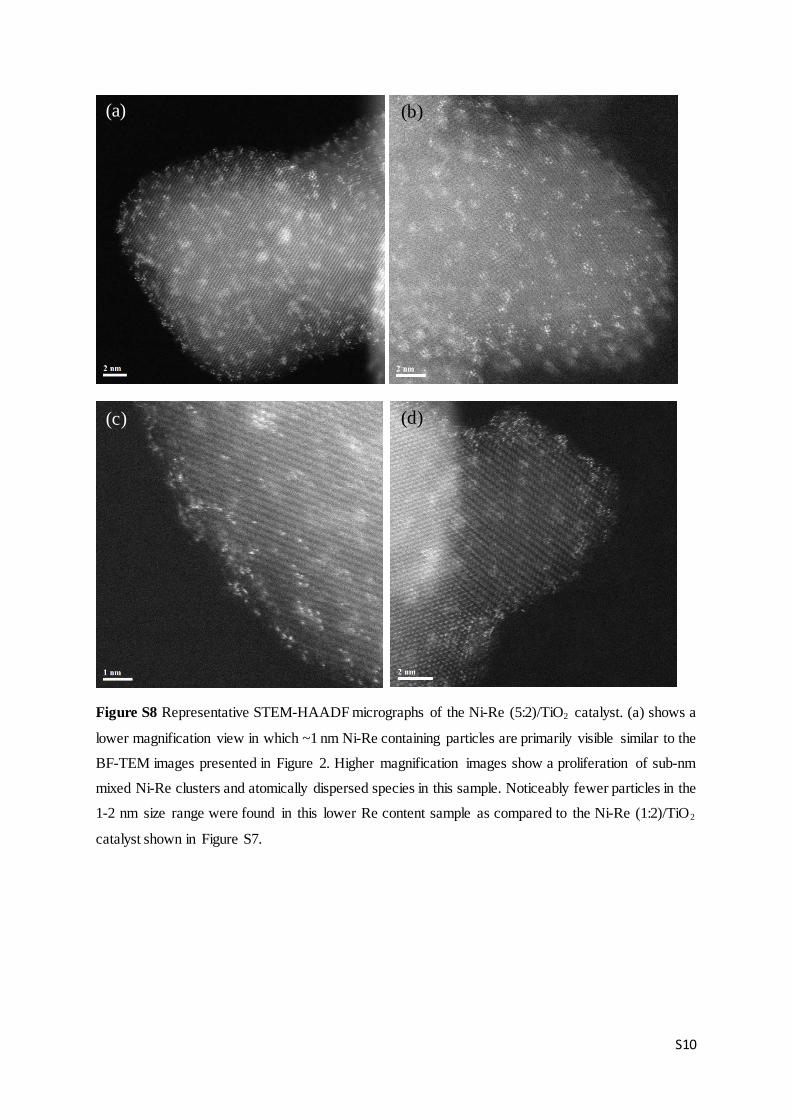
Figure S8 Representative STEM-HAADF micrographs of the Ni-Re (5:2)/TiO2 catalyst. (a) shows a
lower magnification view in which ~1 nm Ni-Re containing particles are primarily visible similar to the
BF-TEM images presented in Figure 2. Higher magnification images show a proliferation of sub-nm
mixed Ni-Re clusters and atomically dispersed species in this sample. Noticeably fewer particles in the
1-2 nm size range were found in this lower Re content sample as compared to the Ni-Re (1:2)/TiO2
catalyst shown in Figure S7.
(a) (b)
(c) (d)

S11
Figure S9. Representative STEM-HAADF micrographs of the Re (18 wt. %)/TiO2 catalyst. (a) and (b)
show lower magnification views evidencing inhomogeneous distributions Re-containing nanoparticles
(NPs). Although some very larger aggregates can be noted in (a), smaller polycrystalline aggregates of
<10 nm (inset in (a)) are more populous. Lattice fittings of large NPs suggest that they are metallic Re
(c,d). Higher magnification images evidence the presence of NPs of different size including
nanocrystals (e-h), clusters and Re atoms (e,f,h). Lattice fringes of ~ 1nm nanocrystals (yellow arrows)
in (e) appear to be parallel to each other, suggesting their epitaxial relation with the support. The
crystalline NPs in (g) and (h) were fitted to Re2O7 and ReO2, respectively. The collected data indicates
the presence of crystalline NPs with Re in different oxidation states, with more oxidized Re observed
in smaller NPs.
S12
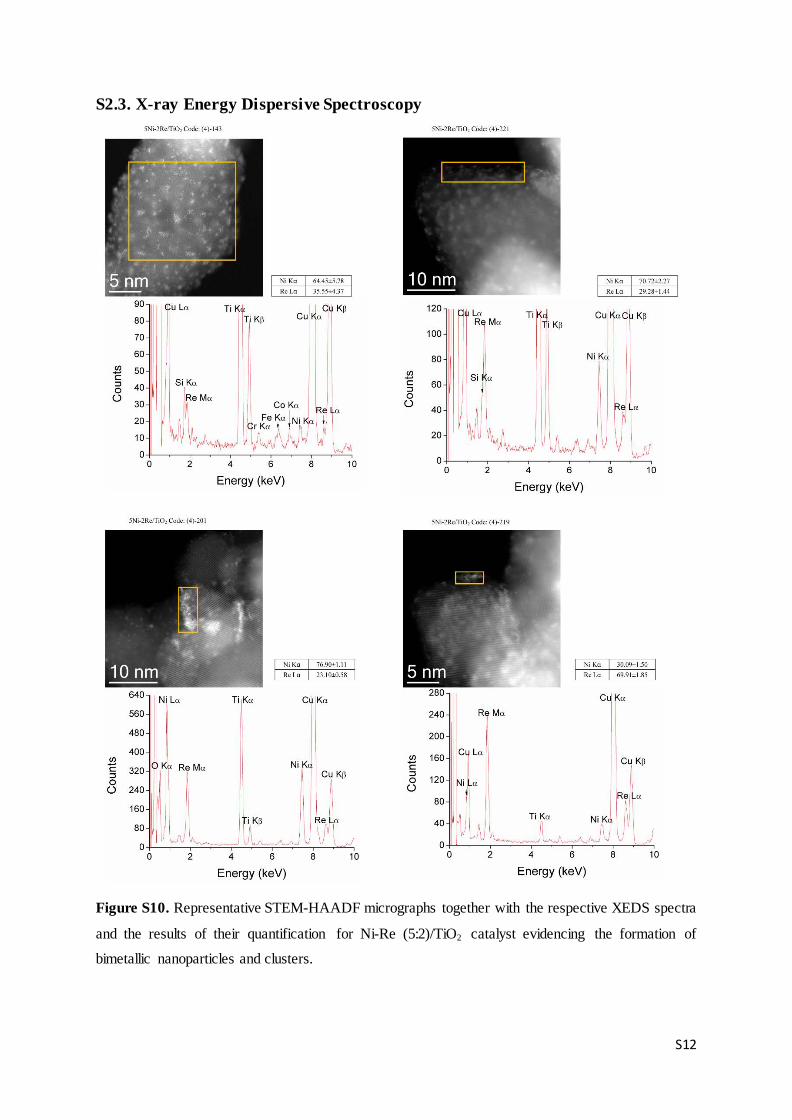
S2.3. X-ray Energy Dispersive Spectroscopy
Figure S10. Representative STEM-HAADF micrographs together with the respective XEDS spectra
and the results of their quantification for Ni-Re (5:2)/TiO2 catalyst evidencing the formation of
bimetallic nanoparticles and clusters.

S13
Figure S11. Representative STEM-HAADF micrographs together with the respective XEDS spectra
and the results of their quantification for Ni-Re (1:1)/TiO2 catalyst evidencing the formation of
bimetallic Ni-Re nanoparticles and clusters.

S14
Figure S12. Representative STEM-HAADF micrographs together with the respective XEDS spectra
and the results of their quantification for Ni-Re (1:2)/TiO2 catalyst evidencing the formation of Ni-Re
bimetallic nanoparticles.
N.B. The analysis of a large number of XEDS spectra collected at varied locations for different Ni-
Re/TiO2 catalysts suggests a general trend for all materials that nanoparticles are more likely to be Re-
rich, whereas sub-nanosized clusters are more Ni-rich or show chemical composition closer to the
nominal metal loading ratio.
(a)

S15
S2.4. Temperature-programmed reduction (TPR)
Figure S13 TPR profiles of (left) Ni-Re (x:y)/TiO2 and (right) Ni-Re (1:2) on TiO2, CeO2, C and Al2O3
catalyst supports.
Table S1. Summary of calculated hydrogen-to-metal ratios for TiO2-supported Ni, Re and Ni-Re
(x:y)/TiO2 catalysts.
H2/metal ratio
Ni (3 wt. %)/TiO2 3.17
Ni:Re (1:1)/TiO2 1.91
Ni:Re (1:2)/TiO2 1.45
Ni:Re (2:1)/TiO2 1.81
Ni:Re (5:1)/TiO2 1.79
Re(13 wt. %)/TiO2 2.17
Re (18 wt. %)/TiO2 2.88

S16
S2.5. X-ray photoelectron spectroscopy (XPS)
Figure S14 XP spectra of Ni(2p) region for the reduced Ni-Re (5:1) and Ni-Re(1:1)/TiO2 catalyst.

S17
Figure S15. XP spectra in Re(4f) region of the reduced titania-supported Re- and Ni-Re catalysts.

S18
S2.6. Supplementary activity measurements
0 2 4 6 8 10 12 14 16
0
20
40
60
80
100
% C
onve
rsio
n
Time / h
0
20
40
60
80
100
% S
elec
tivity
Figure S16 Time-on-line analysis for Ni-Re (1:2)/TiO2 catalysts in the hydrogenation of methyl
hexanoate in octane showing selectivity to 1-hexanol (black) and hexane (green). Conditions: Catalyst
(18 mg), methyl hexanoate (0.44 mmol), hexane (3.5 mL), dodecane (35.2 µL), 180 °C, 50 bar H2, 8 h,
1000 rpm.
Table S2 Evaluation of the activity of the TiO2-supported Re catalysts in hydrogenation of methyl
hexanoate in octane solvent. Catalyst (18 mg), methyl hexanoate (0.44 mmol), octane (3.5 mL),
dodecane (35.2 µL), 180 °C, 50 bar H2, 8 h, 1000 rpm.
Catalyst Conv. (%) Selectivity to, %
hexanol hexane other
Re (5%) /TiO2 31 42 36 32
Re (13%) /TiO2 70 75 7 18
Re (18%) /TiO2 65 80 6 14

S19
S2.7. Supplementary bright-field TEM catalyst characterization
Figure S17 Representative TEM micrograph and corresponding particle-size distribution histogram for
a Ni-Re(1:2)/TiO2 catalyst recovered after methyl hexanoate hydrogenation reaction and re-reduced in
10% H2 (300 oC/ 1 h).
Figure S18 Representative TEM micrograph and corresponding particle-size distribution histogram for
a Ni-Re(1:2)/TiO2 catalyst prepared by a consecutive impregnation methodology and reduced twice in
10% H2 (300 oC/ 2 h).
0.4 0.8 1.2 1.6 2.0 2.4 2.80
5
10
15
20
25
30
35 r = 0.96 nmσ = 0.24 nm
Freq
uenc
y (%
)
Particle Size (nm)
Re[Ni] (2:1)/TiO2
0.4 0.8 1.2 1.6 2.0 2.4 2.80
10
20
30
40
50 r = 0.88 nmσ = 0.20 nm
Freq
uenc
y (%
)
Particle Size (nm)