catalyst courier
DESCRIPTION
grace catalyst guideTRANSCRIPT

NUMBER 104 Fa l l 2008
Cracking the Bottom of the Barrelwith MIDAS® Technology
®

Break the bottom of your barrel withGrace Davison's MIDAS® FCC catalyst.
Grace Davison Refining Technologies7500 Grace Drive • Columbia, Maryland USA 21044+1.410.531.4000 • +1.410.531.8246 (fax) • www.e-catalysts.com
F C C C a t a l y s t
Grace Davison's revolutionary MIDAS® -300 catalyst is commercially proven to upgrade the bottom of your FCC barrel.
Designed by Grace Davison specifically for today's diesel-driven market, MIDAS® -300 offers high activity matrix surfacearea, balanced with an optimized zeolite level.
MIDAS® -300 FCC catalyst is just the latest result of our 60+ year commitment to understanding bottoms crackingmechanisms and catalysts. Contact us for information on how Grace Davison can provide catalytic solutions to yourbottoms cracking needs.
Grace Davison Refining Technologies

A message from the editor...
Dear Refiners:
As the demand for diesel fuel grows, many of you are faced with the challenge of re-optimizing your oper-
ations to maximize light cycle oil (LCO) yield. This issue of the Catalagram® is devoted to strategies for our cus-
tomers to tap the bottom of the barrel and expand their LCO output and then process this feed for maximum ultra
low sulfur diesel (ULSD) yield.
Grace Davison has recently commercialized a max LCO version of our industry-leading MIDAS® FCC cata-
lyst technology. MIDAS®-300, together with the operating strategies presented here, will allow any refiner to ensure
profitable maximum LCO operations while maintaining high C3+ liquid yield and gasoline octane. For an additive
approach, BX™-450 can help maximize distillate yield.
Hydroprocessing LCO from the FCCU, as well as synthetic crudes and other pre-processed streams, can
present problems that impact unit performance. As discussed in the article “Maximizing ULSD Unit Performance
when Processing LCO and other Previously Processed Feeds”, ADVANCED REFINING TECHNOLOGIEScan work
closely with refining technical staff to help plan for processing these opportunity feeds.
If you want more information on the best catalysts and strategies for bottom-of-the barrel upgrading, con-
tact your Grace Davison technical sales representative or me at [email protected].
Joanne DeadyVice PresidentMarketing/R&DGrace Davison Refining Technologies
James J. Blazek passed away on August 25, 2008 in Reisterstown, Maryland at theage of 78. Jim worked for Grace Davison from 1957 until his retirement in 1994.
Anyone who works in the FCC business has been touched by Jim's work at somepoint. Shortly after joining Grace Davison, he formed the first Technical Service Teamin the industry. A half-century later, refiners worldwide rely on Grace Davison'sTechnical Service to optimize their operations. Jim was also instrumental in startingthe Catalagram in 1959, as well as the Equilibrium Catalyst Analysis Program in thelate 1950's at Grace Davison. In the early 1970's, Jim also co-wrote and edited the
first "Grace Davison Guide to Fluid Catalytic Cracking" (known as the "Silver Bullet") that served as the basis for ourwidely-used, three-part Guide of the same name.
He received his B.S.Ch.E. from Purdue University and worked for Atlantic Refining In Philadelphia, PA. He servedin the U.S. Army during the Korean War. Following his military service, Jim worked for Standard Oil of New Jersey'sEsso Refinery in Baltimore, MD until he joined Grace Davison. Jim co-authored numerous technical articles andpapers during his years here.
His wife, Terry, passed away in 1999. Jim and Terry are survived by their son, Matt, who works at Grace Davison'sColumbia, MD headquarters in FCC R&D; daughter, Barbara Regan, and sons, Jim and Paul.
Jim hired and mentored some of the best talent in the FCC business during his time here. He continued to encour-age and inspire us until his passing. He and his wife, Terry, were well-loved and well-respected members of ourGrace Davison FCC "Family."

IN THIS ISSUE
Maximizing FCC Light Cycle Oil Operating Strategies: IntroducingMIDAS®-300 Catalyst for Increased LCO SelectivityBy David Hunt, Rosann Schiller, and Matthew Chang, Grace Davison RefiningTechnologiesMaximizing LCO yield is largely a slurry management process. Refiners canreduce FCC operating severity, optimize fractionator conditions, and/or changefeedstocks in a effort to increase LCO yields. Grace Davison’s experiencedtechnical service engineers can assist with these unit-specific optimizations.LCO volume yield could be further increased with Grace Davison’s newMIDAS®-300 catalysts. Our new technology is also available in a specially for-mulated additive. BX™-450, the industry’s first LCO maximization additive.
Maximizing ULSD Unit Performance when Processing LCO and otherPreviously Processed FeedsBy Brian Watkins, Advanced Refining TechnologiesULSD has evolved from simply meeting the diesel sulfur specification to a con-stant awareness of unit performance in order to process difficult streams suchas FCC light cycle oil (LCO) and other thermally cracked stocks; syntheticcrudes; and various other pre-processed feed sources. It is important tounderstand the impacts of processing new feed streams, and this paper high-lights a few examples demonstrating significant differences in feed reactivity,which are not necessarily anticipated from the usual bulk feed analyses.
Grace Davison Issues New Shipping Guidelines for Hydrocarbon SamplesBy Larry Langan, Grace Davison Refining TechnologiesThis article provides an overview of the shipping guidelines recommended byGrace Davison for materials being sent to U.S. locations for analysis and test-ing from customers and potential customers.
Answers to Questions from the 2008 NPRA Q&A Session-FCC SectionBy Kristen Wagner, Grace Davison Refining Technologies
1
CATALAGRAM 104Fall 2008
Managing Editor:Joanne Deady
Contributors:David Hunt
Rosann SchillerMatthew ChangBrian WatkinsLarry LanganKristen Wagner
Please addressyour comments to
©2008W. R. Grace & Co.-Conn.
The information presented herein is derived from our testing and experience. It is offered, free of charge, for your consid-eration, investigation and verification. Since operating conditions vary significantly, and since they are not under our con-trol, we disclaim any and all warranties on the results which might be obtained from the use of our products. You shouldmake no assumption that all safety or environmental protection measures are indicated or that other measures may not berequired.
NUMBER 104 Fa l l 2008
Cracking the Bottom of the Barrelwith MIDAS® Technology
®
Grace Davison Refining Technologies7500 Grace Drive • Columbia, MD 21044 • 410.531.4000
www.e-catalysts.com
9
14
18
rev.1/09

Catalagram 104 Fall 2008 1
David HuntFCC Technical Service Manager
Rosann SchillerProduct Manager, Base Catalysts
Matthew ChangProduct Manager, Light Olefins
Grace DavisonRefining TechnologiesColumbia, MD USA
race Davison RefiningTechnologies announces newMIDAS® catalyst technology
designed to tap the value at the bot-tom of the barrel and maximize unitprofitability with higher LCO yield.MIDAS®-300 FCC catalyst is the latestresult of Grace Davison’s 60+ yearcommitment to defining bottomscracking mechanisms and catalysis.MIDAS®-300, together with the operat-ing strategies presented here, willallow any refiner to ensure profitablemaximum LCO operations while main-taining high C3+ liquid yield and gaso-line octane.
Adoption of clean fuel standards inthe United States shifted economicconditions such that the value of ultra
low sulfur diesel (ULSD) is equiva-lent to or exceeds the value ofgasoline. Demand shifts havemeant new objectives for FCC units,shifting production away from gaso-line and towards LCO (light cycleoil). Designed to produce high vol-umes of gasoline, many FCC unitsare now being re-optimized to boostyields of LCO to meet the increaseddistillate demand.
Since 2002, the growth in distillatedemand has been more than dou-ble that of gasoline (Figure 1). Thistrend is not occurring only in theUnited States and developedregions, but also in developingregions such as South America, theformer Soviet Union, Middle East
Maximizing FCC Light Cycle OilOperating StrategiesIntroducing MIDAS®-300 Catalyst forIncreased Selectivity
G

www.e-catalysts.com2
and Asia Pacific (Figure 2). Futuredemand of distillate relative togasoline in North America isexpected to increase, as shown inFigure 3, largely due to the EnergyIndependence and Security Act of2007. New Corporate Average FuelEconomy (CAFE) standards requireauto manufacturers to boost fuelmileage to 35 mpg by 2020. Thisapplies to all passenger automo-biles, including light trucks. To meetthis challenging fuel mileage stan-dard, more efficient vehicles pow-ered by hybrid and diesel enginesare expected. The EnergyIndependence and Security Actalso requires the total amount ofbiofuels added to gasoline toincrease to 36 billion gallons by2022, up from 4.7 billion gallons in2007.
Technical Challenges
The primary challenge in the FCCunit is increasing LCO, yet minimiz-ing any incremental slurry yield.Figure 4 shows how LCO and slurryyield change with conversion. LCO,like gasoline, is an intermediateproduct increasing with conversionat very low conversion levels, even-tually reaching an over-crackingpoint. Past the over-cracking point,LCO yield declines with increasingconversion. This high conversionregime represents the traditionalFCC unit-operating window.
The optimal LCO yield may not be atthe maximum LCO point due toincreased amounts of slurry atlower conversion. As a result, max-imizing LCO yield is largely a slurrymanagement process.
Refiners tend to focus on the follow-ing strategies to maximize LCO pro-duction:
1. Operating Conditions• LCO and gasoline cut
point shifts• Reactor and feedstock
temperatures and equilib-rium activity optimization
2. Recycle Streams• Heavy Cycle Oil (HCO) or
slurry
Year
115%
110%
105%
100%
95%
2002 2003 2004 2005 2006 2007
GasolineDistillate
Perc
enta
geC
hang
efr
om20
02
Figure 1United States Gasoline and Distillate Demand
Shar
eof
Glo
balD
istil
late
3.00%
2.10% 2.20%
2.00%
3.50%
3.00%2.90%
Gro
wth
Rat
e
Figure 2Global Distillate Share and Growth Rates Through 2013
1995
2.11
1.77 1.681.88
2000 2006 2010 2015
2.13
Gas
olin
eto
Dis
tilla
teR
atio
Figure 3North America Gasoline to Distillate Demand Ratio
Source: U.S. Department of Energy,Energy Information Administration
Source Hart Energy Consulting based on 2007 IEA data
Source: Hart Energy Consulting Analysis and Forecast 2007

Catalagram 104 Fall 2008 3
3. Feedstock • Removal of diesel range
material from the FCC feedstock
• Feed hydrotreater severity optimization
• Residual feedstock opti-mization
4. Catalyst Optimization• Increasing bottoms con-
version• Maintaining C3+ liquid
yield and gasoline octane
In the following sections we discussthese commonly employed operat-ing strategies to increase FCC LCOyield and unit profitability.
Operating Conditions
Gasoline end point reduction is themost common operating strategy forincreased LCO production.Approximately 10% of the gasolinecan be moved to LCO by reducingthe gasoline cut point from 430°F to350ºF TBP, limited often by a mini-mum main fractionator top tempera-ture and maximum LCO flash point.The LCO cut point should beincreased within the maximum mainfractionator bottoms temperatureand diesel hydrotreater constraints.Many refiners operate with LCOendpoints near 700ºF.
Figures 5, 6 and 7 shows the effectof reactor temperature, feedstocktemperature and equilibrium cata-lyst (Ecat) activity on the yield ofLCO and slurry yield. (These datawere generated using a commercialFCC model). Operating at lowerconversion (by re-optimizing theseoperating conditions) can increaseLCO. Figures 5-7, like Figure 4, con-firm that the true challenge of maxi-mum LCO operations is minimizingincremental slurry yield.
Air blower and wet gas compressordemand is reduced at lower reac-tor temperature or higher feed tem-peratures. As a result, the refinerymay choose to increase feed rateor introduce a recycle stream topush the unit back to an operatingconstraint during maximum LCOoperations.
Conversion, vol.%LC
O a
nd S
lurr
y, v
ol.%
LCO Slurry
Figure 4LCO and Slurry Selectivity
Reactor Temperature, ˚F
LCO
, vol
.%
Slur
ry, v
ol.%
LCO Slurry
Figure 5Reducing Reactor Temperature Increases
LCO and Slurry Yields
Feed Temperature, ˚F
LCO
, vol
.%
Slur
ry, v
ol.%
LCO Slurry
Figure 6Raising Feed Temperature Increases
Both LCO and Slurry Yields

www.e-catalysts.com4
Recycle
Operating with a recycle stream of700+ ºF material can increase LCOyield without producing incrementalslurry yield during lower conversionoperations. HCO in the 700-850°Frange is preferred over slurry(700°F+) due to its lower conradsoncarbon and higher saturate content.Table I shows pilot plant data whereHCO was cracked neat over Ecat.The HCO feed had an API gravity of10°, carbon level of 0.1 wt.%, andan endpoint of 790°F. At a reactortemperature of 970°F and an Ecatmicroactivity (MAT) of 72%, conver-sion was only 37 wt.%, yet resultedin 33 wt.% LCO and 19 wt.% gaso-line. The coke yield is quite high forsuch a low conversion.
Table II shows commercial data forone cat cracker that operated inboth gasoline and LCO maximiza-tion modes. With recycle and lowerEcat activity, LCO increased ~14vol%.1 Note that dry gas and cokeyields also rose with increasedrecycle. Lower air blower and wetgas compressor demand by operat-ing at lower reactor temperatureand higher feedstock temperature,however, may allow the refinery tooperate with a recycle stream.
Ideally, recycle should be intro-duced to the riser in dedicatedinjectors above the fresh feed injec-tors. This practice increases theriser mix zone temperature for agiven riser outlet temperature.Higher mixed temperature of thefeedstock and catalyst at the baseof riser in order to ensure goodfeedstock vaporization at low risertemperatures in order to minimizeslurry yield. Using dedicated injec-tors for recycle, instead of process-ing the recycle through the primaryfresh feed injectors, also eliminatesany damage of the fresh feed injec-tors due to catalyst particles pres-ent in slurry recycle.
Ecat Activity, wt.%LC
O, v
ol.%
Slur
ry, v
ol.%
LCO Slurry
Figure 7Lower Ecat Activity Increases LCO and Slurry Yields
ProductDry gasLPGGasolineLCO (430-660˚F)SlurryCoke
Yield (wt.%)3.08.0
19.033.030.07.0
Table IHCO Cracking Riser Pilot Plant Data
Gasoline Mode Diesel Mode
Combined Feed Ratio 1.07 1.25
Dry Gas 3.4 4.0
LPG 15.7 13.1
Gasoline (C5-420ºF) 43.7 32.1
LCO (420 to 700ºF) 22.9 (~21.3 vol.%) 36.8 (~35.6 vol.%)
Slurry (700ºF+) 8.2 7.3
Coke 6.1 6.7
Conversion (420ºF) 69.8 55.9
Riser Temperature, ºF 950 950
Feed Concarbon, wt.% 3.75 3.75
ECAT Activity Base Base-4
Yields, wt.%
Table IIEffect of Recycle and Lower Ecat Activity
on LCO Production

Catalagram 104 Fall 2008 5
Feedstock
Feedstock composition has a verysignificant effect on LCO yield andquality. In general, the LCO yieldand quality decline with improvedfeedstock quality.2
Feedstock with increased amountsof di- and tri-aromatic cores willincrease the yield of LCO.3 Aromaticcores are inert to catalytic crackingand once the alky groups andnaphthenic rings are cracked fromthe cores, the di- and tri-aromaticcores will remain in heavy cat naph-tha and LCO boiling ranges (totalcycle oil).
Table III shows two FCC feedstocks(A and B) with similar API gravityand hydrogen content. FeedstockB, however, has higher content ofdi- and tri-aromatic cores but similarlevels of tetra+-aromatics.
Table IV shows the product yieldswhen feedstocks A and B werecracked over a standard Ecat in abench scale MAT reactor. Both cat-alysts produced similar coke andslurry. However, LCO yield was high-er for feedstock B. The increase inLCO was nearly proportional to thehigher amount di- and tri-aromaticcores in feedstock B.4
Refiners who hydrotreat FCC feed-stock may consider re-optimizingpolynuclear aromatic (PNA) satura-tion levels to increase LCO yield.Figure 8 shows the effect of feed-stock PNA saturation on LCO andslurry yields at constant coke yield.An ACE unit was used to generatethis data by cracking three FCCfeedstocks produced over a rangeof hydrotreating severities. Lowerhydrotreating severity will increasethe amount of di- and tri-aromaticsin the FCC feedstock and conse-quently raise the LCO yield. Tetra+aromatics also increase at lowerseverity, which can lead to addition-al slurry yield.
Figure 8 also illustrates how an opti-mized catalyst system can be used
Feedstock A B
Feedstock Properties
API Gravity 27.6 28.1
Hydrogen Content, wt.% 13.53 13.59
Total Saturates, wt.% 59.5 52.6
Mono-Aromatics, wt.% 17.8 17.8
Di-aromatics, wt.% 10.5 13.4
Tri-aromatics, wt.% 1.9 4.3
Tetra and Penta-aromatics, wt.% 2.1 3.2
Badoni., R.P. et al.,
Fuel Science and Technology Int’L 13(4), 361-375, (1995)
Table IIIFeedstock Properties
Feedstock A B
Yields (wt.% Feed)
Dry Gas 1.1 1.5
LPG 16.4 17.1
Gasoline (C5-300ºF) 29.2 13.7
LCO (300-700ºF) 44.7 58.6
Slurry (700ºF+) 5.6 5.7
Coke 3.1 3.3 Badoni., R.P. et al.,
Fuel Science and Technology Int’L 13(4), 361-375, (1995)
Table IVFeedstock Effects - MAT Results Using a Standard Ecat
FCC Feed PNA Content, %
LCO
, wt.%
Slur
ry, w
t.%
24.0
22.0
20.0
18.0
16.0
14.0
12.0
10.0
8.0
8.0
7.5
7.0
6.5
6.0
5.5
5.0
4.5
4.0
3.5
3.0
15.0 17.0 19.0 21.0 23.0
LCO SlurryOptimized Catalyst
Figure 8Effect of PNA Saturation on LCO and Slurry Yields

www.e-catalysts.com6
to crack incremental slurry to LCO.Hydrotreated feeds contain higherlevels of naphthenoaromatics thantypical gasoils. The proper designof matrix activity is a crucial factorin optimizing the catalyst feed inter-action. In this example LCO isincreased by ~4 wt.% through acombination of lower VGOhydrotreating severity and an FCCcatalyst reformulation.
C3+ Liquid Yield and GasolineOctane
We have focused primarily on themeans to increase LCO yield whilemitigating the incremental slurryyield that is associated with severi-ty changes. Maintaining liquidyield and gasoline octane duringmaximum LCO operation is equallycritical to ensure overall profitabili-ty. Grace Davison’s OlefinsMax®
additive can be used to achieve thedesired octane levels at lowerreactor temperature. OlefinsMax®
additive is currently the most wide-ly used ZSM-5 additive technologyin the refining industry, enablingrefiners to substantially increaseyields of valuable light olefins, aswell as the octane value of the FCCnaphtha.
Operating at reduced conversion tomaximum LCO will reduce the volumeexpansion of the FCC due to the high-er density of LCO relative to gasolineand LPG. Table V shows three yieldcases. Case 1 represents a tradition-al catalyst reformulation for reducedactivity that increases LCO yield at thebase reactor temperature. Case 2 isan operation with Grace Davison’sMIDAS®-300, our maximum LCO cata-lyst and OlefinsMax® additive.
Despite a two volume percentincrease of LCO in Case 1 and lessslurry, the product value is neutralcompared to the base operation dueto lower C3+ total liquid yield. TheMIDAS®-300 operation in Case 2shows an increase product value of$1.50/bbl over the base due toenhanced bottoms cracking, higherLCO yield, similar C3+ liquid yield, andhigher gasoline octane. In this case,OlefinsMax® additive was added untila wet gas compressor constraint wasreached, increasing C3+ liquid yieldover the Case 1 operation. Recent2008 Gulf Coast economics, with a40¢/gallon incremental value of LCOover gasoline, were used.
Maximizing LCO Yield withMIDAS®-300
The different types of reactionsinvolved in cracking the bottom ofthe barrel require different catalystfunctionalities. Overall, a balancedapproach is required to achievemaximum bottoms upgrading. Thegoal is to convert the bottoms tohigher value products and not coke.Premium Grace Davison MIDAS®
catalysts have been proven toreduce slurry yield without a coke orgas penalty5 and we have recentlycommercialized MIDAS®-300 cata-lyst specifically designed for today’sdistillate driven market.
MIDAS®-300 catalyst is the result ofGrace’s long commitment to defin-ing bottoms cracking mechanismsand catalysis. This research projectproduced the MIDAS®-100 series ofcatalysts in 2005. In 2007, GraceDavison introduced the MIDAS®-200series for increased activity. Today,we are pleased to announce thedevelopment of MIDAS®-300 series,designed to maximize LCO selectiv-ity and bottoms cracking.
MIDAS®-300 catalysts offer highactivity matrix surface area, bal-anced with an optimized zeolitelevel. This new formulation maxi-mizes LCO selectivity via the three-step bottoms cracking mechanism(Figure 9). The majority of matrixporosity in MIDAS®-300 catalysts isfound in the crucial 100-600 Å porediameter range, ensuring selectivecracking of heavy ends.
As previously discussed, a commonmeans to shift selectivity to gaso-line+distillate rather than gaso-line+LPG is to lower operatingseverity. Reduced reactor tempera-ture achieves the desired increasein LCO by reducing conversion, butit comes with a price – reducedcracking temperature also reducesfeed vaporization, allowing unvapor-ized liquid hydrocarbons to bypassthe riser and condense as coke inthe reactor vessel.
Case Base 1 2
Catalyst Base TraditionalLCO Catalyst
MIDAS®-300 withOlefinsMax®
Reactor Temperature, ºF Base Base
Yield, vol.% FF
Conversion 74.6 72.8 72.8
LPG 33.4 31.9 34.4
Gasoline 51.5 50.7 48.8
LCO 20.1 22.0 22.9
Slurry 5.3 5.2 4.3
C3+ 110.3 109.8 110.4
RON 91.0 91.2 93.2
MON 80.0 80.1 81.1
Incremental $/bbl Base $0.00 $1.50
Base
Table VMaximize Product Value with MIDAS®-300

Catalagram 104 Fall 2008 7
Feed vaporization must be main-tained when operating at reducedcracking severity. At low operatingseverity, optimization of Type Icracking becomes more critical dueto the reduction in mix zone temper-ature. Catalyst design plays animportant role in maintaining theright conditions. Since resid feedscontain a high percentage of mole-cules boiling above mix zone tem-perature, pre-cracking is necessaryto achieve complete vaporization.Porosity in the 100-600Å range isessential for the pre-cracking reac-tions that facilitate vaporization.6
MIDAS®-300 catalysts have thehighest porosity in this critical rangeof any cracking catalyst, ensuringthat feed is properly vaporized evenat low severity.
Most of the LPG and gasoline pro-duced in an FCC comes fromdealkylation of aromatics or Type IIcracking. Zeolite is much moreeffective than matrix in crackinglong chain alkyl aromatics. Type IIcracking is important to reduce themolecular size and promote eventu-al conversion of bottoms; however,we must prevent any LCO that isproduced from being over-convert-ed to lighter components. The zeo-lite level in MIDAS®-300 has beenoptimized to provide sufficientdealkylation activity yet maintain theproduct yield as distillate ratherthan LPG and gasoline.
Finally, Type III cracking destroysnaphthene rings in naphthenoaro-matic compounds. The size of typ-ical naphthenoaromatic moleculesis too large to easily fit into the zeo-lite. The cracking of these mole-cules will occur on the matrix sitesor on the external surface of thezeolite. The selective cracking ofthis type of molecule requires theproper design of matrix activity andthe interaction of matrix and zeolite.The high mesoporosity of MIDAS®-300 catalysts improves LCO selec-tivity by converting coke precursorsinto valuable liquid product.
The increased matrix activity andporosity of MIDAS®-300 catalystsenhances LCO selectivity and bot-
toms cracking relative to MIDAS®-100(Table VI) while maintaining equivalentactivity, light ends, gasoline and coke,increasing unit profitability by$0.31/bbl.
Flexibility
Grace Davison can also deliverenhanced LCO selectivity in an addi-tive form. BX™-450 additive isGrace’s newest catalytic additiveoffering and is the first of its kinddesigned specifically for maximumdistillate yield. BX™-450 additive isbased on MIDAS®-300 catalyst tech-nology and offers high activity matrixsurface area balanced with an opti-mized zeolite level to quickly maximizeLCO selectivity as refining economicsswing between distillate and gasoline.As described earlier, proper zeolite tomatrix ratio is critical to selectivelydestroy bottoms and minimize cokeprecursors. However, to maximizeLCO with an additive, the amount andtype of zeolite is critical; too muchzeolite and any LCO that is producedcan be over-converted to lower valueproducts. The optimized zeolite levelin BX™-450 additive provides suffi-cient catalytic activity, enabling 1:1replacement of fresh catalyst.
Commercial Performance
Typically we recommend additionrates of BX™-450 additive up to 20%
of overall fresh catalyst usage.However, improved selectivity hasbeen reported with as little as 10%in inventory.
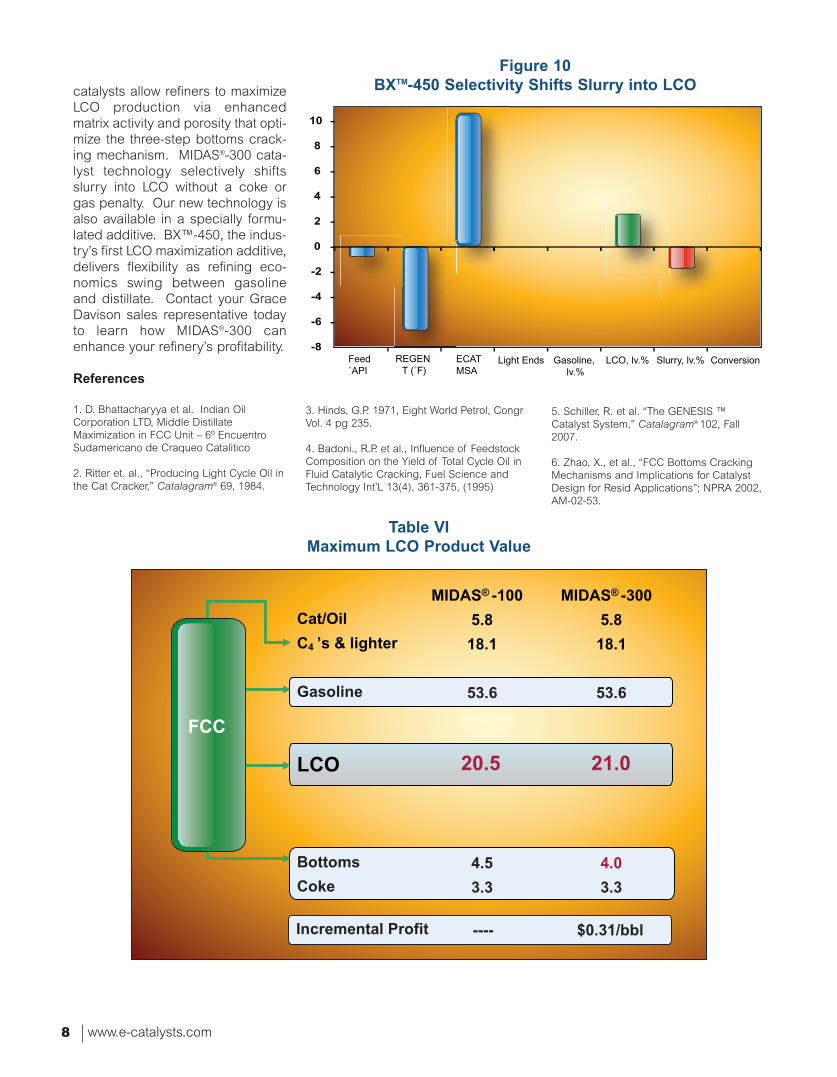
Selective conversion of bottoms toLCO at constant gasoline, LPG, andcoke has been demonstrated withBX™-450 additive [Figure 10]. Atconstant conditions, 1.5 lv.% of slur-ry was shifted to LCO. BX™-450additive, by converting coke precur-sors into liquid product, actuallydecreased regenerator tempera-tures and Ecat coke factor. Usingrecent spot economics, the additionof 10% BX™-450 additive improvesprofitability by $1.14/bbl. Furtherincreases in yield can be attainedthrough a detailed unit severity opti-mization.
Conclusions
Maximizing LCO yield is largely aslurry management process.Refiners can reduce FCC operatingseverity, optimize fractionator condi-tions, and/or change feedstocks in aeffort to increase LCO yields.Grace Davison’s experienced tech-nical service engineers can assistwith these unit-specific optimiza-tions.
LCO volume yield could be furtherincreased with Grace Davison’s newMIDAS®-300 catalysts. MIDAS®-300
R R
Catalytic
Coke MIDAS® Catalyst is themost effective catalystfor Type I and III
Type I Precracking and Feed VaporizationType II Dealkylation of alkyl aromaticsType III Conversion of naphthenaromatics
Feed
Type II Type III
Type I
Thermal/Catalytic
Figure 9Bottoms Cracking Fundamentals
www.e-catalysts.com8
catalysts allow refiners to maximizeLCO production via enhancedmatrix activity and porosity that opti-mize the three-step bottoms crack-ing mechanism. MIDAS®-300 cata-lyst technology selectively shiftsslurry into LCO without a coke orgas penalty. Our new technology isalso available in a specially formu-lated additive. BX™-450, the indus-try’s first LCO maximization additive,delivers flexibility as refining eco-nomics swing between gasolineand distillate. Contact your GraceDavison sales representative todayto learn how MIDAS®-300 canenhance your refinery’s profitability.
References
1. D. Bhattacharyya et al. Indian OilCorporation LTD, Middle DistillateMaximization in FCC Unit – 6º EncuentroSudamericano de Craqueo Catalitico
2. Ritter et. al., “Producing Light Cycle Oil inthe Cat Cracker,” Catalagram® 69, 1984.
-8
-6
-4
-2
0
2
4
6
8
10
Feed˚API
REGEN T (˚F)
ECATMSA
Light Ends Gasoline, lv.%
LCO, lv.% Slurry, lv.% Conversion
Figure 10BXTM-450 Selectivity Shifts Slurry into LCO
Cat/Oil C4 ’ s & lighter
Gasoline
LCO
Bottoms Coke
MIDAS® - 100 5.8 18.1
53.6
20.5
4.5 3.3
MIDAS® - 300 5.8 18.1
53.6
21.0
4.0 3.3
FCC
Incremental Profit ---- $0.31/bbl
Table VIMaximum LCO Product Value
3. Hinds, G.P. 1971, Eight World Petrol, CongrVol. 4 pg 235.
4. Badoni., R.P. et al., Influence of FeedstockComposition on the Yield of Total Cycle Oil inFluid Catalytic Cracking, Fuel Science andTechnology Int’L 13(4), 361-375, (1995)
5. Schiller, R. et al. “The GENESIS ™Catalyst System,” Catalagram® 102, Fall2007.
6. Zhao, X., et al., “FCC Bottoms CrackingMechanisms and Implications for CatalystDesign for Resid Applications”; NPRA 2002,AM-02-53.

ith demands for increasedproduction of ultra-low sulfurdiesel (ULSD) and the rise in
crude prices, unit operation and per-formance have become significantlymore challenging. This has promptedrefiners to look for ways to maximizetheir diesel pool by using opportunityfeedstocks. However, use of thesefeedstocks may lead to other prob-lems which impact unit performance.ULSD has evolved from simply meet-ing the diesel sulfur specification to aconstant awareness of unit perform-ance in order to process difficultstreams such as FCC light cycle oil(LCO) and other cracked stocks; syn-thetic crudes; and various other pre-processed feed sources. It is impor-tant to understand the impact of pro-cessing new feed streams, and thispaper highlights a few examples
demonstrating significant differ-ences in feed reactivity, which arenot necessarily anticipated from theusual bulk feed analyses.
Background
It has been documented for sometime that desulfurization of diben-zothiophene and substituted diben-zothiophenes occurs through tworeaction pathways: the direct sulfurabstraction route and the hydro-genation abstraction route. The for-mer involves adsorption of the mol-ecule on the catalyst surface via thesulfur atom followed by C-S bondscission. This path is favored whenusing cobalt-molybdenum (CoMo)based hydrotreating catalysts. Thesecond pathway involves saturationof one aromatic ring of the diben-
Brian WatkinsSupervisor, HydrotreatingLaboratory Services
ADVANCED REFININGTECHNOLOGIESChicago, IL USA
Maximizing ULSD Unit Performance whenProcessing LCO and Other PreviouslyProcessed Feeds
W
Catalagram 104 Fall 2008 9

zothiophene species followed bythe extraction of the sulfur atom.Nickel-molybdenum (NiMo) cata-lysts have a higher selectivity fordesulfurization via this route.
It is both expedient and efficient tomodel ULSD kinetic schemes bygrouping the various sulfur speciesinto “easy sulfur” and “hard sulfur”categories. The so-called easy sul-fur is made up of compounds whichare readily desulfurized via directabstraction and boil below about680°F, while hard sulfur is made upof compounds which are morereadily removed via hydrogenationfollowed by abstraction. These com-pounds include 4,6 dimethyl-diben-zothiophene and other di- and tri-substituted dibenzothiophenes. Therelative amounts of easy and hardsulfur in a feed are critical proper-ties to consider since the concen-tration of each can vary significant-ly from feed to feed depending oncrude source, boiling range and theprior thermal or catalytic treatmentof the feedstock. Further detailscan be found in the 2007 ERTCpaper by ART entitled “SmARTStrategies for Maximizing ULSD UnitPerformance: Tuning HydrogenUtilization for Flexibility withCracked Stocks.”
The use of thermal or catalytic treat-ment of feedstocks that will be sent toa ULSD unit can have varying effectsdepending on the severity of the pre-treatment. LCO and coker dieselshave long been common elementscombined with a straight run (SR) feedsource to produce ULSD products.LCO generated from an FCC can varydepending on the severity of the pre-treatment of the FCC feed. However,the common element is the increase in
polynuclear aromatic compoundsrelative to other feeds. The amountof LCO blended into the dieselhydrotreater has a much greatereffect on catalyst performancewhen producing ULSD than whenoperating under prior, less restric-tive, low-sulfur regulations. Use ofdiesel range products from ebullat-ing bed resid or fixed bed residdesulfurizers can also have a signif-icant impact on catalyst activity ifnot clearly identified as to their ori-gin. The general properties ofdiesel streams from these unitsoften indicate that they may be fair-ly easy to hydrotreat due to theirunusually low sulfur content. Table Ilists the general properties forexamples of each of the base feedsused in pilot testing at ART.
Note that Ebullating Bed Diesel rep-resents a diesel fraction from theproduct of an LC-FINER or H-OilUnit, and Fixed Bed Diesel is thediesel fraction coming from a FixedBed Resid Unit.
The diesel product from anEbullating Bed Resid (EB) Unit andthe Fixed Bed Resid (FB) Unit pro-vide very different sulfur distributionpatterns compared to the otherfeeds in Figure 1. It is clear that
Type
˚APISulfur, wt.%Nitrogen, ppmAromatics, lv.%
Mono-, lv.%Poly-, lv.%
Dist., D86, ˚FIBP10%50%70%90%FBP
SR
37.721.0964622.3414.437.88
404470532558612678
LCO
15.311.04183768.8118.4450.37
387462542598660712
EbullatingBed Diesel
32.240.14394040.3832.058.34
366440524552591637
FixedBed Diesel
30.90.34447938.5427.2811.26
489538589614649704
Table IBase Feed Properties
0
1000
2000
3000
4000
0
1000
2000
3000
4000
SR Fixed Bed Resid FCC LCO Ebullating Bed Resid
ppm
,sul
fur
BezothiopheneC1-BT
C2-BTC3-BT
C4+ BT
Dibenzothiophene
C1-DBT
C2-DMDBT
4,6-DMDBT
C3+DBT
Figure 1Sulfur Distribution in the Four Distillate Feedstocks
www.e-catalysts.com10

although the total sulfur is muchlower for the two resid diesel materi-als, a majority of the sulfur speciesthat are present are all the so-calledhard sulfur species.
To help explain how the HDS activi-ty changes with product sulfur forthese feeds, pilot work was com-pleted using 100% SR diesel as thebase feed. The individual compo-nents were blended into the basefeed to show the individual, as wellas some cumulative effects on cata-lyst performance. Two different con-centrations (15% and 30% by vol-ume) of LCO were used. Theblends containing LCO produced afive to seven number decrease inAPI, as well as decreases in totalsulfur of 2500 to 2700 ppm, respec-tively. Feed nitrogen content, how-ever, increases by 150 to 250 ppm,and the total aromatic content ineach of the blends increases 10 to18 volume percent. The resid dieselstreams were blended into the SR ata 25% by volume concentration.This gave a similar 1.5 to 2 numberdecrease in API for each of the FBand EB diesel streams, with a signif-icant increase in total nitrogen of120 to 220 ppm, respectively. Feedaromatic content showed a three tofour number increase in mono-aro-matics.
At low severity hydrotreating (higherproduct sulfur), there is little differ-ence between the straight run and theblended resid diesel streams. Figure2 is a plot of the EB and FB dieselblends at different levels of sulfurremoval. The impact of adding EBdiesel is little more than 4°F highertemperature relative to the SR, whilethe FB diesel required just over 10°Ffor low sulfur products. As the prod-uct sulfur is decreased the required
temperatures start to diverge: 17°Fhigher temperature is required forthe EB diesel blend feed at 200ppm sulfur and 22°F for the FBdiesel. Clearly, there is a differenttemperature response for each feedwhich is most likely an indicationthat although the total sulfur is lower,the additional nitrogen from the EBunit is hindering the catalytic abilityto saturate the more difficult sulfurcompounds required to produceULSD. The FB diesel feed also hasan impact, due to the fact that itcontains additional refractory sulfurwhich is harder to remove.
As product sulfur continues to trendtoward ULSD, the differenceincreases to over 35°F. A compari-son of the feedstock inspectionsshown in Table I shows that the twofeeds are quite similar with no obvi-ous explanation for a 30°F increasein required temperature relative tothe base feed to achieve ULSD sul-fur levels. This underscores theimportance of the source (or histo-ry) of a feedstock, and how signifi-cant this can be on unit perform-ance.
Figure 3 summarizes data using the15% and 30% LCO feeds. Theimpact of even a small amount ofLCO is again readily apparent.
0
20
40
60
80
100
120
0 100 200 300 400 500 600
Req
uir
ed T
emp
erat
ure
incr
ease
, ˚F
Product Sulfur, ppm
SR
25% EB Diesel
25% FB Diesel
Figure 2Comparison of EB and FB Diesel Blends
in ULSD Application
0
20
40
60
80
100
120
140
160
0 100 200 300 400 500 600
Req
uir
ed T
emp
erat
ure
Incr
ease
, ˚F
Product Sulfur, ppm
SR
15% LCO
30% LCO
Figure 3Addition of LCO on ULSD Performance
Catalagram 104 Fall 2008 11

Initially about 20°F higher tempera-ture is required compared to the SRfeed for 15% LCO, and 40°F highertemperature is required at the 30%LCO level as compared to the basefeed at 500 ppm product sulfur.Although not obvious from the chart,there are also small differences inthe temperature response betweenthe SR and LCO containing feeds.Using 15% LCO there is a 20°F lossin HDS activity at 500 ppm sulfurwhich increases to 50°F at 200 ppmsulfur and to over 90°F for ULSD.With a 30% LCO blend, the activitydifferences are much greater: 37 °Fat 500 ppm sulfur increasing to 70°Fat 200 ppm sulfur and over 115°F forULSD. As mentioned above, this isan indication that as LCO is addedto the feed, the concentration ofrefractory, sterically hindered sulfurcompounds increases making itmore difficult to desulfurize. Thepresence of more refractory com-pounds decreases the temperatureresponse relative to the base SRfeed. That means that a much larg-er temperature increase is requiredfor the LCO feed to achieve thesame sulfur removal as the basefeed.
The effects of combining the variousdiesel sources are not necessarily acumulative effect on catalyst perform-ance. The effect of adding 15% LCOinto a feedstock that already contains25% FB diesel has only an additional10°F impact compared to the 20°Fincrease in required temperature dis-
cussed above. The use of 30%LCO blended into the 25% FB feedhas an impact of 28°F increase inrequired temperature which isalmost 10°F lower than 30% LCO byitself. This impact can be seenthrough the entire range of opera-tion as shown in Figure 4.
One possible option to gain backsome of the lost activity is tochange the end point of the feed tobe used. ART was able to conductduplicate pilot plant testing on thissame LCO, but with a 30°F endpoint reduction to simulate how thiscan affect catalyst performance.Table II lists the major componentanalysis between the two LCO feedsources. The decrease in endpointlowers the total sulfur by almost1000 ppm, where total nitrogendecreases by 129 ppm.
The impact this reduction has onULSD performance is over 30°F inrestored catalyst activity which cor-responds to additional life in thehydrotreater. A comparison of thetwo LCO feeds blended at 30% intothe SR base feed is shown inFigure 5.
0
20
40
60
80
100
120
140
160
0 100 200 300 400 500 600
Req
uir
ed T
emp
erat
ure
incr
ease
, ˚F
Product Sulfur, ppm
SR
25% FB Diesel
15% LCO & 25% FB
30% LCO & 25% FB
Figure 4Cumulative Addition of LCO for HDS
Type
˚APISulfur, wt.%Nitrogen, ppmAromatics, lv.% Mono-, lv.% Poly-, lv.%
Dist., D86, ̊ F IBP 10% 50% 70% 90% FBP
LCO(Low FBP)
18.310.948708
66.8622.6544.21
380450522579638682
LCO(High FBP)
15.311.041837
68.8118.4450.37
387462542598660712
Table IIComparison of Boiling Point Reduction on LCO
www.e-catalysts.com12

The addition of LCO has a majorimpact on activity for both the lowand high endpoint materials. Therequired temperature increase forULSD in going from 0 to 30% LCOfor the lower endpoint material isabout 1.2°F per percent LCO.Processing the higher endpointLCO increases the required temper-ature to about 1.4°F per percentLCO. Notice from the chart that theactivity effects are not exactly linearwith increasing LCO content. Thefirst 15% LCO has a larger impacton activity than the next 15%.Figure 6 demonstrates this moreclearly in the form of a plot of activ-ity lost as a function of LCO content.It clearly shows much higher activi-ty losses for the first few percentLCO as compared to the last fewpercent added to the feed.
ADVANCED REFINING TECH-NOLOGIES can work closely withrefining technical staff to help planfor processing opportunity feedssuch as those discussed above.One of the keys is being aware ofthe potential impact processing cer-tain feeds will have on unit perform-ance. Feeds which have been pre-viously processed present uniquechallenges and ART is well posi-tioned to provide assistance on howbest to maximize unit performanceand take advantage of these oppor-
0
20
40
60
80
100
120
140
160
0 100 200 300 400 500 600
Req
uir
ed T
emp
erat
ure
incr
ease
, ˚F
Product Sulfur, ppm
SR
30% Hi FBP LCO
30% Lo FBP LCO
Figure 5Impact on FBP Reduction on Hydrotreating Performance
Figure 6Activity Comparisons at Different
LCO FBP and Concentration
Catalagram 104 Fall 2008 13

Larry LanganSenior Engineer,FCC Evaluations
Grace DavisonRefining TechnologiesColumbia, MD USA
Grace Davison Issues New ShippingGuidlines for Hydrocarbon Samples
Introduction
race Davison's Columbia, MD,USA facility handles about4000 oil samples per year from
customers. Many of them arrive with-out incident; however, we are seeingan increase in the number of samplesthat are packaged improperly. Thephotographs accompanying this arti-cle give some examples of improperlypackaged samples.
Acceptable Sample Sizes
Grace Davison’s Columbia, MD facilitywill accept for testing flammable and
other liquids such as gas oil, feed,petroleum distillates, LCO, dieselfuel, naptha, gasoline, motor spirits,petrol, slurry oil, scrubber water etc.with proper labels, documentationand in suitable shipping containersconsistent with the IATA manual andCFR49 DOT regulations.
For these type of materials GraceDavison prefers 4 oz. packages forevaluation in our Oils Lab and formicroactivity testing. If more exten-sive testing is requested, then an 8oz. package will be acceptable.These quantities are more than ade-quate to perform any necessary
A sample that was received by Grace Davison for testing.
www.e-catalysts.com14
G

testing to be performed, while alsoeliminating the need to dispose oflarge quantities of unused sample.Use of smaller samples should alsodecrease shipment costs for ourcustomers.
The customer must use packagingthat meets CFR49 DOT regulationsand include a leak containment bar-rier. Loose sample container lids,paint cans sent improperly withoutlid locks, glass bottles of scrubbingwater of scrubber water that freezein the winter and boxes drippingwith oil in the delivery truck areexamples of why leak containmentis required.
For other testing and use, the sam-ple size required may be larger orsmaller. The amount to be sent toGrace Davison should be dis-cussed in advance with the GraceDavison personnel who will receivethe material. Samples larger thanneeded increase costs to bothGrace Davison, who must disposeof the material, and to the shipper,who must pay for shipment costs.Grace Davison personnel can alsobe contacted to provide assistancein determining the appropriate typeof container or package to maintainsample quality; however, the ship-per must be aware that compliancewith all applicable shipping regula-tion is the responsibility of the ship-per.
Packaging, Paperwork andLabeling
All samples shipped to Columbia,MD must include on the shippingpapers the correct chemical identi-fication information. This permitsGrace Davison personnel to prop-erly follow any applicable chemi-cal handling requirements.
All samples must be appropriatelylabeled with hazard, compositionand other identification information.A relevant MSDS shipped with thesamples or ref- erence to an MSDSalready on file, is also required.
Shipping services often use garbage bags and trash cans to containleaking samples.
Paint can lids pop off. Cans must be used with lid retainer rings.Catalyst "trails" from leaking boxes in receiving and inside trucks arevery slippery.
Vacuum crushing or lid not tight. Leaking containers are often repack-aged by shipper.
Cushioning inadequate for oil. Scrubber water bottle froze and burst inwinter.
Catalagram 104 Fall 2008 15

It is critical that samples areshipped with proper packaging leakprotection and seals as theColumbia site shipping and receiv-ing department may reject samplesthat leak during transport and havethem returned to the shipper.Samples that leak are also oftencomprised and therefore cannot beanalyzed and will be immediatelydisposed of.
Shipments from Overseas
Grace Davison personnel should beinformed in advance of any ship-ments of materials coming toColumbia, MD from overseas so thatproper TSCA import certificationdocumentation can be prepared.Failure to provide such informationwill slow the passage of the materi-al through customs and can oftenresult in the sample being refusedentry into the U.S. A TSCA certifica-tion is required for import of anychemical into the U.S. It is alsoimportant to note that only U.S. citi-zens can authorize TSCA certifica-tions. Most problems occur whenthe customer does not specify theshipping sample name with anaccepted shipping regulationname. They may use somethingsuch as “Unit 5 feed” instead of aregulation name such as “Gas Oil”.
Summary
Compliance with all applicableshipping regulations is the respon-sibility of the shipper. Adoption ofthese shipping guidelines willensure sample integrity and result inaccurate analyses. Most important,proper packaging guarantees thesafety of everyone who touches thesample.
“Wild” gasoline cap popped off. Cans without cap seals.
Cap screwed on the label string makes a wick.
Improperly packed, leaking sample.
Slurry in leaking paint can with catalyst MSDS and a sample without alabel.
www.e-catalysts.com16

Grace Davison has introduced PIN-NACLE®-XLC to the Asia PacificMarket. PINNACLE®-XLC is an alu-mina-sol catalyst formulated with anovel zeolite technology, GraceDavison’s nickel resistant matrix,TRM-400, and the commercially-proven integral vanadium trap, IVT-4, that is utilized in the IMPACT® cat-alyst series.
The alumina-sol technology plat-form provides excellent physicalproperties and catalyst retention.
The proprietary zeolite modificationsutilized in PINNACLE®-XLC deliverenhanced stability and activity com-pared to previous resid processingbenchmarks and shifts light ends intogasoline. Incorporation of GraceDavison’s integral vanadium trap fur-ther enhances stability and activityretention, while Grace Davison’s nick-el resistant matrix, TRM-400, providessuperior coke and gas selectivity inthe presence of high levels of con-taminant nickel.
The overall result is an extremelystable, coke-selective catalyst offer-ing maximum gasoline selectivity atconstant coke yield in high contam-inant metals operations.
Based on our lab testing and com-mercial experience, we have foundthat the use of PINNACLE®-XLCshows, even at high metals level,excellent activity retention (Figure 1)and better coke selectivity (Figure2) compared to resid benchmarkcatalysts.
Introducing PINNACLE®-XLC: An FCCCatalyst for Even Lower Delta Coke
Catalagram 104 Fall 2008 17
ECAT Ni + V, ppm
75
73
71
69
672000 4000 6000 8000 10000 12000
MAT
Con
vers
ion,
%
Resid BenchmarkPinnacleTM-XLC
ECAT Ni + V, ppm
5
4
3
2
12000 4000 6000 8000 10000 12000
Cok
e Yi
eld,
wt.%
Resid Benchmark
Pinnacle-XLC
Figure 1
Figure 2

www.e-catalysts.com18
Kristen WagnerProduct Manager, Clean Fuels
Grace DavisonRefining TechnologiesColumbia, MD USA
CATALYST
33. How much gasoline sulfurreduction can be achieved with theuse of additives? Have you seensulfur reduction in the LCO frac-tion? How well do these additivesperform? Where does the sulfurend up?
a. Grace Davison gasoline sulfurreduction applications provide20%-35% gasoline sulfur reductioncommercially. Current customershave been applying this technologyfor an average of 2.5 years, includ-ing one refiner who has been ben-efiting from Davison gasoline sulfurreduction for over seven years now.Neptune™ catalyst, our mostrecent step-out GSR® technology,has commercially lowered gasolinesulfur by 45%.
b. In some applications, sulfurreduction has been seen in theLCO cut, but only for lower boilingpoint LCO fractions. Grace
Answers to Questions from the 2008NPRA Q&A Session - FCC Section
Davison GSR® products are designedto reduce sulfur species from thegasoline boiling range. If the IBP ofthe LCO is low, there may be gasolinesulfur species in the LCO stream, andtherefore sulfur reduction will occur.
c. The sulfur that is removed from theFCC gasoline boiling range is con-verted to H2S in the reactor. Thisequates to an increase of approxi-mately 1%-2% overall H2S generationfrom the FCCU.
PROCESS TECHNOLOGY
37. What are the typical sulfur con-tents of FCC products for variousFCC feed types and sulfur levels?
Sulfur content of FCC products isderived from the sulfur present in theFCC feed. Gasoline sulfur typicallycontains 2%-10% of the FCC feedsulfur, but there are additional vari-ables that can affect the level of sul-fur in the gasoline. Those variablesinclude the selectivity of the feed tocrack into gasoline range sulfurspecies, the FCCU operating condi-tions, FCC catalyst properties, andthe gasoline cut point in the mainfractionator. One FCC feed type canresult in different gasoline sulfur lev-els in different FCC operations.
Additionally, two different feedswith the same sulfur content canyield different gasoline sulfur levelsin the same FCC unit, due to differ-ences in the sulfur selectivities ofthe feeds.
In Grace Davison GSR® productapplications, FCC feed sulfur levelshave varied from 0.15% to 2.40%feed sulfur, while gasoline sulfurreduction levels remain consistentat 20%-35% sulfur reduction.Based on a range of data andexperience, Grace Davison has notfound a direct correlation betweenFCC feed sulfur content and gaso-line sulfur content or gasoline sulfurreduction levels.
Grace Davison GSR® catalysts andadditives are successfully used inseveral different FCC unit opera-tions, in conjunction with a varietyof FCC catalyst types and FCCfeed types, to provide 20%-45%gasoline sulfur reduction.
n two recent applications ofGrace Davison’s gasolinesulfur reduction additive,
GSR®-5, in India, gasoline sulfurwas reduced by more than 40%without affecting activity and con-version.
GSR®-5 additive can be used with anybase FCC catalyst. Typically, GSR®-5additive is used in place of 25% ofcatalyst additions. There have beenmore than 85 worldwide applicationsof Grace Davison’s gasoline sulfur
reduction catalysts and additivessince the technology was first intro-duced to the market in 1996.
GSR®-5 Reduces Gasoline Sulfur by MoreThan 40% in India
I

Grace Davison Refining Technologies is pleased to welcome Ann Benoit, Matt Chang, andMike Federspiel to our Technical Sales and Marketing Team.
Ann Benoit is Technical Service Representative headquartered out of ourHouston office. A B.S.Ch.E. graduate of Tennessee Technological University,Ann joins us from Citgo’s Lake Charles, LA refinery, where she served as aprocess engineer, economic analyst, and logistic manager.
Matt Chang, who recently completed the Grace Marketing Leadership Pro-gram, is Marketing Manager, Light Olefins. He received his B.S. in ChemicalEngineering and a B.A. in Economics from Rutgers University, as well as anMBA in Marketing and Finance from Georgetown University. Previously, Mattheld production, quality and R&D engineering positions at JM Manufacturingand PlastPro.
Mike Federspiel, Technical Sales Manager, joins us from Hovensa, where hewas Assistant Area Manager, FCC Engineer. Prior to that, he was Chief Tech-nical Advisor, Development Engineer at UOP. Mike holds a B.S.Ch.E. from theUniversity of Wisconsin and is based in the Chicago area.
Please welcome...
Olsen to Serve on Q&A Panel
Advanced Refining Technologies (ART) is pleased to announce that Dr. Charles W. Olsen,Worldwide Technical Services Manager, has been selected to 2008 National Petrochemicaland Refiners’ Association Question and Answer panel. Chuck, who has over 15 years of ex-perience in hydroprocessing, has held a variety of technical service, research and technicalmanagement positions in Chevron and Grace Davison before joining ART. Olsen holds aB.S.ChE degree from the University of Minnesota, and M.S. and Ph.D. degrees in chemical en-gineering from the University of Illinois in Champaign-Urbana.
The 2008 NPRA Q&A session will be held October 5-8 at the Omni Champions Gate Resort inOrlando, Florida. For more information, go to www.npra.org/meetings.
Grace Davison Refining TechnologiesAdvanced Refining TechnologiesW.R. Grace & Co.-Conn.7500 Grace DriveColumbia, MD 21044410.531.4000
Grace Davison Refining TechnologiesAdvanced Refining TechnologiesAsia PacificW.R. Grace (Singapore) Pte. Ltd.#07-02 Wheelock PlaceSingapore 23888065.6737.5488
Grace Davison Refining TechnologiesAdvanced Refining TechnologiesEuropeGrace GmbH & Co. K.G.In der Hollerhecke 1Postfach 1445D-67545 Worms, Germany49.6241.40300
[email protected] [email protected]
®
Catalagram®, Grace®, Grace Davison®, IMPACT®, LIBRA®, MIDAS®, OlefinsMax®, GSR®, PINNACLE®,SmART Catalyst System® are registered trademarks in the United States and/or other countries, of W. R. Grace & Co.-Conn.
DXTM and GENESISTM are trademarks of W. R. Grace & Co.-Conn.
This trademark list has been compiled using available published information as of the publication date of this brochureand may not accurately reflect current trademark ownership.