catalogue no. 99m0002x 2011 national household survey...
TRANSCRIPT
Catalogue no. 99M0002X
2011 National Household Survey Public Use Microdata File (PUMF)
Hierarchical File Documentation and User guide
Statistique Canada
StatisticsCanada

Table of contents
Page
Introduction 3
Chapter 1 Universes 6
Chapter 2 Record layout 8
Chapter 3 Variable descriptions (codebook) 11
Geography 11
Households 12
Families and family composition 13
Demography 15
Place of birth, immigration and citizenship 16
Aboriginal population 22
Ethnic origin 26
Language 27
Education 34
Mobility 40
Journey to work 42
Labour market activity 46
Income 53
Dwellings: Housing and shelter costs 58
Religion 63
Weighting 64
Identifier 66
Chapter 4 Sampling method, estimation and data quality 67
Chapter 5 Other factors affecting data reliability 82
Appendix A: Countries and area of interest 97
Appendix B: Mother tongue and home language 103
Appendix C: Ethnic origins 110
Appendix D: Query examples 119

Introduction
The 2011 National Household Survey (NHS) Public Use Microdata File (PUMF) on private households contains 133,192 private households with a total of 333,008 individual records, representing 1% of the population in private households in private occupied dwellings in Canada. These records were drawn from the population who responded to the 2011 NHS. The NHS is a voluntary, self-administered survey, introduced as a replacement for census Form 2B, more commonly known as the long-form census questionnaire. A random sample of 4.5 million households was invited to respond to the NHS in spring and summer 2011. (The reference date of the NHS is May 10, 2011, the date of the 2011 Census of Population.)
This user guide is divided into five chapters: Chapter 1 defines the universes that can be studied using the hierarchical file (PUMF). Chapter 2 contains the record layout, an indispensable tool for using the file. Chapter 3 defines and provides detailed information about the variables available for analysis in the PUMF dataset. Chapters 4 and 5 respectively deal with the sampling method and factors affecting data quality and reliability.
NHS target population
The NHS covers all persons whose usual place of residence is a private dwelling in Canada. It includes persons who live on Indian reserves and in other Indian settlements, permanent residents, non-permanent residents such as refugee claimants, holders of work or study permits, and members of their families living with them.
Foreign residents such as representatives of a foreign government assigned to an embassy, high commission or other diplomatic mission in Canada, members of the armed forces of another country stationed in Canada, and residents of another country who are visiting Canada temporarily are not covered by the NHS.
The survey also excludes persons living in institutional collective dwellings such as hospitals, nursing homes and penitentiaries; Canadian citizens living in other countries; and, full-time members of the Canadian Armed Forces stationed outside Canada. Also excluded are persons living in non-institutional collective dwellings such as work camps, hotels and motels, and student residences.
Comparability between estimates from the 2006 Census long form and the 2011 National Household Survey estimates: When comparing estimates from the 2006 Census long form and estimates from the 2011 National Household Survey (NHS) users should take into account the fact that the two sources represent different populations. The target population for the 2006 Census long form includes usual residents in collective dwellings and persons living abroad whereas the target population for the NHS excludes them. Moreover, the NHS estimates are derived from a voluntary survey and are therefore subject to potentially higher non-response error than those derived from the 2006 Census long form.
NHS reference products and materials
1. Response rates
http://www12.statcan.gc.ca/nhs-enm/2011/ref/about-apropos/nhs-enm_r012.cfm?Lang=E
The final response rate for the NHS was 68.6%. This rate is similar to rates on other voluntary surveys conducted by Statistics Canada.
2. NHS Dictionary
http://www12.statcan.gc.ca/nhs-enm/2011/ref/dict/index-eng.cfm
The NHS Dictionary is a reference document which contains detailed definitions of concepts, universes, variables and geographic terms used in the NHS. By referring to the NHS Dictionary, both beginner and intermediate data users will gain a better understanding of the data.
3. Reference guides
The reference guides provide information that enables users to effectively use, apply and interpret data from the 2011 National Household Survey (NHS). Each guide contains definitions and explanations of concepts, classifications, data quality and comparability to other sources. Additional information is included for specific variables to help general users better understand the concepts and questions used in the NHS.
http://www12.statcan.gc.ca/nhs-enm/2011/ref/guides/index-eng.cfm
The variables of the 2011 PUMF pertaining to 'Demography' and 'Families and family composition' were collected as part of the 2011 Census of Population. The Families Reference Guide contains useful information about these variables.
http://www12.statcan.gc.ca/census-recensement/2011/ref/guides/index-eng.cfm
4. Other reference products and materials
For a complete list of reference products and materials regarding the 2011 NHS, please see the following: http://www12.statcan.gc.ca/nhs-enm/2011/ref/index-eng.cfm.
PUMF considerations
1. Data confidentiality
It is important for Statistics Canada to protect the confidential information that it collects. Owing to the very nature of a microdata file, various actions are taken to fulfil this commitment.
2. Reduced level of detail
The smallest geographic unit in the 2011 PUMF is the census metropolitan area (CMA). Data at the scale of geographic areas smaller than CMAs are not provided for this product. Also, the user will find that this product contains only information on five of the largest census metropolitan areas and the provinces. The Yukon, the Northwest Territories and Nunavut are grouped under the term 'Northern Canada.'
Furthermore, the data have been aggregated in such a way as to preserve confidentiality while, at the same time, providing as much detail as possible in order to maintain the analytical value of the file. For example, the data on mother tongue do not indicate 'Mandarin,' but rather the more general category 'Chinese languages.' This category also includes other mother tongue languages, such as 'Cantonese.'
3. Data not available
For some records, the codes for certain variables were changed to indicate ‘Not available,’ so as to guarantee data confidentiality. Users should be aware of the existence of this category when producing statistical tables.
4. Lower and upper limits
The PUMF contains lower and upper income limits. Thus, the data on total income and sources of income are adjusted proportionally. Lower and upper limits are also applied to certain dwelling variables such as ‘value of dwelling.’ See chapter 5.
5. Rounding
For all quantitative variables, the data within the lower and upper limits are randomly rounded to base 50, 100, 1,000 or 10,000. See chapter 5.
6. Content changes
The content of the 2011 PUMF is largely the same as that of the 2006 PUMF. However, there are various changes, resulting from content changes in the 2011 NHS, as well as the creation of new variables from existing questions or the use of updated classifications on existing questions.
Changes include:
the insertion of 15 new variables o CFSTRUCT Census family structure, simple version o DUR POW: Commuting Duration o EFDECILE Income: Income decile group o EFDIMBM Income: Disposable income for MBM for all persons o LEAVE POW: Departure time in hours and minutes o LOC_ST_RES Education: Location of study compared with province or territory of residence o LOLICOA Income: Low income status based on LICO-AT o LOLICOB Income: Low income status based on LICO-BT o LOLIMA Income: Low income status based on LIM-AT o LOLIMB Income: Low income status based on LIM-BT o LOLIMMI Income: Low income status based on LIM-MI o LOMBM Income: Low income status based on MBM o NOS Housing suitability o OCC JTW: Vehicle occupancy o RELIGION Religion: Aggregated responses o SUBSIDY Subsidized housing
the removal of 4 old variables o MFS Major field of study (based on MFS classification) o UPHWRK Unpaid housework o UPKID Unpaid care of children o UPSR Unpaid care of senior
a change of universe to Mobility, Generation status and Place of birth of parents variables which are now asked of the entire population, regardless of the respondent’s age. In 2006 and in previous censuses, only respondents aged 15 and over were required to answer these questions.
Variables included in the 2011 PUMF with supporting information can be found in Chapter 3.

Chapter 1 – Universes
Private Household:
Refers to a person or a group of persons (other than foreign residents) who occupy the same private dwelling and do not have a usual place of residence elsewhere in Canada. Household members who are temporarily absent (e.g., temporarily residing elsewhere) on May 10, 2011, are considered as part of their usual household. Every person is a member of one and only one household.
Private dwelling occupied by usual residents
Refers to a separate set of living quarters with a private entrance either from outside or from a common hall, lobby, vestibule or stairway inside the building in which a person or a group of persons is permanently residing. The entrance to the dwelling must be one that can be used without passing through the living quarters of someone else. Also included are private dwellings whose usual residents are temporarily absent on May 10, 2011.
The number of private dwellings occupied by usual residents is equal to the number of private households.
Economic family
Refers to a group of two or more persons who live in the same dwelling and are related to each other by blood, marriage, common law, adoption or a foster relationship. A couple may be of opposite or same sex.
Census family
Refers to a married couple (with or without children of either and/or both spouses), a common-law couple (with or without children of either and/or both partners) or a lone parent of any marital status, with at least one child. A couple may be of opposite sex or same sex.
For additional information regarding the universes above, please refer to the 2011 on-line NHS Dictionary, catalogue number 99-000-XWE.

Basic counts of different units in hierarchical PUMF, 2011
Universe Criteria PUMF unweighted records count
PUMF weighted estimates
NHS weighted estimates
Persons in private households
All records 333,008 32,747,981 32,852,323
Private households PRIHM = 1 133,192 13,317,308 13,319,251
Persons not in an economic family
EF_RP = 3 47,557 4,911,394 4,903,531
Persons in an economic family
EF_RP = 1 or EF_RP = 2
285,451 27,836,587 27,948,792
Economic families EF_RP = 1 94,155 9,244,184 9,254,162
Persons not in a census family
CF_RP = 3 55,020 5,619,213 5,626,052
Persons in a census family
CF_RP = 1 or CF_RP = 2
277,988 27,128,768 27,226,271
Census families CF_RP = 1 95,611 9,377,233 9,387,476

Chapter 2 Record Layout
Geography
TitleTypeField PositionSize MnemonicCensus metropolitan area of current residence (2011)Num48-503 18 CMAProvince or territory of current residence (2011)Num161-1622 83 PR
Households
TitleTypeField PositionSize MnemonicPerson responsible for household paymentsNum911 36 HHMAINPPrimary household maintainerNum1681 87 PRIHM
Families and Family Composition
TitleTypeField PositionSize MnemonicCensus family reference personNum411 12 CF_RPHousehold living arrangements, simple versionNum421 13 CFSTATCensus family structure, simple versionNum431 14 CFSTRUCTEconomic family reference personNum561 24 EF_RP
Demography
TitleTypeField PositionSize MnemonicAge groupsNum32-332 6 AGEGRPMarital status (de facto)Num1281 64 MARSTHSexNum1771 93 SEX
Place of Birth, Immigration and Citizenship
TitleTypeField PositionSize MnemonicImmigration: Age at immigrationNum34-352 7 AGEIMMCitizenship: Citizenship status and type – SummaryNum461 16 CITIZENCitizenship (component): Other country of citizenshipNum471 17 CITOTHGeneration status: DetailedNum791 32 GENSTATImmigration: Immigrant statusNum1011 44 IMMSTATPlace of birth: DetailedNum1571 79 POBPlace of birth of father: DetailedNum1581 80 POBFPlace of birth of mother: DetailedNum1591 81 POBMImmigration: Year of immigrationNum3681 112 YRIMM
Aboriginal Population
TitleTypeField PositionSize MnemonicAboriginal: Aboriginal identity – DetailedNum311 5 ABOIDAboriginal: Membership in a First Nation or Indian bandNum371 9 BFNMEMBAboriginal: Registered or Treaty Indian statusNum1711 89 REGIND
Ethnic Origin
TitleTypeField PositionSize MnemonicEthnic origin: Derived single and selected multiple ethnic originsNum72-732 28 ETHDERVisible minority: DetailedNum2021 100 VISMIN
Language
TitleTypeField PositionSize MnemonicLanguage: First official language spokenNum771 30 FOLLanguage: Home language (A) – English – component – Part ANum921 37 HLAENLanguage: Home language (A) – French – component – Part ANum931 38 HLAFRLanguage: Home language (A) – first write-in – component – Part ANum94-952 39 HLANOLanguage: Home language (B) – English – component – Part BNum961 40 HLBENLanguage: Home language (B) – French – component – Part BNum971 41 HLBFRLanguage: Home language – first write-in – component – Part BNum981 42 HLBNOLanguage: Official languagesNum1081 46 KOLLanguage: Language of work (A) – English – component – Part ANum1221 58 LWAEN

Language: Language of work (A) – French – component – Part ANum1231 59 LWAFRLanguage: Language of work (A) – first write-in – component – Part ANum1241 60 LWANOLanguage: Language of work (B) – English – component – Part BNum1251 61 LWBENLanguage: Language of work (B) – French – component – Part BNum1261 62 LWBFRLanguage: Language of work (B) – first write-in – component – Part BNum1271 63 LWBNOLanguage: Mother tongue (English) – componentNum1391 69 MTNENLanguage: Mother tongue (French) – componentNum1401 70 MTNFRLanguage: Mother Tongue – First write-in – componentNum141-1422 71 MTNNOLanguage: Non-official languageNum149-1502 75 NOL
Education
TitleTypeField PositionSize MnemonicEducation: Attendance at schoolNum361 8 ATTSCHEducation: Major field of study, primary groupings (based on CIP Canada 2011)
Num44-452 15 CIP2011
Education: Highest certificate, diploma or degreeNum89-902 35 HDGREEEducation: Location of study compared with province or territory of residence
Num1121 49 LOC_ST_RES
Education: Location of studyNum113-1142 50 LOCSTUDEducation: Secondary (high) school diploma or equivalentNum178-1792 94 SSGRAD
Mobility
TitleTypeField PositionSize MnemonicMobility 1: Mobility status – Place of residence 1 year ago (2010)Num1291 65 MOB1Mobility 5: Mobility status – Place of residence 5 years ago (2006)Num1301 66 MOB5Mobility 1: Province or territory of residence 1 year ago (2010)Num163-1642 84 PR1Mobility 5: Province or territory of residence 5 years ago (2006)Num165-1662 85 PR5
Journey to Work
TitleTypeField PositionSize MnemonicJTW: POW Commuting distance capped maximum of 201 kilometresNum531 21 DISTPOW: Commuting durationNum551 23 DURPOW: Departure time in hours and minutesNum1091 47 LEAVEJTW: Mode of transportation to workNum1311 67 MODEJTW: Vehicle occupancyNum1521 77 OCCJTW: Place of work statusNum1601 82 POWSTJTW: Place of work provinceNum169-1702 88 PWPR
Labour Market Activities
TitleTypeField PositionSize MnemonicLabour: Class of worker (derived)Num521 20 COWLabour: Full-time or part-time weeks worked in 2010Num781 31 FPTWKLabour: Hours worked for pay or in self-employmentNum99-1002 43 HRSWRKLabour: Labour force statusNum110-1112 48 LFTAGLabour: When last worked for pay or in self-employmentNum1211 57 LSTWRKLabour: Industry sectors (based on the NAICS 2007)Num143-1442 72 NAICSLabour: Occupation (based on the NOC 2011)Num145-1462 73 NOCEELabour: Occupation broad categories (based on the NOC 2011)Num147-1482 74 NOCSLabour: Weeks worked in 2010Num2211 102 WKSWRKLabour: Work activity in 2010Num222-2232 103 WRKACT
Income
TitleTypeField PositionSize MnemonicIncome: Income decile groupNum57-582 25 EFDECILEIncome: Disposable income for MBM for all personsNum59-646 26 EFDIMBMIncome: Employment incomeNum65-717 27 EMPINIncome: Total government transfer paymentsNum84-885 34 GTRFSIncome: Income tax paidNum102-1076 45 INCTAXIncome: Low income status based on LICO-ATNum1151 51 LOLICOAIncome: Low income status based on LICO-BTNum1161 52 LOLICOBIncome: Low income status based on LIM-ATNum1171 53 LOLIMA

Income: Low income status based on LIM-BTNum1181 54 LOLIMBIncome: Low income status based on LIM-MINum1191 55 LOLIMMIIncome: Low income status based on MBMNum1201 56 LOMBMIncome: Market incomeNum132-1387 68 MRKINCIncome: Total incomeNum182-1887 97 TOTINCIncome: After-tax incomeNum189-1946 98 TOTINC_AT
Dwelling: Housing and shelter costs
TitleTypeField PositionSize MnemonicNumber of bedroomsNum381 10 BEDRMPeriod of constructionNum39-402 11 BUILTTenure – CondominiumNum511 19 CONDOStructural type of dwellingNum541 22 DTYPECondominium feesNum74-763 29 FCONDGross rentNum80-834 33 GROSRTHousing suitabilityNum1511 76 NOSOwner's major paymentNum153-1564 78 OMPPresence of mortgageNum1671 86 PRESMORTGCondition of dwellingNum1741 91 REPAIRRooms, number ofNum175-1762 92 ROOMSubsidized housingNum1801 95 SUBSIDYTenureNum1811 96 TENURValue of dwellingNum195-2017 99 VALUE
Religion
TitleTypeField PositionSize MnemonicReligion: Aggregated responsesNum172-1732 90 RELIGION
Weighting
TitleTypeField PositionSize MnemonicIndividuals weighting factorNum203-22018 101 WEIGHTReplicate PUMF weightNum224-24118 104 WT1Replicate PUMF weightNum242-25918 105 WT2Replicate PUMF weightNum260-27718 106 WT3Replicate PUMF weightNum278-29518 107 WT4Replicate PUMF weightNum296-31318 108 WT5Replicate PUMF weightNum314-33118 109 WT6Replicate PUMF weightNum332-34918 110 WT7Replicate PUMF weightNum350-36718 111 WT8
Identifier
TitleTypeField PositionSize MnemonicKey for census family tableNum14-218 3 CF_IDKey for economic family tableNum7-137 2 EF_IDKey for household tableNum1-66 1 HH_IDKey for person tableNum22-309 4 PP_ID
Chapter 3 Variable descriptions
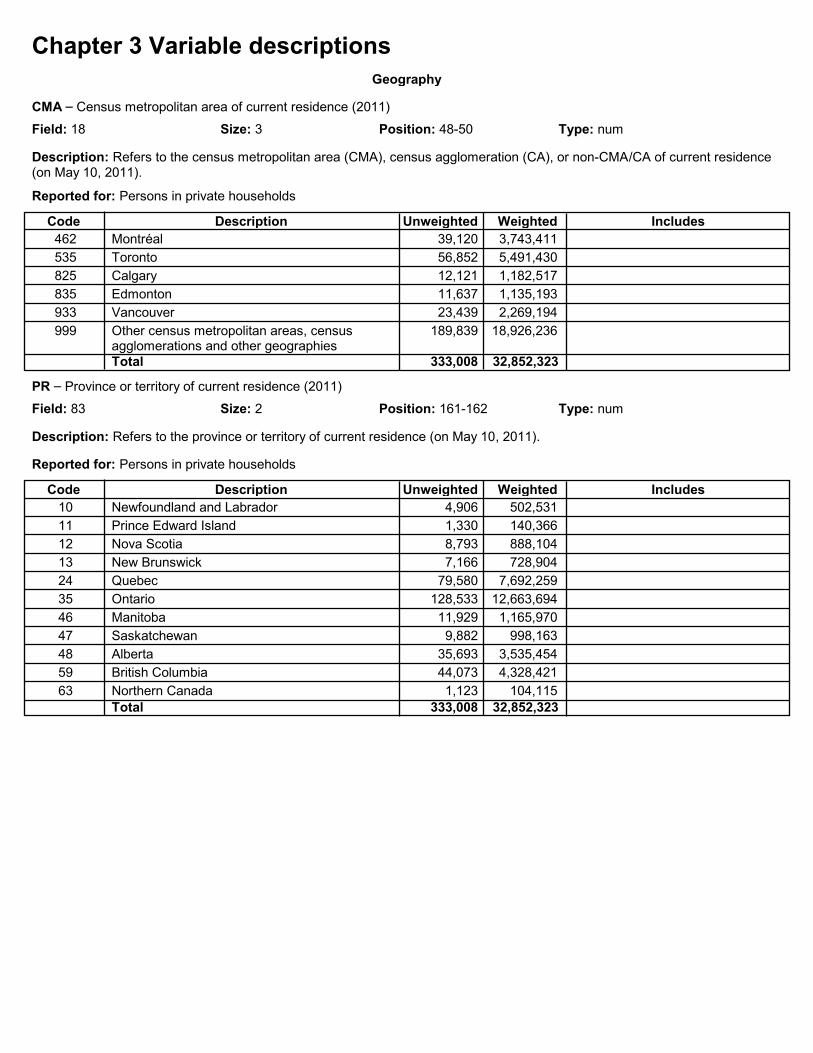
Geography
CMA – Census metropolitan area of current residence (2011)
Field: 18 Position: 48-50Size: 3 Type: num
Description: Refers to the census metropolitan area (CMA), census agglomeration (CA), or non-CMA/CA of current residence (on May 10, 2011).
Reported for: Persons in private households
Description WeightedCode IncludesUnweighted
462 Montréal 3,743,411 39,120
535 Toronto 5,491,430 56,852
825 Calgary 1,182,517 12,121
835 Edmonton 1,135,193 11,637
933 Vancouver 2,269,194 23,439
999 Other census metropolitan areas, census agglomerations and other geographies
18,926,236 189,839
Total 333,008 32,852,323
PR – Province or territory of current residence (2011)
Field: 83 Position: 161-162Size: 2 Type: num
Description: Refers to the province or territory of current residence (on May 10, 2011).
Reported for: Persons in private households
Description WeightedCode IncludesUnweighted
10 Newfoundland and Labrador 502,531 4,906
11 Prince Edward Island 140,366 1,330
12 Nova Scotia 888,104 8,793
13 New Brunswick 728,904 7,166
24 Quebec 7,692,259 79,580
35 Ontario 12,663,694 128,533
46 Manitoba 1,165,970 11,929
47 Saskatchewan 998,163 9,882
48 Alberta 3,535,454 35,693
59 British Columbia 4,328,421 44,073
63 Northern Canada 104,115 1,123Total 333,008 32,852,323
Households
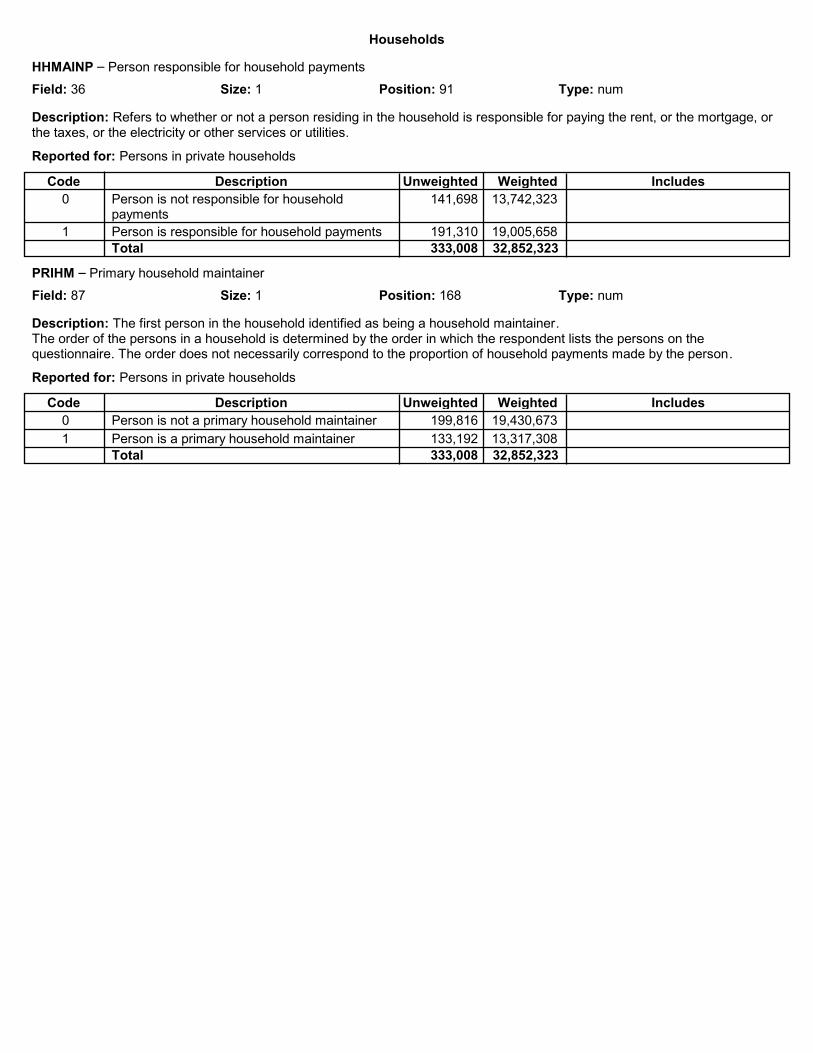
HHMAINP – Person responsible for household payments
Field: 36 Position: 91Size: 1 Type: num
Description: Refers to whether or not a person residing in the household is responsible for paying the rent, or the mortgage, or the taxes, or the electricity or other services or utilities.
Reported for: Persons in private households
Description WeightedCode IncludesUnweighted
0 Person is not responsible for household payments
13,742,323 141,698
1 Person is responsible for household payments 19,005,658 191,310Total 333,008 32,852,323
PRIHM – Primary household maintainer
Field: 87 Position: 168Size: 1 Type: num
Description: The first person in the household identified as being a household maintainer.The order of the persons in a household is determined by the order in which the respondent lists the persons on the questionnaire. The order does not necessarily correspond to the proportion of household payments made by the person.
Reported for: Persons in private households
Description WeightedCode IncludesUnweighted
0 Person is not a primary household maintainer 19,430,673 199,816
1 Person is a primary household maintainer 13,317,308 133,192Total 333,008 32,852,323
Families and family composition
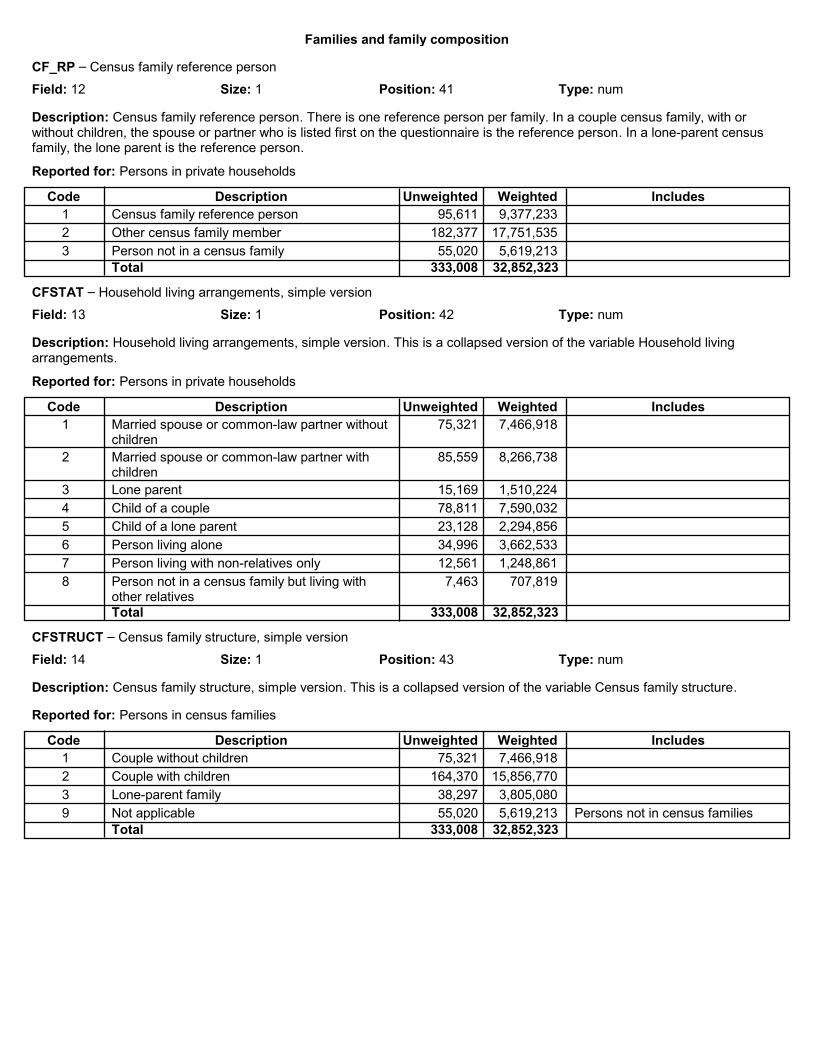
CF_RP – Census family reference person
Field: 12 Position: 41Size: 1 Type: num
Description: Census family reference person. There is one reference person per family. In a couple census family, with or without children, the spouse or partner who is listed first on the questionnaire is the reference person. In a lone-parent census family, the lone parent is the reference person.
Reported for: Persons in private households
Description WeightedCode IncludesUnweighted
1 Census family reference person 9,377,233 95,611
2 Other census family member 17,751,535 182,377
3 Person not in a census family 5,619,213 55,020Total 333,008 32,852,323
CFSTAT – Household living arrangements, simple version
Field: 13 Position: 42Size: 1 Type: num
Description: Household living arrangements, simple version. This is a collapsed version of the variable Household living arrangements.
Reported for: Persons in private households
Description WeightedCode IncludesUnweighted
1 Married spouse or common-law partner without children
7,466,918 75,321
2 Married spouse or common-law partner with children
8,266,738 85,559
3 Lone parent 1,510,224 15,169
4 Child of a couple 7,590,032 78,811
5 Child of a lone parent 2,294,856 23,128
6 Person living alone 3,662,533 34,996
7 Person living with non-relatives only 1,248,861 12,561
8 Person not in a census family but living with other relatives
707,819 7,463
Total 333,008 32,852,323
CFSTRUCT – Census family structure, simple version
Field: 14 Position: 43Size: 1 Type: num
Description: Census family structure, simple version. This is a collapsed version of the variable Census family structure.
Reported for: Persons in census families
Description WeightedCode IncludesUnweighted
1 Couple without children 7,466,918 75,321
2 Couple with children 15,856,770 164,370
3 Lone-parent family 3,805,080 38,297
9 Not applicable 5,619,213 55,020 Persons not in census familiesTotal 333,008 32,852,323

Families and family composition
EF_RP – Economic family reference person
Field: 24 Position: 56Size: 1 Type: num
Description: Economic family reference person. There is one reference person per family. The economic family reference person is the person in an economic family who is listed first on the questionnaire, after re-ordering of persons in the household according to variable PERSNO. The re-ordering ensures that the first person in the household is not under 15 years of age nor the son or daughter or grandchild of someone else in the household. Prior to 2006, the economic family reference person was always the man in an opposite-sex couple; as of 2006, it is based on which spouse or partner is listed first.
Reported for: Persons in private households
Description WeightedCode IncludesUnweighted
1 Economic family reference person 9,244,184 94,155
2 Other economic family member 18,592,402 191,296
3 Person not in an economic family 4,911,394 47,557Total 333,008 32,852,323

Demography
AGEGRP – Age groups
Field: 6 Position: 32-33Size: 2 Type: num
Description: Age groups
Reported for: Persons in private households
Description WeightedCode IncludesUnweighted
1 0 to 9 years 3,437,657 35,300
2 10 to 14 years 1,802,853 18,471
3 15 to 19 years 2,037,446 20,996
4 20 to 24 years 2,080,124 21,338
5 25 to 29 years 2,067,198 21,079
6 30 to 34 years 2,070,473 21,175
7 35 to 39 years 2,086,310 21,284
8 40 to 44 years 2,197,413 22,531
9 45 to 49 years 2,591,315 26,309
10 50 to 54 years 2,583,861 26,141
11 55 to 64 years 4,238,277 42,752
12 65 to 74 years 2,581,994 25,632
13 75 years and over 1,876,397 18,414
88 Not available 1,096,662 11,586Total 333,008 32,852,323
MARSTH – Marital status (de facto)
Field: 64 Position: 128Size: 1 Type: num
Description: Marital status (de facto)
Reported for: Persons in private households
Description WeightedCode IncludesUnweighted
1 Never legally married (and not living common law)
13,135,010 133,790
2 Legally married (and not separated) 12,841,375 131,207
3 Living common law 3,122,464 32,024
4 Separated (and not living common law) 668,922 6,657
5 Divorced (and not living common law) 1,642,167 16,100
6 Widowed (and not living common law) 1,338,042 13,230Total 333,008 32,852,323
SEX – Sex
Field: 93 Position: 177Size: 1 Type: num
Description: Sex
Reported for: Persons in private households
Description WeightedCode IncludesUnweighted
1 Female 16,627,109 169,288
2 Male 16,120,871 163,720Total 333,008 32,852,323

Place of birth, immigration and citizenship
AGEIMM – Immigration: Age at immigration
Field: 7 Position: 34-35Size: 2 Type: num
Description: The variable Age_Imm (Immigration: Age at immigration) indicates the age at immigration. Age at immigration is derived from responses to the questions on date of birth (Question 3) and year of immigration (Question 12). Age at immigration refers to the age at which an immigrant first obtained landed immigrant/permanent resident status. Immigrant refers to a person who is or has ever been a landed immigrant/permanent resident. This person has been granted the right to live in Canada permanently by immigration authorities. Some immigrants have resided in Canada for a number of years, while others have arrived recently. Some immigrants are Canadian citizens, while others are not. Most immigrants are born outside Canada, but a small number are born in Canada. In the 2011 National Household Survey, 'Immigrants' includes immigrants who landed in Canada prior to May 10, 2011. To obtain an estimate (subtotal) for 'Immigrants,' sum all categories with age at immigration. Users should note that comparisons of data for specific ages of immigration over time or between surveys can be affected by a number of factors, for example emigration and mortality among the immigrant population, survey methodology and respondent reporting patterns. For additional information on the collection and dissemination of age at immigration data, refer to the Place of Birth, Generation Status, Citizenship and Immigration Reference Guide, National Household Survey, 2011.
CAUTION - The variable Age at immigration is derived from the variables Year of immigration and Year of birth. An anomaly in the calculation of the age at immigration introduced an inconsistency between the variables Age at immigration and Age for a small number of respondents. Few entries are showing an age at immigration of one year older than their age. These cases should have been assigned an age at immigration equal to their age. Given the small number of cases affected and the fact that there is a difference of only one year in the given value and the value that should have been assigned, the impact on data quality for statistics produced with the age at immigration is marginal.
Reported for: Persons in private households who are, or have ever been, landed immigrants
Description WeightedCode IncludesUnweighted
1 0 to 4 years 611,698 6,401
2 5 to 9 years 578,557 6,028
3 10 to 14 years 536,019 5,603
4 15 to 19 years 586,577 6,072
5 20 to 24 years 859,731 8,863
6 25 to 29 years 948,687 9,944
7 30 to 34 years 776,670 8,138
8 35 to 39 years 537,514 5,667
9 40 to 44 years 348,833 3,683
10 45 to 49 years 210,083 2,227
11 50 to 54 years 124,818 1,311
12 55 to 59 years 86,987 915
13 60 years and over 133,181 1,403
88 Not available 408,979 4,335
99 Not applicable 25,999,648 262,418 Non-immigrants and non-permanent residents
Total 333,008 32,852,323
Place of birth, immigration and citizenship
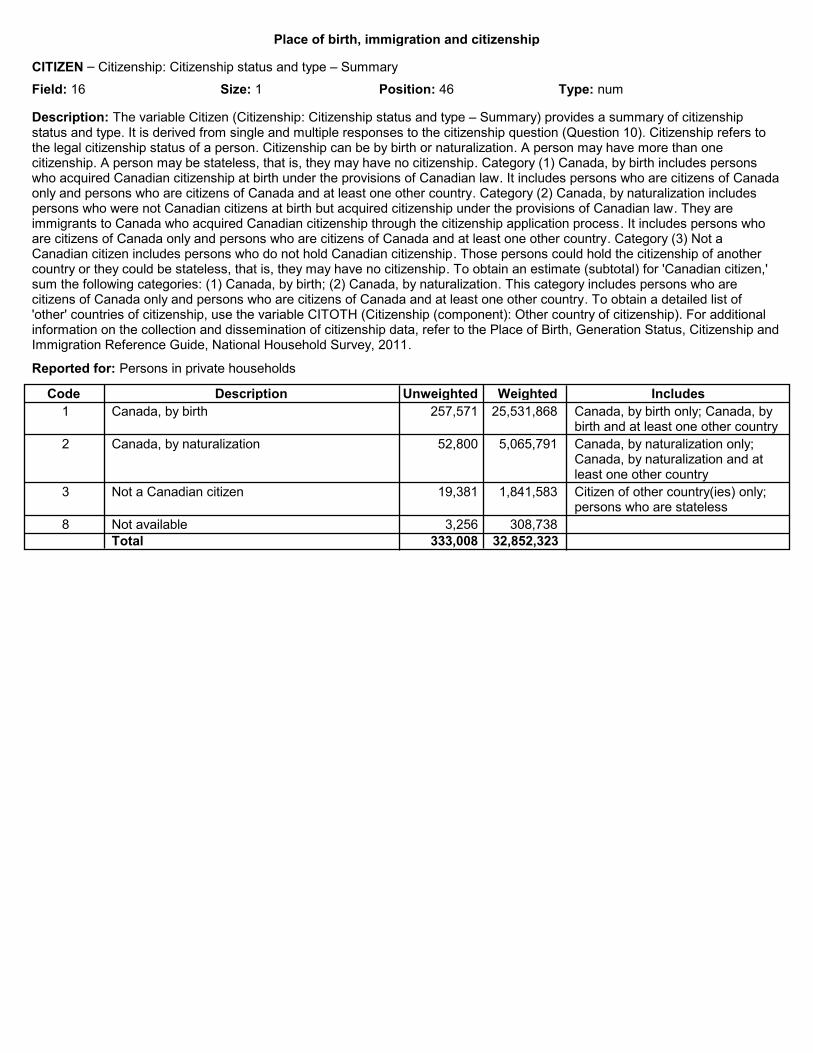
CITIZEN – Citizenship: Citizenship status and type – Summary
Field: 16 Position: 46Size: 1 Type: num
Description: The variable Citizen (Citizenship: Citizenship status and type – Summary) provides a summary of citizenship status and type. It is derived from single and multiple responses to the citizenship question (Question 10). Citizenship refers to the legal citizenship status of a person. Citizenship can be by birth or naturalization. A person may have more than one citizenship. A person may be stateless, that is, they may have no citizenship. Category (1) Canada, by birth includes persons who acquired Canadian citizenship at birth under the provisions of Canadian law. It includes persons who are citizens of Canada only and persons who are citizens of Canada and at least one other country. Category (2) Canada, by naturalization includes persons who were not Canadian citizens at birth but acquired citizenship under the provisions of Canadian law. They are immigrants to Canada who acquired Canadian citizenship through the citizenship application process. It includes persons who are citizens of Canada only and persons who are citizens of Canada and at least one other country. Category (3) Not a Canadian citizen includes persons who do not hold Canadian citizenship. Those persons could hold the citizenship of another country or they could be stateless, that is, they may have no citizenship. To obtain an estimate (subtotal) for 'Canadian citizen,' sum the following categories: (1) Canada, by birth; (2) Canada, by naturalization. This category includes persons who are citizens of Canada only and persons who are citizens of Canada and at least one other country. To obtain a detailed list of 'other' countries of citizenship, use the variable CITOTH (Citizenship (component): Other country of citizenship). For additional information on the collection and dissemination of citizenship data, refer to the Place of Birth, Generation Status, Citizenship and Immigration Reference Guide, National Household Survey, 2011.
Reported for: Persons in private households
Description WeightedCode IncludesUnweighted
1 Canada, by birth 25,531,868 257,571 Canada, by birth only; Canada, by birth and at least one other country
2 Canada, by naturalization 5,065,791 52,800 Canada, by naturalization only; Canada, by naturalization and at least one other country
3 Not a Canadian citizen 1,841,583 19,381 Citizen of other country(ies) only; persons who are stateless
8 Not available 308,738 3,256Total 333,008 32,852,323
Place of birth, immigration and citizenship
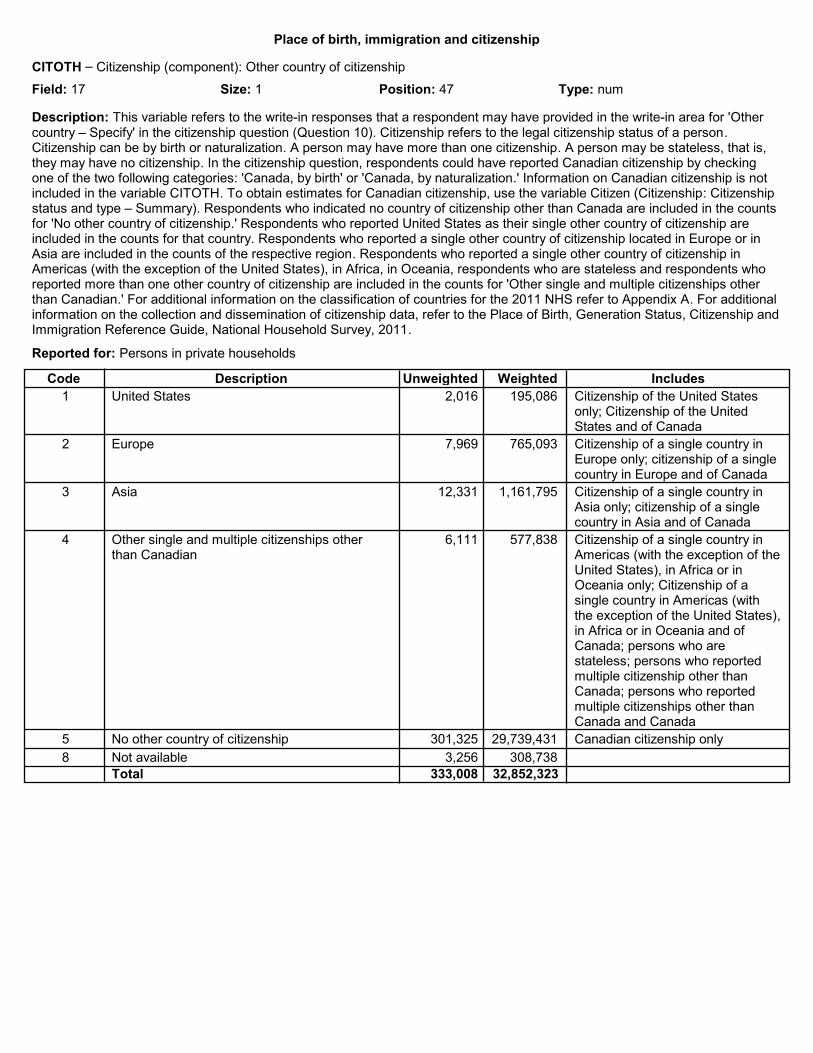
CITOTH – Citizenship (component): Other country of citizenship
Field: 17 Position: 47Size: 1 Type: num
Description: This variable refers to the write-in responses that a respondent may have provided in the write-in area for 'Other country – Specify' in the citizenship question (Question 10). Citizenship refers to the legal citizenship status of a person. Citizenship can be by birth or naturalization. A person may have more than one citizenship. A person may be stateless, that is, they may have no citizenship. In the citizenship question, respondents could have reported Canadian citizenship by checking one of the two following categories: 'Canada, by birth' or 'Canada, by naturalization.' Information on Canadian citizenship is not included in the variable CITOTH. To obtain estimates for Canadian citizenship, use the variable Citizen (Citizenship: Citizenship status and type – Summary). Respondents who indicated no country of citizenship other than Canada are included in the counts for 'No other country of citizenship.' Respondents who reported United States as their single other country of citizenship are included in the counts for that country. Respondents who reported a single other country of citizenship located in Europe or in Asia are included in the counts of the respective region. Respondents who reported a single other country of citizenship in Americas (with the exception of the United States), in Africa, in Oceania, respondents who are stateless and respondents who reported more than one other country of citizenship are included in the counts for 'Other single and multiple citizenships other than Canadian.' For additional information on the classification of countries for the 2011 NHS refer to Appendix A. For additional information on the collection and dissemination of citizenship data, refer to the Place of Birth, Generation Status, Citizenship and Immigration Reference Guide, National Household Survey, 2011.
Reported for: Persons in private households
Description WeightedCode IncludesUnweighted
1 United States 195,086 2,016 Citizenship of the United States only; Citizenship of the United States and of Canada
2 Europe 765,093 7,969 Citizenship of a single country in Europe only; citizenship of a single country in Europe and of Canada
3 Asia 1,161,795 12,331 Citizenship of a single country in Asia only; citizenship of a single country in Asia and of Canada
4 Other single and multiple citizenships other than Canadian
577,838 6,111 Citizenship of a single country in Americas (with the exception of the United States), in Africa or in Oceania only; Citizenship of a single country in Americas (with the exception of the United States), in Africa or in Oceania and of Canada; persons who are stateless; persons who reported multiple citizenship other than Canada; persons who reported multiple citizenships other than Canada and Canada
5 No other country of citizenship 29,739,431 301,325 Canadian citizenship only
8 Not available 308,738 3,256Total 333,008 32,852,323

Place of birth, immigration and citizenship
GENSTAT – Generation status: Detailed
Field: 32 Position: 79Size: 1 Type: num
Description: Generation status refers to whether or not the person or the person's parents were born in Canada. It identifies persons as being first generation, second generation or third generation or more. This variable is derived from responses to questions concerning the person's place of birth (Question 9) and the place of birth of his or her parents (Question 25). 'First generation' includes persons who were born outside Canada. For the most part, these are people who are now, or once were, immigrants to Canada. 'Second generation' includes persons who were born in Canada and had at least one parent born outside Canada. For the most part, these are the children of immigrants. 'Third generation or more' includes persons who were born in Canada with both parents born in Canada. For additional information on the collection and dissemination of generation status data, refer to the Place of Birth, Generation Status, Citizenship and Immigration Reference Guide, National Household Survey, 2011.
Reported for: Persons in private households
Description WeightedCode IncludesUnweighted
1 First generation, respondent born outside Canada
7,137,420 74,596
2 Second generation, respondent born in Canada, both parents born outside Canada
3,104,691 31,921
3 Second generation, respondent born in Canada, one parent born outside Canada
2,513,341 25,503
4 Third generation or more, respondent born in Canada, both parents born in Canada
19,825,288 199,207
8 Not available 167,240 1,781Total 333,008 32,852,323
IMMSTAT – Immigration: Immigrant status
Field: 44 Position: 101Size: 1 Type: num
Description: This variable indicates whether the respondent is a non-immigrant, an immigrant or a non-permanent resident. Immigrant status is derived from the responses to the citizenship question (Question 10) and the landed immigrant status question (Question 11). Non-immigrant refers to a person who is a Canadian citizen by birth. Immigrant refers to a person who is or has ever been a landed immigrant/permanent resident. This person has been granted the right to live in Canada permanently by immigration authorities. Some immigrants have resided in Canada for a number of years, while others have arrived recently. Some immigrants are Canadian citizens, while others are not. Most immigrants are born outside Canada, but a small number are born in Canada. In the 2011 National Household Survey, 'Immigrants' includes immigrants who landed in Canada prior to May 10, 2011. Non-permanent resident refers to a person from another country who has a work or study permit or who is a refugee claimant, and any non-Canadian born family member living in Canada with them. For additional information on the collection and dissemination of immigrant status data, refer to the Place of Birth, Generation Status, Citizenship and Immigration Reference Guide, National Household Survey, 2011.
Reported for: Persons in private households
Description WeightedCode IncludesUnweighted
1 Non-permanent residents 347,953 3,582
2 Non-immigrants 25,651,695 258,836
3 Immigrants 6,748,333 70,590Total 333,008 32,852,323

Place of birth, immigration and citizenship
POB – Place of birth: Detailed
Field: 79 Position: 157Size: 1 Type: num
Description: Place of birth refers to the name of the country in which the person was born. The geographic location is specified according to boundaries current at the time the data are collected, not the boundaries at the time of birth. To obtain an estimate of the population 'Born outside Canada,' sum the categories for each country and region outside Canada. For additional information on the classification of countries for the 2011 NHS, refer to Appendix A. For additional information on the collection and dissemination of place of birth data, refer to the Place of Birth, Generation Status, Citizenship and Immigration Reference Guide, National Household Survey, 2011.
Reported for: Persons in private households
Description WeightedCode IncludesUnweighted
1 Canada 25,514,753 257,410
2 United States 294,491 3,019
3 Europe 2,208,401 22,576 See Appendix A: Europe
4 Asia 3,182,848 33,787 See Appendix A: Asia
5 Other 1,403,348 14,703 See Appendix A: Americas – excludes United States; Africa; Oceania; and other
8 Not available 144,139 1,513Total 333,008 32,852,323
POBF – Place of birth of father: Detailed
Field: 80 Position: 158Size: 1 Type: num
Description: Place of birth of father refers to the name of the country in which the respondent's father was born. The geographic location is specified according to boundaries current at the time the data are collected, not the boundaries at the time of birth. To obtain an estimate of the population 'Born outside Canada,' sum the categories for each country and region outside Canada. For additional information on the classification of countries for the 2011 NHS, refer to Appendix A. For additional information on the collection and dissemination of place of birth of father data, refer to the Place of Birth, Generation Status, Citizenship and Immigration Reference Guide, National Household Survey, 2011.
Reported for: Persons in private households
Description WeightedCode IncludesUnweighted
1 Canada 21,103,889 212,270
2 United States 454,426 4,590
3 Europe 4,696,709 47,732 See Appendix A: Europe
4 Asia 4,310,232 45,681 See Appendix A: Asia
5 Other 2,038,585 21,222 See Appendix A: Americas – excludes United States; Africa; Oceania; and other
8 Not available 144,139 1,513Total 333,008 32,852,323

Place of birth, immigration and citizenship
POBM – Place of birth of mother: Detailed
Field: 81 Position: 159Size: 1 Type: num
Description: Place of birth of mother refers to the name of the country in which the respondent's mother was born. The geographic location is specified according to boundaries current at the time the data are collected, not the boundaries at the time of birth. To obtain an estimate of the population 'Born outside Canada,' sum the categories for each country and region outside Canada. For additional information on the classification of countries for the 2011 NHS, refer to the Appendix A. For additional information on the collection and dissemination of place of birth of mother data, refer to the Place of Birth, Generation Status, Citizenship and Immigration Reference Guide, National Household Survey, 2011.
Reported for: Persons in private households
Description WeightedCode IncludesUnweighted
1 Canada 21,529,014 216,505
2 United States 446,605 4,523
3 Europe 4,339,012 44,187 See Appendix A: Europe
4 Asia 4,302,247 45,602 See Appendix A: Asia
5 Other 1,986,963 20,678 See Appendix A: Americas – excludes United States; Africa; Oceania; and other
8 Not available 144,139 1,513Total 333,008 32,852,323
YRIMM – Immigration: Year of immigration
Field: 112 Position: 368Size: 1 Type: num
Description: The variable YRIMM (Immigration: Year of immigration) indicates the year of immigration. It refers to the year in which the immigrant first obtained his or her landed immigrant/permanent resident status. To obtain an estimate (subtotal) for 'Immigrants,' sum all years of immigration. Immigrant refers to a person who is or has ever been a landed immigrant /permanent resident. This person has been granted the right to live in Canada permanently by immigration authorities. Some immigrants have resided in Canada for a number of years, while others have arrived recently. Some immigrants are Canadian citizens, while others are not. Most immigrants are born outside Canada, but a small number are born in Canada. In the 2011 National Household Survey, 'Immigrants' includes immigrants who landed in Canada prior to May 10, 2011. Users should note that comparisons of individual years of immigration over time or between surveys can be affected by a number of factors, for example, emigration and mortality among the immigrant population, survey methodology and respondent reporting patterns. For additional information on the collection and dissemination of year of immigration data, refer to the Place of Birth, Generation Status, Citizenship and Immigration Reference Guide, National Household Survey, 2011.
Reported for: Persons in private households who are, or have ever been, landed immigrants
Description WeightedCode IncludesUnweighted
1 Before 1981 2,117,810 21,509
2 1981 to 1990 913,145 9,630
3 1991 to 2000 1,484,003 15,764
4 2001 to 2005 980,452 10,387
5 2006 to 2011 1,102,104 11,713 Includes the first four months of 2011
8 Not available 150,818 1,587
9 Not applicable 25,999,648 262,418 Non-immigrants and non-permanent residents
Total 333,008 32,852,323

Aboriginal population
ABOID – Aboriginal: Aboriginal identity – Detailed
Field: 5 Position: 31Size: 1 Type: num
Description: 'Aboriginal identity' refers to whether the person reported being an Aboriginal person, that is, First Nations (North American Indian), Métis or Inuk (Inuit) and/or being a Registered or Treaty Indian (that is, registered under the Indian Act of Canada) and/or being a member of a First Nation or Indian band. Aboriginal identity is derived from data collected in three questions: Aboriginal group (Question 18); Registered or Treaty Indian status (Question 20); and membership in a First Nation or Indian band (Question 21). Aboriginal peoples of Canada are defined in the Constitution Act, 1982, Section 35 (2) as including the Indian, Inuit and Métis peoples of Canada. A person may report being in more than one of those three specific groups in Question 18. To obtain an estimate (total) for 'Aboriginal identity' either use the variable AbDerr (Aboriginal: Aboriginal identity – Summary) or sum the first five categories of this variable, AbIdent (Aboriginal: Aboriginal identity – Detailed): (1) 'First Nations (North American Indian) single identity'; (2) 'Métis single identity'; (3) 'Inuk (Inuit) single identity'; (4) 'Multiple Aboriginal identities'; and (5) 'Aboriginal identities not included elsewhere.' To obtain an estimate (subtotal) for 'Aboriginal single identity,' sum the categories: (1) 'First Nations (North American Indian) single identity'; (2) 'Métis single identity'; and (3) 'Inuk (Inuit) single identity.' The 'Aboriginal single identity' category includes persons who reported being one and only one of First Nations (North American Indian), Métis or Inuk (Inuit). 'First Nations (North American Indian) single identity' includes persons who reported being First Nations (North American Indian). This category includes persons who reported the single response of First Nations (North American Indian) but did not report being Métis or Inuk (Inuit). 'Métis single identity' includes persons who reported being Métis. This category includes persons who reported the single response of Métis but did not report being First Nations (North American Indian) or Inuk (Inuit). 'Inuk (Inuit) single identity' includes persons who reported being Inuk (Inuit). This category includes persons who reported the single response of Inuk (Inuit) but did not report being First Nations (North American Indian) or Métis. 'Multiple Aboriginal identities' includes persons who reported being any two or all three of the following: First Nations (North American Indian), Métis or Inuk (Inuit). 'Aboriginal identities not included elsewhere' includes persons who did not report being First Nations (North American Indian), Métis or Inuk (Inuit) but who did report Registered or Treaty Indian status and/or membership in a First Nation or Indian band. 'Non-Aboriginal identity' includes persons who did not report being First Nations (North American Indian), Métis or Inuk (Inuit), and also did not report Registered or Treaty Indian status or membership in a First Nation or Indian band. INCOMPLETELY ENUMERATED INDIAN RESERVES AND INDIAN SETTLEMENTS Users should be aware that the estimates associated with this variable are more affected than most by the incomplete enumeration of certain Indian reserves and Indian settlements in the National Household Survey (NHS). The extent of the impact will depend on the geographic area under study. By variable and/or group, the issue of incompletely enumerated reserves has the greatest impact on NHS estimates for the total Aboriginal identity population, the First Nations (North American Indian) identity population, the total Aboriginal ancestry population, the First Nations (North American Indian) ancestry population, the Registered or Treaty Indian population, the population who reported membership in a First Nation or Indian Band and the population living on Indian reserves and Indian settlements. Estimates associated with other variables related to Aboriginal peoples, such as language and band housing, may also be more affected by the incomplete enumeration of certain Indian reserves and Indian settlements in the NHS. This issue does not have a significant impact on the estimates for variables associated with the Inuit or Métis populations, as they are less likely to live on reserve. In 2011, there were a total of 36 Indian reserves and Indian settlements that were 'incompletely enumerated' in the NHS. For these reserves or settlements, NHS enumeration was either not permitted or was interrupted before it could be completed, or was not possible because of natural events (specifically forest fires in Northern Ontario). Any historical comparison of Aboriginal data must include adjustments for incompletely enumerated reserves and settlements and for other changes in the definition and geography of reserves. There are two different adjustments that may be necessary. The first adjustment (Adjusted base) is used for comparison of the same areas across different collection periods. Only the Indian reserves and Indian settlements that participated in all comparison years are included when comparing data. The second adjustment (Area of residence) is used when comparing the on- or off-reserve populations over time. If the on- or off-reserve

Aboriginal population
categories are not required for the historical comparison, then only the Adjusted base variables are used. For more information on required adjustments to tables, please refer to notes attached to the Adjusted base and Area of residence variables. Data tables that do not involve historical comparisons should not use the adjustments. The estimates in adjusted tables used for historical comparison may differ from those based on unadjusted data. For additional information on the collection and dissemination of Aboriginal data, please refer to the Aboriginal Peoples Reference Guide, National Household Survey, 2011, and the Aboriginal Peoples Technical Report, National Household Survey, 2011.
Reported for: Persons in private households
Description WeightedCode IncludesUnweighted
1 North American Indian single response 763,706 7,848
2 Métis single response 451,526 4,506
3 Inuit single response 53,584 577
4 Multiple Aboriginal identity responses 9,769 100
5 Aboriginal responses not included elsewhere 26,379 243
6 Non-Aboriginal identity population 31,048,383 315,648
8 Not available 394,633 4,086Total 333,008 32,852,323

Aboriginal population
BFNMEMB – Aboriginal: Membership in a First Nation or Indian band
Field: 9 Position: 37Size: 1 Type: num
Description: Membership in a First Nation or Indian band refers to whether a person reported membership in a First Nation or Indian band. An Indian band is defined as a body of Indians for whose collective use and benefit lands have been set apart or money is held by the Crown, or who have been declared to be a band for the purpose of the Indian Act. Many Indian bands have elected to call themselves a First Nation and have changed their band name to reflect this. With the 1985 amendment to the Indian Act of Canada (Bill C-31), many Indian bands exercised the right to establish their own membership code, whereby it was not always necessary for a band member to be a Registered Indian according to the Indian Act. 'Member of a First Nation or Indian band' includes persons who reported membership in a First Nation or Indian band in Question 21. 'Not a member of a First Nation or Indian band' includes persons who did not report membership in a First Nation or Indian band in Question 21. INCOMPLETELY ENUMERATED INDIAN RESERVES AND INDIAN SETTLEMENTS Users should be aware that the estimates associated with this variable are more affected than most by the incomplete enumeration of certain Indian reserves and Indian settlements in the National Household Survey (NHS). The extent of the impact will depend on the geographic area under study. By variable and/or group, the issue of incompletely enumerated reserves has the greatest impact on NHS estimates for the total Aboriginal identity population, the First Nations (North American Indian) identity population, the total Aboriginal ancestry population, the First Nations (North American Indian) ancestry population, the Registered or Treaty Indian population, the population who reported membership in a First Nation or Indian Band and the population living on Indian reserves and Indian settlements. Estimates associated with other variables related to Aboriginal peoples, such as language and band housing, may also be more affected by the incomplete enumeration of certain Indian reserves and Indian settlements in the NHS. This issue does not have a significant impact on the estimates for variables associated with the Inuit or Métis populations, as they are less likely to live on reserve. In 2011, there were a total of 36 Indian reserves and Indian settlements that were 'incompletely enumerated' in the NHS. For these reserves or settlements, NHS enumeration was either not permitted or was interrupted before it could be completed, or was not possible because of natural events (specifically forest fires in Northern Ontario). Any historical comparison of Aboriginal data must include adjustments for incompletely enumerated reserves and settlements and for other changes in the definition and geography of reserves. There are two different adjustments that may be necessary. The first adjustment (Adjusted base) is used for comparison of the same areas across different collection periods. Only the Indian reserves and Indian settlements that participated in all comparison years are included when comparing data. The second adjustment (Area of residence) is used when comparing the on- or off-reserve populations over time. If the on- or off-reserve categories are not required for the historical comparison, then only the Adjusted base variables are used. For more information on required adjustments to tables, please refer to notes attached to the Adjusted base and Area of residence variables. Data tables that do not involve historical comparisons should not use the adjustments. The estimates in adjusted tables used for historical comparison may differ from those based on unadjusted data. For additional information on the collection and dissemination of Aboriginal data, please refer to the Aboriginal Peoples Reference Guide, National Household Survey, 2011, and the Aboriginal Peoples Technical Report, National Household Survey, 2011.
Reported for: Persons in private households
Description WeightedCode IncludesUnweighted
1 Not a member of a First Nation or Indian band 31,765,965 322,854
2 Member of a First Nation or Indian band 587,382 6,068
8 Not available 394,633 4,086Total 333,008 32,852,323

Aboriginal population
REGIND – Aboriginal: Registered or Treaty Indian status
Field: 89 Position: 171Size: 1 Type: num
Description: Registered or Treaty Indian status refers to whether or not a person reported being a Registered or Treaty Indian. 'Registered or Treaty Indian' includes persons who reported being a Registered or Treaty Indian in Question 20. Registered Indians are persons who are registered under the Indian Act of Canada. Treaty Indians are persons who belong to a First Nation or Indian band that signed a treaty with the Crown. Registered or Treaty Indians are sometimes also called Status Indians. 'Not a Registered or Treaty Indian' includes persons who did not report being a Registered or Treaty Indian in Question 20. INCOMPLETELY ENUMERATED INDIAN RESERVES AND INDIAN SETTLEMENTS Users should be aware that the estimates associated with this variable are more affected than most by the incomplete enumeration of certain Indian reserves and Indian settlements in the National Household Survey (NHS). The extent of the impact will depend on the geographic area under study. By variable and/or group, the issue of incompletely enumerated reserves has the greatest impact on NHS estimates for the total Aboriginal identity population, the First Nations (North American Indian) identity population, the total Aboriginal ancestry population, the First Nations (North American Indian) ancestry population, the Registered or Treaty Indian population, the population who reported membership in a First Nation or Indian Band and the population living on Indian reserves and Indian settlements. Estimates associated with other variables related to Aboriginal peoples, such as language and band housing, may also be more affected by the incomplete enumeration of certain Indian reserves and Indian settlements in the NHS. This issue does not have a significant impact on the estimates for variables associated with the Inuit or Métis populations, as they are less likely to live on reserve. In 2011, there were a total of 36 Indian reserves and Indian settlements that were 'incompletely enumerated' in the NHS. For these reserves or settlements, NHS enumeration was either not permitted or was interrupted before it could be completed, or was not possible because of natural events (specifically forest fires in Northern Ontario). Any historical comparison of Aboriginal data must include adjustments for incompletely enumerated reserves and settlements and for other changes in the definition and geography of reserves. There are two different adjustments that may be necessary. The first adjustment (Adjusted base) is used for comparison of the same areas across different collection periods. Only the Indian reserves and Indian settlements that participated in all comparison years are included when comparing data. The second adjustment (Area of residence) is used when comparing the on- or off-reserve populations over time. If the on- or off-reserve categories are not required for the historical comparison, then only the Adjusted base variables are used. For more information on required adjustments to tables, please refer to notes attached to the Adjusted base and Area of residence variables. Data tables that do not involve historical comparisons should not use the adjustments. The estimates in adjusted tables used for historical comparison may differ from those based on unadjusted data. For additional information on the collection and dissemination of Aboriginal data, please refer to the Aboriginal Peoples Reference Guide, National Household Survey, 2011, and the Aboriginal Peoples Technical Report, National Household Survey, 2011.
Reported for: Persons in private households
Description WeightedCode IncludesUnweighted
1 Not a Registered Indian 31,751,709 322,744
2 Registered Indian 601,638 6,178
8 Not available 394,633 4,086Total 333,008 32,852,323

Ethnic origin
ETHDER – Ethnic origin: Derived single and selected multiple ethnic origins
Field: 28 Position: 72-73Size: 2 Type: num
Description: Ethnic origin refers to the ethnic or cultural origins of the respondent's ancestors. Respondents were asked to specify as many origins as applicable. Four lines were provided for write-in responses and up to six ethnic origins were retained. This variable provides a distribution of the total population by single responses and selected multiple responses to the ethnic origin question (Question 17). Due to the increasingly high proportion of respondents who report multiple origins in the National Household Survey, it is recommended that this variable only be used for very specific purposes. For most analyses, the variable ETOResps (Ethnic origin: Detailed total responses) is recommended for use. The abbreviation 'n.i.e.' means 'not included elsewhere.' The abbreviation 'n.o.s.' means 'not otherwise specified.' For additional information on the collection and dissemination of ethnic origin data, refer to the Ethnic Origin Reference Guide, National Household Survey, 2011.
Reported for: Persons in private households
Description WeightedCode IncludesUnweighted
1 British Isles origins 2,504,718 24,358 Includes single responses of British Isles origins (see Appendix C)
2 French origins 1,123,506 11,462 Includes single responses of French origins (see Appendix C)
3 North American Aboriginal origins 568,450 5,916 Includes single responses of First Nations (North American Indian), Inuit and Métis
4 Other North American origins 5,953,885 59,878 Includes single responses of Other North American origins (see Appendix C)
5 European origins (excluding British Isles and French origins)
3,505,129 35,373 Includes single responses of European origins (excluding British Isles and French origins) – (see Appendix C )
6 Asian origins 3,924,102 41,463 Includes single responses of Asian origins (see Appendix C)
7 Other single origins 1,109,094 11,516 Includes single responses of all other ethnic origin responses (see Appendix C)
8 Multiple origins 13,664,464 138,956 Includes all multiple responses
88 Not available 394,633 4,086Total 333,008 32,852,323
VISMIN – Visible minority: Detailed
Field: 100 Position: 202Size: 1 Type: num
Description: 'Visible minority' refers to whether a person belongs to a visible minority group as defined by the Employment Equity Act and, if so, the visible minority group to which the person belongs. The Employment Equity Act defines visible minorities as 'persons, other than Aboriginal peoples, who are non-Caucasian in race or non-white in colour.' The visible minority population consists mainly of the following groups: South Asian, Chinese, Black, Filipino, Latin American, Arab, Southeast Asian, West Asian, Korean and Japanese. The Visible minority variable is derived from information collected in Question 19: Population group and Question 18: Aboriginal group. Respondents who reported being Aboriginal in Question 18 are included in the category 'Aboriginal self-reporting.' These respondents were not required to answer the population group question (Question 19). All other respondents are classified based on their mark-in and write-in response(s) to the population group question (Question 19). For additional information on the collection and dissemination of visible minority data, refer to the Visible Minority and Population Group Reference Guide, National Household Survey, 2011.
Reported for: Persons in private households
Description WeightedCode IncludesUnweighted
1 Visible minority 6,168,826 65,010
2 Not a visible minority 26,546,013 267,636
8 Not available 33,142 362Total 333,008 32,852,323
Language
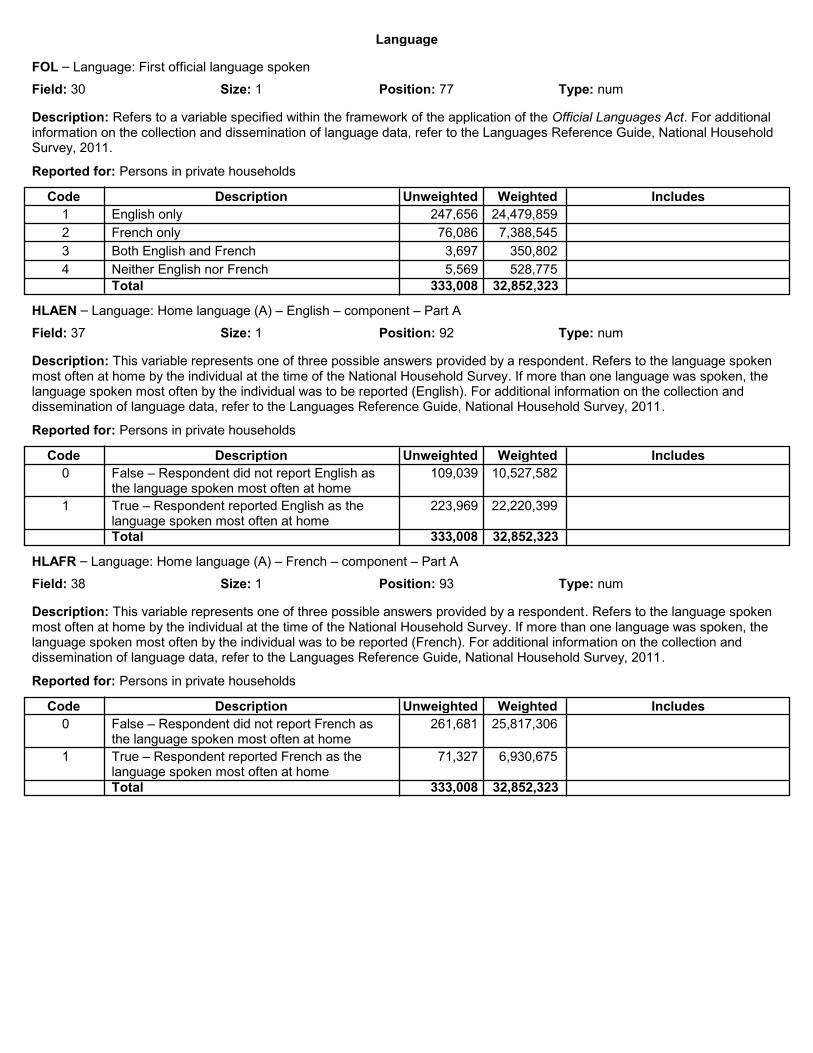
FOL – Language: First official language spoken
Field: 30 Position: 77Size: 1 Type: num
Description: Refers to a variable specified within the framework of the application of the Official Languages Act. For additional information on the collection and dissemination of language data, refer to the Languages Reference Guide, National Household Survey, 2011.
Reported for: Persons in private households
Description WeightedCode IncludesUnweighted
1 English only 24,479,859 247,656
2 French only 7,388,545 76,086
3 Both English and French 350,802 3,697
4 Neither English nor French 528,775 5,569Total 333,008 32,852,323
HLAEN – Language: Home language (A) – English – component – Part A
Field: 37 Position: 92Size: 1 Type: num
Description: This variable represents one of three possible answers provided by a respondent. Refers to the language spoken most often at home by the individual at the time of the National Household Survey. If more than one language was spoken, the language spoken most often by the individual was to be reported (English). For additional information on the collection and dissemination of language data, refer to the Languages Reference Guide, National Household Survey, 2011.
Reported for: Persons in private households
Description WeightedCode IncludesUnweighted
0 False – Respondent did not report English as the language spoken most often at home
10,527,582 109,039
1 True – Respondent reported English as the language spoken most often at home
22,220,399 223,969
Total 333,008 32,852,323
HLAFR – Language: Home language (A) – French – component – Part A
Field: 38 Position: 93Size: 1 Type: num
Description: This variable represents one of three possible answers provided by a respondent. Refers to the language spoken most often at home by the individual at the time of the National Household Survey. If more than one language was spoken, the language spoken most often by the individual was to be reported (French). For additional information on the collection and dissemination of language data, refer to the Languages Reference Guide, National Household Survey, 2011.
Reported for: Persons in private households
Description WeightedCode IncludesUnweighted
0 False – Respondent did not report French as the language spoken most often at home
25,817,306 261,681
1 True – Respondent reported French as the language spoken most often at home
6,930,675 71,327
Total 333,008 32,852,323
Language
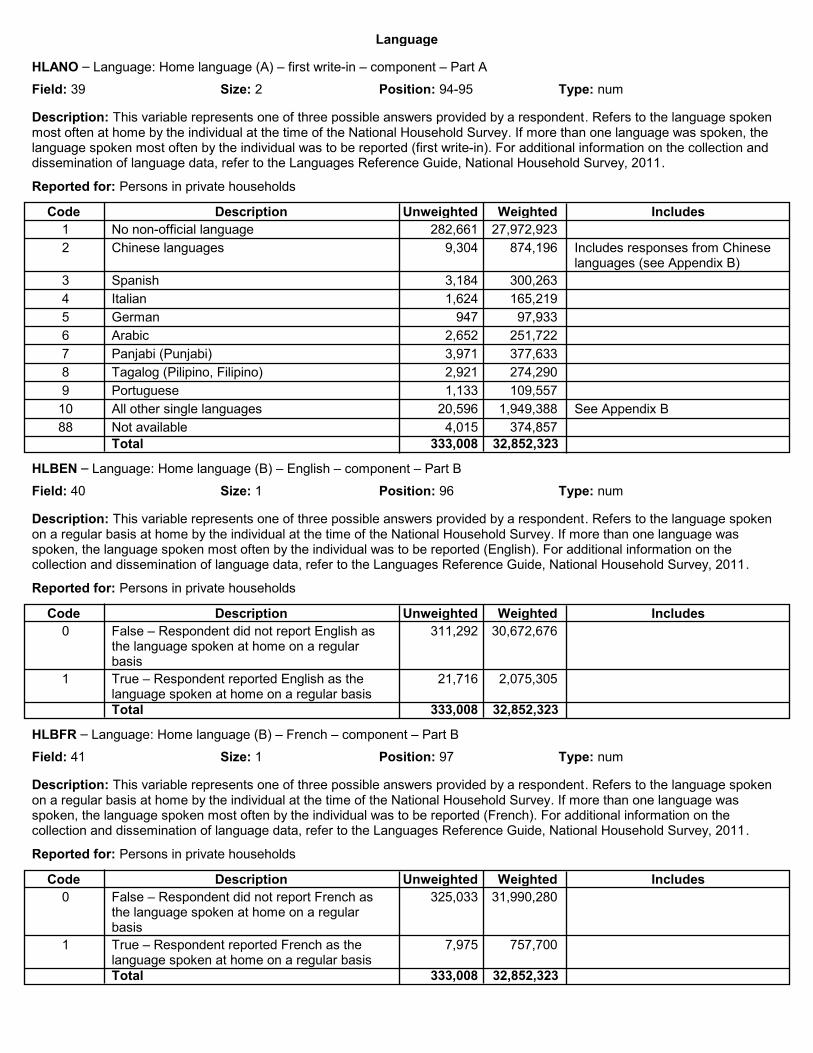
HLANO – Language: Home language (A) – first write-in – component – Part A
Field: 39 Position: 94-95Size: 2 Type: num
Description: This variable represents one of three possible answers provided by a respondent. Refers to the language spoken most often at home by the individual at the time of the National Household Survey. If more than one language was spoken, the language spoken most often by the individual was to be reported (first write-in). For additional information on the collection and dissemination of language data, refer to the Languages Reference Guide, National Household Survey, 2011.
Reported for: Persons in private households
Description WeightedCode IncludesUnweighted
1 No non-official language 27,972,923 282,661
2 Chinese languages 874,196 9,304 Includes responses from Chinese languages (see Appendix B)
3 Spanish 300,263 3,184
4 Italian 165,219 1,624
5 German 97,933 947
6 Arabic 251,722 2,652
7 Panjabi (Punjabi) 377,633 3,971
8 Tagalog (Pilipino, Filipino) 274,290 2,921
9 Portuguese 109,557 1,133
10 All other single languages 1,949,388 20,596 See Appendix B
88 Not available 374,857 4,015Total 333,008 32,852,323
HLBEN – Language: Home language (B) – English – component – Part B
Field: 40 Position: 96Size: 1 Type: num
Description: This variable represents one of three possible answers provided by a respondent. Refers to the language spoken on a regular basis at home by the individual at the time of the National Household Survey. If more than one language was spoken, the language spoken most often by the individual was to be reported (English). For additional information on the collection and dissemination of language data, refer to the Languages Reference Guide, National Household Survey, 2011.
Reported for: Persons in private households
Description WeightedCode IncludesUnweighted
0 False – Respondent did not report English as the language spoken at home on a regular basis
30,672,676 311,292
1 True – Respondent reported English as the language spoken at home on a regular basis
2,075,305 21,716
Total 333,008 32,852,323
HLBFR – Language: Home language (B) – French – component – Part B
Field: 41 Position: 97Size: 1 Type: num
Description: This variable represents one of three possible answers provided by a respondent. Refers to the language spoken on a regular basis at home by the individual at the time of the National Household Survey. If more than one language was spoken, the language spoken most often by the individual was to be reported (French). For additional information on the collection and dissemination of language data, refer to the Languages Reference Guide, National Household Survey, 2011.
Reported for: Persons in private households
Description WeightedCode IncludesUnweighted
0 False – Respondent did not report French as the language spoken at home on a regular basis
31,990,280 325,033
1 True – Respondent reported French as the language spoken at home on a regular basis
757,700 7,975
Total 333,008 32,852,323
Language
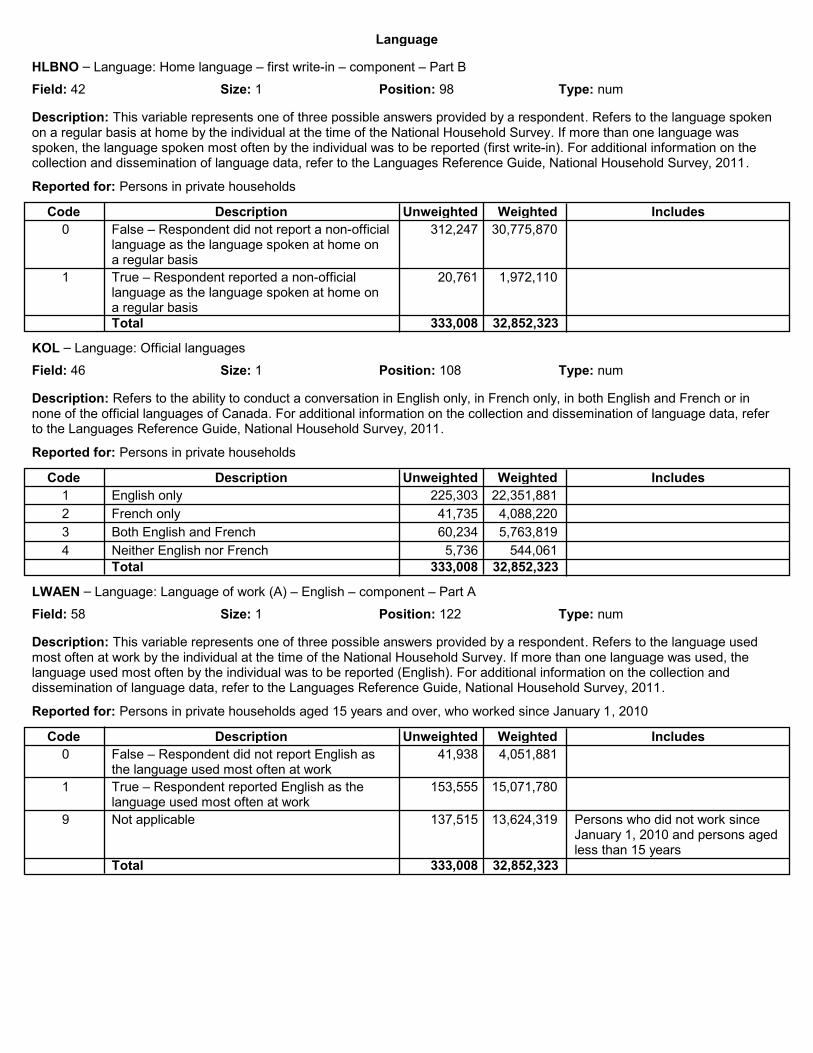
HLBNO – Language: Home language – first write-in – component – Part B
Field: 42 Position: 98Size: 1 Type: num
Description: This variable represents one of three possible answers provided by a respondent. Refers to the language spoken on a regular basis at home by the individual at the time of the National Household Survey. If more than one language was spoken, the language spoken most often by the individual was to be reported (first write-in). For additional information on the collection and dissemination of language data, refer to the Languages Reference Guide, National Household Survey, 2011.
Reported for: Persons in private households
Description WeightedCode IncludesUnweighted
0 False – Respondent did not report a non-official language as the language spoken at home on a regular basis
30,775,870 312,247
1 True – Respondent reported a non-official language as the language spoken at home on a regular basis
1,972,110 20,761
Total 333,008 32,852,323
KOL – Language: Official languages
Field: 46 Position: 108Size: 1 Type: num
Description: Refers to the ability to conduct a conversation in English only, in French only, in both English and French or in none of the official languages of Canada. For additional information on the collection and dissemination of language data, refer to the Languages Reference Guide, National Household Survey, 2011.
Reported for: Persons in private households
Description WeightedCode IncludesUnweighted
1 English only 22,351,881 225,303
2 French only 4,088,220 41,735
3 Both English and French 5,763,819 60,234
4 Neither English nor French 544,061 5,736Total 333,008 32,852,323
LWAEN – Language: Language of work (A) – English – component – Part A
Field: 58 Position: 122Size: 1 Type: num
Description: This variable represents one of three possible answers provided by a respondent. Refers to the language used most often at work by the individual at the time of the National Household Survey. If more than one language was used, the language used most often by the individual was to be reported (English). For additional information on the collection and dissemination of language data, refer to the Languages Reference Guide, National Household Survey, 2011.
Reported for: Persons in private households aged 15 years and over, who worked since January 1, 2010
Description WeightedCode IncludesUnweighted
0 False – Respondent did not report English as the language used most often at work
4,051,881 41,938
1 True – Respondent reported English as the language used most often at work
15,071,780 153,555
9 Not applicable 13,624,319 137,515 Persons who did not work since January 1, 2010 and persons aged less than 15 years
Total 333,008 32,852,323

Language
LWAFR – Language: Language of work (A) – French – component – Part A
Field: 59 Position: 123Size: 1 Type: num
Description: This variable represents one of three possible answers provided by a respondent. Refers to the language used most often at work by the individual at the time of the National Household Survey. If more than one language was used, the language used most often by the individual was to be reported (French). For additional information on the collection and dissemination of language data, refer to the Languages Reference Guide, National Household Survey, 2011.
Reported for: Persons in private households aged 15 years and over, who worked since January 1, 2010
Description WeightedCode IncludesUnweighted
0 False – Respondent did not report French as the language used most often at work
14,971,192 152,492
1 True – Respondent reported French as the language used most often at work
4,152,469 43,001
9 Not applicable 13,624,319 137,515 Persons who did not work since January 1, 2010 and persons aged less than 15 years
Total 333,008 32,852,323
LWANO – Language: Language of work (A) – first write-in – component – Part A
Field: 60 Position: 124Size: 1 Type: num
Description: This variable represents one of three possible answers provided by a respondent. Refers to the language used most often at work by the individual at the time of the National Household Survey. If more than one language was used, the language used most often by the individual was to be reported (first write-in). For additional information on the collection and dissemination of language data, refer to the Languages Reference Guide, National Household Survey, 2011.
Reported for: Persons in private households aged 15 years and over, who worked since January 1, 2010
Description WeightedCode IncludesUnweighted
0 False – Respondent did not report a non-official language as the language used most often at work
18,772,871 191,791
1 True – Respondent reported a non-official language as the language used most often at work
350,791 3,702
9 Not applicable 13,624,319 137,515 Persons who did not work since January 1, 2010 and persons aged less than 15 years
Total 333,008 32,852,323
LWBEN – Language: Language of work (B) – English – component – Part B
Field: 61 Position: 125Size: 1 Type: num
Description: This variable represents one of three possible answers provided by a respondent. Refers to the language used on a regular basis at work by the individual at the time of the National Household Survey. If more than one language was used, the language used most often by the individual was to be reported (English). For additional information on the collection and dissemination of language data, refer to the Languages Reference Guide, National Household Survey, 2011.
Reported for: Persons in private households aged 15 years and over, who worked since January 1, 2010
Description WeightedCode IncludesUnweighted
0 False – Respondent did not report English as the language used on a regular basis at work
17,959,569 183,434
1 True – Respondent reported English as the language used on a regular basis at work
1,164,093 12,059
9 Not applicable 13,624,319 137,515 Persons who did not work since January 1, 2010 and persons aged less than 15 years
Total 333,008 32,852,323

Language
LWBFR – Language: Language of work (B) – French – component – Part B
Field: 62 Position: 126Size: 1 Type: num
Description: This variable represents one of three possible answers provided by a respondent. Refers to the language used on a regular basis at work by the individual at the time of the National Household Survey. If more than one language was used, the language used most often by the individual was to be reported (French). For additional information on the collection and dissemination of language data, refer to the Languages Reference Guide, National Household Survey, 2011.
Reported for: Persons in private households aged 15 years and over, who worked since January 1, 2010
Description WeightedCode IncludesUnweighted
0 False – Respondent did not report French as the language used on a regular basis at work
18,454,914 188,538
1 True – Respondent reported French as the language used on a regular basis at work
668,747 6,955
9 Not applicable 13,624,319 137,515 Persons who did not work since January 1, 2010 and persons aged less than 15 years
Total 333,008 32,852,323
LWBNO – Language: Language of work (B) – first write-in – component – Part B
Field: 63 Position: 127Size: 1 Type: num
Description: This variable represents one of three possible answers provided by a respondent. Refers to the language used on a regular basis at work by the individual at the time of the National Household Survey. If more than one language was used, the language used most often by the individual was to be reported (first write-in). For additional information on the collection and dissemination of language data, refer to the Languages Reference Guide, National Household Survey, 2011.
Reported for: Persons in private households aged 15 years and over, who worked since January 1, 2010
Description WeightedCode IncludesUnweighted
0 False – Respondent did not report a non-official language as the language used on a regular basis at work
18,678,119 190,839
1 True – Respondent reported a non-official language as the language used on a regular basis at work
445,543 4,654
9 Not applicable 13,624,319 137,515 Persons who did not work since January 1, 2010 and persons aged less than 15 years
Total 333,008 32,852,323
MTNEN – Language: Mother tongue (English) – component
Field: 69 Position: 139Size: 1 Type: num
Description: This variable represents one of three possible answers provided by a respondent. Refers to the language first learned in childhood and still understood by the individual at the time of the National Household Survey (English). For additional information on the collection and dissemination of language data, refer to the Languages Reference Guide, National Household Survey, 2011.
Reported for: Persons in private households
Description WeightedCode IncludesUnweighted
0 False – Respondent did not report English as mother tongue
13,517,020 140,313
1 True – Respondent reported English as mother tongue
19,230,960 192,695
Total 333,008 32,852,323
Language
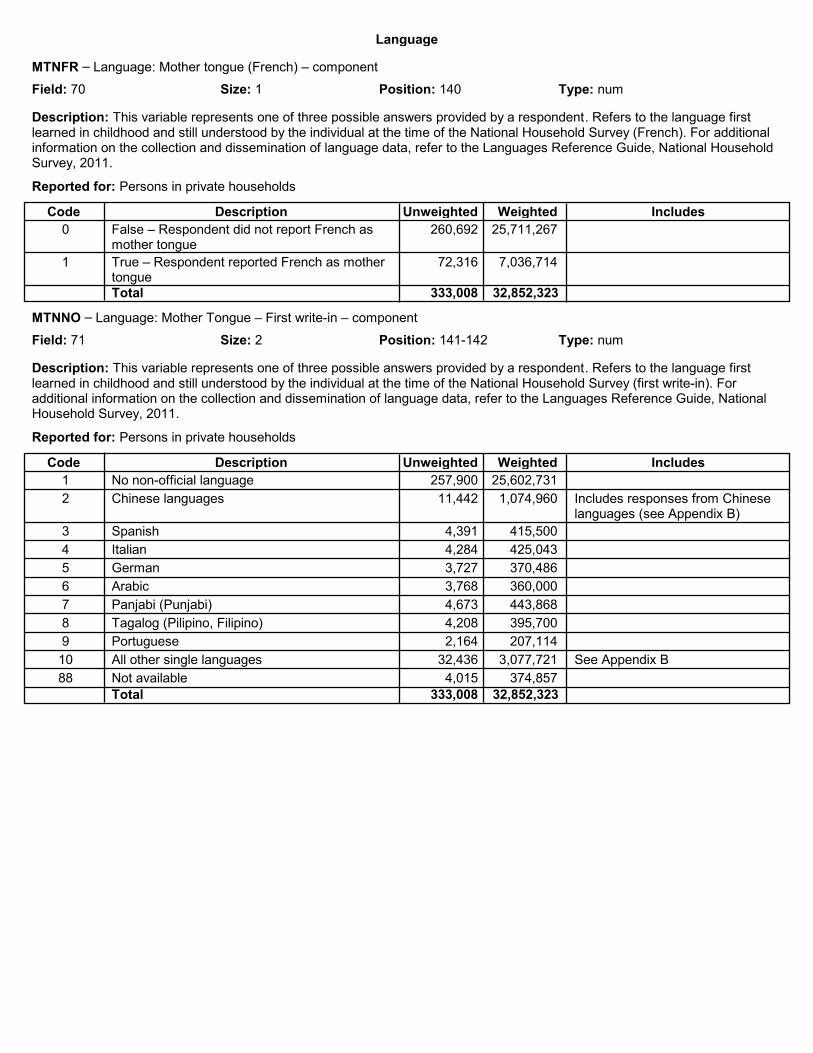
MTNFR – Language: Mother tongue (French) – component
Field: 70 Position: 140Size: 1 Type: num
Description: This variable represents one of three possible answers provided by a respondent. Refers to the language first learned in childhood and still understood by the individual at the time of the National Household Survey (French). For additional information on the collection and dissemination of language data, refer to the Languages Reference Guide, National Household Survey, 2011.
Reported for: Persons in private households
Description WeightedCode IncludesUnweighted
0 False – Respondent did not report French as mother tongue
25,711,267 260,692
1 True – Respondent reported French as mother tongue
7,036,714 72,316
Total 333,008 32,852,323
MTNNO – Language: Mother Tongue – First write-in – component
Field: 71 Position: 141-142Size: 2 Type: num
Description: This variable represents one of three possible answers provided by a respondent. Refers to the language first learned in childhood and still understood by the individual at the time of the National Household Survey (first write-in). For additional information on the collection and dissemination of language data, refer to the Languages Reference Guide, National Household Survey, 2011.
Reported for: Persons in private households
Description WeightedCode IncludesUnweighted
1 No non-official language 25,602,731 257,900
2 Chinese languages 1,074,960 11,442 Includes responses from Chinese languages (see Appendix B)
3 Spanish 415,500 4,391
4 Italian 425,043 4,284
5 German 370,486 3,727
6 Arabic 360,000 3,768
7 Panjabi (Punjabi) 443,868 4,673
8 Tagalog (Pilipino, Filipino) 395,700 4,208
9 Portuguese 207,114 2,164
10 All other single languages 3,077,721 32,436 See Appendix B
88 Not available 374,857 4,015Total 333,008 32,852,323
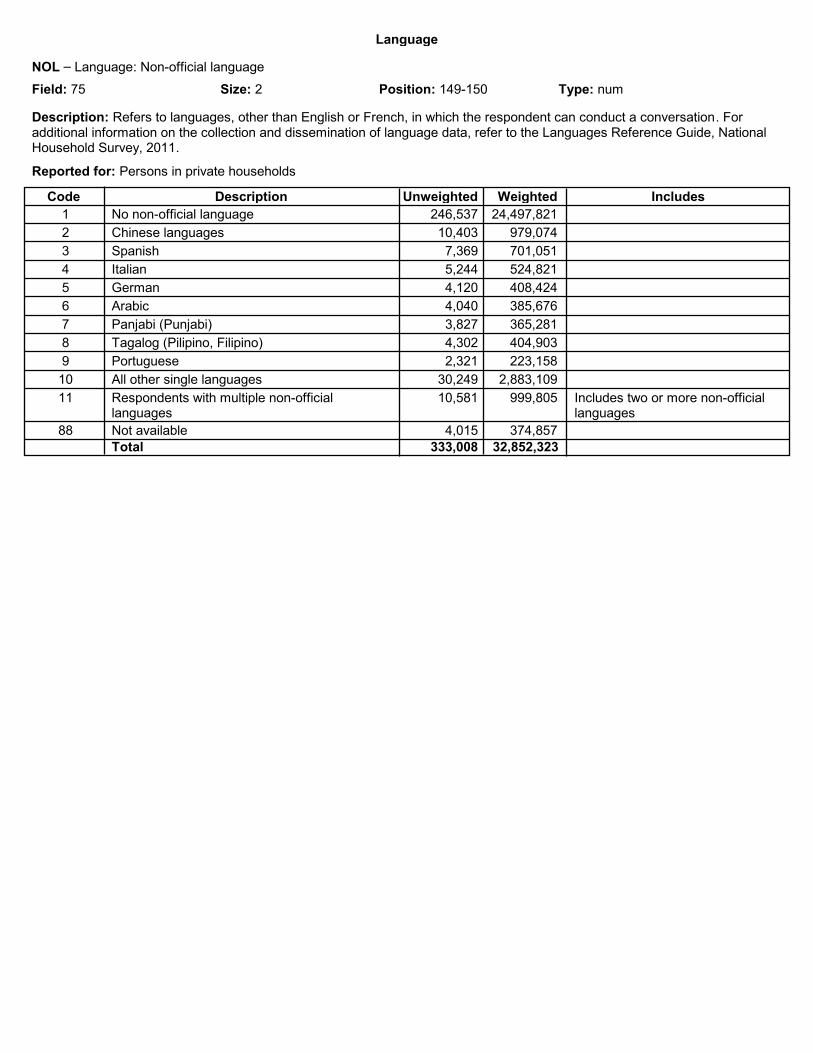
Language
NOL – Language: Non-official language
Field: 75 Position: 149-150Size: 2 Type: num
Description: Refers to languages, other than English or French, in which the respondent can conduct a conversation. For additional information on the collection and dissemination of language data, refer to the Languages Reference Guide, National Household Survey, 2011.
Reported for: Persons in private households
Description WeightedCode IncludesUnweighted
1 No non-official language 24,497,821 246,537
2 Chinese languages 979,074 10,403
3 Spanish 701,051 7,369
4 Italian 524,821 5,244
5 German 408,424 4,120
6 Arabic 385,676 4,040
7 Panjabi (Punjabi) 365,281 3,827
8 Tagalog (Pilipino, Filipino) 404,903 4,302
9 Portuguese 223,158 2,321
10 All other single languages 2,883,109 30,249
11 Respondents with multiple non-official languages
999,805 10,581 Includes two or more non-official languages
88 Not available 374,857 4,015Total 333,008 32,852,323

Education
ATTSCH – Education: Attendance at school
Field: 8 Position: 36Size: 1 Type: num
Description: 'Attendance at school' refers to attendance at school at any time during the nine-month period between September 2010 and May 10, 2011. This variable applies to the population aged 15 years and over in private households. An individual's attendance could be either full time or part time (day or evening), even if the individual dropped out after registration. Attendance was counted only for courses which could be used as credits towards a certificate, diploma or degree from a recognized educational institution (elementary, junior high or secondary school; registered apprenticeship program (in-class portion), trade school, business school, community college, technical institute or CEGEP; or university). Recognized education institutions also included seminaries, schools of nursing, private business schools, private or public trade schools, institutes of technology, vocational schools, or schools for people who are deaf or blind. Attendance at school was not counted for training received from an employer unless it could be used as credit towards a certificate, diploma or degree from a recognized educational institution.
Data quality note: Users are advised that certification analysis of results from the 2011 NHS 'Attendance at school' question showed variations with the Labour Force Survey. It is believed that a small proportion of respondents interpreted the NHS question as 'Has this person ever attended a school, college, CEGEP or university?' rather than the actual question 'At any time since September 2010, has this person attended a school, college, CEGEP or university?' As a result, the 2011 NHS could have overestimated categories with small proportions of school attendance, such as older age groups. We recommend that the data on school attendance be used with caution.
For any other comments on data quality for this variable, refer to the Education Reference Guide, National Household Survey, 2011.
Reported for: Persons in private households aged 15 years and over
Description WeightedCode IncludesUnweighted
1 Did not attend school 22,527,846 227,511
2 Attended school 4,709,206 48,863
9 Not applicable 5,510,929 56,634 Persons aged less than 15 yearsTotal 333,008 32,852,323

Education
CIP2011 – Education: Major field of study, primary groupings (based on CIP Canada 2011)
Field: 15 Position: 44-45Size: 2 Type: num
Description: 'Major field of study' refers to the predominant discipline or area of learning or training of a person's highest postsecondary certificate, diploma or degree. This variable applies to the population aged 15 years and over in private households, with a postsecondary certificate, diploma or degree. It uses the new Classification of Instructional Programs (CIP) Canada 2011 'primary groupings.' Major field of study write-in responses were assigned codes using the updated and revised CIP Canada 2011, as well as the older CIP Canada 2000 to facilitate comparison with other data sources. At the most detailed level, the CIP Canada 2011 consists of 1,688 instructional program classes represented by six-digit codes. Related instructional program classes can be grouped into 387 sub-series (four-digit codes) which can be grouped again to form 49 series (two-digit codes). There is also a variant of CIP Canada 2011 that consists of 13 primary groupings, 12 of which are used for the 2011 National Household Survey (NHS). The category which includes courses in personal improvement and leisure is not used. IMPORTANT NOTE: Some series and their sub-components are not used in the NHS: series 21, 32 to 37 and 53. We recommend that users not make comparisons between categories of the two classification systems on the basis of their labels. Even though many entries in the two classifications are similar, direct comparison could be inappropriate, given the numerous changes made at the detailed level to update the classification. In addition to changes specified by the new CIP2011 classification system, users who select both CIP2000 and CIP2011 classifications in their tables may encounter small counts of CIP2000-CIP2011 pairings from dissimilar fields of study. Such pairings are due to: (a) differing coding interpretations of insufficiently specific write-ins or write-ins involving multiple fields of study, (b) the use of some data processing routines for CIP2000 and CIP2011 codes that operate independently, and (c) an acceptable level of coding error. Theoretical concordances showing the conceptual relationships between CIP Canada 2000 and CIP Canada 2011 based on instructional class definitions are available at: http://www.statcan.gc.ca/concepts/concordances-classifications-eng.htm. For more information on the CIP classifications, see the Classification of Instructional Programs, Canada, 2000, Catalogue no. 12-590-XPE and the Classification of Instructional Programs, Canada 2011, Catalogue no. 12-590-X available from: http://www.statcan.gc.ca/concepts/classification-eng.htm. For any comments on data quality for this variable, refer to the Education Reference Guide, National Household Survey, 2011.
Reported for: Persons in private households aged 15 years and over
Description WeightedCode IncludesUnweighted
1 01 Education 1,059,588 10,958
2 02 Visual and performing arts, and communications technologies
501,452 5,101
3 03 Humanities 762,273 7,867
4 04 Social and behavioural sciences and law 1,415,288 14,561
5 05 Business, management and public administration
3,077,644 31,693
6 06 Physical and life sciences and technologies 503,183 5,220
7 07 Mathematics, computer and information sciences
568,634 5,953
8 08 Architecture, engineering, and related technologies
3,079,418 31,328
9 09 Agriculture, natural resources and conservation
305,034 3,081
10 10 Health and related fields 1,965,056 20,092
11 11 Personal, protective and transportation services
847,548 8,480
12 12 Other 2,075 23
13 No postsecondary certificate, diploma or degree
12,099,632 120,773
88 Not available 1,050,229 11,244
99 Not applicable 5,510,929 56,634 Persons aged less than 15 yearsTotal 333,008 32,852,323
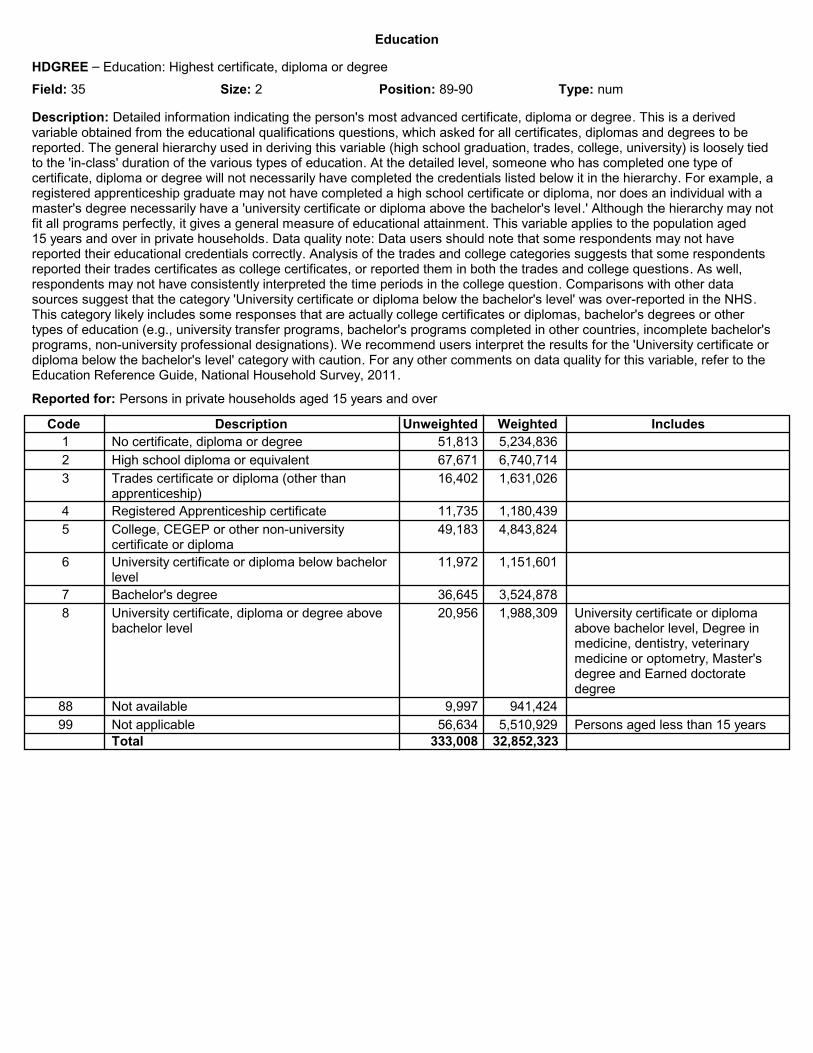
Education
HDGREE – Education: Highest certificate, diploma or degree
Field: 35 Position: 89-90Size: 2 Type: num
Description: Detailed information indicating the person's most advanced certificate, diploma or degree. This is a derived variable obtained from the educational qualifications questions, which asked for all certificates, diplomas and degrees to be reported. The general hierarchy used in deriving this variable (high school graduation, trades, college, university) is loosely tied to the 'in-class' duration of the various types of education. At the detailed level, someone who has completed one type of certificate, diploma or degree will not necessarily have completed the credentials listed below it in the hierarchy. For example, a registered apprenticeship graduate may not have completed a high school certificate or diploma, nor does an individual with a master's degree necessarily have a 'university certificate or diploma above the bachelor's level.' Although the hierarchy may not fit all programs perfectly, it gives a general measure of educational attainment. This variable applies to the population aged 15 years and over in private households. Data quality note: Data users should note that some respondents may not have reported their educational credentials correctly. Analysis of the trades and college categories suggests that some respondents reported their trades certificates as college certificates, or reported them in both the trades and college questions. As well, respondents may not have consistently interpreted the time periods in the college question. Comparisons with other data sources suggest that the category 'University certificate or diploma below the bachelor's level' was over-reported in the NHS. This category likely includes some responses that are actually college certificates or diplomas, bachelor's degrees or other types of education (e.g., university transfer programs, bachelor's programs completed in other countries, incomplete bachelor's programs, non-university professional designations). We recommend users interpret the results for the 'University certificate or diploma below the bachelor's level' category with caution. For any other comments on data quality for this variable, refer to the Education Reference Guide, National Household Survey, 2011.
Reported for: Persons in private households aged 15 years and over
Description WeightedCode IncludesUnweighted
1 No certificate, diploma or degree 5,234,836 51,813
2 High school diploma or equivalent 6,740,714 67,671
3 Trades certificate or diploma (other than apprenticeship)
1,631,026 16,402
4 Registered Apprenticeship certificate 1,180,439 11,735
5 College, CEGEP or other non-university certificate or diploma
4,843,824 49,183
6 University certificate or diploma below bachelor level
1,151,601 11,972
7 Bachelor's degree 3,524,878 36,645
8 University certificate, diploma or degree above bachelor level
1,988,309 20,956 University certificate or diploma above bachelor level, Degree in medicine, dentistry, veterinary medicine or optometry, Master's degree and Earned doctorate degree
88 Not available 941,424 9,997
99 Not applicable 5,510,929 56,634 Persons aged less than 15 yearsTotal 333,008 32,852,323

Education
LOC_ST_RES – Education: Location of study compared with province or territory of residence
Field: 49 Position: 112Size: 1 Type: num
Description: This is a summary variable that indicates whether the 'Location of study' of the person's highest certificate, diploma or degree was the same province or territory where the person lived in at the time of the 2011 National Household Survey, a different Canadian province or territory or outside Canada. This variable is derived from 'Location of study' and province or territory of current residence. It applies to the population aged 15 years and over in private households, with a postsecondary certificate, diploma or degree. Data quality note: Users should be aware that some respondents may have reported the physical location of study rather than the location of the certificate, diploma or degree-granting institution. This could affect the responses of those who obtained a certificate, diploma or degree through a joint program or by distance learning with credentials granted in another province or country. In particular, a number of persons reported a location of study for a university credential in one of the territories (Yukon, Northwest Territories, Nunavut), even though there were no educational institutions in the territories with the authority to grant university degrees. For any other comments on data quality for this variable or 'Location of study,' refer to the Education Reference Guide, National Household Survey, 2011.
Reported for: Persons in private households aged 15 years and over with a postsecondary certificate, diploma or degree
Description WeightedCode IncludesUnweighted
1 Same as province or territory of residence 10,905,122 111,510
2 Another province or territory 1,514,071 15,450
3 Outside Canada 2,397,048 25,200
9 Not applicable 17,931,740 180,848 Persons aged less than 15 years and persons aged 15 years and over with no postsecondary certificate, diploma or degree
Total 333,008 32,852,323
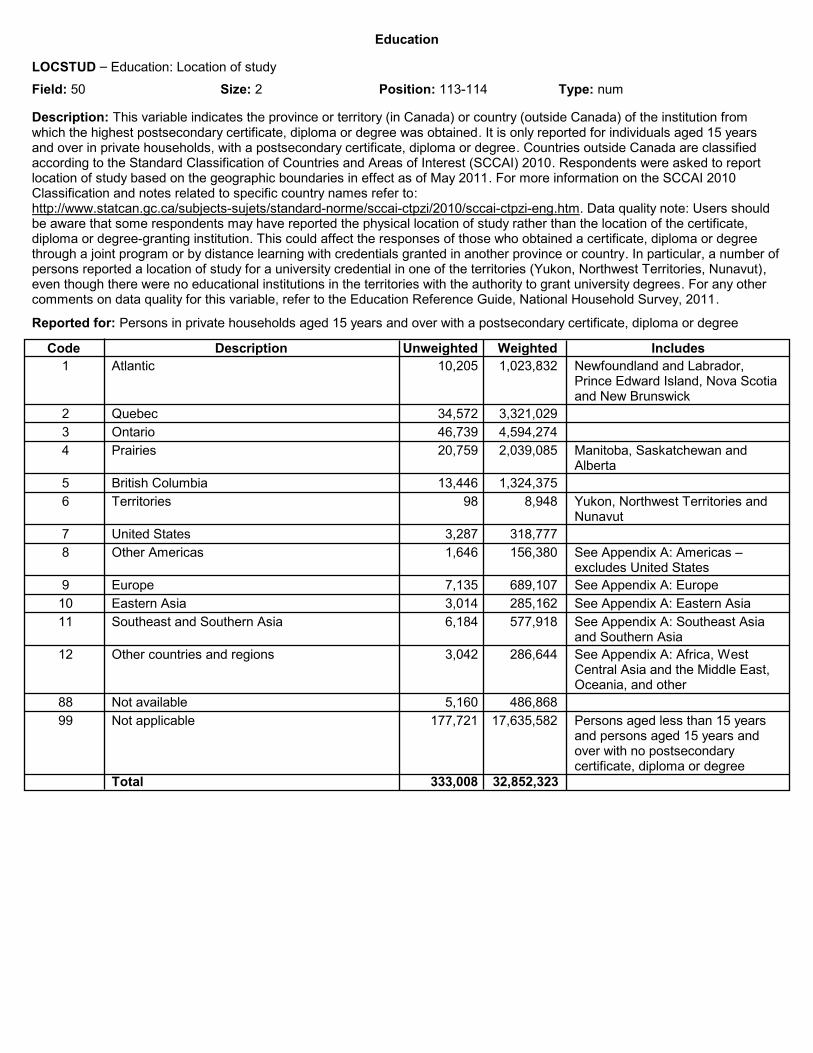
Education
LOCSTUD – Education: Location of study
Field: 50 Position: 113-114Size: 2 Type: num
Description: This variable indicates the province or territory (in Canada) or country (outside Canada) of the institution from which the highest postsecondary certificate, diploma or degree was obtained. It is only reported for individuals aged 15 years and over in private households, with a postsecondary certificate, diploma or degree. Countries outside Canada are classified according to the Standard Classification of Countries and Areas of Interest (SCCAI) 2010. Respondents were asked to report location of study based on the geographic boundaries in effect as of May 2011. For more information on the SCCAI 2010 Classification and notes related to specific country names refer to: http://www.statcan.gc.ca/subjects-sujets/standard-norme/sccai-ctpzi/2010/sccai-ctpzi-eng.htm. Data quality note: Users should be aware that some respondents may have reported the physical location of study rather than the location of the certificate, diploma or degree-granting institution. This could affect the responses of those who obtained a certificate, diploma or degree through a joint program or by distance learning with credentials granted in another province or country. In particular, a number of persons reported a location of study for a university credential in one of the territories (Yukon, Northwest Territories, Nunavut), even though there were no educational institutions in the territories with the authority to grant university degrees. For any other comments on data quality for this variable, refer to the Education Reference Guide, National Household Survey, 2011.
Reported for: Persons in private households aged 15 years and over with a postsecondary certificate, diploma or degree
Description WeightedCode IncludesUnweighted
1 Atlantic 1,023,832 10,205 Newfoundland and Labrador, Prince Edward Island, Nova Scotia and New Brunswick
2 Quebec 3,321,029 34,572
3 Ontario 4,594,274 46,739
4 Prairies 2,039,085 20,759 Manitoba, Saskatchewan and Alberta
5 British Columbia 1,324,375 13,446
6 Territories 8,948 98 Yukon, Northwest Territories and Nunavut
7 United States 318,777 3,287
8 Other Americas 156,380 1,646 See Appendix A: Americas – excludes United States
9 Europe 689,107 7,135 See Appendix A: Europe
10 Eastern Asia 285,162 3,014 See Appendix A: Eastern Asia
11 Southeast and Southern Asia 577,918 6,184 See Appendix A: Southeast Asia and Southern Asia
12 Other countries and regions 286,644 3,042 See Appendix A: Africa, West Central Asia and the Middle East, Oceania, and other
88 Not available 486,868 5,160
99 Not applicable 17,635,582 177,721 Persons aged less than 15 years and persons aged 15 years and over with no postsecondary certificate, diploma or degree
Total 333,008 32,852,323

Education
SSGRAD – Education: Secondary (high) school diploma or equivalent
Field: 94 Position: 178-179Size: 2 Type: num
Description: This variable refers to whether or not persons aged 15 years and over in private households have completed a secondary school or high school diploma, graduation certificate or its equivalent. This variable also indicates whether other educational qualifications are held or not. Examples of high school equivalency certificates are General Educational Development (GED) and Adult Basic Education (ABE). Data quality note: Data users should note that some respondents may not have reported their educational credentials correctly. Analysis of the trades and college categories suggests that some respondents reported their trades certificates as college certificates, or reported them in both the trades and college questions. As well, respondents may not have consistently interpreted the time periods in the college question. Comparisons with other data sources suggest that the category 'University certificate or diploma below the bachelor's level' was over-reported in the NHS. This category likely includes some responses that are actually college certificates or diplomas, bachelor's degrees or other types of education (e.g., university transfer programs, bachelor's programs completed in other countries, incomplete bachelor's programs, non-university professional designations). We recommend users interpret the results for the 'University certificate or diploma below the bachelor's level' category with caution. For any other comments on data quality for this variable, refer to the Education Reference Guide, National Household Survey, 2011.
Reported for: Persons in private households aged 15 years and over
Description WeightedCode IncludesUnweighted
1 No high school diploma or equivalency certificate, without further completed schooling
5,234,836 51,813
2 No high school diploma or equivalency certificate, with registered apprenticeship or other trade certificate
572,032 5,665
3 No high school diploma or equivalency certificate, with college, CEGEP or other non-university certificate
161,593 1,580
4 With high school diploma or equivalency certificate, without further completed schooling
6,740,714 67,671
5 With high school diploma or equivalency certificate, with registered apprenticeship or other trade certificate
2,239,433 22,472
6 With high school diploma or equivalency certificate, with college, CEGEP or other non-university certificate
4,682,231 47,603
7 With high school diploma or equivalency certificate, with university certificate below bachelor
1,151,601 11,972
8 With high school diploma or equivalency certificate, with bachelor's degree
3,524,878 36,645
9 With high school diploma or equivalency certificate, with university certificate, diploma or degree above bachelor level
1,988,309 20,956 'University certificate, diploma or degree above bachelor level' includes the categories 'University certificate or diploma above bachelor level,' 'Degree in medicine, dentistry, veterinary medicine or optometry,' 'Master's degree' and 'Earned doctorate.'
88 Not available 941,424 9,997
99 Not applicable 5,510,929 56,634 Persons aged less than 15 yearsTotal 333,008 32,852,323
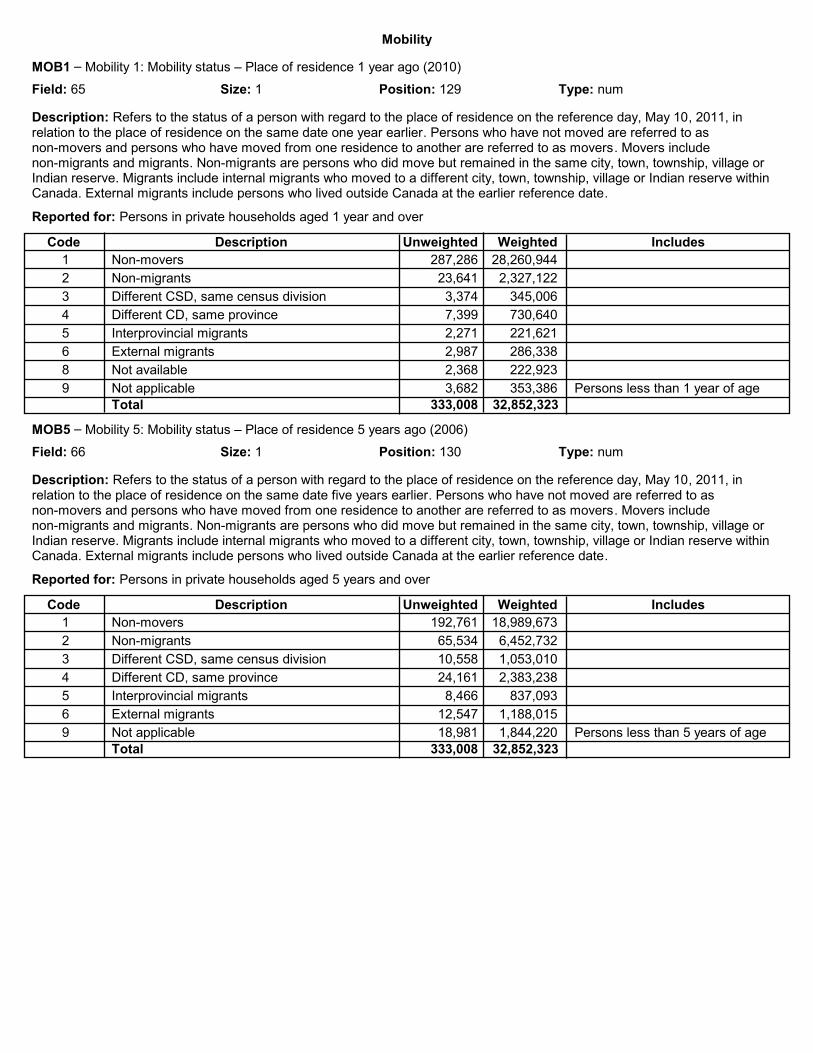
Mobility
MOB1 – Mobility 1: Mobility status – Place of residence 1 year ago (2010)
Field: 65 Position: 129Size: 1 Type: num
Description: Refers to the status of a person with regard to the place of residence on the reference day, May 10, 2011, in relation to the place of residence on the same date one year earlier. Persons who have not moved are referred to as non-movers and persons who have moved from one residence to another are referred to as movers. Movers include non-migrants and migrants. Non-migrants are persons who did move but remained in the same city, town, township, village or Indian reserve. Migrants include internal migrants who moved to a different city, town, township, village or Indian reserve within Canada. External migrants include persons who lived outside Canada at the earlier reference date.
Reported for: Persons in private households aged 1 year and over
Description WeightedCode IncludesUnweighted
1 Non-movers 28,260,944 287,286
2 Non-migrants 2,327,122 23,641
3 Different CSD, same census division 345,006 3,374
4 Different CD, same province 730,640 7,399
5 Interprovincial migrants 221,621 2,271
6 External migrants 286,338 2,987
8 Not available 222,923 2,368
9 Not applicable 353,386 3,682 Persons less than 1 year of ageTotal 333,008 32,852,323
MOB5 – Mobility 5: Mobility status – Place of residence 5 years ago (2006)
Field: 66 Position: 130Size: 1 Type: num
Description: Refers to the status of a person with regard to the place of residence on the reference day, May 10, 2011, in relation to the place of residence on the same date five years earlier. Persons who have not moved are referred to as non-movers and persons who have moved from one residence to another are referred to as movers. Movers include non-migrants and migrants. Non-migrants are persons who did move but remained in the same city, town, township, village or Indian reserve. Migrants include internal migrants who moved to a different city, town, township, village or Indian reserve within Canada. External migrants include persons who lived outside Canada at the earlier reference date.
Reported for: Persons in private households aged 5 years and over
Description WeightedCode IncludesUnweighted
1 Non-movers 18,989,673 192,761
2 Non-migrants 6,452,732 65,534
3 Different CSD, same census division 1,053,010 10,558
4 Different CD, same province 2,383,238 24,161
5 Interprovincial migrants 837,093 8,466
6 External migrants 1,188,015 12,547
9 Not applicable 1,844,220 18,981 Persons less than 5 years of ageTotal 333,008 32,852,323

Mobility
PR1 – Mobility 1: Province or territory of residence 1 year ago (2010)
Field: 84 Position: 163-164Size: 2 Type: num
Description: Refers to the person's usual province or territory of residence on May 10, 2010 one year prior to the reference day, May 10, 2011. This concept applies to the Mobility status (1 year ago) subuniverse only.
Reported for: Persons in private households aged 1 year and over
Description WeightedCode IncludesUnweighted
10 Newfoundland and Labrador 488,635 4,759
11 Prince Edward Island 135,339 1,289
12 Nova Scotia 873,098 8,640
13 New Brunswick 717,361 7,033
24 Quebec 7,511,725 77,661
35 Ontario 12,374,412 125,483
46 Manitoba 1,117,429 11,423
47 Saskatchewan 952,312 9,426
48 Alberta 3,427,342 34,602
59 British Columbia 4,199,060 42,707
63 Northern Canada 88,801 950
88 Not available 222,742 2,366
99 Not applicable 639,724 6,669 Persons less than 1 year of age and external migrants
Total 333,008 32,852,323
PR5 – Mobility 5: Province or territory of residence 5 years ago (2006)
Field: 85 Position: 165-166Size: 2 Type: num
Description: Refers to the person's usual province or territory of residence on May 10, 2006, five years prior to the reference day, May 10, 2011. This concept applies to the Mobility status (5 years ago) subuniverse only.
Reported for: Persons in private households aged 5 years and over
Description WeightedCode IncludesUnweighted
10 Newfoundland and Labrador 470,114 4,581
11 Prince Edward Island 129,119 1,217
12 Nova Scotia 836,330 8,262
13 New Brunswick 692,378 6,757
24 Quebec 7,043,763 72,736
35 Ontario 11,527,873 116,719
46 Manitoba 1,048,307 10,681
47 Saskatchewan 893,826 8,835
48 Alberta 3,116,928 31,465
59 British Columbia 3,865,778 39,246
63 Northern Canada 91,331 981
99 Not applicable 3,032,234 31,528 Persons less than 5 years of age and external migrants
Total 333,008 32,852,323
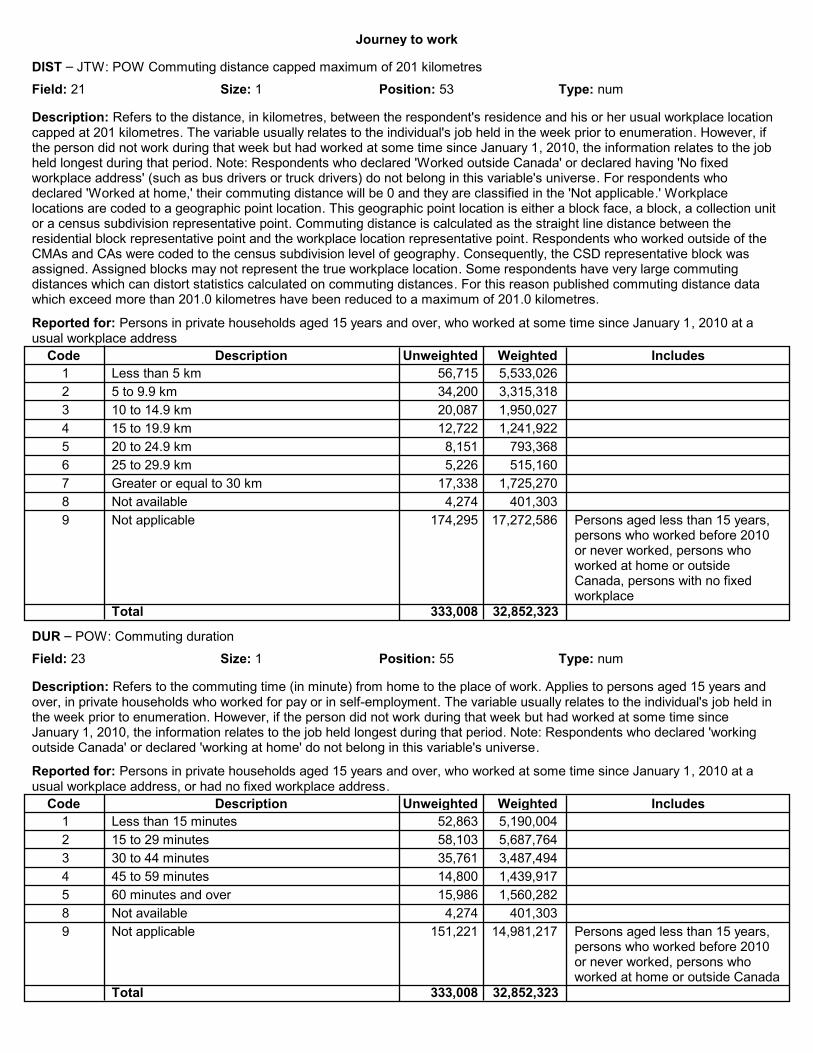
Journey to work
DIST – JTW: POW Commuting distance capped maximum of 201 kilometres
Field: 21 Position: 53Size: 1 Type: num
Description: Refers to the distance, in kilometres, between the respondent's residence and his or her usual workplace location capped at 201 kilometres. The variable usually relates to the individual's job held in the week prior to enumeration. However, if the person did not work during that week but had worked at some time since January 1, 2010, the information relates to the job held longest during that period. Note: Respondents who declared 'Worked outside Canada' or declared having 'No fixed workplace address' (such as bus drivers or truck drivers) do not belong in this variable's universe. For respondents who declared 'Worked at home,' their commuting distance will be 0 and they are classified in the 'Not applicable.' Workplace locations are coded to a geographic point location. This geographic point location is either a block face, a block, a collection unit or a census subdivision representative point. Commuting distance is calculated as the straight line distance between the residential block representative point and the workplace location representative point. Respondents who worked outside of the CMAs and CAs were coded to the census subdivision level of geography. Consequently, the CSD representative block was assigned. Assigned blocks may not represent the true workplace location. Some respondents have very large commuting distances which can distort statistics calculated on commuting distances. For this reason published commuting distance data which exceed more than 201.0 kilometres have been reduced to a maximum of 201.0 kilometres.
Reported for: Persons in private households aged 15 years and over, who worked at some time since January 1, 2010 at a usual workplace address
Description WeightedCode IncludesUnweighted
1 Less than 5 km 5,533,026 56,715
2 5 to 9.9 km 3,315,318 34,200
3 10 to 14.9 km 1,950,027 20,087
4 15 to 19.9 km 1,241,922 12,722
5 20 to 24.9 km 793,368 8,151
6 25 to 29.9 km 515,160 5,226
7 Greater or equal to 30 km 1,725,270 17,338
8 Not available 401,303 4,274
9 Not applicable 17,272,586 174,295 Persons aged less than 15 years, persons who worked before 2010 or never worked, persons who worked at home or outside Canada, persons with no fixed workplace
Total 333,008 32,852,323
DUR – POW: Commuting duration
Field: 23 Position: 55Size: 1 Type: num
Description: Refers to the commuting time (in minute) from home to the place of work. Applies to persons aged 15 years and over, in private households who worked for pay or in self-employment. The variable usually relates to the individual's job held in the week prior to enumeration. However, if the person did not work during that week but had worked at some time since January 1, 2010, the information relates to the job held longest during that period. Note: Respondents who declared 'working outside Canada' or declared 'working at home' do not belong in this variable's universe.
Reported for: Persons in private households aged 15 years and over, who worked at some time since January 1, 2010 at a usual workplace address, or had no fixed workplace address.
Description WeightedCode IncludesUnweighted
1 Less than 15 minutes 5,190,004 52,863
2 15 to 29 minutes 5,687,764 58,103
3 30 to 44 minutes 3,487,494 35,761
4 45 to 59 minutes 1,439,917 14,800
5 60 minutes and over 1,560,282 15,986
8 Not available 401,303 4,274
9 Not applicable 14,981,217 151,221 Persons aged less than 15 years, persons who worked before 2010 or never worked, persons who worked at home or outside Canada
Total 333,008 32,852,323

Journey to work
LEAVE – POW: Departure time in hours and minutes
Field: 47 Position: 109Size: 1 Type: num
Description: Refers to the time at which a respondent usually leave to go to work in hours and minutes. Applies to persons aged 15 years and over, in private households who worked for pay or in self-employment. The variable usually relates to the individual's job held in the week prior to enumeration. However, if the person did not work during that week but had worked at some time since January 1, 2010, the information relates to the job held longest during that period. Note: Respondents who declared 'working outside Canada' or declared 'working at home' do not belong in this variable's universe.
Reported for: Persons in private households aged 15 years and over, who worked at some time since January 1, 2010 at a usual workplace address, or had no fixed workplace address.
Description WeightedCode IncludesUnweighted
1 Between 5:00 a.m. and 5:59 a.m. 1,087,962 10,834
2 Between 6:00 a.m. and 6:59 a.m. 3,098,840 31,391
3 Between 7:00 a.m. and 7:59 a.m. 4,949,258 50,833
4 Between 8:00 a.m. and 8:59 a.m. 3,803,567 39,171
5 Between 9:00 a.m. and 3:59 p.m. 2,821,105 28,989
6 Between 4:00 p.m. and 4:59 a.m. 1,604,729 16,295
8 Not available 401,303 4,274
9 Not applicable 14,981,217 151,221 Persons aged less than 15 years, persons who worked before 2010 or never worked, persons who worked at home or outside Canada
Total 333,008 32,852,323
MODE – JTW: Mode of transportation to work
Field: 67 Position: 131Size: 1 Type: num
Description: Refers to the mode of transportation to go to work. The variable usually relates to the individual's job held in the week prior to enumeration. However, if the person did not work during that week but had worked at some time since January 1, 2010, the information relates to the job held longest during that period. Note: Respondents who declared 'Worked outside Canada' or declared 'Worked at home' do not belong in this variable's universe. Persons who indicated in the place of work question that they either had no fixed workplace address, or specified a usual place of work address, were asked to identify the mode of transportation they most frequently used to commute between home and work. Persons who use more than one mode of transportation were asked to identify the single mode they used for most of the travel distance. As a result, the question provides data on the primary mode of transportation to work. It does not measure multiple modes of transportation, nor does it measure seasonal variation in mode of transportation or trips made for purposes other than the commute between home and work.
Reported for: Persons in private households aged 15 years and over, who worked at some time since January 1, 2010 at a usual workplace address, or had no fixed workplace address.
Description WeightedCode IncludesUnweighted
1 Bicycle 244,709 2,481
2 Car, truck, van as driver 12,587,564 128,277
3 Motorcycle 28,077 292
4 Other mode 214,170 2,201
5 Car, truck, van as passenger 1,101,748 11,379
6 Public transit 2,154,108 22,385
7 Walked 1,035,084 10,498
8 Not available 401,303 4,274
9 Not applicable 14,981,217 151,221 Persons aged less than 15 years, persons who worked before 2010 or never worked, persons who worked at home or outside Canada
Total 333,008 32,852,323
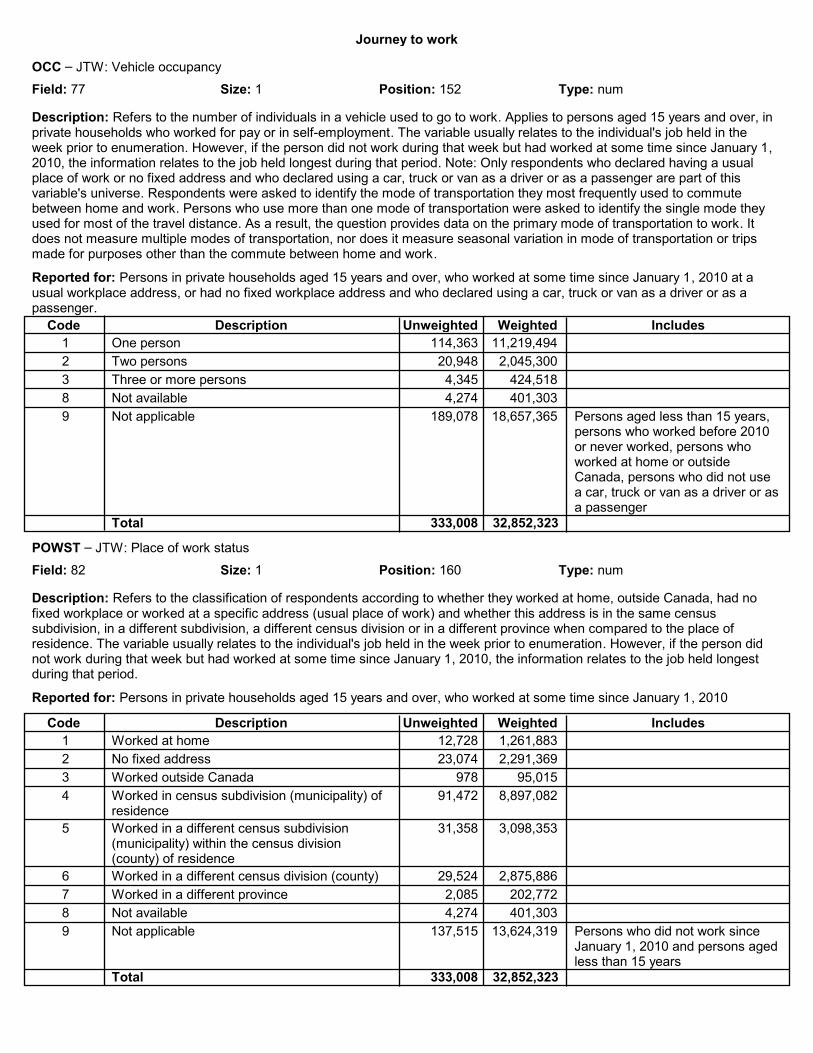
Journey to work
OCC – JTW: Vehicle occupancy
Field: 77 Position: 152Size: 1 Type: num
Description: Refers to the number of individuals in a vehicle used to go to work. Applies to persons aged 15 years and over, in private households who worked for pay or in self-employment. The variable usually relates to the individual's job held in the week prior to enumeration. However, if the person did not work during that week but had worked at some time since January 1, 2010, the information relates to the job held longest during that period. Note: Only respondents who declared having a usual place of work or no fixed address and who declared using a car, truck or van as a driver or as a passenger are part of this variable's universe. Respondents were asked to identify the mode of transportation they most frequently used to commute between home and work. Persons who use more than one mode of transportation were asked to identify the single mode they used for most of the travel distance. As a result, the question provides data on the primary mode of transportation to work. It does not measure multiple modes of transportation, nor does it measure seasonal variation in mode of transportation or trips made for purposes other than the commute between home and work.
Reported for: Persons in private households aged 15 years and over, who worked at some time since January 1, 2010 at a usual workplace address, or had no fixed workplace address and who declared using a car, truck or van as a driver or as a passenger.
Description WeightedCode IncludesUnweighted
1 One person 11,219,494 114,363
2 Two persons 2,045,300 20,948
3 Three or more persons 424,518 4,345
8 Not available 401,303 4,274
9 Not applicable 18,657,365 189,078 Persons aged less than 15 years, persons who worked before 2010 or never worked, persons who worked at home or outside Canada, persons who did not use a car, truck or van as a driver or as a passenger
Total 333,008 32,852,323
POWST – JTW: Place of work status
Field: 82 Position: 160Size: 1 Type: num
Description: Refers to the classification of respondents according to whether they worked at home, outside Canada, had no fixed workplace or worked at a specific address (usual place of work) and whether this address is in the same census subdivision, in a different subdivision, a different census division or in a different province when compared to the place of residence. The variable usually relates to the individual's job held in the week prior to enumeration. However, if the person did not work during that week but had worked at some time since January 1, 2010, the information relates to the job held longest during that period.
Reported for: Persons in private households aged 15 years and over, who worked at some time since January 1, 2010
Description WeightedCode IncludesUnweighted
1 Worked at home 1,261,883 12,728
2 No fixed address 2,291,369 23,074
3 Worked outside Canada 95,015 978
4 Worked in census subdivision (municipality) of residence
8,897,082 91,472
5 Worked in a different census subdivision (municipality) within the census division (county) of residence
3,098,353 31,358
6 Worked in a different census division (county) 2,875,886 29,524
7 Worked in a different province 202,772 2,085
8 Not available 401,303 4,274
9 Not applicable 13,624,319 137,515 Persons who did not work since January 1, 2010 and persons aged less than 15 years
Total 333,008 32,852,323

Journey to work
PWPR – JTW: Place of work province
Field: 88 Position: 169-170Size: 2 Type: num
Description: Refers to the Place of work province. The variable usually relates to the individual's job held in the week prior to enumeration. However, if the person did not work during that week but had worked at some time since January 1, 2010, the information relates to the job held longest during that period. For respondents who declared 'Worked at home,' their Place of work province corresponds to their Place of residence province.
Reported for: Persons in private households aged 15 years and over, who worked at some time since January 1, 2010 at a usual workplace address or at home
Description WeightedCode IncludesUnweighted
10 Newfoundland and Labrador 223,905 2,215
11 Prince Edward Island 66,732 652
12 Nova Scotia 437,371 4,361
13 New Brunswick 361,980 3,588
24 Quebec 3,854,455 40,025
35 Ontario 6,339,524 64,871
46 Manitoba 584,504 6,025
47 Saskatchewan 493,142 4,909
48 Alberta 1,864,295 18,904
59 British Columbia 2,066,854 21,153
63 Northern Canada 45,436 488
88 Not available 401,213 4,273
99 Not applicable 16,008,572 161,544 Persons aged less than 15 years, persons who worked before 2010 or never worked, persons who worked outside Canada, persons with no fixed workplace
Total 333,008 32,852,323

Labour market activities
COW – Labour: Class of worker (derived)
Field: 20 Position: 52Size: 1 Type: num
Description: Applies to persons aged 15 years and over, in private households, who worked at some point in time since January 1, 2010. Employee: This category includes persons who worked for others in the context of an employer-employee relationship. This includes persons who worked for wages, salaries, commissions, tips, piece-rates, or payments 'in kind' (payments in goods or services rather than money). Self-employed: This category includes persons whose job consisted mainly of operating a business, farm or professional practice, alone or in partnership. This includes: operating a farm, whether the land is rented or owned; working on a freelance or contract basis to do a job (e.g., architects, private duty nurses); operating a direct distributorship selling and delivering products such as cosmetics, newspapers, brushes and cleaning products; and fishing with own equipment or with equipment in which the person has a share. The business can be incorporated or unincorporated. Self-employed persons include those with and those without paid help. Unpaid family workers: They are persons who work without pay in a business, farm or professional practice owned and operated by another family member living in the same dwelling.
Reported for: Persons in private households aged 15 years and over, who worked at some time since January 1, 2010
Description WeightedCode IncludesUnweighted
1 Employee 16,955,663 173,445
2 Unpaid family worker 49,571 502
3 Self-employed, without paid help, incorporated 315,212 3,191
4 Self-employed, with paid help, incorporated 419,790 4,278
5 Self-employed, without paid help, unincorporated
902,978 9,122
6 Self-employed, with paid help, unincorporated 322,617 3,284
8 Not available 157,831 1,671
9 Not applicable 13,624,319 137,515 Persons who did not work since January 1, 2010 and persons aged less than 15 years
Total 333,008 32,852,323
FPTWK – Labour: Full-time or part-time weeks worked in 2010
Field: 31 Position: 78Size: 1 Type: num
Description: Applies to persons aged 15 years and over, in private households, who worked for pay or in self-employment in 2010. These persons were asked to report whether the weeks they worked in 2010 were full-time weeks (30 hours or more per week) or not, on the basis of all jobs held. Persons with a part-time job (less than 30 hours per week) for part of the year and a full-time job for another part of the year were to report the information for the job at which they worked the most weeks.
Reported for: Persons in private households aged 15 years and over, who worked for pay or in self-employment in 2010
Description WeightedCode IncludesUnweighted
1 Worked mainly full-time weeks in 2010 14,434,587 147,140
2 Worked mainly part-time weeks in 2010 4,086,134 42,131
9 Not applicable 14,227,259 143,737 Persons aged less than 15 years, persons who did not work for pay or in self-employment in 2010
Total 333,008 32,852,323

Labour market activities
HRSWRK – Labour: Hours worked for pay or in self-employment
Field: 43 Position: 99-100Size: 2 Type: num
Description: Refers to the actual number of hours that persons aged 15 years and over, in private households, worked for pay or in self-employment at all jobs held in the week of Sunday, May 1 to Saturday, May 7, 2011. This includes hours worked for wages, salaries, tips, commissions, piece-rate payments or payments 'in kind' (payments in goods or services rather than money). Hours worked in one's own business, farm or professional practice or hours worked without pay in a family business, farm or professional practice, owned or operated by a relative living in the same household are also included. Excluded are hours during which the respondent was absent, with or without pay, for part of the week because of illness, vacation or other reasons.
Reported for: Persons in private households aged 15 years and over
Description WeightedCode IncludesUnweighted
0 No hours of work 11,422,849 114,843
1 1 to 9 hours of work 510,140 5,341
2 10 to 19 hours of work 957,842 9,944
3 20 to 29 hours of work 1,350,119 13,837
4 30 to 37 hours of work 2,850,800 29,420
5 38 to 40 hours of work 7,004,882 71,132
6 41 to 49 hours of work 1,175,975 12,007
7 50 to 59 hours of work 1,053,650 10,712
8 60 to 69 hours of work 519,043 5,264
9 70 to 79 hours of work 185,101 1,837
10 80 hours or more of work 206,651 2,037
99 Not applicable 5,510,929 56,634 Persons aged less than 15 yearsTotal 333,008 32,852,323
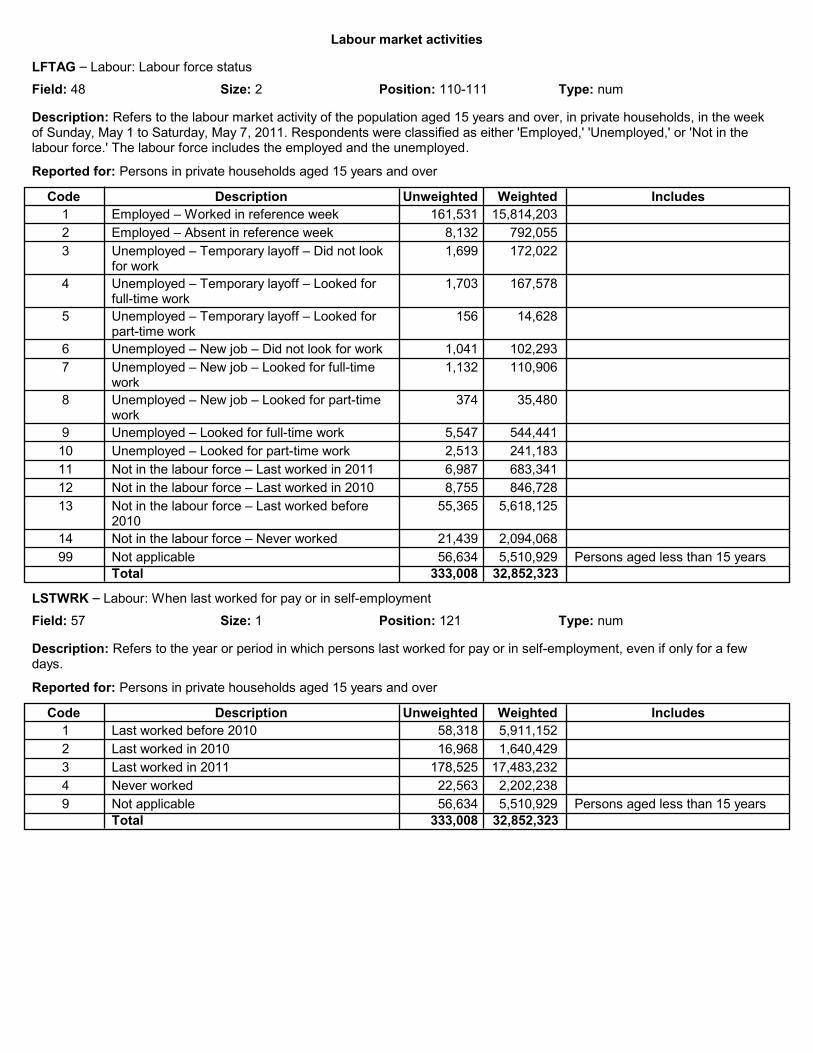
Labour market activities
LFTAG – Labour: Labour force status
Field: 48 Position: 110-111Size: 2 Type: num
Description: Refers to the labour market activity of the population aged 15 years and over, in private households, in the week of Sunday, May 1 to Saturday, May 7, 2011. Respondents were classified as either 'Employed,' 'Unemployed,' or 'Not in the labour force.' The labour force includes the employed and the unemployed.
Reported for: Persons in private households aged 15 years and over
Description WeightedCode IncludesUnweighted
1 Employed – Worked in reference week 15,814,203 161,531
2 Employed – Absent in reference week 792,055 8,132
3 Unemployed – Temporary layoff – Did not look for work
172,022 1,699
4 Unemployed – Temporary layoff – Looked for full-time work
167,578 1,703
5 Unemployed – Temporary layoff – Looked for part-time work
14,628 156
6 Unemployed – New job – Did not look for work 102,293 1,041
7 Unemployed – New job – Looked for full-time work
110,906 1,132
8 Unemployed – New job – Looked for part-time work
35,480 374
9 Unemployed – Looked for full-time work 544,441 5,547
10 Unemployed – Looked for part-time work 241,183 2,513
11 Not in the labour force – Last worked in 2011 683,341 6,987
12 Not in the labour force – Last worked in 2010 846,728 8,755
13 Not in the labour force – Last worked before 2010
5,618,125 55,365
14 Not in the labour force – Never worked 2,094,068 21,439
99 Not applicable 5,510,929 56,634 Persons aged less than 15 yearsTotal 333,008 32,852,323
LSTWRK – Labour: When last worked for pay or in self-employment
Field: 57 Position: 121Size: 1 Type: num
Description: Refers to the year or period in which persons last worked for pay or in self-employment, even if only for a few days.
Reported for: Persons in private households aged 15 years and over
Description WeightedCode IncludesUnweighted
1 Last worked before 2010 5,911,152 58,318
2 Last worked in 2010 1,640,429 16,968
3 Last worked in 2011 17,483,232 178,525
4 Never worked 2,202,238 22,563
9 Not applicable 5,510,929 56,634 Persons aged less than 15 yearsTotal 333,008 32,852,323

Labour market activities
NAICS – Labour: Industry sectors (based on the NAICS 2007)
Field: 72 Position: 143-144Size: 2 Type: num
Description: Refers to the general nature of the business carried out in the establishment where the person worked. If the person did not have a job during the week of Sunday, May 1 to Saturday, May 7, 2011, the data relate to the job of longest duration since January 1, 2010. Persons with two or more jobs were required to report the information for the job at which they worked the most hours. The 2011 National Household Survey industry data are produced according to the NAICS 2007. The NAICS provides enhanced industry comparability among the three North American Free Trade Agreement (NAFTA) trading partners (Canada, United States and Mexico). This classification consists of a systematic and comprehensive arrangement of industries structured into 20 sectors, 102 subsectors and 324 industry groups. The criteria used to create these categories are similarity of input structures, labour skills or production processes used by the establishment.
Reported for: Persons in private households aged 15 years and over, who worked at some time since January 1, 2010
Description WeightedCode IncludesUnweighted
1 Agriculture and other resource-based industries 841,418 8,397
2 Construction industries 1,232,585 12,216
3 Manufacturing industries 1,626,022 16,526
4 Wholesale trade 731,891 7,486
5 Retail trade 2,103,333 21,477
6 Finance and real estate 1,087,998 11,206
7 Health care and social services 1,983,392 20,251
8 Educational services 1,366,853 14,248
9 Business services 3,375,048 34,555
10 Public Administration 1,277,494 13,243
11 Other services 2,443,240 24,698
88 Not available 1,054,387 11,190
99 Not applicable 13,624,319 137,515 Persons who did not work since January 1, 2010 and persons aged less than 15 years
Total 333,008 32,852,323

Labour market activities
NOCEE – Labour: Occupation (based on the NOC 2011)
Field: 73 Position: 145-146Size: 2 Type: num
Description: Applies to persons aged 15 years and over, in private households, who worked since January 1, 2010. Refers to the kind of work persons were doing, as determined by their kind of work and the description of the main activities in their job. If the person did not have a job during the week of Sunday, May 1 to Saturday, May 7, 2011, the data relate to the job of longest duration since January 1, 2010. Persons with two or more jobs were to report the information for the job at which they worked the most hours. The National Occupational Classification (NOC) 2011 is composed of four levels of aggregation. There are 10 broad occupational categories containing 40 major groups that are further subdivided into 140 minor groups. At the most detailed level, there are 500 occupation unit groups. Occupation unit groups are formed on the basis of the education, training, or skill level required to enter the job, as well as the kind of work performed, as determined by the tasks, duties and responsibilities of the occupation. Here, the occupational unit groups are aggregated in 12 groups based on the need of the Employment Equity program.
Reported for: Persons in private households aged 15 years and over, who worked at some time since January 1, 2010
Description WeightedCode IncludesUnweighted
1 Managers 1,988,145 20,244
2 Professionals 3,225,402 33,626
3 Semi-professionals and technicians 1,812,798 18,736
4 Supervisors 511,818 5,144
5 Administrative and senior clerical personnel 1,156,625 11,930
6 Skilled sales and service personnel 757,191 7,663
7 Skilled crafts and trades workers 1,420,468 14,230
8 Clerical personnel 1,209,470 12,407
9 Intermediate sales and service personnel 2,399,065 24,379
10 Semi-skilled manual workers 1,550,269 15,478
11 Other sales and service personnel 1,633,415 16,596
12 Other manual workers 606,022 5,996
88 Not available 852,975 9,064
99 Not applicable 13,624,319 137,515 Persons who did not work since January 1, 2010 and persons aged less than 15 years
Total 333,008 32,852,323
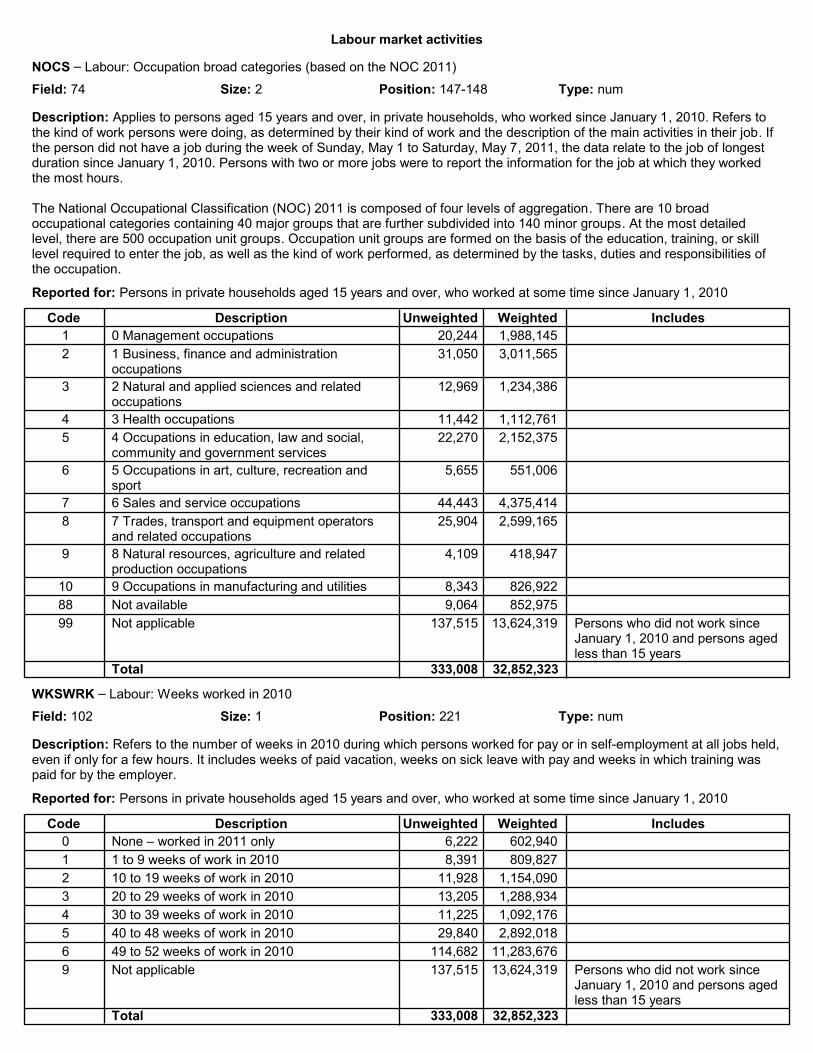
Labour market activities
NOCS – Labour: Occupation broad categories (based on the NOC 2011)
Field: 74 Position: 147-148Size: 2 Type: num
Description: Applies to persons aged 15 years and over, in private households, who worked since January 1, 2010. Refers to the kind of work persons were doing, as determined by their kind of work and the description of the main activities in their job. If the person did not have a job during the week of Sunday, May 1 to Saturday, May 7, 2011, the data relate to the job of longest duration since January 1, 2010. Persons with two or more jobs were to report the information for the job at which they worked the most hours.
The National Occupational Classification (NOC) 2011 is composed of four levels of aggregation. There are 10 broad occupational categories containing 40 major groups that are further subdivided into 140 minor groups. At the most detailed level, there are 500 occupation unit groups. Occupation unit groups are formed on the basis of the education, training, or skill level required to enter the job, as well as the kind of work performed, as determined by the tasks, duties and responsibilities of the occupation.
Reported for: Persons in private households aged 15 years and over, who worked at some time since January 1, 2010
Description WeightedCode IncludesUnweighted
1 0 Management occupations 1,988,145 20,244
2 1 Business, finance and administration occupations
3,011,565 31,050
3 2 Natural and applied sciences and related occupations
1,234,386 12,969
4 3 Health occupations 1,112,761 11,442
5 4 Occupations in education, law and social, community and government services
2,152,375 22,270
6 5 Occupations in art, culture, recreation and sport
551,006 5,655
7 6 Sales and service occupations 4,375,414 44,443
8 7 Trades, transport and equipment operators and related occupations
2,599,165 25,904
9 8 Natural resources, agriculture and related production occupations
418,947 4,109
10 9 Occupations in manufacturing and utilities 826,922 8,343
88 Not available 852,975 9,064
99 Not applicable 13,624,319 137,515 Persons who did not work since January 1, 2010 and persons aged less than 15 years
Total 333,008 32,852,323
WKSWRK – Labour: Weeks worked in 2010
Field: 102 Position: 221Size: 1 Type: num
Description: Refers to the number of weeks in 2010 during which persons worked for pay or in self-employment at all jobs held, even if only for a few hours. It includes weeks of paid vacation, weeks on sick leave with pay and weeks in which training was paid for by the employer.
Reported for: Persons in private households aged 15 years and over, who worked at some time since January 1, 2010
Description WeightedCode IncludesUnweighted
0 None – worked in 2011 only 602,940 6,222
1 1 to 9 weeks of work in 2010 809,827 8,391
2 10 to 19 weeks of work in 2010 1,154,090 11,928
3 20 to 29 weeks of work in 2010 1,288,934 13,205
4 30 to 39 weeks of work in 2010 1,092,176 11,225
5 40 to 48 weeks of work in 2010 2,892,018 29,840
6 49 to 52 weeks of work in 2010 11,283,676 114,682
9 Not applicable 13,624,319 137,515 Persons who did not work since January 1, 2010 and persons aged less than 15 years
Total 333,008 32,852,323

Labour market activities
WRKACT – Labour: Work activity in 2010
Field: 103 Position: 222-223Size: 2 Type: num
Description: Refers to the number of weeks in which a person worked for pay or in self-employment in 2010 at all jobs held, even if only for a few hours, and whether these weeks were mostly full time (30 hours or more per week) or mostly part time (less than 30 hours per week). The term 'full-year full-time workers' refers to persons aged 15 years and over who worked 49 to 52 weeks mostly full time in 2010 for pay or in self-employment.
Reported for: Persons in private households aged 15 years and over, who worked at some time since January 1, 2010
Description WeightedCode IncludesUnweighted
1 Worked before 2010 or never worked 8,113,390 80,881
2 Didn't work in 2010, worked in 2011 602,940 6,222
3 Worked 1 to 13 weeks full time 586,748 6,028
4 Worked 1 to 13 weeks part time 787,934 8,198
5 Worked 14 to 26 weeks full time 960,445 9,783
6 Worked 14 to 26 weeks part time 765,793 7,939
7 Worked 27 to 39 weeks full time 791,902 8,103
8 Worked 27 to 39 weeks part time 452,205 4,698
9 Worked 40 to 48 weeks full time 2,232,262 22,994
10 Worked 40 to 48 weeks part time 659,756 6,846
11 Worked 49 to 52 weeks full time 9,863,230 100,232
12 Worked 49 to 52 weeks part time 1,420,446 14,450
99 Not applicable 5,510,929 56,634 Persons aged less than 15 yearsTotal 333,008 32,852,323

Income
EFDECILE – Income: Income decile group
Field: 25 Position: 57-58Size: 2 Type: num
Description: The income decile group provides a rough ranking of the economic situation of a person based on his or her relative position in the economic families adjusted after-tax income distribution. The population in private households is sorted according to its adjusted after-tax family income and then divided into 10 equal groups each containing 10% of the population. Code 1 is the lowest income decile and 10 is the highest.
Reported for: Persons in economic families and persons not in economic families in private households
Description WeightedCode IncludesUnweighted
1 Lowest decile 3,203,391 31,988
2 Second decile 3,204,138 31,667
3 Third decile 3,229,165 32,189
4 Fourth decile 3,276,200 32,988
5 Fifth decile 3,215,751 32,636
6 Sixth decile 3,265,120 33,325
7 Seventh decile 3,290,283 33,569
8 Eighth decile 3,236,882 33,334
9 Ninth decile 3,252,307 33,750
10 Highest decile 3,276,729 34,398
88 Not available 298,015 3,164Total 333,008 32,852,323
EFDIMBM – Income: Disposable income for MBM for all persons
Field: 26 Position: 59-64Size: 6 Type: num
Description: Disposable income for the market basket measure (MBM) was created by Human Resources and Skills Development Canada (HRSDC), now known as Employment and Social Development Canada (ESDC), to approximate the disposable income available to an economic family or person not in an economic family to purchase the elements in HRSDC's MBM at the time. It is the amount of income remaining after deducting from economic family total income, the sum of income tax paid and non-discretionary spending for the MBM for all members and, for units in households that own the dwelling without a mortgage, adding the mortgage-free homeowner's advantage (an amount to represent typical savings compared to rent or ownership with a mortgage).
Reported for: Persons in economic families and persons not in economic families in private households
The value 888,888 stands for not available. Otherwise, this variable could be positive, negative or zero and is a rounded value. Values that would have been rounded to zero have been replaced by 1 or -1. In some cases, high values have been top-coded and low values have been bottom coded in this file.
EMPIN – Income: Employment income
Field: 27 Position: 65-71Size: 7 Type: num
Description: Refers to total income received by persons aged 15 years and over during 2010 as wages and salaries, net income from unincorporated non-farm business and/or professional practice and net farm self-employment income.
Reported for: Persons in private households aged 15 years and over
The value 8,888,888 stands for not available. The value 9,999,999 stands for not applicable and is applied to all persons aged less than 15 years. Otherwise, this variable could be positive, negative or zero and is a rounded value of the amount received by the individual in 2010. Values that would have been rounded to zero have been replaced by 1 or -1. In some cases, high values have been top-coded and low values have been bottom coded in this file.

Income
GTRFS – Income: Total government transfer payments
Field: 34 Position: 84-88Size: 5 Type: num
Description: Refers to the total income from all transfer payments received by an individual 15 years of age and over from federal, provincial, territorial or municipal governments in calendar year 2010. This variable is derived by summing the amounts for the following sources: – Old Age Security pensions and Guaranteed Income Supplements; – Canada or Quebec Pension Plan benefits; – employment insurance benefits; – child benefits; – other income from government sources.
Reported for: Persons in private households aged 15 years and over
The value 88,888 stands for not available. The value 99,999 stands for not applicable and is applied to all persons aged less than 15 years. Otherwise, this variable could be positive or zero and is a rounded value of the amount received by the individual in 2010. Values that would have been rounded to zero have been replaced by 1.
INCTAX – Income: Income tax paid
Field: 45 Position: 102-107Size: 6 Type: num
Description: Refers to all federal, provincial and territorial taxes paid on 2010 income. Federal, provincial and territorial taxes paid refer to taxes on income, after taking into account exemptions, deductions, non-refundable tax credits and the Quebec abatement. These data are obtained from the income tax files for persons who allowed access to their income tax data.
Reported for: Persons in private households aged 15 years and over
The value 888,888 stands for not available. The value 999,999 stands for not applicable and is applied to all persons aged less than 15 years. Otherwise, this variable could be positive or zero and is a rounded value of the amount paid by the individual in 2010. Values that would have been rounded to zero have been replaced by 1. In some cases, high values have been top-coded in this file.
LOLICOA – Income: Low income status based on LICO-AT
Field: 51 Position: 115Size: 1 Type: num
Description: The code values for this variable indicate the position of each member of an economic family and each person not in an economic family in relation to Statistics Canada's low income cut-offs (LICO-AT). This variable is suitable to obtain a count of persons or to classify the population. The prevalence of low income is usually expressed as the percentage of the applicable population in private households that are below the low income cut-offs.
Reported for: Persons in economic families and persons not in economic families aged 15 years and over in private households, excluding persons living in the Yukon, Northwest Territories and Nunavut
Description WeightedCode IncludesUnweighted
1 Member of a non-low income economic family or non-low income person aged 15 years and over not in an economic family
28,757,432 292,823
2 Member of a low income economic family or low income person aged 15 years and over not in an economic family
3,612,143 36,161
8 Not available 274,290 2,901
9 Not applicable 104,115 1,123 Persons living in the Yukon, Northwest Territories and Nunavut
Total 333,008 32,852,323

Income
LOLICOB – Income: Low income status based on LICO-BT
Field: 52 Position: 116Size: 1 Type: num
Description: The code values for this variable indicate the position of each member of an economic family and each person not in an economic family in relation to Statistics Canada's before-tax low income cut-offs (LICO-BT). This variable is suitable to obtain a count of persons or to classify the population. The prevalence of low income is usually expressed as the percentage of the applicable population in private households that are below the low income cut-offs.
Reported for: Persons in economic families and persons not in economic families aged 15 years and over in private households, excluding persons living in the Yukon, Northwest Territories and Nunavut
Description WeightedCode IncludesUnweighted
1 Member of a non-low income economic family or non-low income person aged 15 years and over not in an economic family
27,527,224 280,695
2 Member of a low income economic family or low income person aged 15 years and over not in an economic family
4,842,351 48,289
8 Not available 274,290 2,901
9 Concept not applicable 104,115 1,123 Persons living in the Yukon, Northwest Territories and Nunavut
Total 333,008 32,852,323
LOLIMA – Income: Low income status based on LIM-AT
Field: 53 Position: 117Size: 1 Type: num
Description: The code values for this variable indicate the position of each member of a household in relation to Statistics Canada's after-tax low-income measure (LIM-AT). This variable is suitable to obtain a count of persons or to classify the population. The prevalence of low income is usually expressed as the percentage of the applicable population in private households that are below the low-income line.
Reported for: Persons in private households, excluding persons living in the Yukon, Northwest Territories and Nunavut
Description WeightedCode IncludesUnweighted
1 Member of a non-low income household 27,505,737 280,713
2 Member of a low income household 4,863,838 48,271
8 Not available 274,290 2,901
9 Not applicable 104,115 1,123 Persons living in the Yukon, Northwest Territories and Nunavut
Total 333,008 32,852,323
LOLIMB – Income: Low income status based on LIM-BT
Field: 54 Position: 118Size: 1 Type: num
Description: The code values for this variable indicate the position of each member of a household in relation to Statistics Canada's before-tax low-income measure (LIM-BT). This variable is suitable to obtain a count of persons or to classify the population. The prevalence of low income is usually expressed as the percentage of the applicable population in private households that are below the low-income line.
Reported for: Persons in private households, excluding persons living in the Yukon, Northwest Territories and Nunavut
Description WeightedCode IncludesUnweighted
1 Member of a non-low income household 26,406,742 269,871
2 Member of a low income household 5,962,833 59,113
8 Not available 274,290 2,901
9 Concept not applicable 104,115 1,123 Persons living in the Yukon, Northwest Territories and Nunavut
Total 333,008 32,852,323

Income
LOLIMMI – Income: Low income status based on LIM-MI
Field: 55 Position: 119Size: 1 Type: num
Description: The code values for this variable indicate the position of each member of a household in relation to Statistics Canada's market income low-income measure (LIM-MI). This variable is suitable to obtain a count of persons or to classify the population. The prevalence of low income is usually expressed as the percentage of the applicable population in private households that are below the low-income line.
Reported for: Persons in private households, excluding persons living in the Yukon, Northwest Territories and Nunavut
Description WeightedCode IncludesUnweighted
1 Member of a non-low income household 23,761,500 243,892
2 Member of a low income household 8,608,075 85,092
8 Not available 274,290 2,901
9 Concept not applicable 104,115 1,123 Persons living in the Yukon, Northwest Territories and Nunavut
Total 333,008 32,852,323
LOMBM – Income: Low income status based on MBM
Field: 56 Position: 120Size: 1 Type: num
Description: The code values for this variable indicate the position of each member of an economic family and each person not in an economic family in relation to HRSDC's market basket measure low-income line (MBM). This variable is suitable to obtain a count of persons or to classify the population. The prevalence of low income is usually expressed as the percentage of the applicable population in private households that are below the low income line.
Reported for: Persons in economic families and persons not in economic families in private households, excluding persons living in the Yukon, Northwest Territories and Nunavut
Description WeightedCode IncludesUnweighted
1 Member of a non-low income economic family or non-low income person aged 15 years and over not in an economic family
28,027,302 285,632
2 Member of a low income economic family or low income person aged 15 years and over not in an economic family
4,342,273 43,352
8 Not available 274,290 2,901
9 Concept not applicable 104,115 1,123 Persons living in the Yukon, Northwest Territories and Nunavut
Total 333,008 32,852,323
MRKINC – Income: Market income
Field: 68 Position: 132-138Size: 7 Type: num
Description: Refers to the sum of employment income (wages and salaries, net farm income and net income from a non-farm unincorporated business and/or professional practice), investment income, retirement pensions, superannuation and annuities (including those from Registered Retirement Savings Plans [RRSPs] and Registered Retirement Income Funds [RRIFs]) and other money income. It is equivalent to total income minus all government transfer payments, and is also referred to as income before transfers and taxes. This variable does not include net capital gains or losses.
Reported for: Persons in private households aged 15 years and over
The value 8,888,888 stands for not available. The value 9,999,999 stands for not applicable and is applied to all persons aged less than 15 years. Otherwise, this variable could be positive, negative or zero and is a rounded value of the amount received by the individual in 2010. Values that would have been rounded to zero have been replaced by 1 or -1. In some cases, high values have been top-coded and low values have been bottom coded in this file.
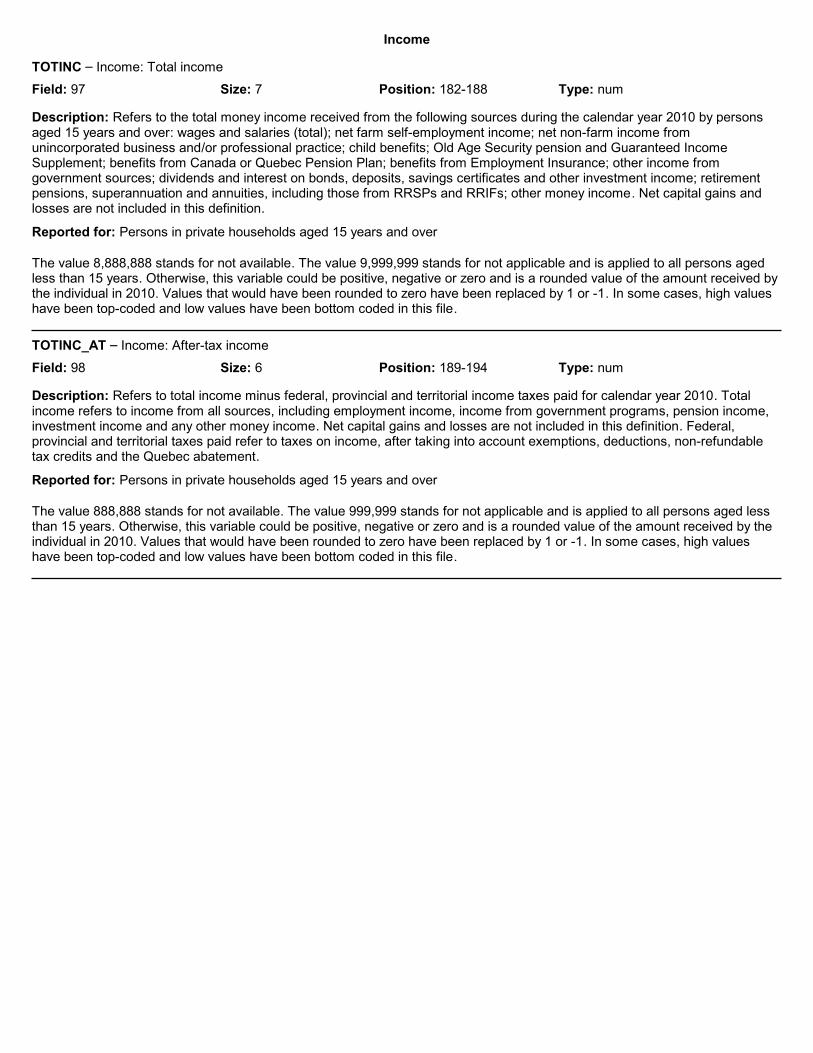
Income
TOTINC – Income: Total income
Field: 97 Position: 182-188Size: 7 Type: num
Description: Refers to the total money income received from the following sources during the calendar year 2010 by persons aged 15 years and over: wages and salaries (total); net farm self-employment income; net non-farm income from unincorporated business and/or professional practice; child benefits; Old Age Security pension and Guaranteed Income Supplement; benefits from Canada or Quebec Pension Plan; benefits from Employment Insurance; other income from government sources; dividends and interest on bonds, deposits, savings certificates and other investment income; retirement pensions, superannuation and annuities, including those from RRSPs and RRIFs; other money income. Net capital gains and losses are not included in this definition.
Reported for: Persons in private households aged 15 years and over
The value 8,888,888 stands for not available. The value 9,999,999 stands for not applicable and is applied to all persons aged less than 15 years. Otherwise, this variable could be positive, negative or zero and is a rounded value of the amount received by the individual in 2010. Values that would have been rounded to zero have been replaced by 1 or -1. In some cases, high values have been top-coded and low values have been bottom coded in this file.
TOTINC_AT – Income: After-tax income
Field: 98 Position: 189-194Size: 6 Type: num
Description: Refers to total income minus federal, provincial and territorial income taxes paid for calendar year 2010. Total income refers to income from all sources, including employment income, income from government programs, pension income, investment income and any other money income. Net capital gains and losses are not included in this definition. Federal, provincial and territorial taxes paid refer to taxes on income, after taking into account exemptions, deductions, non-refundable tax credits and the Quebec abatement.
Reported for: Persons in private households aged 15 years and over
The value 888,888 stands for not available. The value 999,999 stands for not applicable and is applied to all persons aged less than 15 years. Otherwise, this variable could be positive, negative or zero and is a rounded value of the amount received by the individual in 2010. Values that would have been rounded to zero have been replaced by 1 or -1. In some cases, high values have been top-coded and low values have been bottom coded in this file.
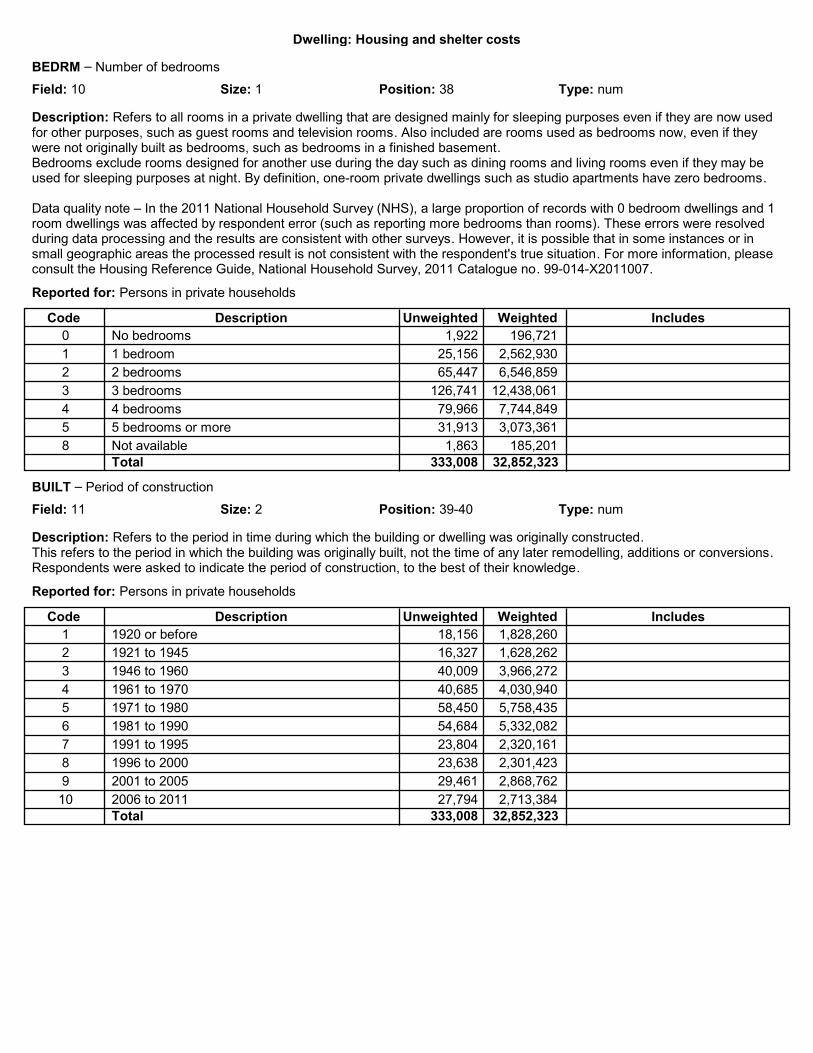
Dwelling: Housing and shelter costs
BEDRM – Number of bedrooms
Field: 10 Position: 38Size: 1 Type: num
Description: Refers to all rooms in a private dwelling that are designed mainly for sleeping purposes even if they are now used for other purposes, such as guest rooms and television rooms. Also included are rooms used as bedrooms now, even if they were not originally built as bedrooms, such as bedrooms in a finished basement.Bedrooms exclude rooms designed for another use during the day such as dining rooms and living rooms even if they may be used for sleeping purposes at night. By definition, one-room private dwellings such as studio apartments have zero bedrooms. Data quality note – In the 2011 National Household Survey (NHS), a large proportion of records with 0 bedroom dwellings and 1 room dwellings was affected by respondent error (such as reporting more bedrooms than rooms). These errors were resolved during data processing and the results are consistent with other surveys. However, it is possible that in some instances or in small geographic areas the processed result is not consistent with the respondent's true situation. For more information, please consult the Housing Reference Guide, National Household Survey, 2011 Catalogue no. 99-014-X2011007.
Reported for: Persons in private households
Description WeightedCode IncludesUnweighted
0 No bedrooms 196,721 1,922
1 1 bedroom 2,562,930 25,156
2 2 bedrooms 6,546,859 65,447
3 3 bedrooms 12,438,061 126,741
4 4 bedrooms 7,744,849 79,966
5 5 bedrooms or more 3,073,361 31,913
8 Not available 185,201 1,863Total 333,008 32,852,323
BUILT – Period of construction
Field: 11 Position: 39-40Size: 2 Type: num
Description: Refers to the period in time during which the building or dwelling was originally constructed. This refers to the period in which the building was originally built, not the time of any later remodelling, additions or conversions. Respondents were asked to indicate the period of construction, to the best of their knowledge.
Reported for: Persons in private households
Description WeightedCode IncludesUnweighted
1 1920 or before 1,828,260 18,156
2 1921 to 1945 1,628,262 16,327
3 1946 to 1960 3,966,272 40,009
4 1961 to 1970 4,030,940 40,685
5 1971 to 1980 5,758,435 58,450
6 1981 to 1990 5,332,082 54,684
7 1991 to 1995 2,320,161 23,804
8 1996 to 2000 2,301,423 23,638
9 2001 to 2005 2,868,762 29,461
10 2006 to 2011 2,713,384 27,794Total 333,008 32,852,323

Dwelling: Housing and shelter costs
CONDO – Tenure – Condominium
Field: 19 Position: 51Size: 1 Type: num
Description: Refers to whether or not the private dwelling is part of a condominium development. Dwellings that are in the process of becoming registered condominiums are included as condominiums.A condominium is a residential complex in which dwellings are owned individually while land and common elements are held in joint ownership with others.
Reported for: Persons in private households
Description WeightedCode IncludesUnweighted
0 Not part of a condominium development 29,430,993 299,118
1 Part of a condominium development 3,131,787 32,027
8 Not available 185,201 1,863Total 333,008 32,852,323
DTYPE – Structural type of dwelling
Field: 22 Position: 54Size: 1 Type: num
Description: Refers to the structural characteristics and/or dwelling configuration, that is, whether the dwelling is a detached single house, an apartment in a high-rise building, a row house, a mobile home, etc.
Reported for: Persons in private households
Description WeightedCode IncludesUnweighted
1 Single-detached house 20,250,833 206,852
2 Semi-detached house 1,726,479 17,780
3 Row house 2,039,918 20,872
4 Apartment or flat in a duplex 1,723,729 17,582
5 Apartment in a building that has five or more storeys
2,251,708 22,625
6 Apartment in a building that has fewer than five storeys
4,300,885 42,831
7 Other single-attached house 68,094 695
8 Movable dwelling 386,334 3,771Total 333,008 32,852,323
FCOND – Condominium fees
Field: 29 Position: 74-76Size: 3 Type: num
Description: Refers to monthly payments for maintenance and various condominium services.Although the condominium status question is asked to owner and renter households, the condominium fee question is only asked to owners. Renters of condominiums are not usually responsible for the direct payment of condominium fees.
Reported for: Persons in private households in owner-occupied non-farm dwellings which form part of a condominium development.
The value 888 stands for not available. The value 999 stands for not applicable and is applied to persons in farm dwellings, tenant-occupied dwellings, owner-occupied dwellings not part of a condominium and band dwellings. Otherwise, this variable is always positive and is a rounded value of the monthly payments. In some cases, high values have been top-coded in this file.
GROSRT – Gross rent
Field: 33 Position: 80-83Size: 4 Type: num
Description: Average monthly total of all shelter expenses paid by households that rent their dwelling. Gross rent includes, where applicable, the monthly rent and the costs of electricity, heat, water and other municipal services.
Reported for: Persons in private households in tenant-occupied non-farm dwellings
The value 8,888 stands for not available. The value 9,999 stands for not applicable and is applied to persons in farm dwellings, and owner-occupied dwellings. Otherwise, this variable could be positive or zero and is a rounded amount paid by tenant-occupied households. In some cases, high values have been top-coded in this file.

Dwelling: Housing and shelter costs
NOS – Housing suitability
Field: 76 Position: 151Size: 1 Type: num
Description: Housing suitability refers to whether a private household is living in suitable accommodations according to the National Occupancy Standard (NOS); that is, whether the dwelling has enough bedrooms for the size and composition of the household. A household is deemed to be living in suitable accommodations if its dwelling has enough bedrooms, as calculated using the NOS.
Housing suitability and the National Occupancy Standard (NOS) were developed by Canada Mortgage and Housing Corporation (CMHC) through consultations with provincial housing agencies.
Reported for: Persons in private households
Description WeightedCode IncludesUnweighted
1 Suitable 29,234,447 296,108
2 Not suitable 3,328,333 35,037
8 Not available 185,201 1,863Total 333,008 32,852,323
OMP – Owner's major payment
Field: 78 Position: 153-156Size: 4 Type: num
Description: Refers to the total average monthly payments made by owner households to secure shelter. Owner's major payments include, where applicable, payments for electricity, oil, gas, coal, wood or other fuels, water and other municipal services, monthly mortgage payments, property taxes (municipal and school) and condominium fees.
Reported for: Persons in private households in owner-occupied non-farm dwellings
The value 8,888 stands for not available. The value 9,999 stands for not applicable and is applied to persons in farm dwellings, tenant-occupied dwellings and band housing. Otherwise, this variable could be positive or zero and is a rounded amount paid by owner households. In some cases, high values have been top-coded in this file.
PRESMORTG – Presence of mortgage
Field: 86 Position: 167Size: 1 Type: num
Description: Refers to whether regular monthly mortgage or debt payments for the dwelling are made.
Reported for: Persons in private households in owner-occupied non-farm dwellings
Description WeightedCode IncludesUnweighted
1 Without mortgage 8,398,411 85,602
2 With mortgage 15,489,833 159,244
8 Not available 185,201 1,863
9 Not applicable 8,674,536 86,299 Farm dwellings, tenant-occupied dwellings and band housing
Total 333,008 32,852,323

Dwelling: Housing and shelter costs
REPAIR – Condition of dwelling
Field: 91 Position: 174Size: 1 Type: num
Description: Refers to whether, in the judgement of the respondent, the dwelling is in need of repairs (excluding desirable remodelling or additions). The 'regular maintenance needed' category includes dwellings where only regular maintenance such as painting or furnace cleaning is required.The 'minor repairs needed' category includes dwellings needing only minor repairs such as dwellings with missing or loose floor tiles, bricks or shingles or defective steps, railing or siding.The 'major repairs needed' category includes dwellings needing major repairs such as dwellings with defective plumbing or electrical wiring and dwellings needing structural repairs to walls, floors or ceilings. Data quality note – The 2011 National Household Survey (NHS) estimate for the percentage of dwellings requiring major repair in Nunavut was higher than the comparable rate in the 2009/2010 Nunavut Housing Needs Survey. For provinces, other territories and Canada, the percentage of dwellings requiring major repairs in the NHS was not statistically different when compared to other surveys. For more information, please consult the Housing Reference Guide, National Household Survey, 2011 Catalogue no. 99-014-X2011007.
Reported for: Persons in private households
Description WeightedCode IncludesUnweighted
1 Regular maintenance needed 21,887,456 222,007
2 Minor repairs needed 8,437,566 86,675
3 Major repairs needed 2,422,959 24,326Total 333,008 32,852,323
ROOM – Rooms, number of
Field: 92 Position: 175-176Size: 2 Type: num
Description: Refers to the number of rooms in a private dwelling. A room is an enclosed area within a private dwelling which is finished and suitable for year round living. The number of rooms of a private dwelling includes kitchens, bedrooms and finished rooms in the attic or basement.The number of rooms of a private dwelling excludes bathrooms, halls, vestibules and rooms used solely for business purposes. Partially divided rooms are considered to be separate rooms if they are considered as such by the respondent (e.g., L-shaped dining room and living room arrangements). Data quality note – In the 2011 National Household Survey (NHS), a large proportion of records with 0 bedroom dwellings and 1 room dwellings was affected by respondent error (such as reporting more bedrooms than rooms). These errors were resolved during data processing and the results are consistent with other surveys. However, it is possible that in some instances or in small geographic areas the processed result is not consistent with the respondent's true situation. For more information, please consult the Housing Reference Guide, National Household Survey, 2011 Catalogue no. 99-014-X2011007.
Reported for: Persons in private households
Description WeightedCode IncludesUnweighted
1 One room 164,423 1,614
2 Two rooms 563,784 5,584
3 Three rooms 1,891,766 18,788
4 Four rooms 3,681,253 36,658
5 Five rooms 4,691,324 47,148
6 Six rooms 4,760,379 48,458
7 Seven rooms 4,682,269 47,718
8 Eight rooms 4,413,334 45,275
9 Nine rooms 2,882,667 29,792
10 Ten rooms 2,471,648 25,500
11 Eleven or more rooms 2,359,933 24,610
88 Not available 185,201 1,863Total 333,008 32,852,323

Dwelling: Housing and shelter costs
SUBSIDY – Subsidized housing
Field: 95 Position: 180Size: 1 Type: num
Description: Indicates that the dwelling is subsidized or not. Subsidized housing includes rent geared to income, social housing, public housing, government-assisted housing, non-profit housing, rent supplements and housing allowances.
Reported for: Persons in private households in tenant-occupied non-farm dwellings
Description WeightedCode IncludesUnweighted
1 No, not a subsidized dwelling 7,227,671 72,103 Band housing
2 Yes, a subsidized dwelling 1,059,408 10,400
8 Not available 185,201 1,863
9 Not applicable 24,275,701 248,642 Farm dwellings and owner occupied dwellings
Total 333,008 32,852,323
TENUR – Tenure
Field: 96 Position: 181Size: 1 Type: num
Description: Refers to whether some member of the household owns or rents the dwelling. Data quality note – The 2011 National Household Survey (NHS) estimate for homeownership in Alberta was statistically higher than the comparable rate in the 2010 Survey of Labour Income Dynamics (SLID). The 2011 NHS estimate of the homeownership rate for other provinces and for Canada was not statistically different when compared to the 2010 SLID. For more information, please consult the Housing Reference Guide, National Household Survey, 2011 Catalogue no. 99-014-X2011007.
Reported for: Persons in private households
Description WeightedCode IncludesUnweighted
1 Owned by a member of the household 24,257,308 248,463
2 Rented or band housing 8,305,472 82,682
8 Not available 185,201 1,863Total 333,008 32,852,323
VALUE – Value of dwelling
Field: 99 Position: 195-201Size: 7 Type: num
Description: Refers to the dollar amount expected by the owner if the dwelling were to be sold.'Value of dwelling' refers to the value of the entire dwelling, including the value of the land it is on and of any other structure, such as a garage, which is on the property. If the dwelling is located in a building which contains several dwellings, or a combination of residential and business premises, all of which the household owns, the value is estimated as a portion of the market value that applies only to the dwelling in which the household resides.
Reported for: Persons in private households in owner-occupied non-farm dwellings
The value 8,888,888 stands for not available. The value 9,999,999 stands for not applicable and is applied to persons in farm dwellings, tenant-occupied dwellings and band housing. Otherwise, this variable is always positive and is a rounded value of the amount expected by the owner if the dwelling were to be sold. In some cases, high values have been top-coded in this file.
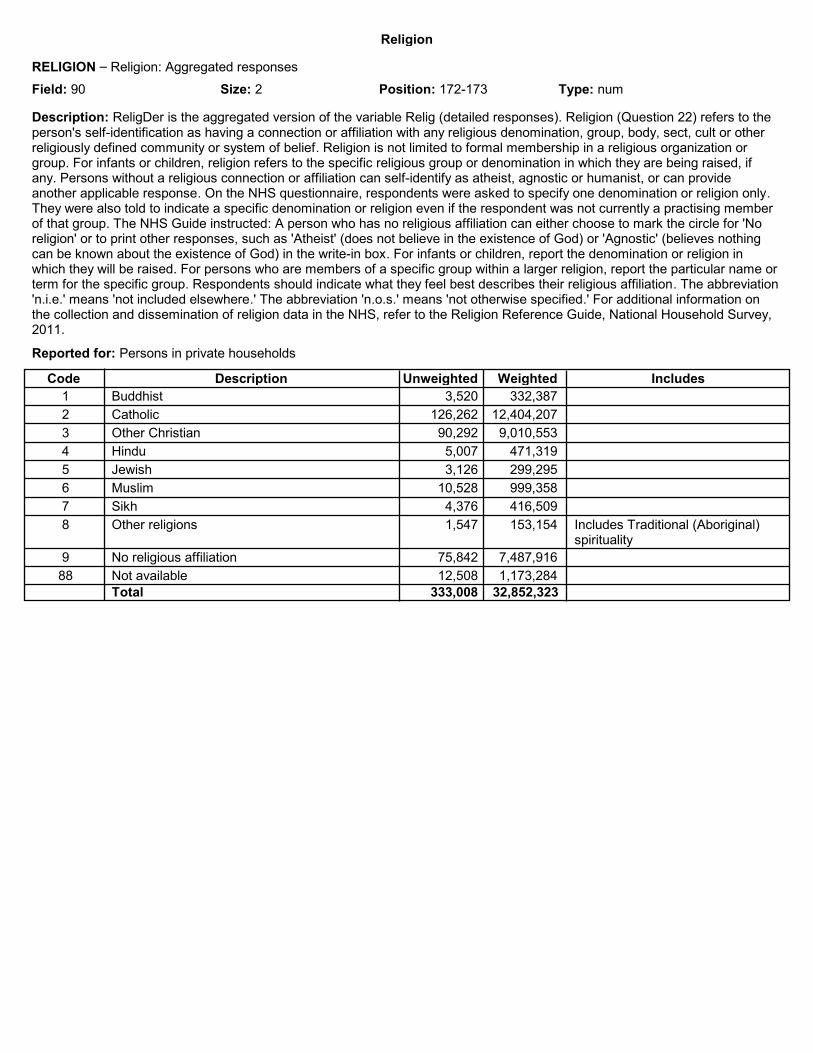
Religion
RELIGION – Religion: Aggregated responses
Field: 90 Position: 172-173Size: 2 Type: num
Description: ReligDer is the aggregated version of the variable Relig (detailed responses). Religion (Question 22) refers to the person's self-identification as having a connection or affiliation with any religious denomination, group, body, sect, cult or other religiously defined community or system of belief. Religion is not limited to formal membership in a religious organization or group. For infants or children, religion refers to the specific religious group or denomination in which they are being raised, if any. Persons without a religious connection or affiliation can self-identify as atheist, agnostic or humanist, or can provide another applicable response. On the NHS questionnaire, respondents were asked to specify one denomination or religion only. They were also told to indicate a specific denomination or religion even if the respondent was not currently a practising member of that group. The NHS Guide instructed: A person who has no religious affiliation can either choose to mark the circle for 'No religion' or to print other responses, such as 'Atheist' (does not believe in the existence of God) or 'Agnostic' (believes nothing can be known about the existence of God) in the write-in box. For infants or children, report the denomination or religion in which they will be raised. For persons who are members of a specific group within a larger religion, report the particular name or term for the specific group. Respondents should indicate what they feel best describes their religious affiliation. The abbreviation 'n.i.e.' means 'not included elsewhere.' The abbreviation 'n.o.s.' means 'not otherwise specified.' For additional information on the collection and dissemination of religion data in the NHS, refer to the Religion Reference Guide, National Household Survey, 2011.
Reported for: Persons in private households
Description WeightedCode IncludesUnweighted
1 Buddhist 332,387 3,520
2 Catholic 12,404,207 126,262
3 Other Christian 9,010,553 90,292
4 Hindu 471,319 5,007
5 Jewish 299,295 3,126
6 Muslim 999,358 10,528
7 Sikh 416,509 4,376
8 Other religions 153,154 1,547 Includes Traditional (Aboriginal) spirituality
9 No religious affiliation 7,487,916 75,842
88 Not available 1,173,284 12,508Total 333,008 32,852,323
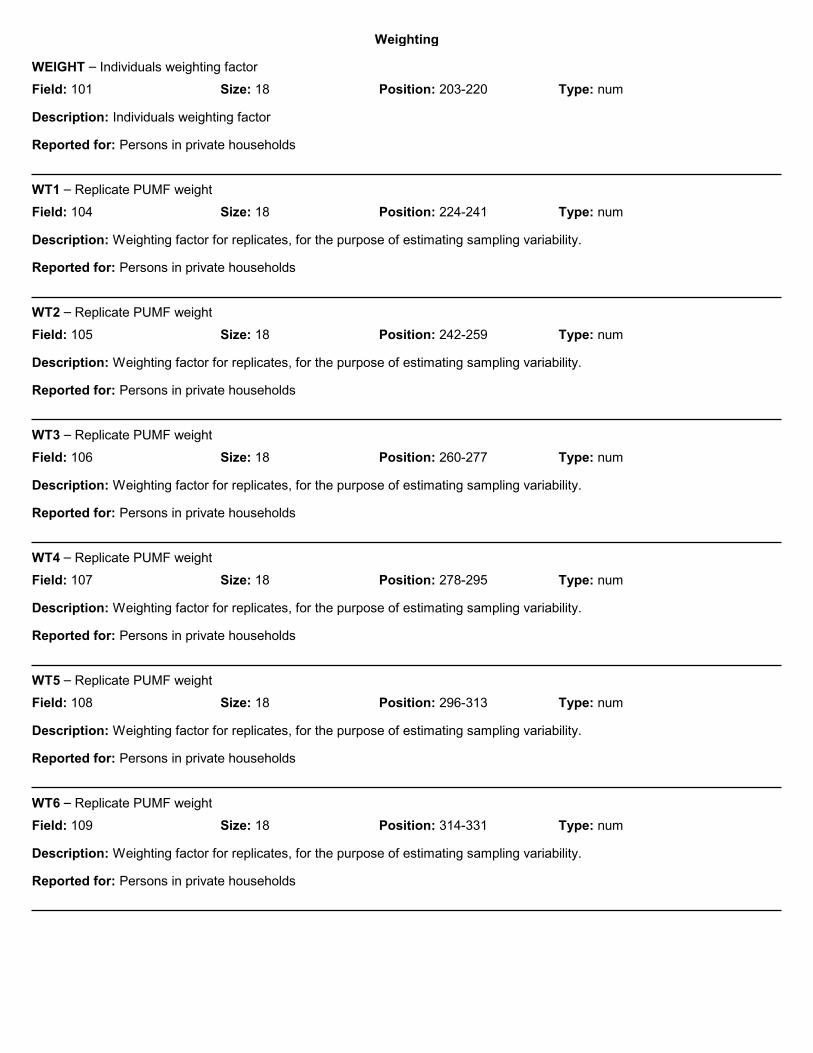
Weighting
WEIGHT – Individuals weighting factor
Field: 101 Position: 203-220Size: 18 Type: num
Description: Individuals weighting factor
Reported for: Persons in private households
WT1 – Replicate PUMF weight
Field: 104 Position: 224-241Size: 18 Type: num
Description: Weighting factor for replicates, for the purpose of estimating sampling variability.
Reported for: Persons in private households
WT2 – Replicate PUMF weight
Field: 105 Position: 242-259Size: 18 Type: num
Description: Weighting factor for replicates, for the purpose of estimating sampling variability.
Reported for: Persons in private households
WT3 – Replicate PUMF weight
Field: 106 Position: 260-277Size: 18 Type: num
Description: Weighting factor for replicates, for the purpose of estimating sampling variability.
Reported for: Persons in private households
WT4 – Replicate PUMF weight
Field: 107 Position: 278-295Size: 18 Type: num
Description: Weighting factor for replicates, for the purpose of estimating sampling variability.
Reported for: Persons in private households
WT5 – Replicate PUMF weight
Field: 108 Position: 296-313Size: 18 Type: num
Description: Weighting factor for replicates, for the purpose of estimating sampling variability.
Reported for: Persons in private households
WT6 – Replicate PUMF weight
Field: 109 Position: 314-331Size: 18 Type: num
Description: Weighting factor for replicates, for the purpose of estimating sampling variability.
Reported for: Persons in private households
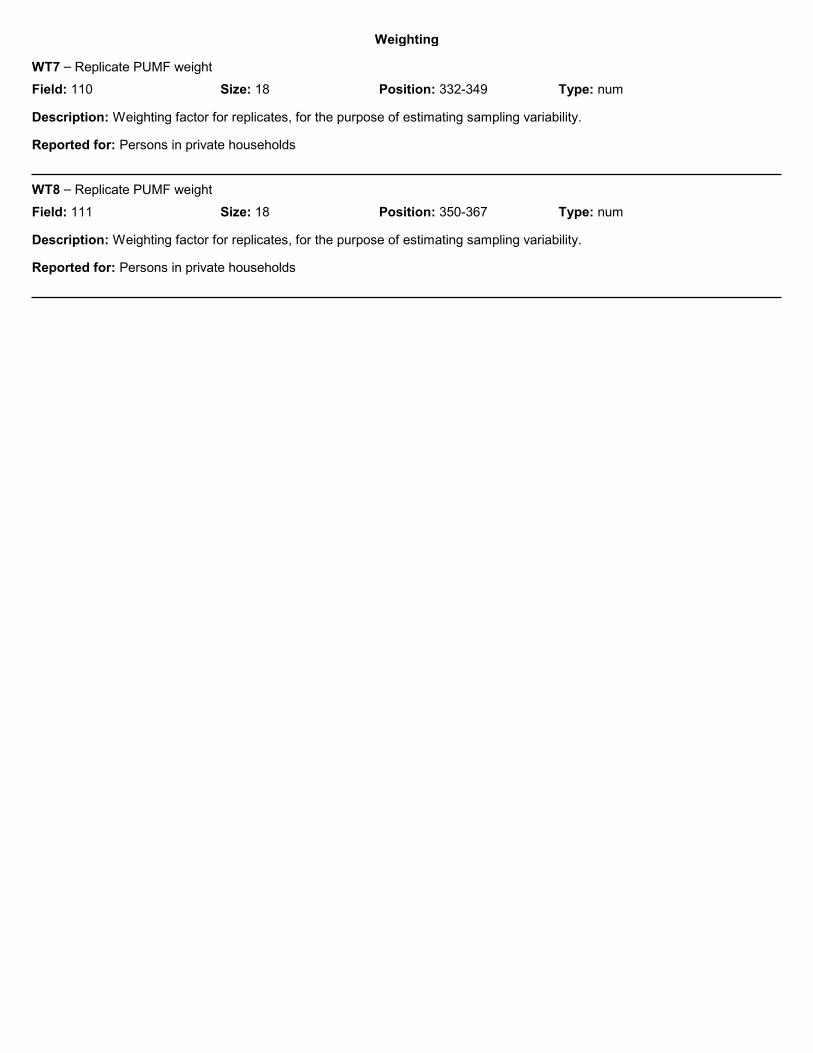
Weighting
WT7 – Replicate PUMF weight
Field: 110 Position: 332-349Size: 18 Type: num
Description: Weighting factor for replicates, for the purpose of estimating sampling variability.
Reported for: Persons in private households
WT8 – Replicate PUMF weight
Field: 111 Position: 350-367Size: 18 Type: num
Description: Weighting factor for replicates, for the purpose of estimating sampling variability.
Reported for: Persons in private households

Identifier
CF_ID – Key for census family table
Field: 3 Position: 14-21Size: 8 Type: num
Description: Key for census family table
Reported for: Persons in private households
EF_ID – Key for economic family table
Field: 2 Position: 7-13Size: 7 Type: num
Description: Key for economic family table
Reported for: Persons in private households
HH_ID – Key for household table
Field: 1 Position: 1-6Size: 6 Type: num
Description: Key for household table
Reported for: Persons in private households
PP_ID – Key for person table
Field: 4 Position: 22-30Size: 9 Type: num
Description: Key for person table
Reported for: Persons in private households
Chapter 4 Sampling method, estimation and data quality
This chapter provides notes on sampling, estimation and quality of the data related to the hierarchical file. It includes the following sections:
A. Sampling method
B. Estimation
C. Data reliability
In Section A, the target population is defined and the way in which the sample was selected is explained. Section B covers the concept of weighting and briefly describes the usual estimators. Finally, Section C explains how to estimate the sampling error and provides guidelines for disseminating estimates.
A Sampling method
A.1 Target population
The target population of the hierarchical file is the same as the NHS one. It represents the entire population who usually lived in Canada on the survey’s reference date, in provinces as well as territories. The NHS reference date is May 10, 2011. This date matches the reference date of the 2011 Census of Population. The target population includes persons who live on Indian reserves and in other Indian settlements, permanent residents, non-permanent residents such as refugee claimants, holders of work or study permits, and members of their families living with them.
Excluded from the target population are residents of incompletely enumerated Indian reserves, persons living in collective dwellings, Canadian citizens living abroad and full-time members of the Canadian Forces stationed outside Canada. Also excluded are foreign residents such as representatives of a foreign government assigned to an embassy, high commission or other diplomatic corps in Canada, members of the armed forces of another country stationed in Canada and residents of another country who are visiting Canada temporarily.
A.2 Sample design
The sample of households of the hierarchical file is selected using a two-phase sampling plan applied to the sample of NHS-responding households. For the first phase, the sample of NHS respondents was split into three parts representative of the country. Those parts are used as a survey frame to select the different NHS public use microdata files samples. The first frame was used to select the individuals file records. The second frame was used to select the hierarchical file records. The third frame was used to select records for a public use microdata file intended to do international comparisons. In the second phase, the selection of records for the hierarchical file was made from the second of the three frames. The hierarchical file sample size represents 1% of households of the target population, and is equal to 132,192 households.
A.2.a Sampling starting point: NHS respondent households
The hierarchical file sample is drawn from households selected to participate to the NHS that are part of the target population and that responded to the survey. The NHS sample was selected in two phases. A sample of 30% of the population’s households was selected in the first phase. After several weeks of collection, the initial sample was reduced by subsampling in the second phase one third of the remaining non-responding households. Non-response follow-up efforts were focused on this subsample.
Because the NHS is a voluntary survey, household non-response is higher than during a mandatory survey. The response rate of households selected in the first phase is 68.6%. This non-response was corrected by reweighting upward responding households.

Final NHS weights vary between 1 and 100 because of the survey design and variations in response rates from one population group to another. This weight indicates, for a given household, the number of Canadian households it represents. Likewise, this weight indicates, for a person in a given responding household, the number of Canadians he or she represents.
A.2.b First phase of sampling of the hierarchical file
To select the first phase sample for the hierarchical file, the NHS-responding households were split into three parts. To do so, these households were first sorted by province or territory of residence, number of usual residents in the household, census division, census tract and dissemination area. After this sorting, the NHS sample was systematically split into three parts.
This is equivalent to selecting a systematic sample of NHS-responding households at the first phase of sampling of the hierarchical file. In order for selected households to represent the entire target population, their weight was recalculated by dividing the final NHS weight by the first phase sampling fraction.
A.2.c Second phase of sampling of the hierarchical file
For the second phase of sampling, a sample of households was drawn from the first phase sample according to a systematic sampling design with probability-proportional-to-size (PPS), where the size is the weight resulting from the first phase of sampling. The goal was to obtain a self-weighted sample (meaning with identical weights) of which the size would correspond to 1% of the target universe. A self-weighted sample is desirable because it gives a uniform representation of the target population. However, it is not possible to select a self-weighted sample of 1% of the population’s households from the first phase sample because some households have a weight higher than 1/1% after the first phase of sampling. The best way to draw a sample close to a self-weighted sample is then to select highest-weight households with certainty and select a PPS systematic sample from the remaining households. A self-weighted sample was consequently drawn from households with weights lower than 90.3, and the other households were selected with certainty.
To select the self-weighted sample of households with weights lower than 90.3, records are first sorted with respect to some variables to ensure a good representativeness of the sample. These variables are:
1. Province or territory of residence 2. Urban – rural indicator 3. Number of persons in the household 4. Census Families structure and type in the household 5. Elderly person presence indicator in the household 6. Visible minority presence indicator in the household 7. Similar ethnic origins indicator in the household 8. At least one person in the labour force indicator in the household
The sample is systematically selected using a sampling interval of 90.3, and a random start between 0 and 90.3. The probability of selecting a record is proportional to its selection weighting factor determined during the first phase of sampling. More specifically, the weighting factor of the first household in the frame is added to the random start. The sum obtained is compared to the sampling interval; if it is larger than or equal to the interval, the household is selected; otherwise, we move on to the next household, adding its weighting factor to the previous sum. The result is again compared to the sampling interval. When a household is selected, we subtract the sampling interval from the cumulative total before selecting another household.
Once the complete sample is drawn, the final weight of the hierarchical file (the WEIGHT variable) is calculated for each household in the sample. It is equal to the household’s first phase weight divided by the second phase selection probability. Persons in selected households inherit their household’s respective weight. Households selected according to the self-weighted plan then have a design weight of 90.3 (or more specifically 90.20770959 on the file, due to a small adjustment so that the sum of selected individuals’ weighting factors yields the published number of individuals of the target universe) and represents about 86% of the households in the file. The remaining households have a higher weight. The sample size is equal to 1% of households of the target population. The file contains 132,192 households

including a total of 333,008 individuals. Please note that some individuals were suppressed for confidentiality reasons and that the number of persons estimate produced using the PUMF will be slightly lower than the published count.
B Estimation
B.1 Weighting
The microdata file contains a record for each individual selected in the PUMF sample. Each record contains a certain number of characteristics or variables described in Chapter 3. Each of these individuals represents a number of others who are not included in the sample, but who are in the NHS target population. This is reflected in the estimation process by the use of the variable 'WEIGHT.' The value of WEIGHT is the weighting factor for each individual unit. It corresponds to the number of units in the population represented by the unit selected in the sample. The WEIGHT value may be the same or different from one selected unit to another, depending on the weight adjustments made to match the sampling strategy. Also, the WEIGHT variable is the same for all individuals in a given household. This variable is calculated at the household level (since sampling is done at this level), and all individuals inherit the weight of their household. Economic families and census families also inherit the weight of their household.
To produce estimates that describe the population, the weighting factor must be used in all estimation calculations. For example, to estimate the number of persons in Canada who speak Chinese at home, the WEIGHT values for all records having this characteristic on the file must be totalled. The weighting factor must be used to produce estimates, regardless of whether the unit of analysis is the individual, the census family, the economic family, the household or the dwelling. Results based on this strategy are called 'weighted estimation results,' or simply 'weighted results.'
Note: Users must refrain from publishing unweighted estimates and from conducting analyses based on unweighted data from the file, since the unweighted results do not represent the population. They must also make sure to exclude from their calculations all values that are not applicable or not available, since the statistical software may consider those values valid, though they are not. For example, values such as 9,999,999 or 8,888,888 for a numeric (or quantitative) variable would be interpreted as valid observed values, but they should be considered as nominal values indicating that they are not usable in estimation.
B.2 Usual estimators
The microdata file contains two types of variables: numeric (or quantitative) variables, such as income, and nominal (or qualitative) variables, such as mother tongue. Several estimators are commonly used for these two types of variables. They are presented in the next sections.
B.2.a Nominal or qualitative variables
B.2.a.1 Estimator of a total
At the sample level, a total is obtained by counting the records that have the characteristic(s) sought. This unweighted total can be used to study the characteristics of the sample, but not those of the population.
The total at the population level is estimated by summing the weight of all records that have the characteristics sought. This weighted sample total is a proper estimate of the population total.

Example 1:
We want to estimate the total number of women aged 25 and over who are living in the Edmonton census metropolitan area (CMA) and whose highest level of schooling is a university certificate or diploma above the bachelor’s level.
We must first find the number of records in the file that satisfy the conditions CMA = 835, SEX = 1, AGEGRP ≥ 5, AGEGRP ≠ 88 and HDGREE = 8. We obtain a total of 300 records that satisfy all these conditions. Second, we estimate the population total by summing the WEIGHT variable for these 300 records. The resulting estimate of the population total is 28,503.
B.2.a.2 Estimator of a proportion
A proportion can be defined as a ratio of two qualitative variable totals, where the numerator is a total on a subset of the units targeted by the denominator.
A weighted estimate of this proportion is obtained by estimating both the numerator total and the denominator total and by calculating the ratio of these two quantities. Note that the denominator may represent either all the units in a geographic area or a subset of the units within a geographic area.
Example 2:
We want to estimate the proportion of immigrants among individuals who live in the Montréal CMA. First, we identify the records in the file that satisfy the conditions IMMSTAT = 3 and CMA = 462, and those that satisfy the condition CMA = 462. Second, we calculate the two corresponding weighted totals. Finally, the ratio of the two totals is the estimated proportion of immigrants among the individuals living in the Montréal CMA.
The estimated proportion is 848,541/3,743,411 = 0.2267, which means that slightly less than 23% of the individuals in the Montréal CMA are immigrants. In this example, the denominator targets all individuals in a geographic area.
Example 3:
We want to estimate, out of all males aged 20 to 44 living in the Vancouver CMA, the proportion whose de facto marital status is 'divorced (and not living common law).' In this case, the numerator is the weighted total of the records that satisfy the conditions CMA = 933, SEX = 2, 4 ≤ AGEGRP ≤ 8 and MARSTH = 5. The denominator is the weighted total of the records that satisfy CMA = 933, SEX = 2, and 4 ≤ AGEGRP ≤ 8.
We obtain 7,227/388,171 = 0.0186, which means that approximately 1.9% of males aged 20 to 44 in Vancouver are divorced and are not living common law. In this example, the denominator targets a subset of records in a geographic area.
B.2.a.3 Estimator of a ratio
In this section, we are interested in estimating the ratio of two quantities, which could be either two totals or two proportions. To estimate the ratio of two totals, simply obtain the estimated totals to appear respectively in the numerator and the denominator and divide one by the other. To estimate the ratio of two proportions, simply obtain the proportions to be used respectively in the numerator and the denominator and divide one by the other.
B.2.b Numeric or quantitative variables
B.2.b.1 Estimator of a total
At the sample level, a total of a numeric variable for a given area is obtained by summing the values of the variable for the records in the area of interest. At the population level, the estimated total is obtained by multiplying WEIGHT by the value of the variable of interest for each record in the area and by summing the result of the product. If we want to estimate a population total for a subset of units within an area, all calculations must be restricted to the records that are in this subset.
B.2.b.2 Estimator of an average
To estimate the average of a variable in a given geographic area, WEIGHT is multiplied by the value of the variable for the sample records that belong to the area, the results are totalled, and the total is divided by the sum of the WEIGHT values for the same records. If estimation of the average of a variable for a subset of the units in a given area is sought, it is necessary to multiply WEIGHT and the value of the variable for the sample records that belong to the subset in question, total the results and divide this total by the sum of the WEIGHT values for the same records.
Example 4:
We want to estimate the average total income of women aged 15 years and over living in Ontario who have an income. In the calculation of the numerator, WEIGHT must be multiplied by the value of the 'total income' variable for individuals with an income (those for whom TOTINC ≠ 8,888,888, TOTINC ≠ 9,999,999 and TOTINC ≠ 0) whose gender is female (SEX = 1) and who are aged 15 or over (AGEGRP ≥ 3 and AGEGRP ≠ 88) in the province of Ontario (PR = 35); the results are then totalled. To estimate the average, the numerator (or estimated total income) is divided by the sum of the WEIGHT values for individuals satisfying the same conditions on TOTINC, SEX, AGEGRP and PR.
The result obtained is $174,575,754,107/5,013,454 = $34,821, which means that the average total income of women aged 15 and over living in Ontario who have an income is around $34,821.
B.2.b.3 Estimator of a ratio
A ratio can be defined as the division of two amounts, which could be two totals or two averages. To estimate the ratio of two totals, simply obtain the estimated totals to appear respectively in the numerator and the denominator and divide one by the other. To estimate the ratio of two averages, obtain the estimated averages to be used respectively in the numerator and the denominator and divide one by the other.
C Data reliability
Since the microdata file is a sample drawn from among respondents of the NHS sample, there is not necessarily perfect agreement between the estimates calculated from the file and the results that would be obtained if we were observing the population as a whole. Any observed difference is attributable to two types of errors: sampling error and non-sampling errors.
C.1 Sampling error
The sampling error is the error attributable to the fact that only a sample of the population is used to produce the estimates. Different samples would have yielded different estimates. These differences are represented by the sampling variability. The procedure for estimating the sampling variability is described in the next section.
C.2 Estimation of the sampling variability
The 'coefficient of variation' (CV) is a measure frequently used to determine the degree of sampling variability. It is simply the ratio of the standard error of an estimate and the estimate itself. In other words, it is the standard error expressed as a percentage of the targeted estimate.
The sample design must be taken into account in computing the sampling error. The microdata file does not contain all the necessary information on the design to estimate this sampling error. We propose to use instead an approximate method, called the 'nonindependent random groups method,' which is described in detail in Chapter 2 of the book Introduction to Variance Estimation.
1 This method is easy to
1. Wolter, K. M., Introduction to Variance Estimation, Springer Series in Statistics, Springer-Verlag, New York, 1985.

apply, but one of its features is that it tends to overestimate the sampling error for small estimates, which results in a conservative procedure for testing significant differences.
The principle of the method is as follows. The PUMF sample was divided into eight nonindependent random groups (or nonoverlapping random groups). Each group is representative of the population but is about 8 times smaller than the full sample. These groups can be identified using the replicate weighting factors WT1, WT2, …, WT8 on the microdata file. For example, the fourth group is the set of records for which WT4 is strictly greater than 0. A given replicate weighting factor is 0 if the record is not part of the corresponding group and is 8 times WEIGHT if it is part of the group. The multiplication by 8 compensates for the division of the sample into eight groups. Using each of the replicate weighting factors, we can compute an estimate for each group. The sampling error is estimated on the basis of these eight estimates.
The targeted estimate must first be obtained as in Section B.2 using all records in the sample and the WEIGHT variable. Then, the following calculations are required:
(1) Calculate the same estimates based on each of the eight groups, i.e., using each of the eight replicate weighting factors instead of WEIGHT. The estimates are usually different but are all based on the same sampling design. Since the original sample was divided into eight groups, the number of records in each group is limited and some groups might be empty. In this case, use zero as the estimate for the group.
(2) Calculate the average of the eight estimates.
(3) Calculate the sum of the squared deviations between the group estimates obtained in (1) and the average obtained in (2).
(4) Divide the number obtained in (3) by 56 and extract the square root of the result. The result is an estimate of the standard error of the targeted estimate.
(5) Divide the number obtained in (4) by the targeted estimate. The result is the coefficient of variation.
(6) One can calculate a confidence interval that would be accurate 19 times out of 20 by removing 1.96 times the standard error from the targeted estimate for the lower bound and by adding 1.96 times the standard error to the targeted estimate for the upper bound.
Table 1 Guidelines for releasing estimates
Category Alphabetic
code Coefficient of variation (%)
Recommendation
Unrestricted
A
B
C
D
E
0.0 – 1.0
1.0 – 2.5
2.5 – 5.0
5.0 – 10.0
10.0 – 16.5
The estimates can be included in a general release without restriction. The letter A indicates that the estimate is very reliable. The letter B indicates that the estimate is reliable, but less so than one from category A, and so on.
Restricted
F
G
16.5 – 25.0
25.0 – 33.3
The estimates are sufficiently reliable for specific purposes, but must be used with caution. Whenever these estimates are used, it is preferable to point out that their sampling variability is higher.
Not to be released
Greater than 33.3 It is recommended that these estimates be removed from releases and statistical tables.
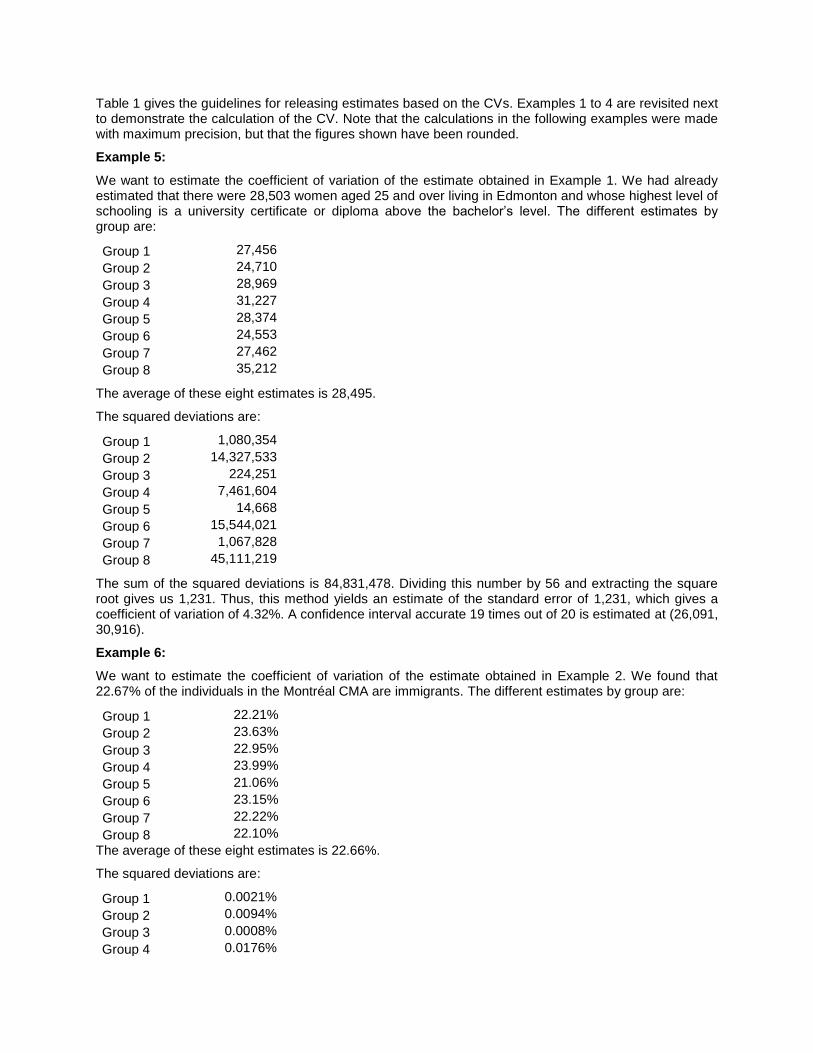
Table 1 gives the guidelines for releasing estimates based on the CVs. Examples 1 to 4 are revisited next to demonstrate the calculation of the CV. Note that the calculations in the following examples were made with maximum precision, but that the figures shown have been rounded.
Example 5:
We want to estimate the coefficient of variation of the estimate obtained in Example 1. We had already estimated that there were 28,503 women aged 25 and over living in Edmonton and whose highest level of schooling is a university certificate or diploma above the bachelor’s level. The different estimates by group are:
Group 1 27,456
Group 2 24,710
Group 3 28,969
Group 4 31,227
Group 5 28,374
Group 6 24,553
Group 7 27,462
Group 8 35,212
The average of these eight estimates is 28,495.
The squared deviations are:
Group 1 1,080,354
Group 2 14,327,533
Group 3 224,251
Group 4 7,461,604
Group 5 14,668
Group 6 15,544,021
Group 7 1,067,828
Group 8 45,111,219
The sum of the squared deviations is 84,831,478. Dividing this number by 56 and extracting the square root gives us 1,231. Thus, this method yields an estimate of the standard error of 1,231, which gives a coefficient of variation of 4.32%. A confidence interval accurate 19 times out of 20 is estimated at (26,091, 30,916).
Example 6:
We want to estimate the coefficient of variation of the estimate obtained in Example 2. We found that 22.67% of the individuals in the Montréal CMA are immigrants. The different estimates by group are:
The average of these eight estimates is 22.66%.
The squared deviations are:
Group 1 0.0021%
Group 2 0.0094%
Group 3 0.0008%
Group 4 0.0176%
Group 1 22.21%
Group 2 23.63%
Group 3 22.95%
Group 4 23.99%
Group 5 21.06%
Group 6 23.15%
Group 7 22.22%
Group 8 22.10%

Group 5 0.0258%
Group 6 0.0024%
Group 7 0.0020%
Group 8 0.0031%
The sum of the squared deviations is 0.0631%. Dividing this number by 56 and extracting the square root gives us 0.34%. Thus, this method yields an estimate of the standard error of 0.34%, which gives a coefficient of variation of 1.48%. A confidence interval accurate 19 times out of 20 is estimated at (22.01%, 23.33%).
Example 7:
We want to estimate the coefficient of variation of the estimate obtained in Example 3. We found that 1.86% of males aged 20 to 44 in the Vancouver CMA are divorced (and not living common law). The different estimates per group are:
Group 1 1.27%
Group 2 2.25%
Group 3 0.84%
Group 4 1.87%
Group 5 2.83%
Group 6 1.98%
Group 7 1.70%
Group 8 2.20%
The average of these eight estimates is 1.87%.
The squared deviations are:
The sum of the squared deviations is 0.0265%. Dividing this number by 56 and extracting the square root gives us 0.22%. Thus, this method yields an estimate of the standard error of 0.22%, which gives a coefficient of variation of 11.68%. A confidence interval accurate 19 times out of 20 is estimated at (1.44%, 2.29%).
Example 8:
We want to estimate the coefficient of variation of the estimate obtained in Example 4. We found that among females aged 15 and over who live in Ontario and have an income, the average total income is around $34,821. The different estimates by group are:
Group 1 35,169
Group 2 35,197
Group 3 34,000
Group 4 34,532
Group 5 35,447
Group 6 35,145
Group 7 35,079
Group 8 34,044
Group 1 0.0036%
Group 2 0.0015%
Group 3 0.0105%
Group 4 0.0000%
Group 5 0.0093%
Group 6 0.0001%
Group 7 0.0003%
Group 8 0.0011%

The average of these eight estimates is $34,827.
The squared deviations are:
Group 1 117,357
Group 2 137,442
Group 3 683,773
Group 4 86,739
Group 5 384,708
Group 6 101,174
Group 7 63,750
Group 8 612,620
The sum of the squared deviations is 2,187,561. Dividing this number by 56 and extracting the square root gives us 198. Thus, this method yields an estimate of the standard error of 198, which gives a coefficient of variation of 0.57%. A confidence interval accurate 19 times out of 20 is estimated at (34,434, 35,209).
C.3 Generic SAS code to produce coefficients of variation
We will give an example of SAS code for producing coefficients of variation.
Assume that you want to create a multidimensional data table of estimates for which you wish to obtain a coefficient of variation for the estimates found in each cell. For example, you want to have a table showing the average total income of persons who have an income, broken down by sex and de facto marital status.
Assume that you have read the microdata file and saved the variables SEX, MARSTH, TOTINC, WEIGHT, WT1, WT2, ..., WT8 in a SAS dataset called ORIGINAL. The ORIGINAL file should contain all 333,008 records.
To determine the averages, we must exclude records in which TOTINC is equal to 8888888, 9999999 or 0.
DATA TOTINC_VALID;
SET ORIGINAL;
IF TOTINC NOT IN(0,8888888,9999999);
RUN;
The file TOTINC_VALID contains 260,524 records. To obtain the desired estimates, it is necessary to create nine weighted sums of total income from the records:
DATA WEIGHTED_SUM;
SET TOTINC_VALID;
weighted_INC = WEIGHT * TOTINC;
weighted_INC1 = WT1 * TOTINC;
weighted_INC2 = WT2 * TOTINC;
weighted_INC3 = WT3 * TOTINC;
weighted_INC4 = WT4 * TOTINC;
weighted_INC5 = WT5 * TOTINC;
weighted_INC6 = WT6 * TOTINC;
weighted_INC7 = WT7 * TOTINC;
weighted_INC8 = WT8 * TOTINC;
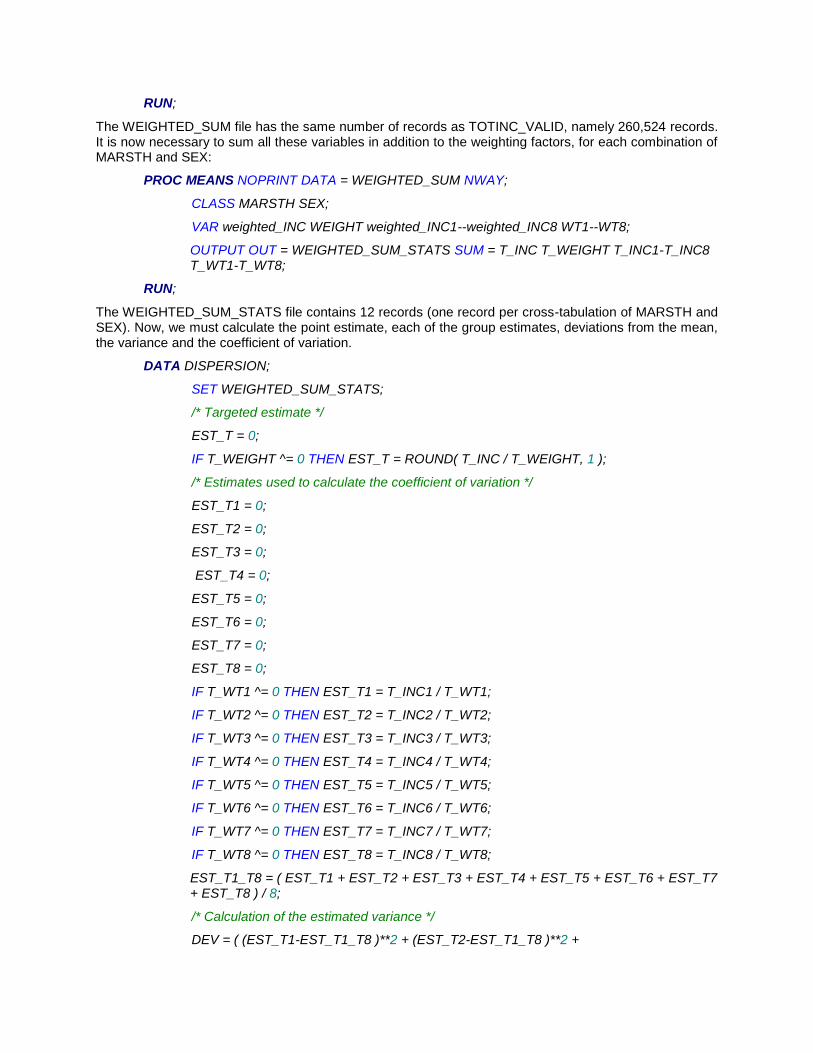
RUN;
The WEIGHTED_SUM file has the same number of records as TOTINC_VALID, namely 260,524 records. It is now necessary to sum all these variables in addition to the weighting factors, for each combination of MARSTH and SEX:
PROC MEANS NOPRINT DATA = WEIGHTED_SUM NWAY;
CLASS MARSTH SEX;
VAR weighted_INC WEIGHT weighted_INC1--weighted_INC8 WT1--WT8;
OUTPUT OUT = WEIGHTED_SUM_STATS SUM = T_INC T_WEIGHT T_INC1-T_INC8 T_WT1-T_WT8;
RUN;
The WEIGHTED_SUM_STATS file contains 12 records (one record per cross-tabulation of MARSTH and SEX). Now, we must calculate the point estimate, each of the group estimates, deviations from the mean, the variance and the coefficient of variation.
DATA DISPERSION;
SET WEIGHTED_SUM_STATS;
/* Targeted estimate */
EST_T = 0;
IF T_WEIGHT ^= 0 THEN EST_T = ROUND( T_INC / T_WEIGHT, 1 );
/* Estimates used to calculate the coefficient of variation */
EST_T1 = 0;
EST_T2 = 0;
EST_T3 = 0;
EST_T4 = 0;
EST_T5 = 0;
EST_T6 = 0;
EST_T7 = 0;
EST_T8 = 0;
IF T_WT1 ^= 0 THEN EST_T1 = T_INC1 / T_WT1;
IF T_WT2 ^= 0 THEN EST_T2 = T_INC2 / T_WT2;
IF T_WT3 ^= 0 THEN EST_T3 = T_INC3 / T_WT3;
IF T_WT4 ^= 0 THEN EST_T4 = T_INC4 / T_WT4;
IF T_WT5 ^= 0 THEN EST_T5 = T_INC5 / T_WT5;
IF T_WT6 ^= 0 THEN EST_T6 = T_INC6 / T_WT6;
IF T_WT7 ^= 0 THEN EST_T7 = T_INC7 / T_WT7;
IF T_WT8 ^= 0 THEN EST_T8 = T_INC8 / T_WT8;
EST_T1_T8 = ( EST_T1 + EST_T2 + EST_T3 + EST_T4 + EST_T5 + EST_T6 + EST_T7 + EST_T8 ) / 8;
/* Calculation of the estimated variance */
DEV = ( (EST_T1-EST_T1_T8 )**2 + (EST_T2-EST_T1_T8 )**2 +

(EST_T3-EST_T1_T8 )**2 + (EST_T4-EST_T1_T8 )**2 +
(EST_T5-EST_T1_T8 )**2 + (EST_T6-EST_T1_T8 )**2 +
(EST_T7-EST_T1_T8 )**2 + (EST_T8-EST_T1_T8 )**2 ) / 56;
/* Calculation of the coefficient of variation */
CV_T = 0;
IF EST_T ^= 0 THEN CV_T = SQRT( DEV ) / EST_T;
KEEP MARSTH SEX EST_T CV_T; RUN;
The following PRINT procedure yields Table 2 when the MARSTH and SEX formats have been loaded into SAS beforehand:
PROC PRINT DATA=DISPERSION NOOBS LABEL;
VAR MARSTH SEX EST_T CV_T;
LABEL EST_T = "Estimate of the average total income ($)" CV_T = "CV (%)" MARSTH = "De facto marital status" SEX = "Sex";
FORMAT MARSTH MARSTH. SEX SEX. EST_T 8.0 CV_T PERCENT8.2;
RUN;
Table 2 Estimated average total income of persons with an income, by de facto marital status and
sex
De facto marital status Sex Estimated average
total income ($) CV (%)
Never legally married (and not living common law)
Female 24,415 1.02
Male 26,749 0.63
Legally married (and not separated)
Female 36,100 0.29
Male 60,778 0.56
Living common law Female 36,161 0.64
Male 51,375 0.98
Separated (and not living common law)
Female 36,431 0.94
Male 48,684 2.47
Divorced (and not living common law)
Female 37,977 0.67
Male 47,001 1.54
Widowed (and not living common law)
Female 30,802 0.67
Male 41,446 2.63
C.4 Generic SUDAAN code for producing coefficients of variation
We will give an example of SUDAAN code for producing the same coefficients of variation as in the previous section, namely those in Table 2. Assume once again that the ORIGINAL file in the SAS

example was created beforehand. The following SUDAAN procedure provides estimates of the mean, as well as the corresponding standard errors and confidence intervals. It also creates a SUDAAN_OUTPUT dataset containing estimates of the mean and their standard errors.
PROC DESCRIPT DATA=ORIGINAL DESIGN=BRR DDF=1000000;
REPWGT WT1-WT8/ADJFAY=0.1428571;
WEIGHT WEIGHT;
CLASS MARSTH SEX;
TABLE MARSTH*SEX;
VAR TOTINC;
OUTPUT MEAN SEMEAN / FILENAME=SUDAAN_OUTPUT;
SUBPOPN TOTINC != 0 AND TOTINC != 8888888 AND TOTINC != 9999999;
RUN;
The option DESIGN=BRR tells SUDAAN to estimate the sampling variability with a variance formula that uses replicate weights similar (within a multiplicative factor) to the variance formula of the nonindependent random groups method. The option DDF=1000000 tells SUDAAN to subtract and add 1.96 times the standard error to the point estimate to produce confidence intervals. The instruction REPWGT WT1-WT8 tells SUDAAN which replicate weights to use. The option ADJFAY=0.1428571 is needed to obtain the appropriate standard error. It tells the software to divide the sum of the squared deviations by seven times the number of replicates (56 in our case) rather than by the default value. The default value is equal to the number of replicates, which is eight in our case. The instruction SUBPOPN specifies the subset of the population of interest. In general, to apply the nonindependent random groups method in any SUDAAN procedure, the same DESIGN, DDF, REPWGT and ADJFAY instructions must be used.
The SUDAAN_OUTPUT file produced by the DESCRIPT procedure in this example contains 21 records. There is a record for each possible combination of gender and marital status, for a total of 12. The other records give estimates of the mean and the corresponding standard errors when genders are combined (the six records with SEX = 0 and MARSTH ≠ 0), when marital statuses are combined (the two records with MARSTH = 0 and SEX ≠ 0) or when both are combined (the record with SEX = 0 and MARSTH = 0).
The following code is used to calculate the coefficient of variation and isolate the 12 records in the SUDAAN_OUTPUT file that represent the cross-tabulation of a gender and a marital status.
DATA CV;
SET SUDAAN_OUTPUT;
CV=SEMEAN/MEAN;
IF SEX NE 0 AND MARSTH NE 0;
RUN;
The PRINT procedure that follows prints Table 2 when the MARSTH and SEX formats have been loaded into SAS beforehand:
PROC PRINT DATA=CV NOOBS LABEL;
VAR MARSTH SEX MEAN CV;
LABEL EST_T = "Estimate of the average total income ($)" CV_T = "CV (%)" MARSTH = "De facto marital status" SEX = "Sex";
FORMAT MARSTH MARSTH. SEX SEX. MEAN 8.0 CV PERCENT8.2;
RUN;

C.5 Generic Stata code for producing coefficients of variation
Below is a Stata code example that yields the same coefficients of variation as in Sections C.3 and C.4, provided in Table 2. More specifically, we want the table to show the average total income of persons who have an income, broken down according to de facto marital status and sex, as well as a coefficient of variation attached to each estimate. Note that this code was tested with STATA, version 11.
*Clear any STATA file from your computer memory; drop _all
*Allocate appropriate memory to STATA; set memory 60m
*Read the original data file. “C:” must be replaced by the directory that contains your “data_donnees.dat” file;
infix MARSTH 128-128 WEIGHT 203-220 WT1 224-241 WT2 242-259 WT3 260-277 WT4 278-295 WT5 296-313 WT6 314-331 WT7 332-349 WT8 350-367 SEX 177-177 TOTINC 182-188 using "C:\data_donnees.dat", clear
* Only keep people who have an income; keep if TOTINC != 9999999 & TOTINC != 8888888 & TOTINC != 0 describe, short
* Calculate the weighted total income for each record; generate T_INC = WEIGHT * TOTINC gen T_WT1 = WT1 * TOTINC gen T_WT2 = WT2 * TOTINC gen T_WT3 = WT3 * TOTINC gen T_WT4 = WT4 * TOTINC gen T_WT5 = WT5 * TOTINC gen T_WT6 = WT6 * TOTINC gen T_WT7 = WT7 * TOTINC gen T_WT8 = WT8 * TOTINC
* Sum the weighted total income by MARSTH and SEX; collapse (sum) WEIGHT WT1 WT2 WT3 WT4 WT5 WT6 WT7 WT8 T_INC T_WT1 T_WT2 T_WT3 T_WT4 T_WT5 T_WT6 T_WT7 T_WT8, by (MARSTH SEX) describe, short
* The file now contains only 12 records; * Calculate the average total income for each group;
generate EST_T = T_INC / WEIGHT if WEIGHT != 0 generate EST_T1 = T_WT1 / WT1 if WT1 != 0 generate EST_T2 = T_WT2 / WT2 if WT2 != 0 generate EST_T3 = T_WT3 / WT3 if WT3 != 0 generate EST_T4 = T_WT4 / WT4 if WT4 != 0 generate EST_T5 = T_WT5 / WT5 if WT5 != 0 generate EST_T6 = T_WT6 / WT6 if WT6 != 0 generate EST_T7 = T_WT7 / WT7 if WT7 != 0 generate EST_T8 = T_WT8 / WT8 if WT8 != 0
* Set the average to zero for groups with zero weights; replace EST_T = 0 if EST_T == . replace EST_T1 = 0 if EST_T1 == . replace EST_T2 = 0 if EST_T2 == . replace EST_T3 = 0 if EST_T3 == . replace EST_T4 = 0 if EST_T4 == . replace EST_T5 = 0 if EST_T5 == . replace EST_T6 = 0 if EST_T6 == . replace EST_T7 = 0 if EST_T7 == . replace EST_T8 = 0 if EST_T8 == .
* Compute the mean estimate;
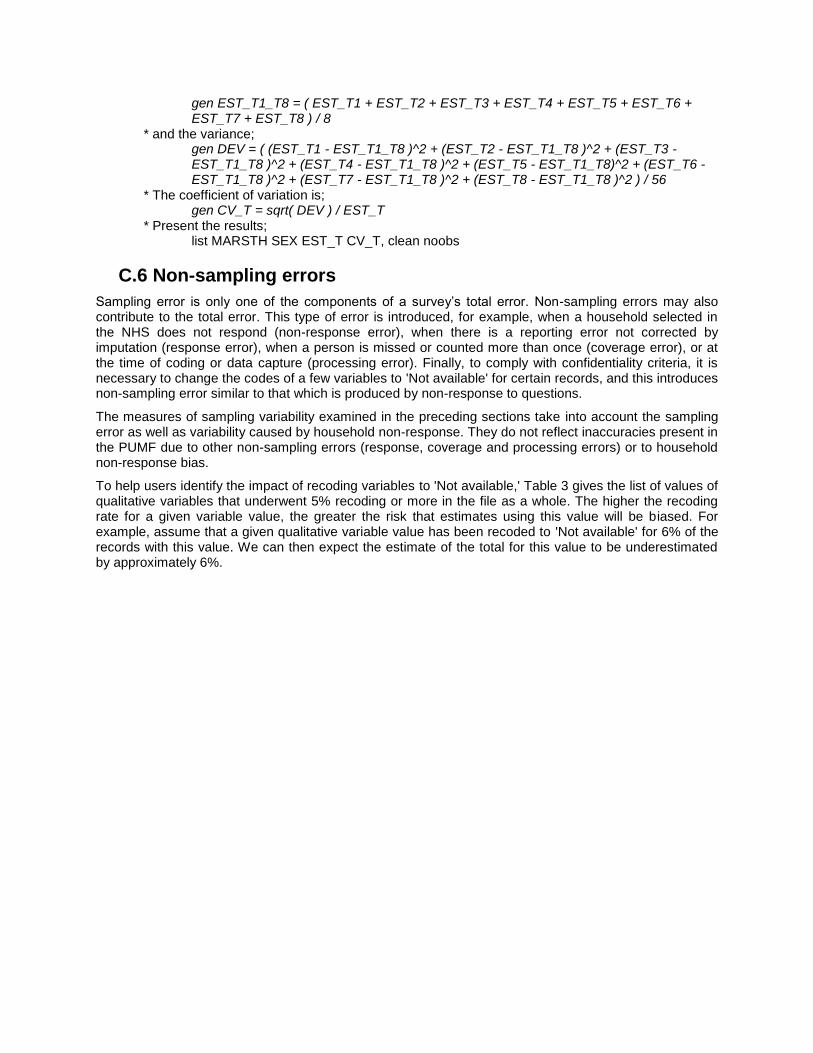
gen EST_T1_T8 = ( EST_T1 + EST_T2 + EST_T3 + EST_T4 + EST_T5 + EST_T6 + EST_T7 + EST_T8 ) / 8
* and the variance; gen DEV = ( (EST_T1 - EST_T1_T8 )^2 + (EST_T2 - EST_T1_T8 )^2 + (EST_T3 - EST_T1_T8 )^2 + (EST_T4 - EST_T1_T8 )^2 + (EST_T5 - EST_T1_T8)^2 + (EST_T6 - EST_T1_T8 )^2 + (EST_T7 - EST_T1_T8 )^2 + (EST_T8 - EST_T1_T8 )^2 ) / 56
* The coefficient of variation is; gen CV_T = sqrt( DEV ) / EST_T
* Present the results; list MARSTH SEX EST_T CV_T, clean noobs
C.6 Non-sampling errors
Sampling error is only one of the components of a survey’s total error. Non-sampling errors may also contribute to the total error. This type of error is introduced, for example, when a household selected in the NHS does not respond (non-response error), when there is a reporting error not corrected by imputation (response error), when a person is missed or counted more than once (coverage error), or at the time of coding or data capture (processing error). Finally, to comply with confidentiality criteria, it is necessary to change the codes of a few variables to 'Not available' for certain records, and this introduces non-sampling error similar to that which is produced by non-response to questions.
The measures of sampling variability examined in the preceding sections take into account the sampling error as well as variability caused by household non-response. They do not reflect inaccuracies present in the PUMF due to other non-sampling errors (response, coverage and processing errors) or to household non-response bias.
To help users identify the impact of recoding variables to 'Not available,' Table 3 gives the list of values of qualitative variables that underwent 5% recoding or more in the file as a whole. The higher the recoding rate for a given variable value, the greater the risk that estimates using this value will be biased. For example, assume that a given qualitative variable value has been recoded to 'Not available' for 6% of the records with this value. We can then expect the estimate of the total for this value to be underestimated by approximately 6%.

Table 3 Qualitative variable values for which the rate of recoding to 'Not available' is 5% or more
Variable Value Rate of recoding to 'Not
available' (%) Variable Value
Rate of recoding to 'Not available' (%)
ABOID
1 9.7 LOCSTUD 6 39.9
3 13.4 MOB1 5 7.6
4 10.7
NAICS
1 5.9
5 7.3 2 6.2
AGEGRP 2 5.5 3 5.4
3 5.3 4 6.4
AGEIMM
1 6.5 5 6.2
2 6.2 6 5.9
3 6.1 7 5.3
4 6.6 8 5.3
5 5.5 10 6.8
6 5.2 11 6.6
7 5.6
NOCEE
3 5.8
8 5.6 10 5.5
9 6.0 11 5.3
10 6.2 12 7.7
11 9.3
NOCS
4 5.2
12 10.8 6 7.5
13 11.4 9 8.8
BFNMEMB 2 11.3 10 6.3
CIP2011
1 5.1 POB 2 6.4
2 7.0 POWST
3 10.5
3 7.4 7 7.4
4 5.7 PR1 63 14.1
6 8.8 PWPR
11 7.0
7 6.5 63 21.6
9 7.3 REGIND 2 11.3
11 5.7
RELIGION
1 13.1
CITOTH
1 12.2 4 6.9
2 5.9 5 9.9
4 7.1 6 5.6
COW 2 18.4 7 5.8
ETHDER 3 10.0 8 23.3
HDGREE 6 5.6 SSGRAD 7 5.6

Chapter 5 Other factors affecting data reliability
A Adjustments to Geographic Areas
Users should be aware that the boundaries of census geographic areas are subject to change from one census to the next. Therefore, when using data from two or more censuses, users must be aware of, and take into consideration, any changes to the geographic boundaries and/or the conceptual definition of the areas being compared. Users wishing to obtain additional information in this regard should refer to the following electronic reference tool: GeoSuite, 2011 Census, Catalogue no. 92-150-XBB.
B Population counts based on usual place of residence
The population counts shown here for a particular area represent the number of respondents whose usual place of residence is in that area, regardless of where they happened to be on May 10, 2011. Also included are any respondents staying in a dwelling in that area on May 10, 2011 and having no usual place of residence elsewhere in Canada, as well as persons considered as 'non-permanent residents' (see Section C below). In most areas, there is little difference between the number of usual residents and the number of people staying in the area on May 10, 2011. For certain places, however, such as tourist or vacation areas, or areas including large work camps, the number of people staying in the area at any particular time could significantly exceed the number of usual residents for that area.
C Non-permanent residents
The 2011 National Household Survey (NHS) included information about non-permanent residents in Canada. Non-permanent residents are defined as persons from another country who, at the time of the survey, held a Work or Study Permit or who were refugee claimants, as well as non-Canadian-born family members living in Canada with them. The non-permanent resident population is identified from responses to the citizenship and landed immigrant status questions. Persons who are not Canadian citizens by birth and who answered 'No' to the landed immigrant status question are considered non permanent residents.
The inclusion of non-permanent residents in the NHS facilitates comparisons with provincial and territorial statistics (marriages, divorces, births and deaths) which include this population and provides information for planning of services, such as health care, education and employment programs. As well, the inclusion of non-permanent residents brings Canadian practice closer to the United Nations recommendation that long-term residents (persons living in a country for one year or longer) be enumerated.
Although every attempt has been made to enumerate non-permanent residents, factors such as language difficulties, the reluctance to complete a government form or to understand the need to participate may have affected the estimate of this population.
D Comparability of data on self-reported Aboriginal population
In the 1991 Census and previous censuses, the Aboriginal population was determined using the ethnic origin question, based primarily on the ancestry dimension. Again in 1996, respondents could report their Aboriginal ethnic origin or ancestry. However, a new question was included in the questionnaire for the 1996 Census. That question, which concerned self-reporting of Aboriginal ancestry, enabled respondents who identified with at least one Aboriginal group (North American Indian, Métis or Inuit) to define themselves as 'Aboriginal.' The same question was asked in the 2001 and 2006 censuses and the 2011 NHS.
It is important to note that the 2001, 2006 and 2011 data on the self-reported Aboriginal population are not comparable with either the 1991, 1996, 2001, 2006 or 2011 ethnic origin or ancestry figures. The concepts underlying these figures are very different. For example, some persons who have Aboriginal ancestors do not see themselves as Aboriginal (and vice versa).
E Housing
In order to protect the confidentiality of data in the 2011 Public Use Microdata File (PUMF), the 'Rented' and 'Band housing' categories have been combined as in the 2006 PUMF. Furthermore, gross rent data for individuals living in Band housing have been imputed to prevent inadvertent disclosure of individual information.
Users should use caution when using housing and shelter cost data for analyses focused entirely or largely on the Aboriginal population.
F Labour market activity
F.1 Standard industrial classification, 2007
The 2011 NHS Industry data were coded to the North American Industry Classification System (NAICS) 2007 which is a revision of the NAICS 2002.
The 2011 industry data can be tabulated for a number of populations, among which the most frequently used are:
(a) the employed; (b) the experienced labour force - persons who were either employed or unemployed in the reference
week but who had worked since January 1, 2010; (c) those who have worked since January 1, 2010, regardless of whether or not they were in the
labour force in the reference week.
The remaining components of the labour force, unemployed persons who worked prior to January 1, 2010, or who never worked, are shown in the data under the category 'Industry - Not applicable.'
Coding of responses to the industry questions was done, where possible, using a pre-coded list of establishments to ensure uniformity with the NAICS codes assigned to the same establishments by other Statistics Canada surveys.
Comparable industry information based on NAICS 2007 is also available from the Labour Force Survey for certain geographic areas and for some level of detail for NAICS.
For more information on the NAICS 2007, see North American Industry Classification System (NAICS) 2007, Catalogue no. 12-501-XIE.
F.2 Occupation
The 2011 NHS occupation data were coded to the National Occupational Classification (NOC) 2011. The 2011 occupation data were subsequently recoded to the NOC-S 2006 for users wishing to compare occupation data based on that classification. As well, empirical NOC 2011-NOC-S 2006 concordance tables have been produced to allow for the conversion of occupation data from one classification to the other. For more information, please see Appendix 2.5 of the 2011 National Household Survey dictionary.
Users of NHS occupation data coded to NOC-S 2006 should note that some unit groups have been combined. For a list of combined unit groups, refer to Table 2.4 of the 2011 National Household Survey dictionary. It should be further noted that where the combined occupations cross minor groups, the NHS occupation data will not be comparable at the minor group level with data from other sources coded to NOC-S 2006. For a list of affected minor groups, refer to Table 2.3 of the 2011 National Household Survey dictionary.
It is recommended that users not make comparisons between the broad categories, major and minor groups of the NOC 2011 and NOC-S 2006 on the basis of their labels. Even though many of the labels in the two classifications are similar, they are not directly comparable given differences in the content and placement of some unit groups.
For more information on the relationship between the NOC-S 2006 and the NOC 2011, please see http://www.statcan.gc.ca/subjects-sujets/standard-norme/noc-cnp/2011/index-indexe-eng.htm.
The 2011 NHS occupation data can be tabulated for a number of populations, among which the most frequently used are:
(a) the employed (b) the experienced labour force – persons who were either employed or unemployed in the
reference week, but who had worked since January 1, 2010 (c) those who have worked since January 1, 2010, regardless of whether or not they were in the
labour force in the reference week.
The remaining components of the labour force, unemployed persons who worked prior to January 1, 2010, or who never worked, are shown in the data under the category 'Occupation – Not applicable.'
F.3 Self-employed workers in Sector 91 - Public administration
All individuals employed in Industry Sector 91- Public administration (Industry variable) should be classified as employee (Class of worker variable). However, data users will notice counts for self-employed individuals in the Industry sector 91 - Public administration due to a failure to edit a common respondent error. More specifically, some self-employed respondents report working for the 'government' to the Industry question - and therefore are classified in Public administration - when in fact, they have obtained contractual work in the public service. These self-employed respondents should have reported their own business or services to the Industry question since they are self-employed and consequently should have been classified based on the description of their business or services provided to the government. For example, if they were offering accounting or legal services to the government and would have had reported such services instead of reporting 'government,' they would have been classified in Industry 54 - Professional, scientific and technical Services. If they were offering a medical service such as self-employed physicians and would have had reported such services instead of government, they would have been classified in Industry 62 - Health care and social assistance.
F.4 Youth labour force status
Both the National Household Survey (NHS) and the Labour Force Survey (LFS) collect data on the labour force status of the Canadian population. However, there are a number of conceptual differences between the two surveys. For more information on the general comparability of the NHS and Labour Force Survey data refer to the National Household Survey Dictionary, Catalogue no. 99-000-X, Appendix 2.1.
In addition to the information provided in the appendix, data users should be aware that in May 2011, the reference periods between the two surveys had a gap of two weeks. The NHS reference period was from May 1 to May 7, 2011, whereas the reference period of the LFS was from May 15 to May 21, 2011.
This gap in reference periods occurred during a strategic time of the year for youth as the academic year ended in May; job searching and hiring for the summer began. Most noticeably, employment rates for individuals aged 15 to 24 showed a discrepancy between the two surveys for May 2011.
G Place of Work and Mode of Transportation
The National Household Survey assumes that the commute to work originates from the usual place of residence, but this may not always be the case. In some cases, respondents may be on a business trip and may have reported their place of work or mode of transportation based on where they were working during the trip. Some persons maintain a residence close to work and commute to their home on weekends. Students often work after school at a location near their school. As a result, the data may show unusual commutes and an unusual mode of transportation.
H Income
H.1 Income data
The 2011 NHS collected income information from all individuals 15 years and over in private households. In order to reduce respondent burden and improve the quality of the income data, the 2011 NHS provided

Canadians with the option of granting permission to retrieve income information directly from their tax records. Those who did not select this option were requested to provide the income information on the paper form or via the Internet. With over 70% of the respondents giving permission to retrieve tax information and with the precision of the tax data, privacy protection measures must be applied to the PUMF. All users should be aware of the rounding and replacement of extreme values described in the following section.
NHS income statistics are subject to sampling variability. Although such sampling variability may be quite small for large population groups, its effects cannot be ignored in the case of very small subgroups of population in an area or in a particular category. This is because, all other things being equal, the larger the sample size, the smaller the error. For this reason, published income data for areas below the provincial level, where the private household population was less than 250 or the number of households was less than 40, have been suppressed. The users of this microdata file are strongly advised to exercise caution in the interpretation of statistics based on relatively small totals.
When the user is interested in concepts that do not require the presence of all family or household members, the Individuals File, 2011 National Household Survey (Public Use Microdata Files) Catalogue no. 99M0001X may be a more appropriate tool. Its larger sample size permits greater statistical precision in estimates and more detail in the sources of income variables.
The majority of the income concepts covered by in the 2011 NHS can also be found in the long-form sample of the 2006 Census. Due to differences in survey methodologies, users should exercise caution when comparing income statistics between the 2011 NHS PUMF and the 2006 Census PUMF.
For more information about comparability and data quality of income data, please refer to the 2011 NHS Income Reference Guide Catalogue no. 99-014-XWE2011006
http://www12.statcan.gc.ca/nhs-enm/2011/ref/guides/99-014-x/99-014-x2011006-eng.cfm
For more information about the methodological differences between the voluntary NHS and the mandatory Census, please refer to the NHS User Guide Catalogue no. 99-001-x2011001
http://www12.statcan.gc.ca/nhs-enm/2011/ref/nhs-enm_guide/index-eng.cfm
H.2 Random rounding and adjustment of extreme values for income and shelter costs
In planning this microdata file, it was deemed essential that the procedures used to create the file make it impossible to identify an individual, family or household from its income or any other quantitative data. To accomplish this, incomes and shelter costs in the records selected to be part of this microdata file underwent the rounding and extreme value adjustment procedures described below. These procedures minimize the impact on quality. As well, they have been applied at the dwelling level for the shelter cost variables, at the economic family unit level for the EFDIMBM variable, and at the individual level for the other income variables.
First, since a very large portion of the incomes in the file are from tax files, all values for these variables required rounding. The GTRFS variable was rounded with a base of 100. The TOTINC, MRKINC, EMPIN, INCTAX, TOTINC_AT and EFDIMBM variables were rounded with a base of 1,000. If the value of a variable was higher than 100,000, the rounding base used was increased to 10,000. If a value higher than 0 would have been rounded to 0 through the random procedure, the value 1 was assigned instead. Similarly, when a value below 0 would have been rounded to 0, the value -1 was assigned. This was done to maintain the applicability condition of the income sources and to preserve the same number of negative, null and positive values before and after random rounding. Since the random rounding was done independently by variable, some relations between income sources are no longer valid. However, this rounding technique maintains the statistical nature of the data. As for the shelter cost variables, the rounding base for the VALUE variable was set at 10,000. The rounding base for the OMP and GROSRT variables was set at 100 and that of the FCOND variable was set at 50.
Second, large incomes and shelter costs were top-coded to eliminate all possibility of disclosure. Values for shelter costs (VALUE, OMP, GROSRT and FCOND) were top-coded when they were higher than a
certain threshold. This threshold is the weighted 90th percentile for a dwelling’s geographical region rounded down using the rounding bases given in the previous paragraph. The replacement value for the top-coded values was set at the weighted average of the top-coded values for the geographical region. The thresholds and replacement values were calculated from the set of all NHS respondents. Thus, calculating the weighted sum of all values of a particular variable in a given geographical region yields a sum comparable to the sum that would be produced if no top-coding had been done on the data.
For incomes other than the EFDIMBM variable, values higher than the rounded-down 99th weighted percentile for an individual’s respective area and gender were top-coded. Some supplementary top-coding was necessary to eliminate the possibility of residual disclosure. The replacement value was set to the weighted average of all the records requiring top-coding for the given variable. As well, some negative values, that is, values below a threshold, were bottom-coded using the standard method. The replacement value was the threshold. This threshold was set to -30,000 for females and for males in the Atlantic Region and the territories. For other individuals, it was set to -50,000.
For the EFDIMBM variable, values greater than the rounded-down 98th weighted percentile were top-coded independently by region and according to whether it was an economic family or a person not in an economic family. The replacement value was the weighted average over the threshold. Some negative values were also bottom-coded using the threshold as the replacement value. The threshold was set to -30,000 for the Atlantic Region and the territories, and -50,000 in the rest of Canada. Since the top-coding was done independently by quantitative variable, some relations between income variables (in the form of amount, low income flag or decile) are no longer valid.
Tables 1A to 1H below show the thresholds and replacement values used in the top-coding of large values.
Tables 2 and 3 provide comparative assessments of estimates from the National Household Survey master file and the public use microdata file.
Table 2 compares the number of recipients and the median and average income received by source at the individual level. Table 3 provides total income and after-tax income distributional statistics with various levels of hierarchical aggregation (household, economic family and census family) for Canada-level estimates.

Table 1A Condominium fees (FCOND), gross rent (GROSRT), owner’s major payments (OMP) and value of dwelling (VALUE)
Geography
FCOND GROSRT OMP VALUE
Threshold Replacement
value Threshold
Replacement value
Threshold Replacement
value Threshold
Replacement value
Newfoundland and Labrador 300 415 1,000 1,301 1,500 1,914 350,000 537,978
Prince Edward Island 300 408 1,000 1,185 1,500 1,926 270,000 417,218
Nova Scotia 450 573 1,100 1,411 1,600 2,105 350,000 574,615
New Brunswick 300 510 900 1,144 1,400 1,866 260,000 387,179
Montréal (CMA) 350 545 1,100 1,454 1,900 2,488 500,000 820,690
Quebec (other) 300 521 900 1,223 1,400 1,823 300,000 459,390
Toronto (CMA) 700 812 1,600 2,016 2,500 3,221 780,000 1,205,546
Ontario (other) 500 636 1,200 1,529 2,000 2,546 450,000 692,840
Manitoba 450 615 1,000 1,297 1,600 2,094 380,000 538,591
Saskatchewan 350 462 1,300 1,696 1,700 2,195 450,000 668,470
Calgary (CMA) 450 571 1,700 2,070 2,400 3,051 700,000 1,141,021
Edmonton (CMA) 400 528 1,600 1,937 2,300 2,853 600,000 903,897
Alberta (other) 350 435 1,600 2,174 2,200 2,835 590,000 849,535
Vancouver (CMA) 400 529 1,600 2,075 2,700 3,576 1,200,000 1,978,811
British Columbia (other) 300 387 1,400 1,808 2,000 2,601 680,000 997,622
Yukon, Northwest Territories and Nunavut
550 681 1,700 2,062 2,500 3,094 500,000 740,294
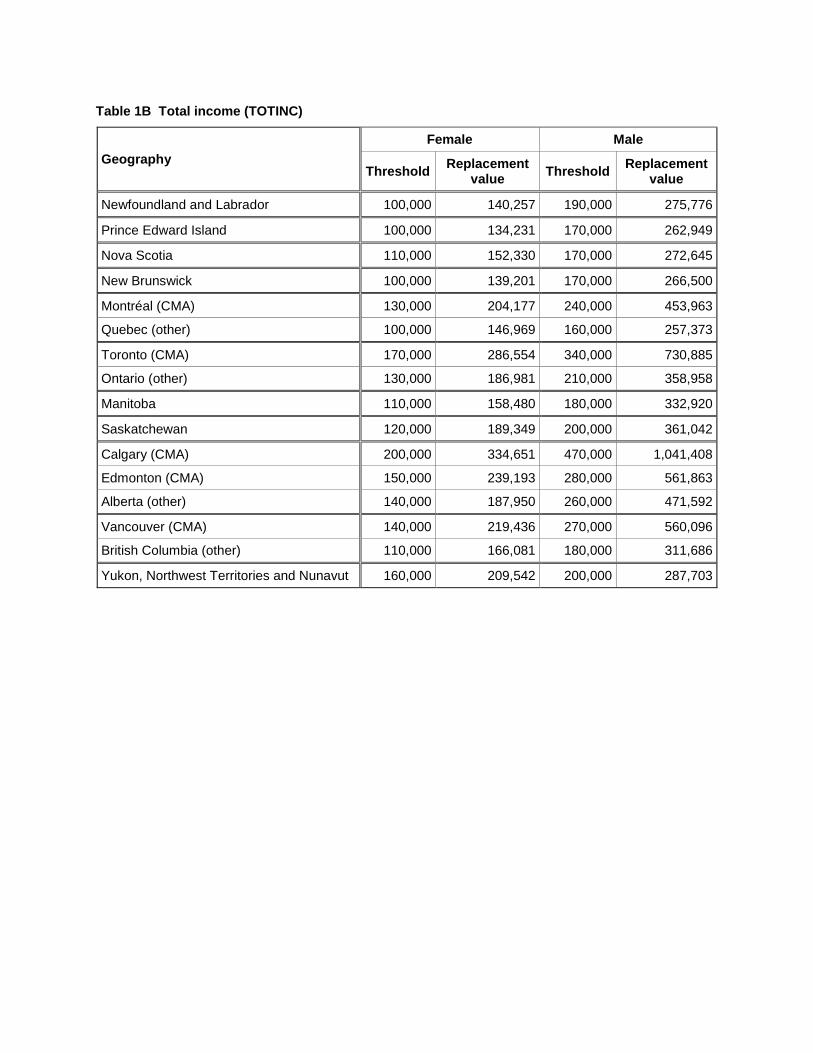
Table 1B Total income (TOTINC)
Geography
Female Male
Threshold Replacement
value Threshold
Replacement value
Newfoundland and Labrador 100,000 140,257 190,000 275,776
Prince Edward Island 100,000 134,231 170,000 262,949
Nova Scotia 110,000 152,330 170,000 272,645
New Brunswick 100,000 139,201 170,000 266,500
Montréal (CMA) 130,000 204,177 240,000 453,963
Quebec (other) 100,000 146,969 160,000 257,373
Toronto (CMA) 170,000 286,554 340,000 730,885
Ontario (other) 130,000 186,981 210,000 358,958
Manitoba 110,000 158,480 180,000 332,920
Saskatchewan 120,000 189,349 200,000 361,042
Calgary (CMA) 200,000 334,651 470,000 1,041,408
Edmonton (CMA) 150,000 239,193 280,000 561,863
Alberta (other) 140,000 187,950 260,000 471,592
Vancouver (CMA) 140,000 219,436 270,000 560,096
British Columbia (other) 110,000 166,081 180,000 311,686
Yukon, Northwest Territories and Nunavut 160,000 209,542 200,000 287,703
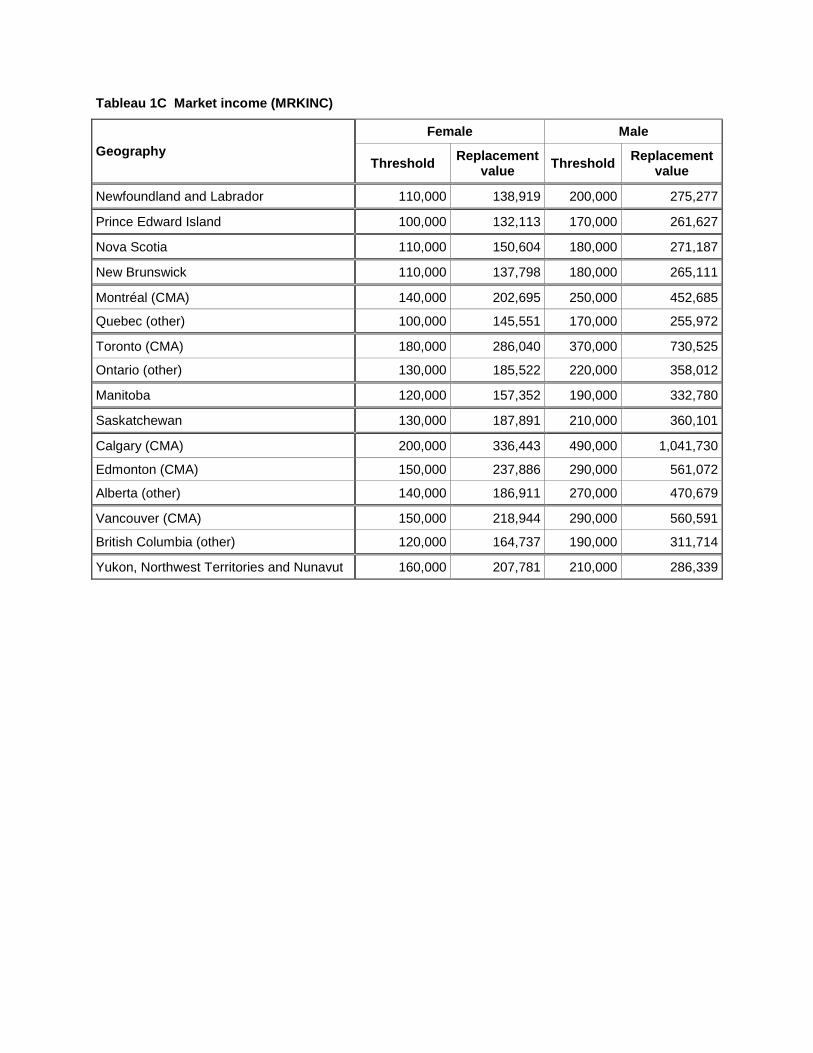
Tableau 1C Market income (MRKINC)
Geography
Female Male
Threshold Replacement
value Threshold
Replacement value
Newfoundland and Labrador 110,000 138,919 200,000 275,277
Prince Edward Island 100,000 132,113 170,000 261,627
Nova Scotia 110,000 150,604 180,000 271,187
New Brunswick 110,000 137,798 180,000 265,111
Montréal (CMA) 140,000 202,695 250,000 452,685
Quebec (other) 100,000 145,551 170,000 255,972
Toronto (CMA) 180,000 286,040 370,000 730,525
Ontario (other) 130,000 185,522 220,000 358,012
Manitoba 120,000 157,352 190,000 332,780
Saskatchewan 130,000 187,891 210,000 360,101
Calgary (CMA) 200,000 336,443 490,000 1,041,730
Edmonton (CMA) 150,000 237,886 290,000 561,072
Alberta (other) 140,000 186,911 270,000 470,679
Vancouver (CMA) 150,000 218,944 290,000 560,591
British Columbia (other) 120,000 164,737 190,000 311,714
Yukon, Northwest Territories and Nunavut 160,000 207,781 210,000 286,339
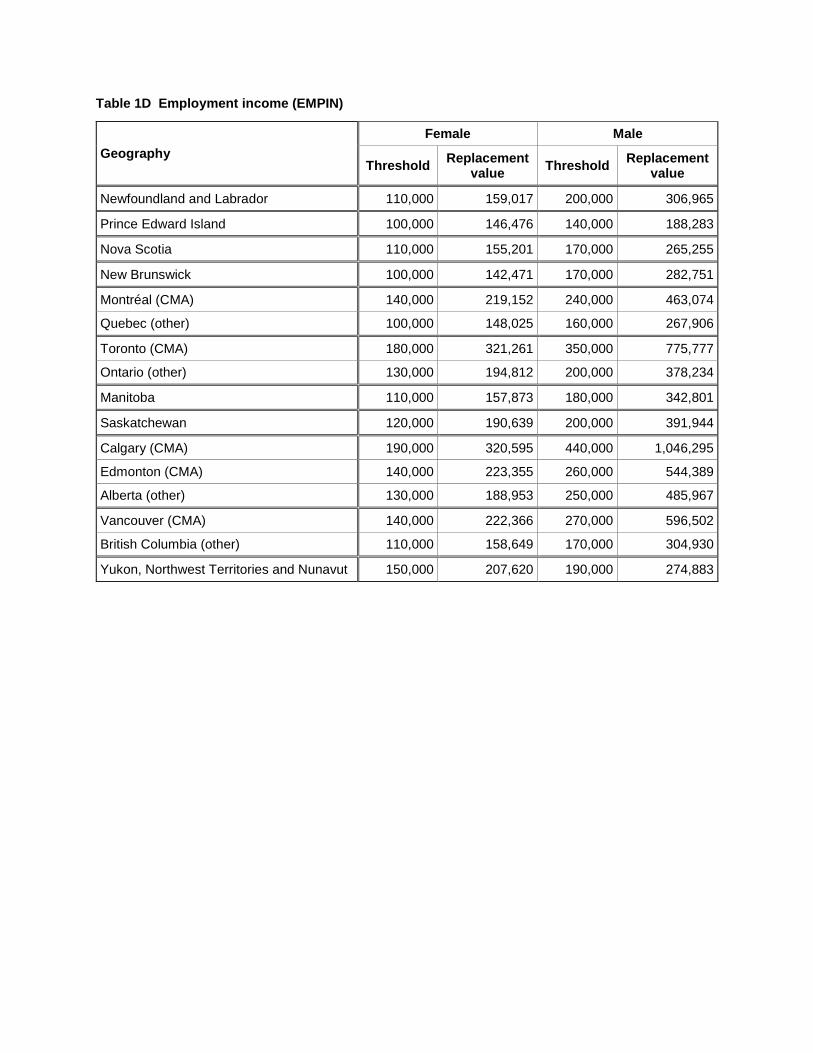
Table 1D Employment income (EMPIN)
Geography
Female Male
Threshold Replacement
value Threshold
Replacement value
Newfoundland and Labrador 110,000 159,017 200,000 306,965
Prince Edward Island 100,000 146,476 140,000 188,283
Nova Scotia 110,000 155,201 170,000 265,255
New Brunswick 100,000 142,471 170,000 282,751
Montréal (CMA) 140,000 219,152 240,000 463,074
Quebec (other) 100,000 148,025 160,000 267,906
Toronto (CMA) 180,000 321,261 350,000 775,777
Ontario (other) 130,000 194,812 200,000 378,234
Manitoba 110,000 157,873 180,000 342,801
Saskatchewan 120,000 190,639 200,000 391,944
Calgary (CMA) 190,000 320,595 440,000 1,046,295
Edmonton (CMA) 140,000 223,355 260,000 544,389
Alberta (other) 130,000 188,953 250,000 485,967
Vancouver (CMA) 140,000 222,366 270,000 596,502
British Columbia (other) 110,000 158,649 170,000 304,930
Yukon, Northwest Territories and Nunavut 150,000 207,620 190,000 274,883

Table 1E Total government transfers (GTRFS)
Geography
Female Male
Threshold Replacement
value Threshold
Replacement value
Newfoundland and Labrador 27,000 32,434 31,000 40,384
Prince Edward Island 25,700 29,655 27,300 35,582
Nova Scotia 24,100 29,588 29,800 38,086
New Brunswick 24,800 29,265 26,000 31,972
Montréal (CMA) 28,500 34,113 24,400 32,876
Quebec (other) 28,200 33,693 27,600 35,508
Toronto (CMA) 26,200 32,588 25,100 33,515
Ontario (other) 27,300 35,130 27,800 36,654
Manitoba 25,900 32,977 22,600 30,447
Saskatchewan 25,700 32,656 24,500 32,037
Calgary (CMA) 23,700 28,963 24,700 31,366
Edmonton (CMA) 24,700 31,629 25,700 35,140
Alberta (other) 24,000 31,035 26,200 35,206
Vancouver (CMA) 23,000 27,651 24,500 35,110
British Columbia (other) 24,600 30,746 29,800 41,104
Yukon, Northwest Territories and Nunavut 28,700 35,959 27,000 41,473

Table 1F Income tax (INCTAX)
Geography
Female Male
Threshold Replacement
value Threshold
Replacement value
Newfoundland and Labrador 32,000 55,146 64,000 112,165
Prince Edward Island 31,000 59,735 54,000 102,743
Nova Scotia 34,000 59,978 61,000 132,549
New Brunswick 29,000 48,758 58,000 110,158
Montréal (CMA) 49,000 91,358 100,000 212,293
Quebec (other) 32,000 58,616 59,000 116,357
Toronto (CMA) 69,000 149,110 160,000 370,496
Ontario (other) 40,000 73,723 78,000 165,655
Manitoba 37,000 66,186 69,000 148,672
Saskatchewan 40,000 80,072 73,000 163,743
Calgary (CMA) 66,000 135,790 170,000 418,865
Edmonton (CMA) 45,000 92,371 94,000 225,576
Alberta (other) 41,000 71,208 89,000 201,799
Vancouver (CMA) 49,000 100,617 110,000 271,118
British Columbia (other) 32,000 64,976 62,000 128,997
Yukon, Northwest Territories and Nunavut 47,000 72,000 65,000 101,032

Table 1G After-tax income (TOTINC_AT)
Geography
Female Male
Threshold Replacement
value Threshold
Replacement value
Newfoundland and Labrador 84,000 104,375 140,000 199,401
Prince Edward Island 78,000 101,040 120,000 196,410
Nova Scotia 86,000 115,130 120,000 185,367
New Brunswick 82,000 107,595 120,000 188,498
Montréal (CMA) 99,000 143,732 160,000 305,134
Quebec (other) 79,000 109,462 110,000 178,004
Toronto (CMA) 120,000 197,570 220,000 473,760
Ontario (other) 99,000 139,808 140,000 246,876
Manitoba 90,000 117,069 130,000 229,529
Saskatchewan 98,000 140,551 140,000 254,250
Calgary (CMA) 140,000 252,384 320,000 745,809
Edmonton (CMA) 110,000 181,692 200,000 407,199
Alberta (other) 100,000 144,727 190,000 341,306
Vancouver (CMA) 110,000 168,655 190,000 393,124
British Columbia (other) 94,000 130,841 140,000 230,323
Yukon, Northwest Territories and Nunavut 120,000 156,876 150,000 212,855
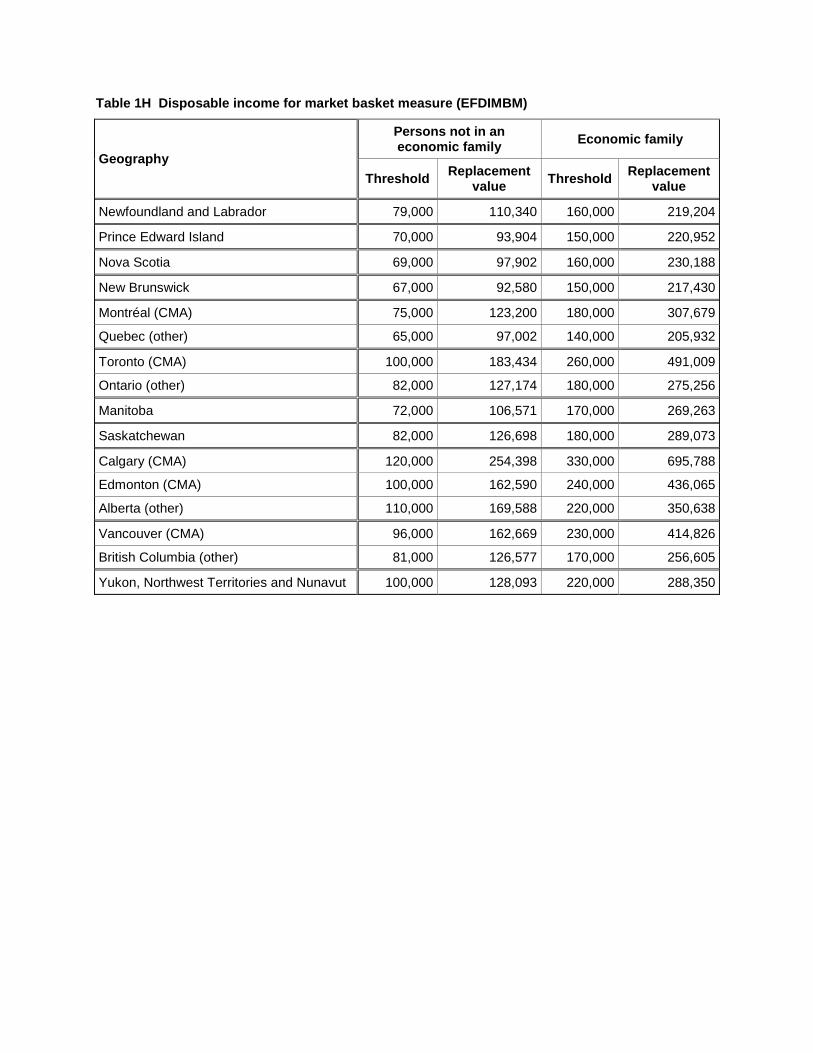
Table 1H Disposable income for market basket measure (EFDIMBM)
Geography
Persons not in an economic family
Economic family
Threshold Replacement
value Threshold
Replacement value
Newfoundland and Labrador 79,000 110,340 160,000 219,204
Prince Edward Island 70,000 93,904 150,000 220,952
Nova Scotia 69,000 97,902 160,000 230,188
New Brunswick 67,000 92,580 150,000 217,430
Montréal (CMA) 75,000 123,200 180,000 307,679
Quebec (other) 65,000 97,002 140,000 205,932
Toronto (CMA) 100,000 183,434 260,000 491,009
Ontario (other) 82,000 127,174 180,000 275,256
Manitoba 72,000 106,571 170,000 269,263
Saskatchewan 82,000 126,698 180,000 289,073
Calgary (CMA) 120,000 254,398 330,000 695,788
Edmonton (CMA) 100,000 162,590 240,000 436,065
Alberta (other) 110,000 169,588 220,000 350,638
Vancouver (CMA) 96,000 162,669 230,000 414,826
British Columbia (other) 81,000 126,577 170,000 256,605
Yukon, Northwest Territories and Nunavut 100,000 128,093 220,000 288,350

Table 2 Comparison of individual income statistics for persons in private households, NHS and Hierarchical PUMF
Hierarchical PUMF estimates
NHS estimates
PUMF to NHS ratio
Persons in private households 32,747,981 32,852,325 99.7%
Count with total income 25,696,474 25,918,505 99.1%
Median total income 30,000 29,878 100.4%
Average total income 40,709 40,650 100.1%
Count with market income 22,320,561 22,498,990 99.2%
Median market income 30,000 29,936 100.2%
Average market income 41,053 41,024 100.1%
Count with employment income 18,664,311 18,820,315 99.2%
Median employment income 32,000 31,603 101.3%
Average employment income 41,899 41,795 100.2%
Count with total government transfer payments 18,906,242 19,070,830 99.1%
Median total government transfer payments 4,100 4,104 99.9%
Average total government transfer payments 6,863 6,848 100.2%
Count with income tax paid 17,256,288 17,352,675 99.4%
Median income tax paid 5,000 5,389 92.8%
Average income tax paid 9,951 9,942 100.1%
Count with after-tax income 25,692,441 25,914,885 99.1%
Median after-tax income 27,000 27,334 98.8%
Average after-tax income 34,065 33,998 100.2%

Table 3 Comparison of income statistics for various aggregate units in private households, NHS and Hierarchical PUMF
Hierarchical PUMF estimates
NHS estimates
PUMF to NHS ratio
Private households 13,317,308 13,319,250 100.0%
Median household total income 61,000 61,072 99.9%
Average household total income 78,907 79,102 99.8%
Median after-tax income of households 54,000 54,089 99.8%
Average after-tax income of households 66,018 66,149 99.8%
Economic families 9,244,094 9,254,160 99.9%
Median economic family income 77,000 76,511 100.6%
Average economic family income 93,927 94,125 99.8%
Median after-tax income of economic families 67,000 67,044 99.9%
Average after-tax income of economic families 78,438 78,517 99.9%
Persons not in economic families aged 15 years or over
4,911,484 4,903,505 100.2%
Median total income for persons aged 15 years or over not in economic families
28,000 28,018 99.9%
Average total income for persons aged 15 years or over not in economic families
37,414 37,225 100.5%
Median after-tax income for persons aged 15 years or over not in economic families
26,000 25,761 100.9%
Average after-tax income for persons aged 15 years or over not in economic families
31,579 31,497 100.3%
Census families 9,372,632 9,387,475 99.8%
Median census family income 74,000 73,498 100.7%
Average census family income 90,962 90,926 100.0%
Median after-tax income of census families 65,000 64,543 100.7%
Average after-tax income of census families 75,871 75,756 100.2%
Persons not in census families aged 15 years and over
5,594,709 5,580,905 100.2%
Median census family income for persons aged 15 years and over not in census families
27,000 26,416 102.2%
Average census family income for persons aged 15 years and over not in census families
36,069 35,839 100.6%
Median after-tax income for persons aged 15 years and over not in census families
25,000 24,602 101.6%
Average after-tax income for persons aged 15 years and over not in census families
30,566 30,442 100.4%

Appendix A Countries and area of interest disseminated in the 2011 National Household Survey
In Canada
Outside Canada o Americas
North America
Saint Pierre and Miquelon
United States Central America
Belize
Costa Rica
El Salvador
Guatemala
Honduras
Mexico
Nicaragua
Panama Caribbean and Bermuda
Anguilla
Antigua and Barbuda
Aruba
Bahamas
Barbados
Bermuda
Cayman Islands
Cuba
Curaçao
Dominica
Dominican Republic
Grenada
Guadeloupe
Haiti
Jamaica
Martinique
Montserrat
Puerto Rico
Saint Kitts and Nevis
Saint Lucia
Saint Vincent and the Grenadines
Sint Maarten (Dutch part)
Trinidad and Tobago
Turks and Caicos Islands
Virgin Islands, British
Virgin Islands, United States South America
Argentina
Bolivia 1
Brazil
Chile
Colombia
Ecuador
French Guiana
Guyana
Paraguay
Peru
Suriname
Uruguay
Venezuela 2
Americas, n.i.e. 3
o Europe Western Europe
Austria
Belgium
France
Germany
Luxembourg
Monaco
Netherlands
Switzerland Eastern Europe
Belarus
Bulgaria
Czech Republic
Estonia
Hungary
Latvia
Lithuania
Moldova 4
Poland
Romania
Russian Federation
Slovakia
Ukraine Northern Europe
Denmark
Faroe Islands
Finland
Guernsey
Iceland
Ireland, Republic of
Isle of Man
Jersey
Norway
Sweden
United Kingdom 5
Southern Europe
Albania
Bosnia and Herzegovina
Croatia
Gibraltar
Greece
Italy

Kosovo 6
Macedonia, Republic of 7
Malta
Montenegro
Portugal
Serbia
Slovenia
Spain Europe, n.i.e.
8
o Africa Western Africa
Benin
Burkina Faso
Cape Verde
Côte d'Ivoire
Gambia
Ghana
Guinea
Guinea-Bissau
Liberia
Mali
Mauritania
Niger
Nigeria
Senegal
Sierra Leone
Togo Eastern Africa
Burundi
Comoros
Djibouti
Eritrea
Ethiopia
Kenya
Madagascar
Malawi
Mauritius
Mozambique
Réunion
Rwanda
Seychelles
Somalia
Tanzania 9
Uganda
Zambia
Zimbabwe Northern Africa
Algeria
Egypt
Libya 10
Morocco
Sudan
Tunisia

Central Africa
Angola
Cameroon
Central African Republic
Chad
Congo, The Democratic Republic of the
Congo, Republic of the
Equatorial Guinea
Gabon Southern Africa
Botswana
Lesotho
Namibia
South Africa, Republic of
Swaziland Africa, n.i.e.
11
o Asia West Central Asia and the Middle East
Afghanistan
Armenia
Azerbaijan
Bahrain
Cyprus
Georgia
Iran 12
Iraq
Israel
Jordan
Kazakhstan
Kuwait
Kyrgyzstan
Lebanon
Oman
Qatar
Saudi Arabia
Syria 13
Tajikistan
Turkey
Turkmenistan
United Arab Emirates
Uzbekistan
West Bank and Gaza Strip (Palestine) 14
Yemen Eastern Asia
China 15
Hong Kong Special Administrative Region
Japan
Korea, North 16
Korea, South 17
Macao Special Administrative Region
Mongolia
Taiwan Southeast Asia

Brunei Darussalam
Burma (Myanmar)
Cambodia
Indonesia
Laos 18
Malaysia
Philippines
Singapore
Thailand
Viet Nam 19
Southern Asia
Bangladesh
Bhutan
India
Nepal
Pakistan
Sri Lanka Asia, n.i.e.
20
o Oceania Australia Fiji French Polynesia New Caledonia New Zealand Papua New Guinea Samoa Tonga Oceania, n.i.e.
21
o Other
Footnotes
1. The official name of Bolivia is Plurinational State of Bolivia. 2. The official name of Venezuela is Bolivarian Republic of Venezuela. 3. Includes countries such as Bonaire, Saint Eustatius and Saba; Falkland Islands (Malvinas);
Greenland; Saint Barthélemy; Saint Martin (French part); and South Georgia and the South Sandwich Islands.
4. The official name of Moldova is Republic of Moldova. 5. The official name of United Kingdom is United Kingdom of Great Britain and Northern Ireland.
United Kingdom includes Scotland, Wales, England and Northern Ireland (excludes Isle of Man, the Channel Islands and British Overseas Territories).
6. The official name of Kosovo is Republic of Kosovo. 7. Known as Former Yugoslav Republic of Macedonia in the United Nations and other international
bodies. 8. Includes countries such as Åland Islands; Andorra; Holy See (Vatican City State); Liechtenstein;
San Marino; and Svalbard and Jan Mayen Island. 9. The official name of Tanzania is United Republic of Tanzania. 10. The official name of Libya is Libyan Arab Jamahiriya. 11. Includes countries such as Mayotte; Saint Helena; Sao Tome and Principe; and Western Sahara. 12. The official name of Iran is Islamic Republic of Iran. 13. The official name of Syria is Syrian Arab Republic. 14. West Bank and Gaza Strip are the territories referred to in the Declaration of Principles, signed by
Israel and the Palestine Liberation Organization in 1993. Palestine refers to pre-1948 British mandate Palestine.
15. China excludes Hong Kong Special Administrative Region and Macao Special Administrative Region.
16. The official name of North Korea is Democratic People's Republic of Korea. 17. The official name of South Korea is Republic of Korea. 18. The official name of Laos is Lao People's Democratic Republic. 19. The official name of Viet Nam is Socialist Republic of Viet Nam. 20. Includes countries such as British Indian Ocean Territory; Maldives; and Timor-Leste. 21. Includes countries such as American Samoa; Christmas Island; Cocos (Keeling) Islands; Cook
Islands; Guam; Kiribati; Marshall Islands; Micronesia, Federated States of; Nauru; Niue; Norfolk Island; Northern Mariana Islands; Palau; Pitcairn; Solomon Islands; Tokelau; Tuvalu; United States Minor Outlying Islands; Vanuatu; and Wallis and Futuna.
Abbreviation
n.i.e. = not included elsewhere

Appendix B Mother tongue and home language: 2011 National Household Survey classification
Please note that in the second part of the question on home language, the respondent had the option of marking the 'No' circle to indicate that there was no other language spoken on a regular basis.
English
French
Non-official languages
Aboriginal languages
Algonquian languages
Algonquin
Atikamekw
Blackfoot
Cree languages
Cree, n.o.s.
Swampy Cree
Plains Cree
Woods Cree
Cree, n.i.e.
Malecite
Mi'kmaq
Innu/Montagnais
Naskapi
Ojibway
Oji-Cree
Algonquian languages, n.i.e.
Michif
Athapaskan languages
Carrier
Wetsuweten
Chilcotin
Dene
Tlicho (Dogrib)
Gwich'in
North Slavey (Hare)
South Slavey
Slavey, n.o.s.
Sarcee
Beaver
Sekani
Kaska (Nahani)
Tahltan
Northern Tutchone
Southern Tutchone
Tutchone, n.o.s.
Athapaskan languages, n.i.e.
Haida
Iroquoian languages
Mohawk
Cayuga
Oneida
Iroquoian languages, n.i.e.
Kutenai
Salish languages
Shuswap (Secwepemctsin)
Thompson (Ntlakapamux)
Halkomelem
Lillooet
Okanagan
Squamish
Straits
Salish languages, n.i.e.
Siouan languages
Dakota
Stoney
Siouan languages, n.i.e.
Tlingit
Tsimshian languages
Gitksan
Nisga'a
Tsimshian
Wakashan languages
Nootka (Nuu-chah-nulth)
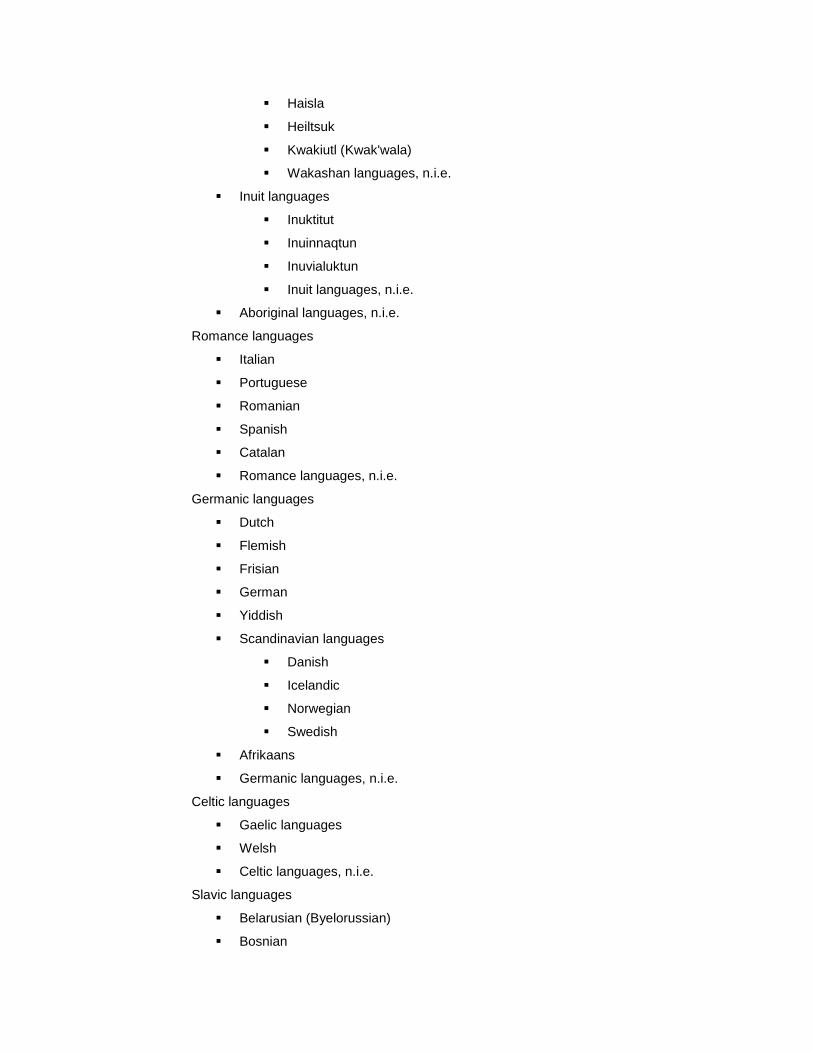
Haisla
Heiltsuk
Kwakiutl (Kwak'wala)
Wakashan languages, n.i.e.
Inuit languages
Inuktitut
Inuinnaqtun
Inuvialuktun
Inuit languages, n.i.e.
Aboriginal languages, n.i.e.
Romance languages
Italian
Portuguese
Romanian
Spanish
Catalan
Romance languages, n.i.e.
Germanic languages
Dutch
Flemish
Frisian
German
Yiddish
Scandinavian languages
Danish
Icelandic
Norwegian
Swedish
Afrikaans
Germanic languages, n.i.e.
Celtic languages
Gaelic languages
Welsh
Celtic languages, n.i.e.
Slavic languages
Belarusian (Byelorussian)
Bosnian
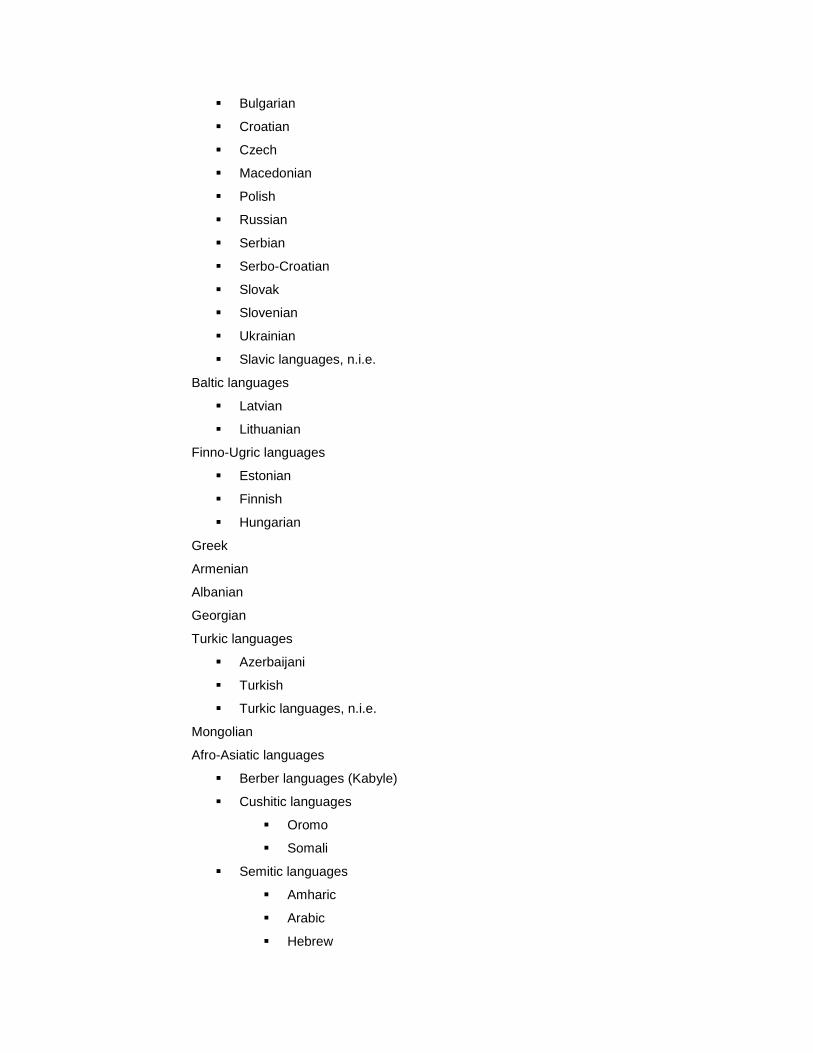
Bulgarian
Croatian
Czech
Macedonian
Polish
Russian
Serbian
Serbo-Croatian
Slovak
Slovenian
Ukrainian
Slavic languages, n.i.e.
Baltic languages
Latvian
Lithuanian
Finno-Ugric languages
Estonian
Finnish
Hungarian
Greek
Armenian
Albanian
Georgian
Turkic languages
Azerbaijani
Turkish
Turkic languages, n.i.e.
Mongolian
Afro-Asiatic languages
Berber languages (Kabyle)
Cushitic languages
Oromo
Somali
Semitic languages
Amharic
Arabic
Hebrew
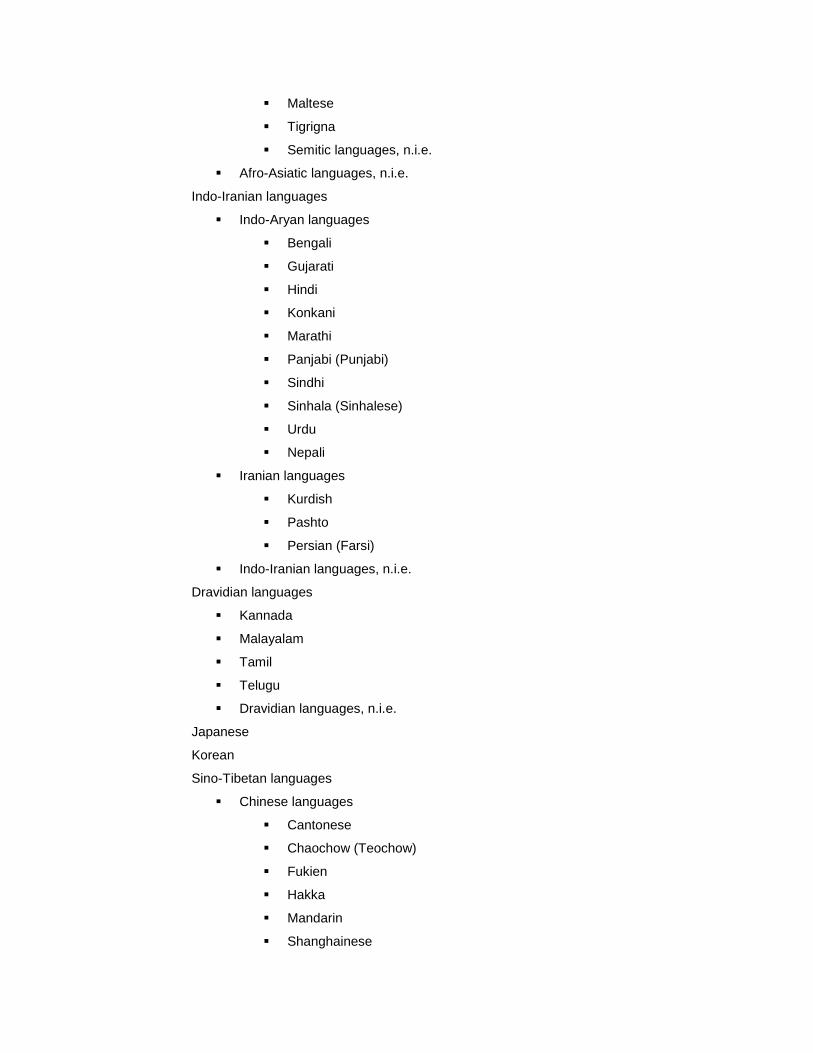
Maltese
Tigrigna
Semitic languages, n.i.e.
Afro-Asiatic languages, n.i.e.
Indo-Iranian languages
Indo-Aryan languages
Bengali
Gujarati
Hindi
Konkani
Marathi
Panjabi (Punjabi)
Sindhi
Sinhala (Sinhalese)
Urdu
Nepali
Iranian languages
Kurdish
Pashto
Persian (Farsi)
Indo-Iranian languages, n.i.e.
Dravidian languages
Kannada
Malayalam
Tamil
Telugu
Dravidian languages, n.i.e.
Japanese
Korean
Sino-Tibetan languages
Chinese languages
Cantonese
Chaochow (Teochow)
Fukien
Hakka
Mandarin
Shanghainese

Taiwanese
Chinese, n.o.s. 1
Tibetan languages
Burmese
Sino-Tibetan languages, n.i.e.
Tai languages
Lao
Thai
Austro-Asiatic languages
Khmer (Cambodian)
Vietnamese
Malayo-Polynesian languages
Bisayan languages
Ilocano
Malay
Pampango
Tagalog (Pilipino, Filipino)
Bikol
Malagasy
Fijian
Pangasinan
Malayo-Polynesian languages, n.i.e.
Niger-Congo languages
Akan (Twi)
Bantu languages
Lingala
Rundi (Kirundi)
Rwanda (Kinyarwanda)
Shona
Swahili
Ganda
Bantu languages, n.i.e.
Edo
Igbo
Wolof
Bamanankan
Ewe

Ga
Niger-Congo languages, n.i.e.
African languages, n.i.e.
Creoles
Non-verbal languages
American Sign Language
Quebec Sign Language
Sign languages, n.i.e.
Other languages
Footnotes
1. Anyone responding 'Chinese,' with no other precision, along with other dialects, n.o.s.
Abbreviation
n.i.e. = not included elsewhere
n.o.s. = not otherwise specified
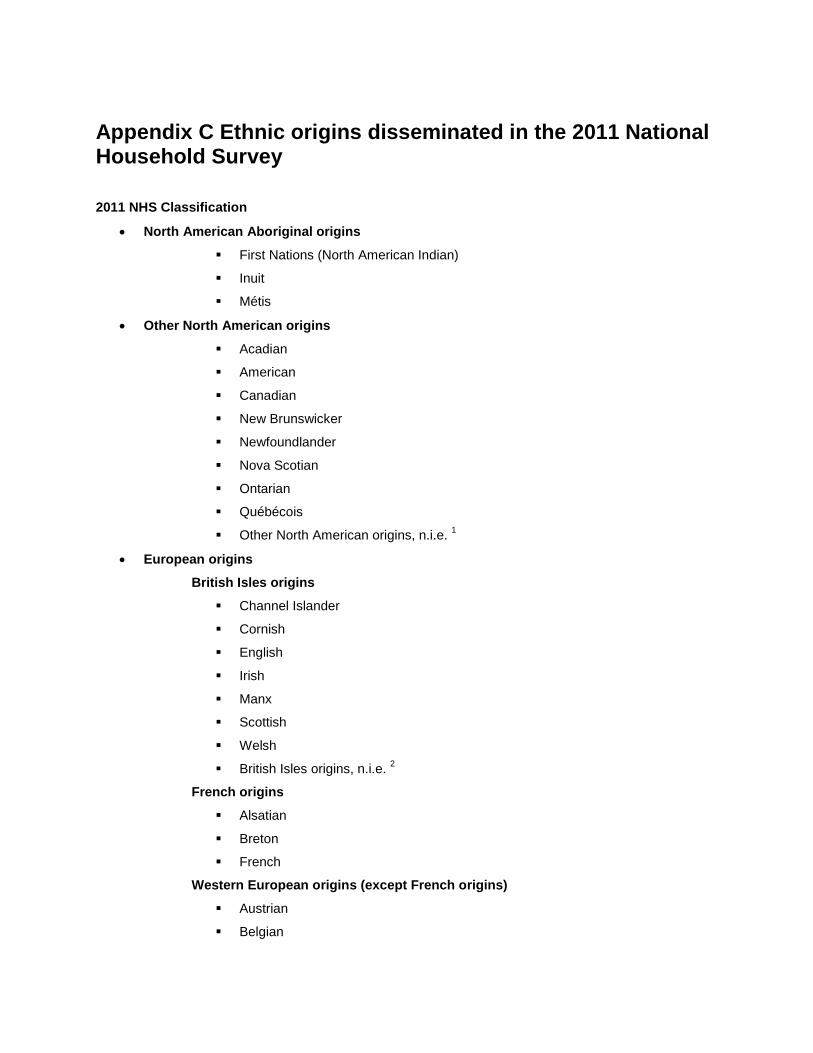
Appendix C Ethnic origins disseminated in the 2011 National Household Survey
2011 NHS Classification
North American Aboriginal origins
First Nations (North American Indian)
Inuit
Métis
Other North American origins
Acadian
American
Canadian
New Brunswicker
Newfoundlander
Nova Scotian
Ontarian
Québécois
Other North American origins, n.i.e. 1
European origins
British Isles origins
Channel Islander
Cornish
English
Irish
Manx
Scottish
Welsh
British Isles origins, n.i.e. 2
French origins
Alsatian
Breton
French
Western European origins (except French origins)
Austrian
Belgian

Dutch
Flemish
Frisian
German
Luxembourger
Swiss
Western European origins, n.i.e. 3
Northern European origins (except British Isles origins)
Danish
Finnish
Icelandic
Norwegian
Swedish
Northern European origins, n.i.e. 4
Eastern European origins
Bulgarian
Byelorussian
Czech
Czechoslovakian, n.o.s.
Estonian
Hungarian
Latvian
Lithuanian
Moldovan
Polish
Romanian
Russian
Slovak
Ukrainian
Eastern European origins, n.i.e. 5
Southern European origins
Albanian
Bosnian
Croatian
Cypriot
Greek
Italian
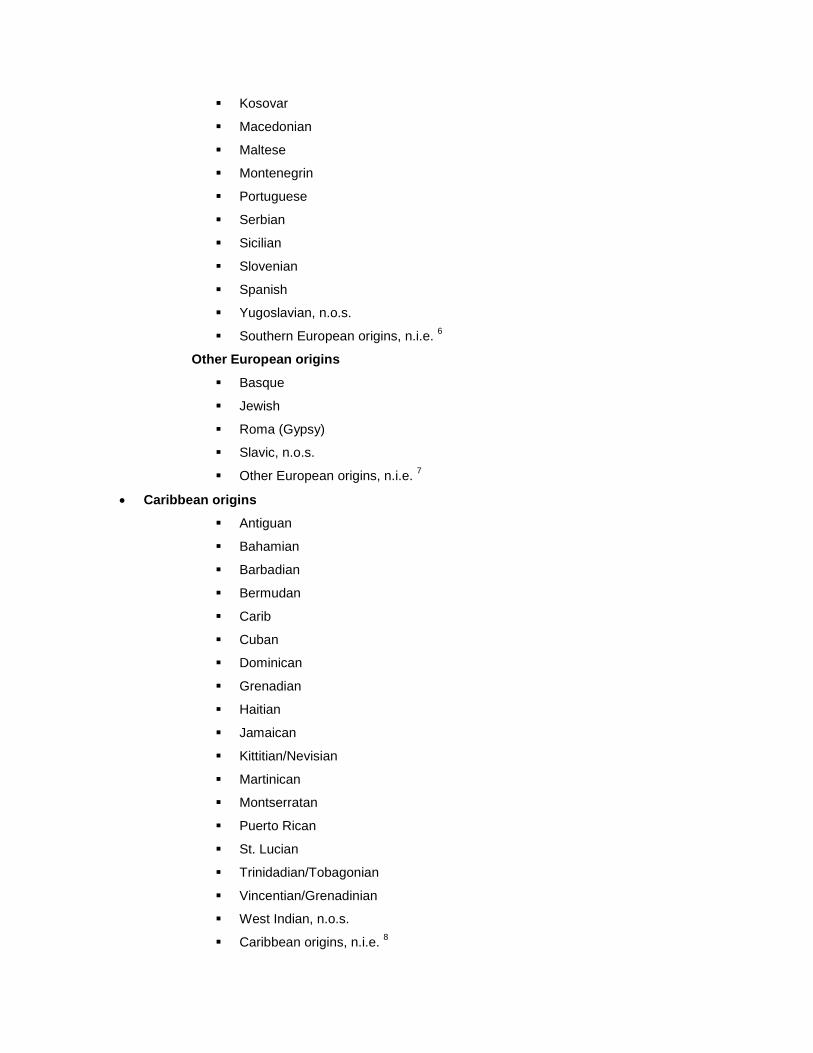
Kosovar
Macedonian
Maltese
Montenegrin
Portuguese
Serbian
Sicilian
Slovenian
Spanish
Yugoslavian, n.o.s.
Southern European origins, n.i.e. 6
Other European origins
Basque
Jewish
Roma (Gypsy)
Slavic, n.o.s.
Other European origins, n.i.e. 7
Caribbean origins
Antiguan
Bahamian
Barbadian
Bermudan
Carib
Cuban
Dominican
Grenadian
Haitian
Jamaican
Kittitian/Nevisian
Martinican
Montserratan
Puerto Rican
St. Lucian
Trinidadian/Tobagonian
Vincentian/Grenadinian
West Indian, n.o.s.
Caribbean origins, n.i.e. 8
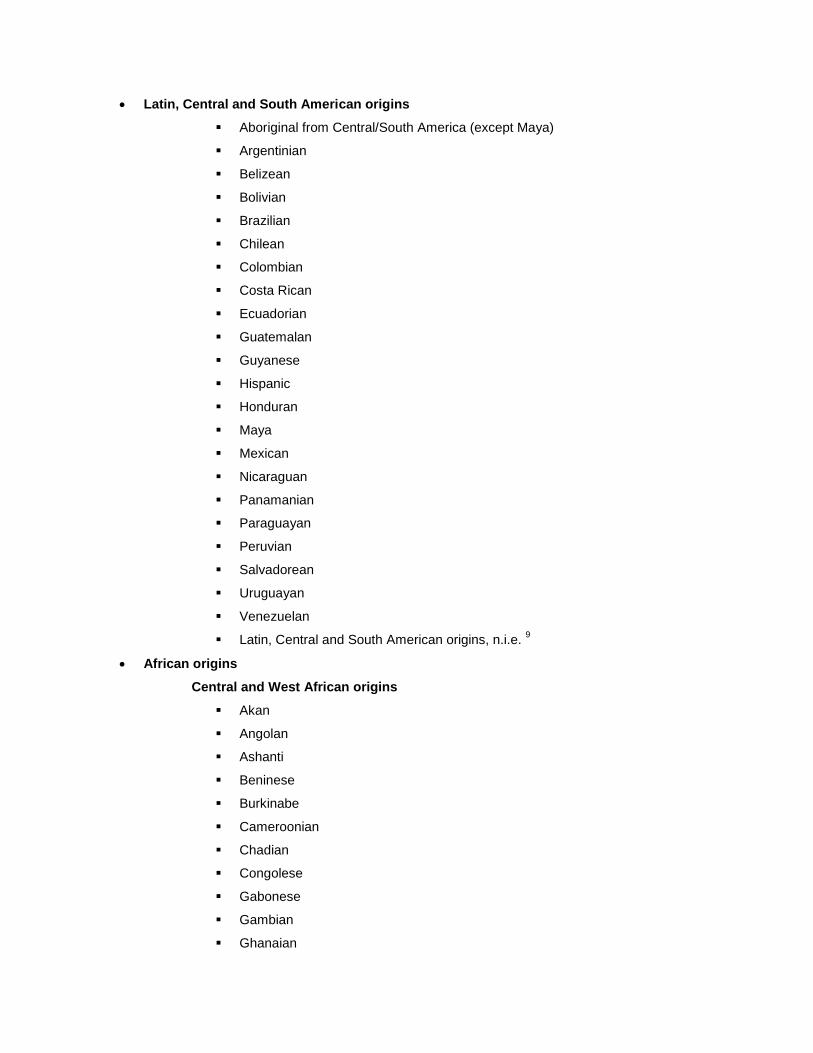
Latin, Central and South American origins
Aboriginal from Central/South America (except Maya)
Argentinian
Belizean
Bolivian
Brazilian
Chilean
Colombian
Costa Rican
Ecuadorian
Guatemalan
Guyanese
Hispanic
Honduran
Maya
Mexican
Nicaraguan
Panamanian
Paraguayan
Peruvian
Salvadorean
Uruguayan
Venezuelan
Latin, Central and South American origins, n.i.e. 9
African origins
Central and West African origins
Akan
Angolan
Ashanti
Beninese
Burkinabe
Cameroonian
Chadian
Congolese
Gabonese
Gambian
Ghanaian
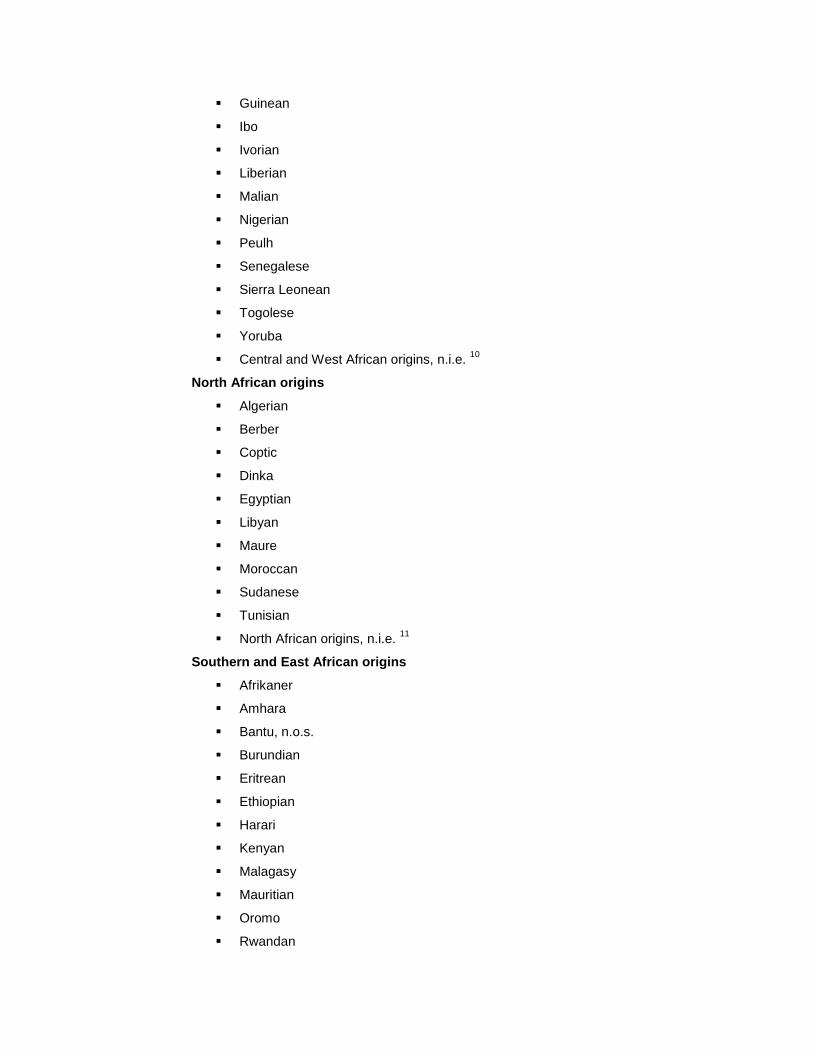
Guinean
Ibo
Ivorian
Liberian
Malian
Nigerian
Peulh
Senegalese
Sierra Leonean
Togolese
Yoruba
Central and West African origins, n.i.e. 10
North African origins
Algerian
Berber
Coptic
Dinka
Egyptian
Libyan
Maure
Moroccan
Sudanese
Tunisian
North African origins, n.i.e. 11
Southern and East African origins
Afrikaner
Amhara
Bantu, n.o.s.
Burundian
Eritrean
Ethiopian
Harari
Kenyan
Malagasy
Mauritian
Oromo
Rwandan

Seychellois
Somali
South African
Tanzanian
Tigrian
Ugandan
Zambian
Zimbabwean
Zulu
Southern and East African origins, n.i.e. 12
Other African origins
Black, n.o.s. 13
Other African origins, n.i.e. 14
Asian origins
West Central Asian and Middle Eastern origins
Afghan
Arab, n.o.s.
Armenian
Assyrian
Azerbaijani
Georgian
Iranian
Iraqi
Israeli
Jordanian
Kazakh
Kurd
Kuwaiti
Lebanese
Palestinian
Pashtun
Saudi Arabian
Syrian
Tajik
Tatar
Turk
Uighur

Uzbek
Yemeni
West Central Asian and Middle Eastern origins, n.i.e. 15
South Asian origins
Bangladeshi
Bengali
East Indian 13
Goan
Gujarati
Kashmiri
Nepali
Pakistani
Punjabi
Sinhalese
Sri Lankan
Tamil
South Asian origins, n.i.e. 16
East and Southeast Asian origins
Burmese
Cambodian (Khmer)
Chinese
Filipino
Hmong
Indonesian
Japanese
Korean
Laotian
Malaysian
Mongolian
Singaporean
Taiwanese
Thai
Tibetan
Vietnamese
East and Southeast Asian origins, n.i.e. 17
Other Asian origins
Other Asian origins, n.i.e. 18
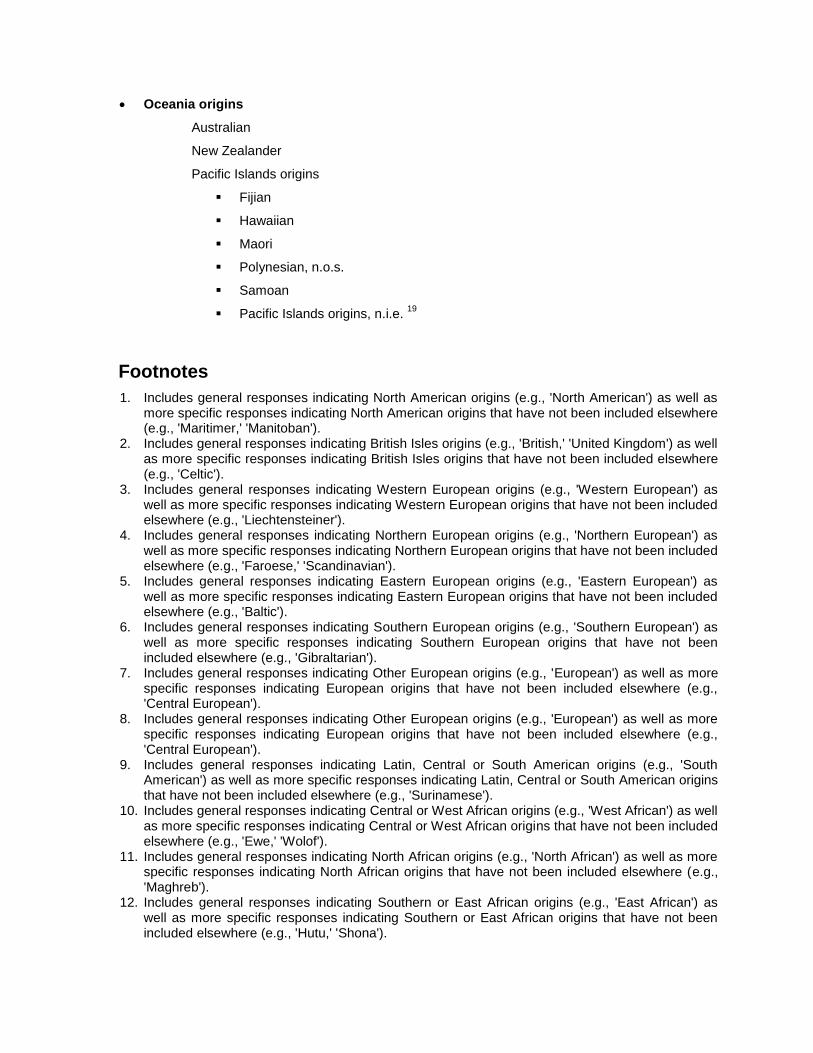
Oceania origins
Australian
New Zealander
Pacific Islands origins
Fijian
Hawaiian
Maori
Polynesian, n.o.s.
Samoan
Pacific Islands origins, n.i.e. 19
Footnotes
1. Includes general responses indicating North American origins (e.g., 'North American') as well as more specific responses indicating North American origins that have not been included elsewhere (e.g., 'Maritimer,' 'Manitoban').
2. Includes general responses indicating British Isles origins (e.g., 'British,' 'United Kingdom') as well as more specific responses indicating British Isles origins that have not been included elsewhere (e.g., 'Celtic').
3. Includes general responses indicating Western European origins (e.g., 'Western European') as well as more specific responses indicating Western European origins that have not been included elsewhere (e.g., 'Liechtensteiner').
4. Includes general responses indicating Northern European origins (e.g., 'Northern European') as well as more specific responses indicating Northern European origins that have not been included elsewhere (e.g., 'Faroese,' 'Scandinavian').
5. Includes general responses indicating Eastern European origins (e.g., 'Eastern European') as well as more specific responses indicating Eastern European origins that have not been included elsewhere (e.g., 'Baltic').
6. Includes general responses indicating Southern European origins (e.g., 'Southern European') as well as more specific responses indicating Southern European origins that have not been included elsewhere (e.g., 'Gibraltarian').
7. Includes general responses indicating Other European origins (e.g., 'European') as well as more specific responses indicating European origins that have not been included elsewhere (e.g., 'Central European').
8. Includes general responses indicating Other European origins (e.g., 'European') as well as more specific responses indicating European origins that have not been included elsewhere (e.g., 'Central European').
9. Includes general responses indicating Latin, Central or South American origins (e.g., 'South American') as well as more specific responses indicating Latin, Central or South American origins that have not been included elsewhere (e.g., 'Surinamese').
10. Includes general responses indicating Central or West African origins (e.g., 'West African') as well as more specific responses indicating Central or West African origins that have not been included elsewhere (e.g., 'Ewe,' 'Wolof').
11. Includes general responses indicating North African origins (e.g., 'North African') as well as more specific responses indicating North African origins that have not been included elsewhere (e.g., 'Maghreb').
12. Includes general responses indicating Southern or East African origins (e.g., 'East African') as well as more specific responses indicating Southern or East African origins that have not been included elsewhere (e.g., 'Hutu,' 'Shona').

13. Some respondents may choose to provide very specific ethnic origins in the National Household Survey (NHS), while other respondents may choose to give more general responses. This means that two respondents with the same ethnic ancestry could have different response patterns and thus could be counted as having different ethnic origins. For example, one respondent may report 'East Indian' ethnic origin while another respondent, with a similar ancestral background, may report 'Punjabi' or 'South Asian' origins; one respondent may report 'Black' while another, similar respondent, may report 'Ghanaian' or 'African.' As a result, ethnic origin data are very fluid, and counts for certain origins, such as 'East Indian' and 'Black,' may seem lower than initially expected. Users who wish to obtain broader response counts may wish to combine data for one or more ethnic origins together or use counts for ethnic categories such as 'South Asian origins' or 'African origins.' (Please note, however, that 'African origins' should not be considered equivalent to the 'Black' population group or visible minority status, as there are persons reporting African origins who report a population group or visible minority status other than 'Black.' Conversely, many people report a population group or visible minority status of 'Black' and do not report having 'African' origins. For information on population group and visible minority population in the 2011 NHS, refer to the appropriate definitions in this publication.)
14. Includes general responses indicating Other African origins (e.g., 'African') as well as more specific responses indicating Other African origins that have not been included elsewhere (e.g., 'Saharan').
15. Includes general responses indicating West Asian, Central Asian and Middle Eastern origins (e.g., 'West Asian,' 'Middle Eastern') as well as more specific responses indicating West Asian, Central Asian and Middle Eastern origins that have not been included elsewhere (e.g., 'Baloch,' 'Circassian').
16. Includes general responses indicating South Asian origins (e.g., 'South Asian') as well as more specific responses indicating South Asian origins that have not been included elsewhere (e.g., 'Bhutanese').
17. Includes general responses indicating East and Southeast Asian origins (e.g., 'Southeast Asian') as well as more specific responses indicating East and Southeast Asian origins that have not been included elsewhere (e.g., 'Bruneian,' 'Karen').
18. Includes general responses indicating Other Asian origins (e.g., 'Asian') as well as more specific responses indicating Other Asian origins that have not been included elsewhere (e.g., 'Eurasian').
19. Includes general responses indicating Pacific Islands origins (e.g., 'Pacific Islander') as well as more specific responses indicating Pacific Islands origins that have not been included elsewhere (e.g., 'Tahitian').
Abbreviation
n.i.e. = not included elsewhere
n.o.s. = not otherwise specified
Source: Statistics Canada, National Household Survey, 2011.
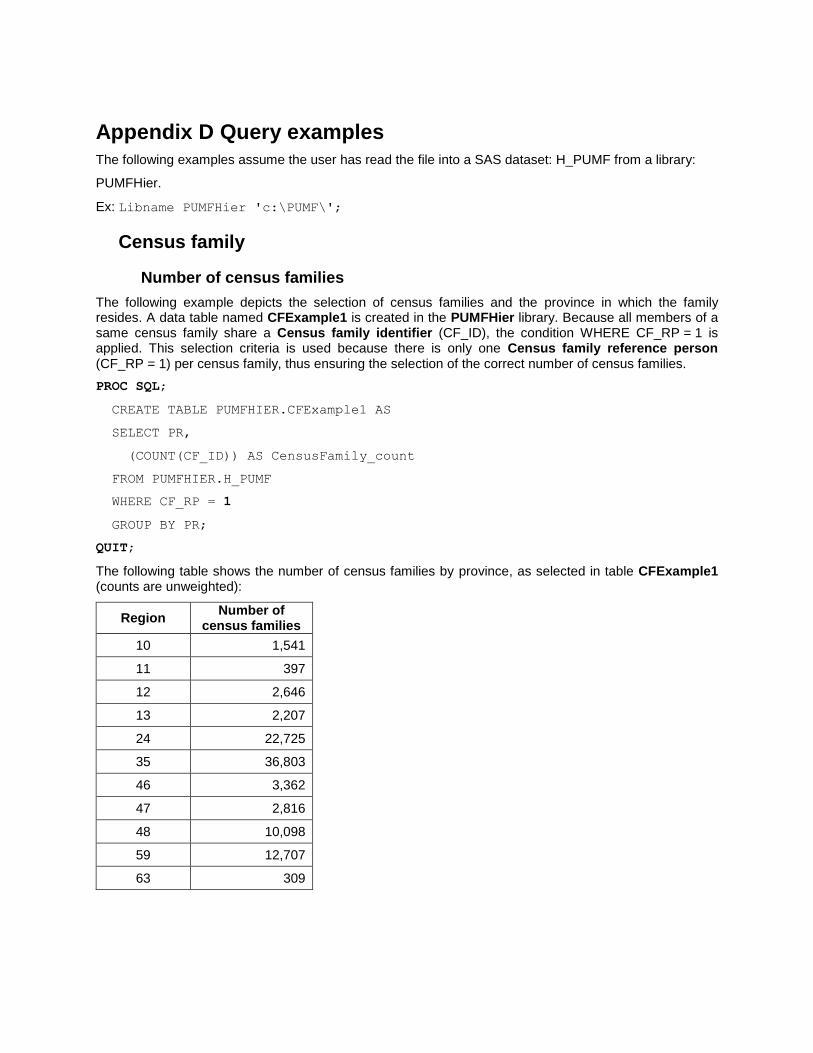
Appendix D Query examples
The following examples assume the user has read the file into a SAS dataset: H_PUMF from a library:
PUMFHier.
Ex: Libname PUMFHier 'c:\PUMF\';
Census family
Number of census families
The following example depicts the selection of census families and the province in which the family resides. A data table named CFExample1 is created in the PUMFHier library. Because all members of a same census family share a Census family identifier (CF_ID), the condition WHERE CF_RP = 1 is applied. This selection criteria is used because there is only one Census family reference person (CF_RP = 1) per census family, thus ensuring the selection of the correct number of census families.
PROC SQL;
CREATE TABLE PUMFHIER.CFExample1 AS
SELECT PR,
(COUNT(CF_ID)) AS CensusFamily_count
FROM PUMFHIER.H_PUMF
WHERE CF_RP = 1
GROUP BY PR;
QUIT;
The following table shows the number of census families by province, as selected in table CFExample1 (counts are unweighted):
Region Number of
census families
10 1,541
11 397
12 2,646
13 2,207
24 22,725
35 36,803
46 3,362
47 2,816
48 10,098
59 12,707
63 309

Number of children less than 25 years of age per census family
The following example depicts the selection of census families and derives the number of children aged less than 25 years old per census family. For this example, a table named CFExample2 is created in the PUMFHier library. It is populated by selecting the Census family identifier (CF_ID) and counting the number of Person identifiers (PP_ID) within the CF_ID (group by CF_ID) who correspond to the definition of a census family child under the age of 25. A census family child is defined as an individual with a Detailed census family status and household living arrangements value of 7, 8, 9 or 10 (see codebook for textual correspondence) and to meet the age criteria of the query, Age groups less than 5 (agegrp < 5) is utilized.
PROC SQL;
CREATE TABLE PUMFHIER.CFExample2 AS
SELECT CF_ID,
(COUNT(PP_ID)) AS Number_of_kids
FROM PUMFHIER.H_PUMF
WHERE (CFStat BETWEEN 4 AND 5) and agegrp < 5
GROUP BY CF_ID;
QUIT;
The following counts for number of children aged less than 25 years per census family can be produced from table CFExample2 (counts are unweighted):
Number of children aged < 25 in census
family Count of families
1 19,862
2 20,332
3 6,141
4 1,344
5 376
6 12
Economic families
Selection of economic families
The following example depicts the selection of economic families. A data table named EFExample1 is created in the PUMFHier library. Because all members of a same economic family share an Economic family identifier (EF_ID) the condition WHERE EF_RP = 1 is applied. This selection criteria is used because there is only one Economic family reference person (EF_RP = 1) per economic family, thus ensuring the selection of the correct number of economic families.
PROC SQL;
CREATE TABLE PUMFHIER.EFExample1 AS
SELECT EF_ID

FROM PUMFHIER.H_PUMF
WHERE EF_RP = 1;
QUIT;
The preceding query will produce table EFExample1 with the following number of economic families (count is unweighted).
Count of economic families: 94,155
Total income per economic families
This example depicts the aggregation of a quantitative variable within an economic family. A table named EFExample2 is created in the PUMFHier library. The total income of each member of the economic family is summed to create the economic family total income. This is achieved by applying the sum function to Total income of individual (SUM(TotInc)) and grouping the results by Economic family identifier (group by EF_ID). Please note that when aggregating economic family data, one must restrict their selection to only include persons in an economic family, i.e., EF_RP of 1 or 2 (EF_RP in (1, 2)). Also, it is very important to exclude the 'not available' (in this case 8888888) and 'not applicable' (in this case 9999999) categories when applying arithmetic or statistics to quantitative income and housing variables.
PROC SQL;
CREATE TABLE PUMFHIER.EFExample2 AS
SELECT EF_ID,
(SUM(TotInc)) AS SUM_of_TotInc
FROM PUMFHIER.H_PUMF
WHERE EF_RP in (1,2) AND TotInc NOT IN
(8888888, 9999999)
GROUP BY EF_ID;
QUIT;
The following mean value for economic family total income can be obtained from table EFExample2 (economic families' total income where the income is not available or not applicable for all family members is excluded from the calculation, statistic is unweighted).
Mean economic family total income = $95,349
Households
Selection of households
The following example depicts the selection of private households and their province. A data table named HHExample1 is created in the PUMFHier library. Because all persons residing in the same household share the same Household identifier (HH_ID), the condition WHERE PRIHM = 1 is applied. This selection criteria is used because there is only one primary household Maintainer (PRIHM = 1) per household and all households have a primary household maintainer.
PROC SQL;
CREATE TABLE PUMFHIER.HHExample1 AS
SELECT PR,
(COUNT(PRIHM)) AS Household_count
FROM PUMFHIER.H_PUMF
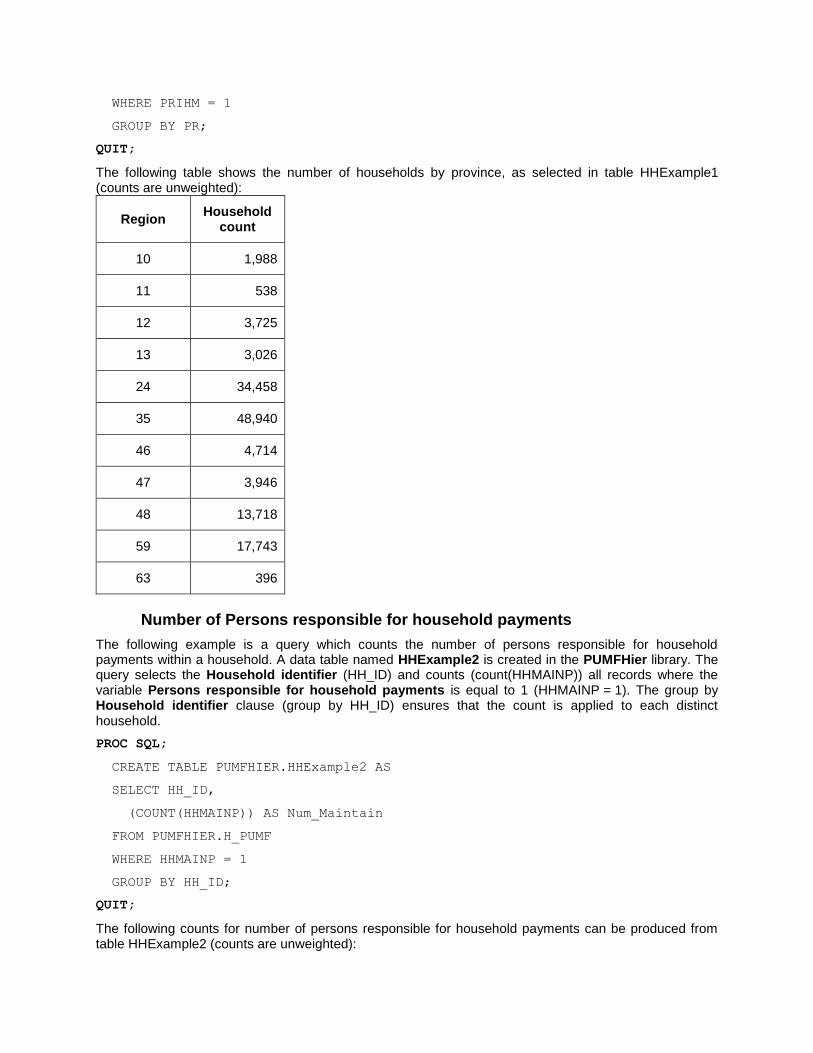
WHERE PRIHM = 1
GROUP BY PR;
QUIT;
The following table shows the number of households by province, as selected in table HHExample1 (counts are unweighted):
Region Household
count
10 1,988
11 538
12 3,725
13 3,026
24 34,458
35 48,940
46 4,714
47 3,946
48 13,718
59 17,743
63 396
Number of Persons responsible for household payments
The following example is a query which counts the number of persons responsible for household payments within a household. A data table named HHExample2 is created in the PUMFHier library. The query selects the Household identifier (HH_ID) and counts (count(HHMAINP)) all records where the variable Persons responsible for household payments is equal to 1 (HHMAINP = 1). The group by Household identifier clause (group by HH_ID) ensures that the count is applied to each distinct household.
PROC SQL;
CREATE TABLE PUMFHIER.HHExample2 AS
SELECT HH_ID,
(COUNT(HHMAINP)) AS Num_Maintain
FROM PUMFHIER.H_PUMF
WHERE HHMAINP = 1
GROUP BY HH_ID;
QUIT;
The following counts for number of persons responsible for household payments can be produced from table HHExample2 (counts are unweighted):

Number of persons responsible for
household payments Frequency
1 78,914
2 51,353
3 2,165
4 605
5 155

To fulfill your data needs or to
receive help in accessing and
ordering custom census or NHS
products...
Call: 1-800-263-1136
e-mail: [email protected]
Afin de répondre à vos besoins en matière de données ou pour obtenir de l’aide pour accéder et commander des produits personnalisés du recensement ou de l’ENM...
Composez le 1-800-263-1136
Courriel: [email protected]
For data, reference material,
maps and much more...
Pour obtenir des données, des
documents de référence, des cartes
géographiques et beaucoup plus...