cat sossm services - finning
TRANSCRIPT
Management Guide• Two methods of
reading particles
• Measuring contamination
• ISO Codes
• ISO 11171:1999
Cat® S•O•SSM ServicesReporting Particle Count by ISO Code
�
Reporting Particle Count by ISO Code
Introduction................................................................................................................ 3
What ISO Means ....................................................................................................... 3
Two Methods of Reading Particles ....................................................................4-5
Measuring Contamination ...................................................................................6-9
Applying ISO Code .................................................................................................. 10
What ISO 11171:1999 Means ................................................................................ 11
Working Together With the Same Goal .............................................................. 12
Reporting Particle Count by ISO Code
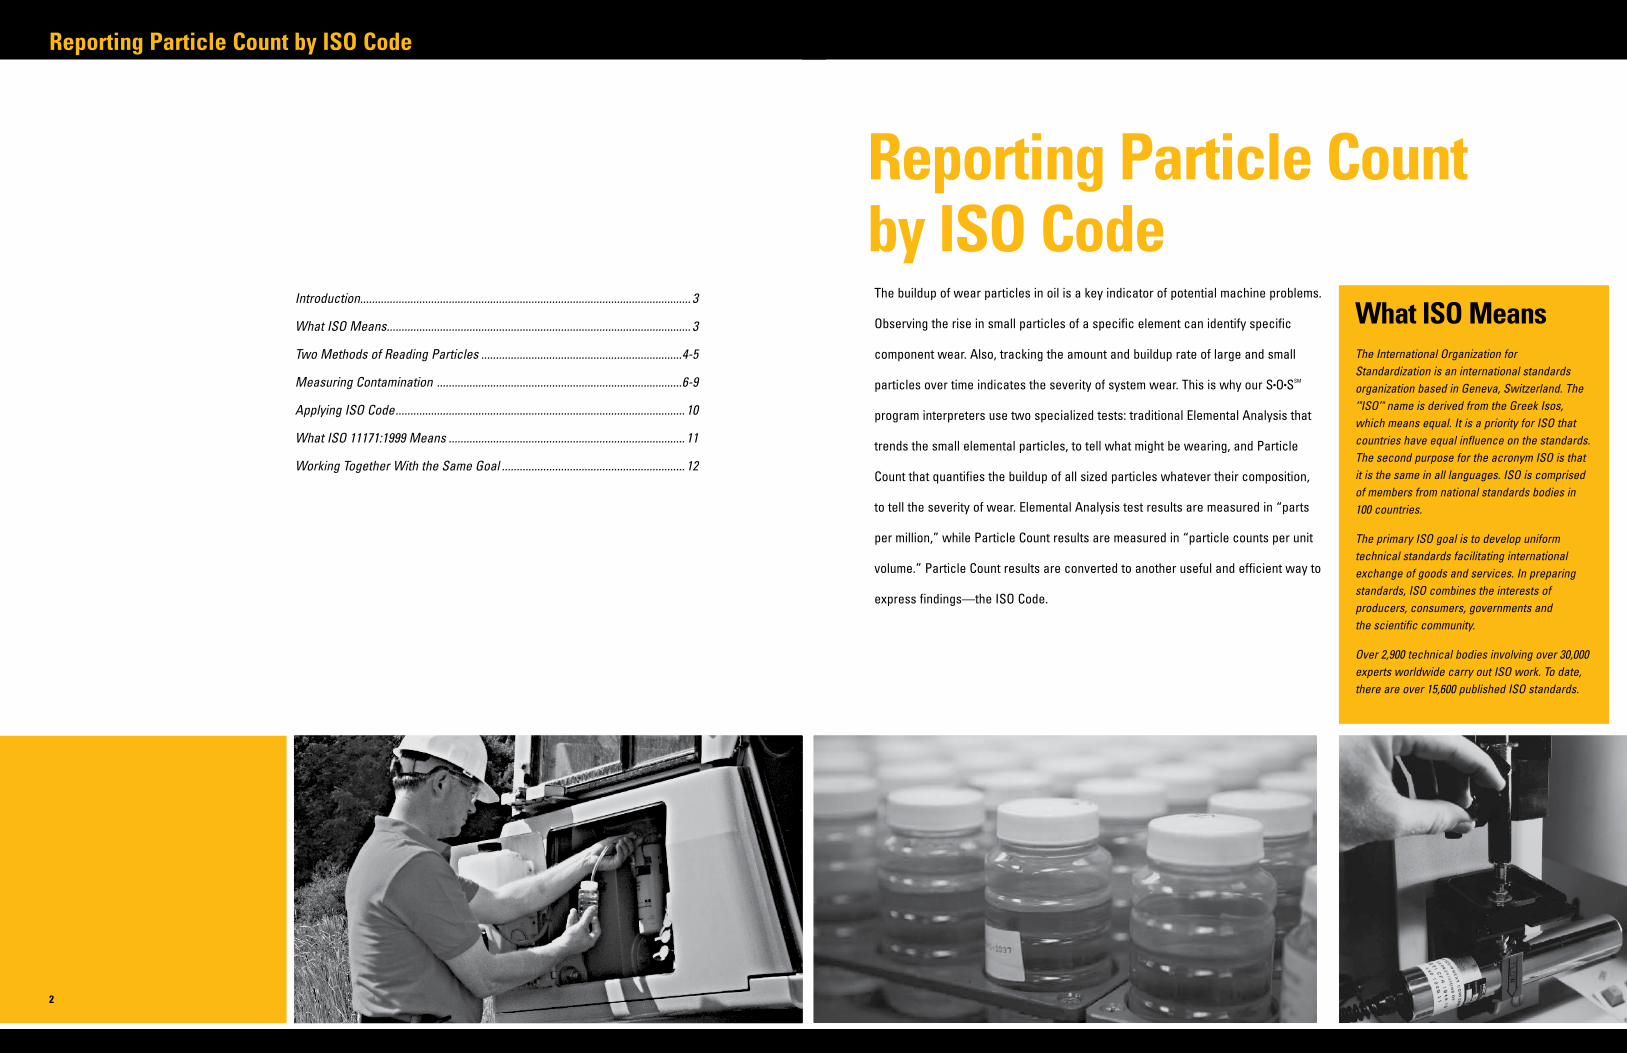
What ISO MeansThe International Organization for Standardization is an international standards organization based in Geneva, Switzerland. The ‘"ISO’" name is derived from the Greek Isos, which means equal. It is a priority for ISO that countries have equal influence on the standards. The second purpose for the acronym ISO is that it is the same in all languages. ISO is comprised of members from national standards bodies in 100 countries.
The primary ISO goal is to develop uniform technical standards facilitating international exchange of goods and services. In preparing standards, ISO combines the interests of producers, consumers, governments and the scientific community.
Over 2,900 technical bodies involving over 30,000 experts worldwide carry out ISO work. To date, there are over 15,600 published ISO standards.
The buildup of wear particles in oil is a key indicator of potential machine problems.
Observing the rise in small particles of a specific element can identify specific
component wear. Also, tracking the amount and buildup rate of large and small
particles over time indicates the severity of system wear. This is why our S•O•SSM
program interpreters use two specialized tests: traditional Elemental Analysis that
trends the small elemental particles, to tell what might be wearing, and Particle
Count that quantifies the buildup of all sized particles whatever their composition,
to tell the severity of wear. Elemental Analysis test results are measured in “parts
per million,” while Particle Count results are measured in “particle counts per unit
volume.” Particle Count results are converted to another useful and efficient way to
express findings—the ISO Code.
�
Reporting Particle Count by ISO CodeReporting Particle Count by ISO Code
Two Methods for Reading ParticlesThe concentration of wear particles in oil is a key indicator of potential component problems. Therefore, oil analysis must be capable of measuring a wide range of wear particles and contaminant particles. Some types of wear produce particles that are extremely small. Other types of wear produce larger particles that can be visually observed in the oil. Likewise, contamination particles come in a variety of sizes. Tiny particles of dust in the air can cause significant damage if the particles enter a lubricated compartment. Dirt from the soil will also cause damage if it is allowed to enter the lubricating oil.
To effectively measure this wide range of particle sizes, S·O·S Services uses two types of tests. The Elemental Analysis test is used to measure the extremely small particles. The Particle Count test is used to measure the larger particles. Trending the concentration and wear rate of large and small particles indicates the severity of system wear.
Elemental Analysis
This test identifies elemental constituents present in the oil and specific elements that comprise wear particles. Results are provided in parts per million or ppm. Over the course of several samples, trending the concentration of various elements can signal potential problems. Classic combinations of elements may identify specific wear sources and other compartment issues.
Elemental Analysis cannot analyze particles larger than 10 microns. These larger particles may also signal abnormal wear and contamination.
Particle Count
Particle Count can quantify the number of particles from approximately 4 microns to 50 microns in size (figure 1), regardless of particle composition. This analysis is measured in particles per milliliter. These results are converted to another useful and efficient way to express findings, the ISO Code.
Dirt, metal and water will all be reported as particles in this analysis since Particle Count does not distinguish particle composition. Particle Count can detect additional signs of abnormal wear that Elemental Analysis cannot detect.
Elemental Analysis and Particle Count Analysis form an efficient partnership in identifying abnormal wear levels and identifying total fluid contamination levels.
DIAMETER OF A HUMAN HAIR80 MICRONS
TALCUM POWDER15 MICRONS
1 MICRON
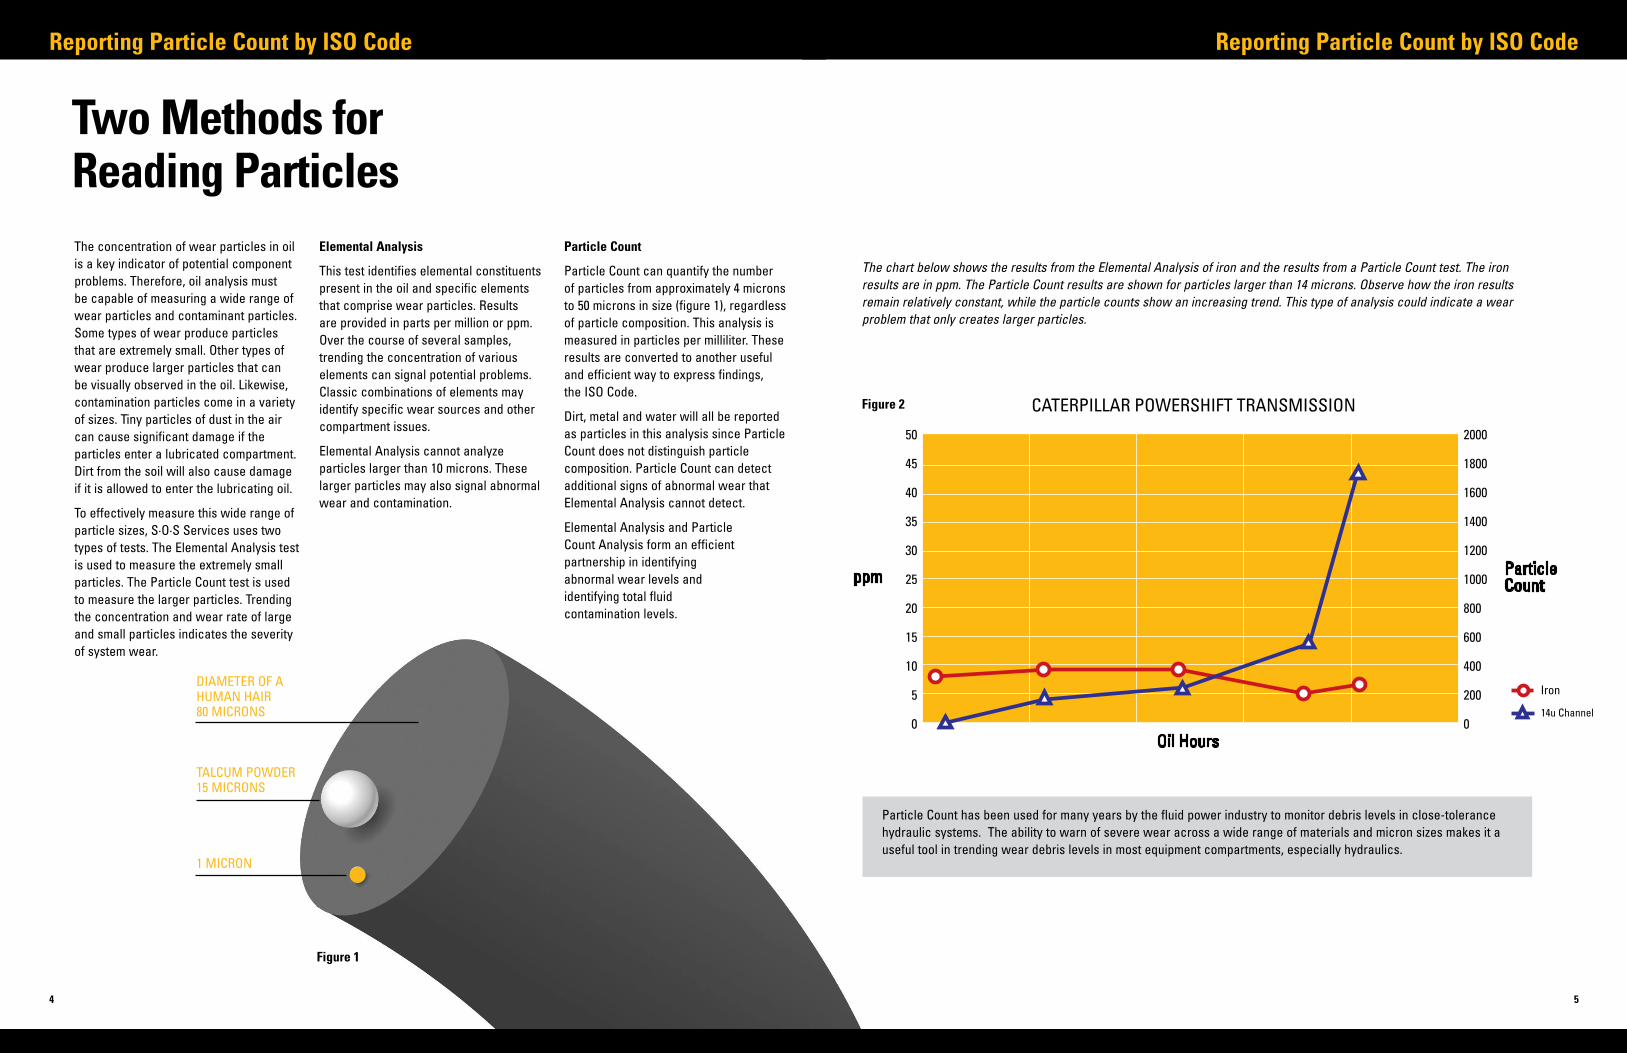
The chart below shows the results from the Elemental Analysis of iron and the results from a Particle Count test. The iron results are in ppm. The Particle Count results are shown for particles larger than 14 microns. Observe how the iron results remain relatively constant, while the particle counts show an increasing trend. This type of analysis could indicate a wear problem that only creates larger particles.
Particle Count has been used for many years by the fluid power industry to monitor debris levels in close-tolerance hydraulic systems. The ability to warn of severe wear across a wide range of materials and micron sizes makes it a useful tool in trending wear debris levels in most equipment compartments, especially hydraulics.
Figure 1
Figure �
�

�
Reporting Particle Count by ISO CodeReporting Particle Count by ISO Code
�
Particle Counting Techniques Any valid measuring system must give consistent results and be calibrated to conform to industry reporting standards. Consistent results enable interpreters to identify wear trends in consecutive samples and enable compartment cleanliness targets to be set and monitored.
The most direct method for measuring the larger particles is with an optical microscope. With this method, a measured amount of oil is passed through a fine piece of filtration media that traps the particles. A technician then counts and measures the size of each particle on the filter media. The counting and sizing of the particles is done through a calibrated microscope. This optical microscope technique is very time consuming and expensive.
Optical particle counters were developed to reduce the expense and time required for particle counting.
Optical Particle Counters are used in the S·O·S program. The instrument shines a laser through the sample. A detector then counts the number and size of shadows created by particles in the oil. Any object in the oil that creates a shadow will be counted as a particle. Water droplets, entrained air and some oil additives will cause shadows. When water, air and additives are measured by a particle counter, it is called interference. It is not possible for the optical particle counter to distinguish the difference between shadows caused by debris and shadows caused by interference. Therefore, careful sample preparation and screening is required for best results.
Measuring ContaminationSample PreparationsThe following guidelines may be used when preparing a sample for testing with an optical particle counter.
Water Samples that contain more than 0.5% water contamination should not be tested on an optical particle counter. Water contamination at this level is more of a problem for the fluid system than debris in the oil.
Entrained Air Entrained air or air bubbles will create shadows during the analysis and will be counted as particles by the particle counter. Bottle samples can be vacuumed or sonicated to remove the air bubbles before analysis.
Oil Additives This problem is most prominent with new oils. Once the oil has been placed into service for a few hours, additive interference is reduced. The problem is also not the same for all new oils. The amount and type of additives in the oil affect the severity of additive interference. High quality engine oils contain the highest levels of additives. Hydraulic oil contains fewer additives than engine oil and gear oil has the least amount of additives.
For in service engine oils, Particle Count analysis is not performed. Soot formation and the associated darkening of the sample make optical particle counting impossible for this type of oil sample. All other compartments are analyzed for particles.

�
Reporting Particle Count by ISO CodeReporting Particle Count by ISO Code
�
Understanding Particle Count ResultsParticle Count is reported in the number and size (in microns) of particles in a volume of fluid. Particle Counting instruments are calibrated to recognize different sizes of particles. Particle Count results are divided into size ranges or “channels,” each based on a specific size of particle. Figure 3 shows a typical array of such channels and particle counts per milliliter of sample results.
Particle Count data is reported as a number of particles greater than a certain size. Figure 3 shows this sample contains 26650 particles larger than 4 microns, 9108 particles larger than 6 microns, 1750 particles larger than 14 microns. The
particle count for each channel includes all of the particles in all of the larger channels as well.
By trending this information over a series of samples, changes in the concentration of particles in each channel can be used to spot abnormal wear. Elemental Analysis of the same samples can often identify the makeup of the smaller particles involved and point to probable wear sources.
As with all S·O·S tests, proper sampling technique is important. Trending of data depends on repeatable performance of sampling technique and using the same sampling locations. For more information on correct sampling techniques ask us about AERV5514 “S·O·S Services Sampling Techniques” and PEGJ0047 “How to Take a Good Oil Sample.”
Converting Particle Counts to ISO Codes
ISO Codes are a simple way to quantify particulate matter by size. These codes were established by ISO and are the most widely used method of reporting particle count results.
Under the ISO Code system (see Figure 4) 28 code numbers are set up, each representing a given range of particles per milliliter. The lowest number of particles per milliliter of sample is 0.01 and the highest number of particles per milliliter of sample is 2,500,000. Smaller code numbers correlate to smaller numbers of particles. Please note that the size of each code range is double the number of the preceding range.
For example, in figure 4, ISO Code 10 has a range of 5 particles while ISO Code 11 has a range of 10 particles. Each one- step increase in ISO Code (i.e. going from 11 to 12), for the same channel, indicates the particle concentration is double the particle concentration of the preceding code.
X = number of particles larger than (>) 4 micronsY = number of particles larger than (>) 6 micronsZ = number of particles larger than (>) 14 microns Cat utilizes these channels
Channels (In microns) 4 6 10 14 18 21 38 50
Particle Count 26650 9108 4016 1750 740 467 50 16
Channels (in microns) 4 6 10 14 18 21 38 50
Particle Count 45439 4626 664 233 100 53 8 4
Method of Reporting Report Display ISO4406 X/Y/Z 22/20/18 Y/Z Reports 20/18
Method of Reporting Report Display ISO4406 X/Y/Z 23/19/15 Y/Z Reports 19/15
Figure 3
Figure �
X = number of particles larger than (>) 4 micronsY = number of particles larger than (>) 6 micronsZ = number of particles larger than (>) 14 microns Cat utilizes these channels
Channels (In microns) 4 6 10 14 18 21 38 50
Particle Count 26650 9108 4016 1750 740 467 50 16
Channels (in microns) 4 6 10 14 18 21 38 50
Particle Count 45439 4626 664 233 100 53 8 4
Method of Reporting Report Display ISO4406 X/Y/Z 22/20/18 Y/Z Reports 20/18
Method of Reporting Report Display ISO4406 X/Y/Z 23/19/15 Y/Z Reports 19/15
Reporting Particle Count by ISO CodeReporting Particle Count by ISO Code
10
What ISO 111�1:1��� MeansNewer technologies revealed limitations in the test dust used to calibrate particle counters. ISO 11171:1999 discusses proper calibration of optical particle counters with standards that are more consistent. The end result is a more consistent analysis. S·O·S Reports will look slightly different, since the new standard specifies different ISO Code Channels. While the channels may look different, the ISO Codes still indicate the same cleanliness levels as before.
11
Applying the ISO Codes
X = number of particles larger than (>) 4 micronsY = number of particles larger than (>) 6 micronsZ = number of particles larger than (>) 14 microns Cat utilizes these channels
Channels (In microns) 4 6 10 14 18 21 38 50
Particle Count 26650 9108 4016 1750 740 467 50 16
Channels (in microns) 4 6 10 14 18 21 38 50
Particle Count 45439 4626 664 233 100 53 8 4
Method of Reporting Report Display ISO4406 X/Y/Z 22/20/18 Y/Z Reports 20/18
Method of Reporting Report Display ISO4406 X/Y/Z 23/19/15 Y/Z Reports 19/15
The governing ISO standard (ISO4406:1999) establishes a three-factor code (X/Y/Z) to express fluid cleanliness. The X factor represents the number of particles larger than 4 microns. The Y factor represents the number of particles larger than 6 microns and Z factor indicates the number of particle larger than 14 microns. S·O·S Services reports the Y and Z codes to keep consistency with older data.
For the example in Figure 5, test results where the particles /1 mL sample in the 6 micron channel are 9108, the associated ISO Code is 20. For the example test results where the particle/1mL sample in the 14 micron channel is 1750, the associated ISO Code is 18. The ISO Cleanliness Code is 20/18.
Another example is shown in Figure 6
The >6 micron size was selected because the smaller channel indicates particles that can cause silting in the fluid or are close to clearance sizes in various components. This size particle is also identified with Elemental Analysis. The >14 micron size can indicate the presence of rapidly increasing larger wear particles.
An ISO Code is an instant identifier summarizing oil particle count information in two numbers. As the trend changes between samples, particle count can be a first indication of abnormal wear. These indications are signals to review channel readings and other S·O·S tests for potential wear and potential causes of wear. Elemental Analysis can be especially useful when viewed with the Particle Count information.
X = number of particles larger than (>) 4 micronsY = number of particles larger than (>) 6 micronsZ = number of particles larger than (>) 14 microns Cat utilizes these channels
Channels (In microns) 4 6 10 14 18 21 38 50
Particle Count 26650 9108 4016 1750 740 467 50 16
Channels (in microns) 4 6 10 14 18 21 38 50
Particle Count 45439 4626 664 233 100 53 8 4
Method of Reporting Report Display ISO4406 X/Y/Z 22/20/18 Y/Z Reports 20/18
Method of Reporting Report Display ISO4406 X/Y/Z 23/19/15 Y/Z Reports 19/15
Figure 5.
Figure 6.

CAT® DEAlERS DEFInE
WORlD-ClASS
PRODUCT SUPPORT.
We offer you the right parts and service
solutions, when and where you need them.
The Cat Dealer network of highly trained
experts can help you maximize your
equipment investment.
PEGJ0045www.cat.com
© 2007 Caterpillar • All Rights Reserved • Printed in USACAT, CATERPILLAR, their respective logos, S•O•S, “Caterpillar Yellow” and the POWER EDGE trade dress, as well as corporate and product identity used herein, are trademarks of Caterpillar and may not be used without permission.
Working together with the same goalISO Codes are the international language of reporting particle count results. These
codes provide easy-to-read signals of changing contamination levels and enhance
the information from Elemental Analysis. This standard language provides a unique
code for particle concentrations.
Particle Count and Elemental Analysis work together to alert you of potential
abnormal wear. The S·O·S program of tests is designed to find abnormal wear and
then identify possible causes of the wear. The S·O·S program is one element of a
condition monitoring philosophy that you can put into place with your equipment to
monitor the impact of your maintenance program. The S·O·S program combined with
regular inspections, analysis of your equipment’s site conditions, electronic data,
and service history will enable you to evaluate your equipment’s health. You can
perform a maintenance program on your own, or you can enlist the assistance of your
Caterpillar® Dealer to perform any level of preventive maintenance that will keep your
equipment running at peak performance.