cassandra cole and kathleen mccullough co-editors · while capital provides a safety net that helps...
TRANSCRIPT

Journal of Insurance Regulation
Cassandra Cole and Kathleen McCulloughCo-Editors
Vol. 34, No. 6
Integrated Determination of Insurer Capital, Investment and Reinsurance Strategy
Hong MaoJames M. Carson
Krzysztof M. Ostaszewski
JIR-ZA-34-06

Accounting & ReportingInformation about statutory accounting principles and the procedures necessary for fi ling fi nancial annual statements and conducting risk-based capital calculations.
Consumer InformationImportant answers to common questions about auto, home, health and life insurance — as well as buyer’s guides on annuities, long-term care insurance and Medicare supplement plans.
Financial Regulation Useful handbooks, compliance guides and reports on fi nancial analysis, company licensing, state audit requirements and receiverships.
LegalComprehensive collection of NAIC model laws, regulations and guidelines; state laws on insurance topics; and other regulatory guidance on antifraud and consumer privacy.
Market RegulationRegulatory and industry guidance on market-related issues, including antifraud, product fi ling requirements, producer licensing and market analysis.
NAIC ActivitiesNAIC member directories, in-depth reporting of state regulatory activities and offi cial historical records of NAIC national meetings and other activities.
For more information about NAIC publications, view our online catalog at:
http://store.naic.org
Special StudiesStudies, reports, handbooks and regulatory research conducted by NAIC members on a variety of insurance-related topics.
Statistical ReportsValuable and in-demand insurance industry-wide statistical data for various lines of business, including auto, home, health and life insurance.
Supplementary ProductsGuidance manuals, handbooks, surveys and research on a wide variety of issues.
Capital Markets & Investment AnalysisInformation regarding portfolio values and procedures for complying with NAIC reporting requirements.
White Papers Relevant studies, guidance and NAIC policy positions on a variety of insurance topics.
© 2015 National Association of Insurance Commissioners. All rights reserved.
Printed in the United States of America
No part of this book may be reproduced, stored in a retrieval system, or transmitted in any form or by any means, electronic or mechanical, including photocopying, recording, or any storage or retrieval system, without written permission from the NAIC.
NAIC Executive Offi ce444 North Capitol Street, NWSuite 700Washington, DC 20001 202.471.3990
NAIC Central Offi ce1100 Walnut StreetSuite 1500Kansas City, MO 64106816.842.3600
NAIC Capital Markets& Investment Analysis Offi ceOne New York Plaza, Suite 4210New York, NY 10004212.398.9000
The NAIC is the authoritative source for insurance industry information. Our expert solutions support the efforts of regulators, insurers and researchers by providing detailed and comprehensive insurance information. The NAIC offers a wide range of publications in the following categories:

The following companion products provide additional information on the same or similar subject matter. Many
customers who purchase the Journal of Insurance Regulation also purchase one or more of the following
products:
Companion Products
Federalism and Insurance Regulation
This publication presents a factual historical account of the development of the
framework for insurance regulation in the United States. It does so in part by
using illustrative early statutes, presenting them chronologically, and in part by
using cases that illustrate the interpretation of the crucial later statutes.
Copyright 1995.
Regulation and the Casualty Actuary
This anthology reprints 20 important papers from past issues of the Journal of
Insurance Regulation that are most relevant for practicing actuaries and state
insurance regulators. It covers a wide range of issues, such as ratemaking,
auto insurance pricing, residual markets, reserving and solvency monitoring.
This invaluable reference explains these complex topics in straightforward,
non-technical language. Copyright 1996.
International orders must be prepaid, including shipping charges. Please contact an NAIC Customer Service Representative, Monday - Friday, 8:30 am - 5 pm CT.

Editorial Staff of the Journal of Insurance Regulation Co-Editors Case Law Review Editor Cassandra Cole and Kathleen McCullough Jennifer McAdam, J.D. Florida State University NAIC Legal Counsel II Tallahassee, FL
Editorial Review Board Cassandra Cole, Florida State University, Tallahassee, FL
Lee Covington, Insured Retirement Institute, Arlington, VA
Brenda Cude, University of Georgia, Athens, GA
Robert Detlefsen, National Association of Mutual Insurance Companies, Indianapolis, IN
Bruce Ferguson, American Council of Life Insurers, Washington, DC
Stephen Fier, University of Mississippi, University, MS
Kevin Fitzgerald, Foley & Lardner, Milwaukee, WI
Robert Hoyt, University of Georgia, Athens, GA
Alessandro Iuppa, Zurich North America, Washington, DC
Robert Klein, Georgia State University, Atlanta, GA
J. Tyler Leverty, University of Iowa, Iowa City, IA
Andre Liebenberg, University of Mississippi, Oxford, MS
David Marlett, Appalachian State University, Boone, NC
Kathleen McCullough, Florida State University, Tallahassee, FL
Charles Nyce, Florida State University, Tallahassee, FL
Mike Pickens, The Goldwater Taplin Group, Little Rock, AR
David Sommer, St. Mary’s University, San Antonio, TX
Sharon Tennyson, Cornell University, Ithaca, NY

Purpose
The Journal of Insurance Regulation is sponsored by the National Association
of Insurance Commissioners. The objectives of the NAIC in sponsoring the
Journal of Insurance Regulation are:
1. To provide a forum for opinion and discussion on major insurance
regulatory issues;
2. To provide wide distribution of rigorous, high-quality research
regarding insurance regulatory issues;
3. To make state insurance departments more aware of insurance
regulatory research efforts;
4. To increase the rigor, quality and quantity of the research efforts on
insurance regulatory issues; and
5. To be an important force for the overall improvement of insurance
regulation.
To meet these objectives, the NAIC will provide an open forum for the
discussion of a broad spectrum of ideas. However, the ideas expressed in the
Journal are not endorsed by the NAIC, the Journal’s editorial staff, or the
Journal’s board.

* Shanghai Second Polytechnic University; [email protected]. ** Terry College of Business, University of Georgia; [email protected]. *** Illinois State University; [email protected]. **** State Farm Insurance and Illinois State University; [email protected].
© 2015 National Association of Insurance Commissioners
Integrated Determination of Insurer
Capital, Investment and Reinsurance Strategy
Hong Mao* James M. Carson**
Krzysztof M. Ostaszewski*** Wei Hao****
Abstract
Based on the criteria of the Swiss Solvency Test, Solvency II, RBC and minimizing total frictional cost, we establish integrated models to determine the adjustment capital required, investment strategy and reinsurance strategy by numerically analyzing the effect of several important parameters. Results illustrate that when the cost of reinsurance is low or the frictional cost of capital is high, reinsurance is especially attractive as an effective instrument for capital management. However, when the cost of reinsurance is high or the frictional cost of capital is low, capital can partly or fully substitute for reinsurance. Furthermore, in most cases, setting the regulatory capital level either by Solvency II or the Swiss Solvency Test leads to greater prudence than determining insurer capital level by minimizing total frictional cost, except when the cost of capital is very low.
1

Journal of Insurance Regulation
© 2015 National Association of Insurance Commissioners
Introduction Insurers use various strategies, methods and tools to manage risk, including
reinsurance, increasing the amount of capital held and optimizing the investment portfolio. In this light, insurer risk management may be viewed as a system engineering project whereby managers assess the costs and benefits of various financial tools to determine optimal risk management strategies to achieve overall profitability and financial strength.
While capital provides a safety net that helps an insurer reduce the likelihood of financial distress, increasing the amount of capital held is costly (Staking and Babbel, 1995). Developments in global insurance regulation are aimed at risk-based supervision that accounts for all financial, insurance and business risks, particularly asset and liability risks. For example, the Swiss Solvency Test (SST) proposes the concept of target capital.1 Solvency II, the European Union (EU) framework for prudential regulation of insurers, presents the concept of the solvency capital requirement (SCR).2 In the U.S., necessary economic capital is defined by the NAIC in terms of an insurer’s RBC. Eling, Schmeiser and Schmit (2007), Eling and Holzmuller (2008), Holzmuller (2009), Cummins and Phillips (2009), and Gatzert and Wesker (2012) analyze and compare the recent developments in global solvency regulation.
Dhaene et al. (2003) discuss the determination of optimal capital by minimizing the capital cost above risk-free interest and insolvency cost. Chandra and Sherris (2006) note that minimizing frictional cost of capital produces an optimal capital level based on value at risk (VaR) at much lower levels than observed.3 They established single-period and multiple-period optimization models under the assumption that the return on insurer assets is deterministic. For a discussion of other research addressing capital and capital allocation, see Mao and Ostaszewski (2010).
1. As discussed in Luder (2005), the Swiss Solvency Test (SST) is a stochastic risk model
that includes scenarios for market risk, insurance risk and credit risk in order to determine target capital.
2. Solvency II aims to be a forward-looking, risk-sensitive regulatory structure, focusing on capital adequacy, governance and overall risk management through a total balance sheet approach. Solvency II further develops insurance regulation, similar to developments in bank regulation in Basel II.
3. Frictional cost of capital is defined as taxation and investment cost on assets backing the required capital over the projected lifetime of underlying risk. See: Smith (2010) and www.pwc.com/gx/en/actuarial-insurance-services/pdf/european-insurance-cfo-forum-mcev.pdf.
2
Insurer C
© 2015 Natio
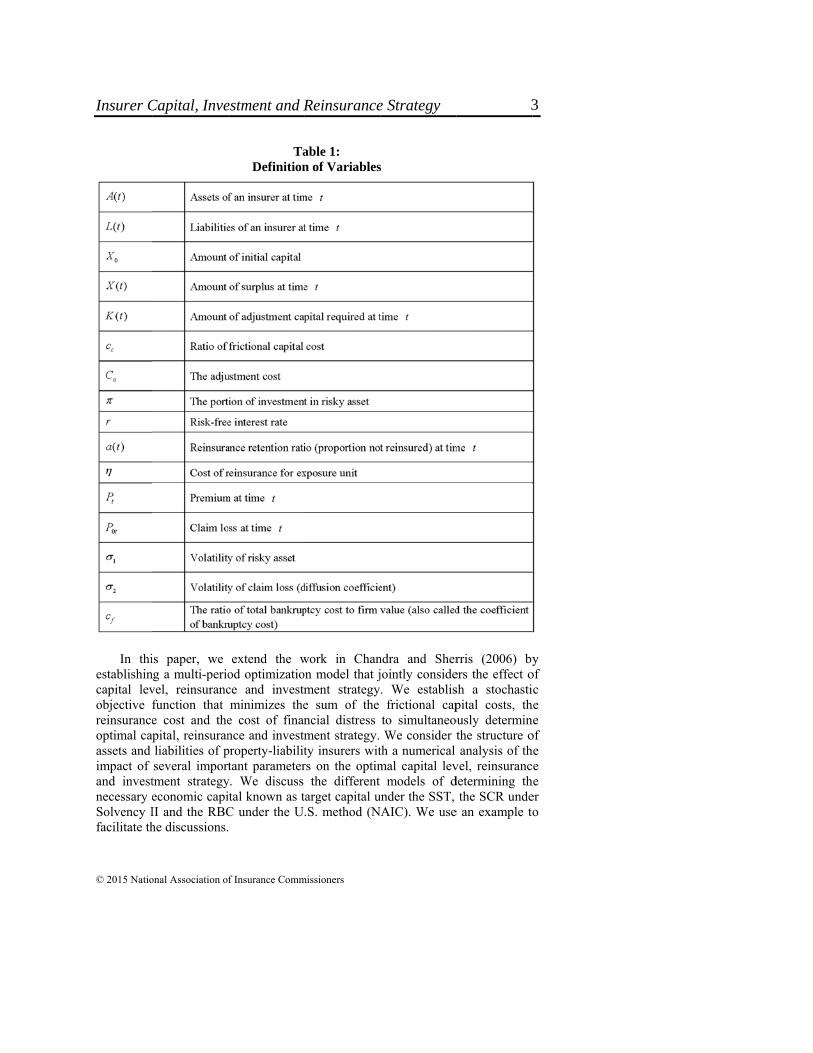
In thi
establishincapital levobjective reinsuranceoptimal caassets and impact of and investnecessary eSolvency Ifacilitate th
Capital, Inve
onal Association o
is paper, we ng a multi-periovel, reinsurancfunction that e cost and the
apital, reinsuranliabilities of pseveral importtment strategyeconomic capiII and the RBChe discussions.
estment and R
f Insurance Comm
TaDefinition
extend the wod optimizatioce and investmminimizes the
e cost of finannce and investmproperty-liabilittant parameter
y. We discuss ital known as tC under the U
Reinsurance
missioners
able 1: n of Variables
work in Chanon model that jment strategye sum of the ncial distress ment strategy. ty insurers witrs on the optim
the different target capital u.S. method (N
e Strategy
s
ndra and Sherjointly conside. We establisfrictional cap
to simultaneoWe consider t
th a numerical mal capital lev
models of dunder the SST, NAIC). We use
rris (2006) byers the effect osh a stochastipital costs, th
ously determinthe structure oanalysis of th
vel, reinsurancdetermining th
the SCR undee an example to
y of ic he ne of he ce he er o
3

Mothe
The
O
level.cost, tand tdetermhighegenerexpecfrictiosome determinsure
WMcCureinsuBeyonhedgiintegrmodeand ininvest
Tof thebankr
where
4
bankrureorgacosts rcosts ocredit, new op
odel Basee Friction
Optimizatio
Our optimizatio We considerthe expected tothe amount ofmine the optimer levels of caprally decreasescted bankruptconal cost of ca
capital (whichmined optimal er needs to deteWhile reinsuraullough and Caurance to adjusnd the use ofing underwritirating risk mael for the simulnvestment strated by the insu
The expected toe reinsurance ruptcy4 at time
e the surplus X
4. Bankruptcy couptcy costs. Direanization/liquidatirelated to the liquof lost managemand/or possibly
pportunities. (See
ed on Mn Cost
on Model wit
on model dealr the relationshotal frictional cf adjustment c
mal amount of cital increases ithe probabilit
cy cost. Howeapital. In practh we refer to capital level.
ermine the optance allows iarson (2013) pst capital acrosf reinsurance, ing risks. In anagement andltaneous determategy. We assuurer, with variaotal frictional ccost, the frictt, with t = 1,2,
X(t) is also calle
osts can be definect bankruptcy cion process, incluidation of the fir
ment energies, whthe inability of the Chandra and Sh
Jou
© 2015 Nation
Minimizin
th No Const
ls with determhip between bcost (the differcapital requirecapital to hold,its frictional coty of insolvencever, higher letice, the insureas adjustmentThus, the insu
timal level of cinsurers to mprovide empiriss affiliated firmeffective invewhat follows
d capital manamination of theume proportionables as definedcost at time t, Ftional cost of ,…T, that is:
ed RBC (Schm
ned broadly as eicosts are those eluding legal, accrm’s assets. Indirhich could lead the enterprise to oherris, 2006.)
urnal of Insu
nal Association of
ng
traint of Inso
mining the insubankruptcy corence between ed. It is impor, since capital i
ost. Holding higcy, with a resuevels of capiter decides whet in capital requrer faces a tracapital to hold. mitigate underical evidence thms within inteestment strategs, we will takagement to este optimal capitnal reinsuranced in Table 1. FCt,t=1,2,…T i
capital and th
meiser and Sieg
ither direct bankexplicit costs paicounting, filing arect bankruptcy cto lost sales, lost
obtain credit or is
rance Regul
Insurance Commi
olvency
urer's optimal cost, frictional cthese first two rtant for insuris costly and hgher levels of c
ulting decrease tal will increaether to raise oquired) based oade-off for whi
rwriting risks,hat insurers al
ernal capital magy also can hke the approatablish an intetal level, reinsue and one risky
is defined as thhe expected c
gel, 2013).
kruptcy costs or id by the debtorand other adminicosts are the oppot profits, higher
ssue securities to
lation
ssioners
capital capital costs)
rers to holding capital in the
ase the or shed on the ich the
, Fier, lso use arkets.
help in ach of egrated urance y asset
he sum cost of
indirect r in the istrative ortunity cost of finance
4

Insurer C
© 2015 Natio
By estreinsurancewe can finreinsurancecapital.5
The ob
where K(t)refer to it associated property-li
with the bowith drift coefficientinvestmentobtain the strategy fo
The Opti
We us
II. Given clevel 1 – exceeding
5. The
and risk, the 6. For
because the (Please see Lthank an ano
Capital, Inve
onal Association o
tablishing the se cost, the frict
nd the optimal e, the optima
bjective functio
) is the capitalas the adjustmwith raising o
iability insurers
oundary conditof and vol
t of 2, W1 andt in risky asse
optimal solutr t, where t = 1
imization M
se VaR (1 – confidence lev is given by th
l is not larger
factors affectingunderwriting riskmulti-period optadjustment cost Leary and Rober
onymous reviewer
estment and R
f Insurance Comm
stochastic objetional cost of cportion of risk
al capital leve
on is:
l needed to bement capital reor shedding exs satisfies the f
tion X (0) = x,latility of 1, W2
are indepeets. Substitutintions of adjus1,2,…T.
Model with Co
= 99.5%) of thel (0,1) ,
he smallest numthan . The SC
g retention rate ofk, and the price antimization modelwill affect the in
rts, 2005; Flanner for this commen
Reinsurance
missioners
ctive function capital and the ky asset to inveel and, theref
e raised or to bquired. Ca, (C
xternal capital.following stoch
where W1 is aW2 is a diffu
endent of each ng equation (3stment capital,
onstraint of
he net asset as the VaR of the
mber l such thaCR at time t is
f reinsurance incnd quantity demals, it is importannterval of adjustiery and Rangan, nt.
e Strategy
of minimizingexpected cost
est, the optimafore, the optim
be reduced at Ca ≥ 0) is the a
6 Assume thathastic different
a geometric Brusion process other, and is
3) into equatioreinsurance a
f Solvency II
the SCR define net assets at at the probabili:
clude the investmanded of insurancnt to consider theing the capital to2006; and Streb
g the sum of tht of bankruptcyal proportion omal risk-based
time t, and wadjustment cost the surplus otial equation:
rownian motionwith diffusion
s the portion oon (2), we canand investmen
ned in Solvencythe confidenc
ity of the loss X
ment rate of returce products. e adjustment coso the target valuebulaev, 2007). W
he y, of d
we st of
n n
of n
nt
y ce X
rn
st e.
We
5

whereX(t–1
Sminimthat is
subje
W
retentdefine The
T
capitaduringbetweliabili
Btarget
whereexpecintegr
e X (t) satisfie).
Similar to themizing the totas,
ct to:
With simulatiotion ratio and ted in Solvency
Optimizatio
The SST propoal defined as g a one-year een the markeities.
Based on the dt capital (TC) a
e Xt satisfies stcted shortfall wral.
es stochastic d
e discussion aal frictional cos
on, we can rethe proportion
y II.
on Model wit
oses the concepthe expected period. The ri
et-consistent va
definitions aboat time t:
tochastic differwith confidenc
Jou
© 2015 Nation
differential equ
above, we estst with the con
each the optimof risky asset
th Constrain
pt of target capishortfall of th
risk-bearing caalue of the as
ove, we establi
rential equationce level of .
urnal of Insu
nal Association of
uation either (3
tablish the obnstraint that Pr
mal solutions ts invested by
nt of the SST
ital, which equhe change in
apital is definessets and the b
ish the formula
n (3), Xt = Xt We use as
rance Regul
Insurance Commi
3) and Xt =
bjective functir (Xt –SCR
of the reinsuthe insurer and
T
uals the one-yerisk-bearing c
ed as the diffbest estimate
a for calculatin
– Xt–1 and ESs the variable
lation
ssioners
X(t) –
ion of t) = ,
urance d SCR
ear risk capital
ference of the
ng the
is the of the
6

Insurer C
© 2015 Natio
We esthe followi
That is,
subject to:
Nume In this
make compthe ratio oaverage ratof Kielholzwho emplbankruptcyindex dataestimate ththe risk-freChandra acapital reqsimilar to assume thacapital anddistress. Ta
7. The
estimates ma
Capital, Inve
onal Association o
stablish the objing constraint:
erical An
s section, we parisons amon
of capital cost,tio of capital cz (2000).) For loys sample y cost to firm va and rates of rhe drift and theee interest rate.and Sherris (2quired in the f
the single-perat there are nod consider onlable 2 lists the
information used
ade by the author
estment and R
f Insurance Comm
ective function
nalysis B
present an exng models base, we use the rost for nonlife the bankruptc
data from 19value. We use return for Trea
e volatility of th. For other data
2006). We focfirst year, whicriod model in o costs associaly the frictionainput data for
d in the numericas; the results may
Reinsurance
missioners
n of minimizin
Based on
ample to illusd on different results from Kinsurance com
cy cost, we use985–2005 to Standard & Poasury bills durhe rate of retura (described becus on calculach can be seen
Chandra and ated with adjual cost of capithe analysis.
al analysis here iy vary with differ
e Strategy
g the total frict
n an Exam
strate the optimcriteria discuss
Kielholz (2000)mpanies in 199e the results ofestimate the
oor’s (S&P) 50ring the periodrn on risky asseelow), we rely ating the optimn as the singleSherris (2006
usting to the opital and the co
s drawn from prient underlying as
tional cost with
mple
mal results andsed above.7 Fo), which is th
98. (See Table f Lewis (2009)
ratio of tota00 stock marked 1983–2007 toets (stocks) andon results from
mal adjustmene-period mode6). That is, wptimal level oost of financia
ior studies and osssumptions.
h
d or he 1 ), al et o d
m nt el
we of al
on
7

R
may compcalculrangedoes frictioTableand thWhenoptimpartia
Reinsurance covary widely.
plicated. Becaulate optimal so
e of the rate onot satisfy th
onal cost and e 4 and Table he premium inn the rate of re
mal retention raally or complet
The Inp
ontracts are prThe factors
use exact ratesolutions based of reinsurance he requiremenvice versa. T5. From Table
ncome, P1, are einsurance cosate a* is smalltely replaces ca
Jou
© 2015 Nation
Table 2:put Data for t
rivately negotiaffecting the s of reinsurancon a range of vcost, which isnt of insolven
The optimal soe 3, we find thimportant fact
st is small or l or equal to zapital to transfe
urnal of Insu
nal Association of
the Example
iated, and the rate of reinsu
ce cost are values for eachs not economicncy regulationolutions, *, arhat the rate of tors that affectthe premium i
zero, which meer claim risk.
rance Regul
Insurance Commi
contract condurance cost isunknown to u
h . We also gical to the insun with lowestre listed in Taf reinsurance cot the optimal rincome is smaeans the reinsu
lation
ssioners
ditions s very us, we ive the urer or t total able 3, ost, , results. all, the urance
8

Insurer C
© 2015 Natio
From in our casincrease ofto increasedecrease thcapital held
Optima
From
(P1 = 10 incase), the means thareinsurancecost increaconservativWhen underwritindue to high
Finallyhigher (P2 means thatcapital cosaddition, thcost is lowthat the proffset inso
Capital, Inve
onal Association o
Table 3, we alse), the adjustmf the rate of ree capital so as he net incomed so as to reduc
al Solutions O
Table 3, we an our case) and
optimal retentt it is optimale due to the lowases, the invesve, the retentio 0.2, the optimng risk is reduher reinsurancey, from Table = 20, and P3
t it is optimal t. Also, higherhe optimal ret
wer or higher. Aremium incomlvency risk.
estment and R
f Insurance Comm
so find when tment capital reinsurance cost
to offset undee of the insurece the insolven
Tabtained by Op
also find that wd when the ratetion rate is zel for the insurw reinsurance stment strategon portion is inmal retention uced by increae cost.
3, we found = 25 in our cafor the insure
r premium incotention rate is
And all surplus me and the retu
Reinsurance
missioners
the level of preequired is post. This means ierwriting risk. er and also prncy risk caused
able 3: ptimization M
when the levee of reinsurancero, and there rer to transfer cost. Howevery changes fro
ncreasing, and rate is 1, the
asing capital in
that when the ases), the optimer to reduce come can be useequal to 1 whis invested in r
urn of risk-fre
e Strategy
emuim income sitive and incrit is necessary Higher reinsu
rompt the insud by higher rein
Model Without
el of premuim e cost is low (is no risky inall underwrit
r, when the rateom more aggrethe capital heloptimal capitanstead of buyi
level of premmal capital is napital held so
ed to offset insohether the rate risk-free assets
ee assets are g
is low (P1 = 10reases with th
y for the insureurance cost wilurer to increasnsurance cost.
t Constraint
income is low = 0.05 in ou
nvestment. Thiting risk to the of reinsurancessive to morld is increasingal is great, anding reinsuranc
mium income inegative, which
as to decreasolvency risk. Inof reinsuranc
s. This suggestgreat enough to
0
he er ll
se
w ur is
he ce re g. d
ce
is h
se n
ce ts o
9

Op
Note: Prequire
Note: Prequire
ptimal Solution
P1 – premium inced; * – the optima
Optimal So
P1 – premium inced; * – the optima
ns Obtained b
come; – the rate al portion of risky
olutions Obtaion the
come; – the rate al portion of risky
Jou
© 2015 Nation
Table 4: by Optimizatio
of reinsurance coassets; a* – the op
Table 5: ined by the O
e Swiss Solven
of reinsurance coassets; a* – the op
urnal of Insu
nal Association of
on Model Bas
ost; K(1)* – the optimal portion of r
ptimization Mcy Test
ost; K(1)* – the optimal portion of r
rance Regul
Insurance Commi
ed on Solvenc
ptimal adjustmentretention.
Model Based
ptimal adjustmentretention.
lation
ssioners
cy II
t capital
t capital
10

Insurer Capital, Investment and Reinsurance Strategy
© 2015 National Association of Insurance Commissioners
From Table 4 and Table 5, we find that the optimal adjustment capital required is greater with the constraints of Solvency II and the SST than without these constraints of insolvency. The tables illustrate that Solvency II and the SST tend to be more prudent in terms of determining optimal capital level.
From Table 4 and Table 5, we also find that the investment strategies are more aggressive when optimal adjustment capital required is greater or the premium income is greater. The higher capital and higher premium income can help the insurer to hedge the investment risk so as to allow for more aggressive investment strategies. All of these findings provide insight on the decision of optimal capital, investment and reinsurance strategies.
Next, we perform a sensitivity analysis of the optimal adjustment capital required, investment and reinsurance strategies to the change in several critical parameters, including the ratio of the frictional cost of capital, cc; the rate of reinsurance cost, ; the drift of the rate of return on risky assets, ; the volatility of the return rate of the risky assets invested, ; the volatility of claim loss rate, 1; and the ratio of total bankruptcy cost to firm value, cf.
The Effect of Changes in cc,
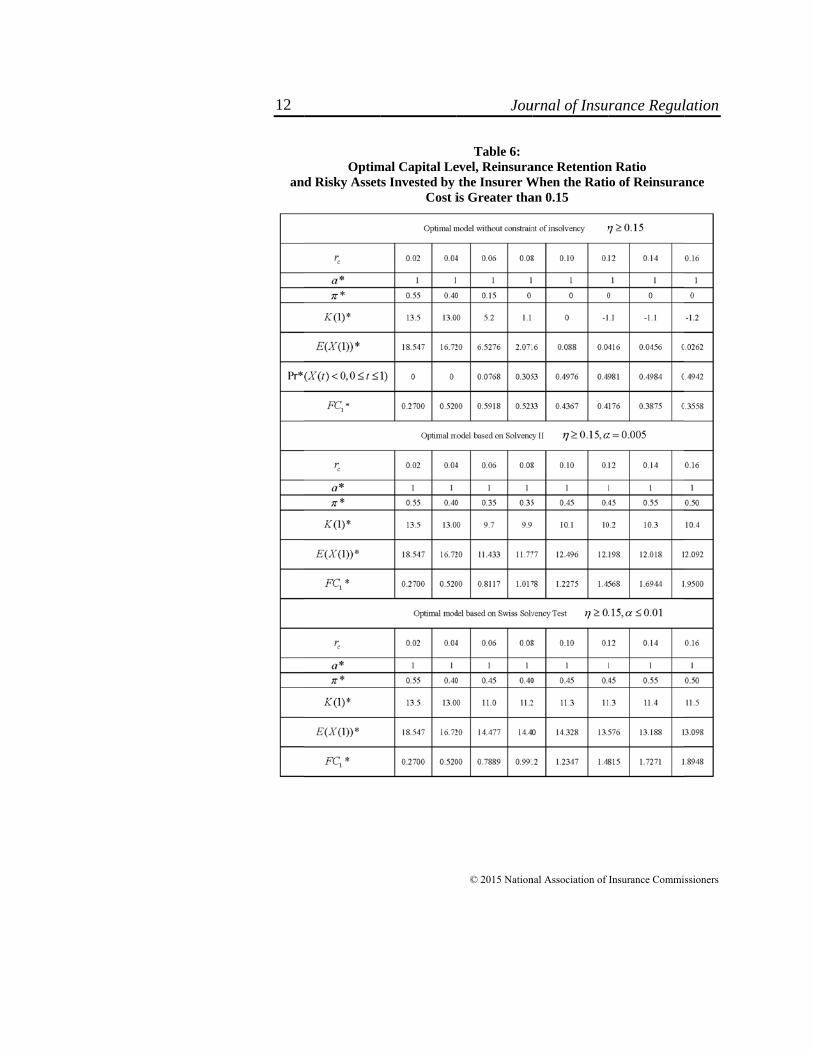
Table 6 and Table 7 display the optimal values of the proportions of reinsurance retention and the risky assets invested and the capital adjusted by the insurer for different values of the ratio of capital cost cc and the rate of reinsurance cost , when we use the criteria of minimizing the total control cost. The confidence level is set equal to 0.5% for Solvency II and 1% for the SST. We present the results for the second scenario of premium income. (The analyses of the other two scenarios of premium income are similar.)
The results in Table 6 show that the optimal investment strategy, *, tends to be more aggressive when the ratio of capital cost, cc, is small and the optimal adjustment capital required, K(1)*, is large with the optimization model without constraint of insolvency. (The optimal portion of risky assets (*) equals 0.55 when the ratio of capital cost, cc, is 0.02, and the optimal adjustment capital required, K(1)*, is 13.5.) However, the investment strategies tend to be more conservative with increases in the ratio of capital cost and with decreases in the optimal adjustment capital required. The portion of risky assets becomes zero when the optimal adjustment capital required is very small or negative. Because lower capital level means higher insolvency risk, the insurer should select a more conservative investment strategy in order to reduce investment risk and further to reduce insolvency risk. However, based on the estimation from the second and third model (with constraint of insolvency), the optimal capital levels are much higher than those estimated by the first model (without constraint of insolvency).
11
an
Optimd Risky Asset
mal Capital Lets Invested by
Cost i
Jou
© 2015 Nation
Table 6: evel, Reinsurathe Insurer Wis Greater tha
urnal of Insu
nal Association of
ance RetentionWhen the Ratian 0.15
rance Regul
Insurance Commi
n Ratio io of Reinsura
lation
ssioners
ance
12
Insurer Capital, Investment and Reinsurance Strategy
© 2015 National Association of Insurance Commissioners
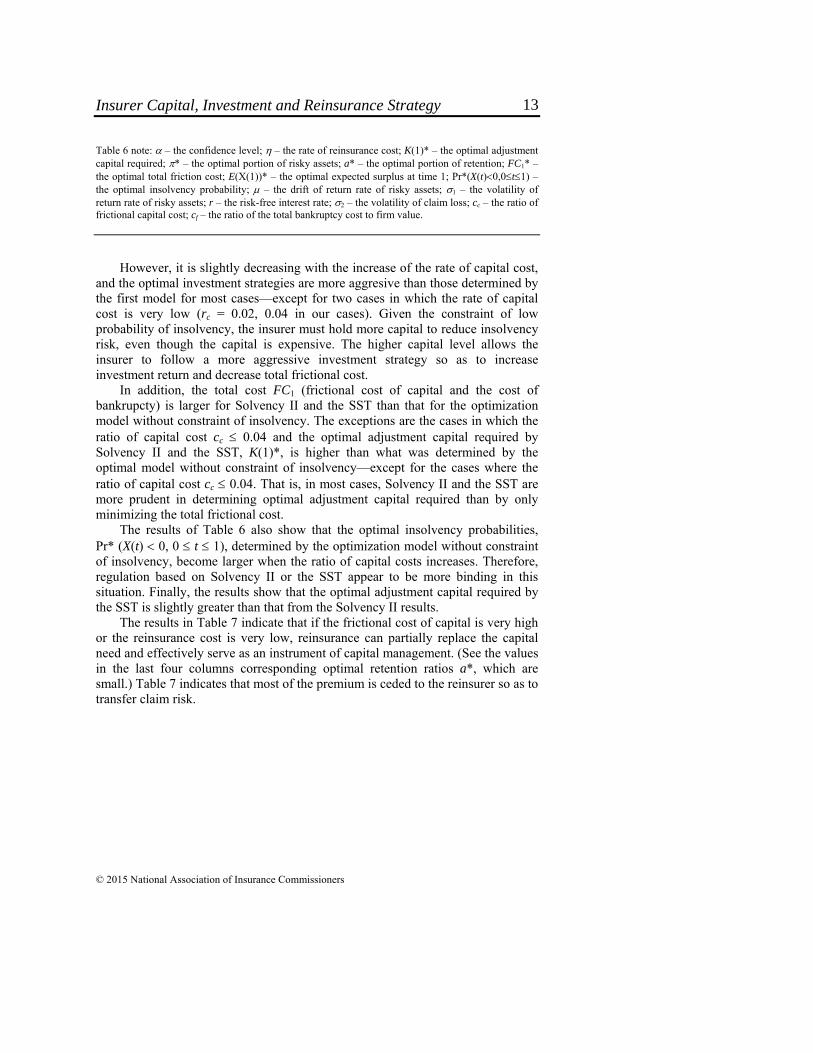
Table 6 note: – the confidence level; – the rate of reinsurance cost; K(1)* – the optimal adjustment capital required; * – the optimal portion of risky assets; a* – the optimal portion of retention; FC1* – the optimal total friction cost; E(X(1))* – the optimal expected surplus at time 1; Pr*(X(t)0,0t1) – the optimal insolvency probability; – the drift of return rate of risky assets; 1 – the volatility of return rate of risky assets; r – the risk-free interest rate; 2 – the volatility of claim loss; cc – the ratio of frictional capital cost; cf – the ratio of the total bankruptcy cost to firm value.
However, it is slightly decreasing with the increase of the rate of capital cost, and the optimal investment strategies are more aggresive than those determined by the first model for most cases—except for two cases in which the rate of capital cost is very low (rc = 0.02, 0.04 in our cases). Given the constraint of low probability of insolvency, the insurer must hold more capital to reduce insolvency risk, even though the capital is expensive. The higher capital level allows the insurer to follow a more aggressive investment strategy so as to increase investment return and decrease total frictional cost.
In addition, the total cost FC1 (frictional cost of capital and the cost of bankrupcty) is larger for Solvency II and the SST than that for the optimization model without constraint of insolvency. The exceptions are the cases in which the ratio of capital cost cc 0.04 and the optimal adjustment capital required by Solvency II and the SST, K(1)*, is higher than what was determined by the optimal model without constraint of insolvency—except for the cases where the ratio of capital cost cc 0.04. That is, in most cases, Solvency II and the SST are more prudent in determining optimal adjustment capital required than by only minimizing the total frictional cost.
The results of Table 6 also show that the optimal insolvency probabilities, Pr* (X(t) 0, 0 t 1), determined by the optimization model without constraint of insolvency, become larger when the ratio of capital costs increases. Therefore, regulation based on Solvency II or the SST appear to be more binding in this situation. Finally, the results show that the optimal adjustment capital required by the SST is slightly greater than that from the Solvency II results.
The results in Table 7 indicate that if the frictional cost of capital is very high or the reinsurance cost is very low, reinsurance can partially replace the capital need and effectively serve as an instrument of capital management. (See the values in the last four columns corresponding optimal retention ratios a*, which are small.) Table 7 indicates that most of the premium is ceded to the reinsurer so as to transfer claim risk.
13

O
Optimal CapitInvested by th
tal Level, Reinhe Insurer Wh
Jou
© 2015 Nation
Table 7: nsurance Retehen the Ratio
urnal of Insu
nal Association of
ention Ratio anof Reinsuran
rance Regul
Insurance Commi
nd Risky Assece Cost is 0.05
lation
ssioners
ets 5
14

Insurer C
© 2015 Natio
Table 7 note:capital requirthe optimal tothe optimal ireturn rate of frictional cap
Table
model andmodel for m(rc = 0.02reinsuranceallow the investment
Figurethe probabinsolvencynumerical
Thethe Pr
In
Capital, Inve
onal Association o
– the confidencred; * – the optimotal friction cost; insolvency probabf risky assets; r – thital cost; cf – the ra
7 also indicated third model most cases—e2, 0.04 in oue can decreaseinsurer to ta
t return and dece 1 depicts the bility of insoly, and the conresults of the e
e Relationshiprobability of Innsolvency, and
estment and R
f Insurance Comm
ce level; – the ramal portion of riskE(X(1))* – the op
bility; – the drifhe risk-free interesatio of the total ba
es that the inveare more aggxcept for two c
ur cases). Hige probability oake more aggcrease total fricrelationship b
lvency based nfidence level
example.
Figp Between the nsolvency Bas
d the ConfidenSwiss Solven
Reinsurance
missioners
ate of reinsurance ky assets; a* – the ptimal expected suft of return rate ost rate; 2 – the voankruptcy cost to fi
estment strategressive than thcases that the r
gher capital leof insolvency agressive investctional cost. etween the raton optimal m
l of Solvency
gure 1: Rate of Fricti
sed on a Modence Levels for cy Test ( 0
e Strategy
cost; K(1)* – the ooptimal portion o
urplus at time 1; Pof risky assets; 1 olatility of claim lofirm value.
gies determinedhose determinrate of capital cevel or a highand underwirintment strategy
te of frictional model withouty II and the
ional Cost of Cel Without CoSolvency II a.15)
optimal adjustmenof retention; FC1* Pr*(X(t)0,0t1)
– the volatility ooss; cc – the ratio o
d by the secondned by the firscost is very lowher portion o
ng risk so as toy, obtain mor
cost of capitalt constraint oSST from th
Capital, nstraint of nd the
nt – –
of of
d st w of o
re
l, of he
15

FmodebasedSST iThe rSolvethan dthe ca
FdetermSolvereinsuexamdetermas thecapitacapita
Th
8
equal discussmalle
Figure 1 showsel without consd on Solvency in most cases—results also indency II or the determining caases where the Figure 2 descrmined by the oency II and theurance for each
mple. The resumined by the oe rate of frictioal will make thal in order to k
he Relationshi
8. The reason thatto 1 when s the cases witho
er value of and
s that the probstraint of insolII and with ta
—except for thdicate that settSST leads to
apital by only ratio of capital
ribes the relatioptimization me SST and the rh exposure lts in Figure optimization monal cost of cahe total controeep the total co
ip Between OpCapital Cost
t we choose 00.15. In order to
out reinsurance. Idiscuss the cases
Jou
© 2015 Nation
bability of insolvency is muchail value at rishe cases whereting the regulagreater prudenminimizing th
l cost is very sionship betwee
model without rate of friction 0.158 and ot2 indicate tha
model without apital, cc, increol cost increasontrol cost min
Figure 2: ptimal Adjustof Three Mod
0.15
is that the op
o make analysis In Figure 3 and F with reinsurance
urnal of Insu
nal Association of
olvency based h greater than sk (TVaR) cone the ratio of caatory capital lence toward thhe total frictionmall. en the optimaconstraint of i
nal cost of capither data as deat the optimalconstraint of iases, since largse, and it is nenimized.
tment Capital dels ( 0.15)
ptimal retention p and comparison
Figure 5 (also seee.
rance Regul
Insurance Commi
on the optimiwith VaR con
nstraint based apital cost cc evel based on e risk of insolnal cost—exce
al adjustment cinsolvency, basital when the c
escribed above l adjustment cinsolvency decger frictional cecessary to de
and the Ratio)
portion of reinsurn conveniently, we Table 7), we w
lation
ssioners
ization nstraint on the 0.04.
either lvency ept for
capital sed on cost of in the
capital creases cost of ecrease
o of
rance is we first
will set a
16
Insurer C
© 2015 Natio
The Chanth
The re
by Solvencthe probabincrease caFinally, Fithe SST isretention o
Figureoptimal prothe reinsurthat reinsuinstrumentand the fricand Figuredifferent bhigh and th
Capital, Inve
onal Association o
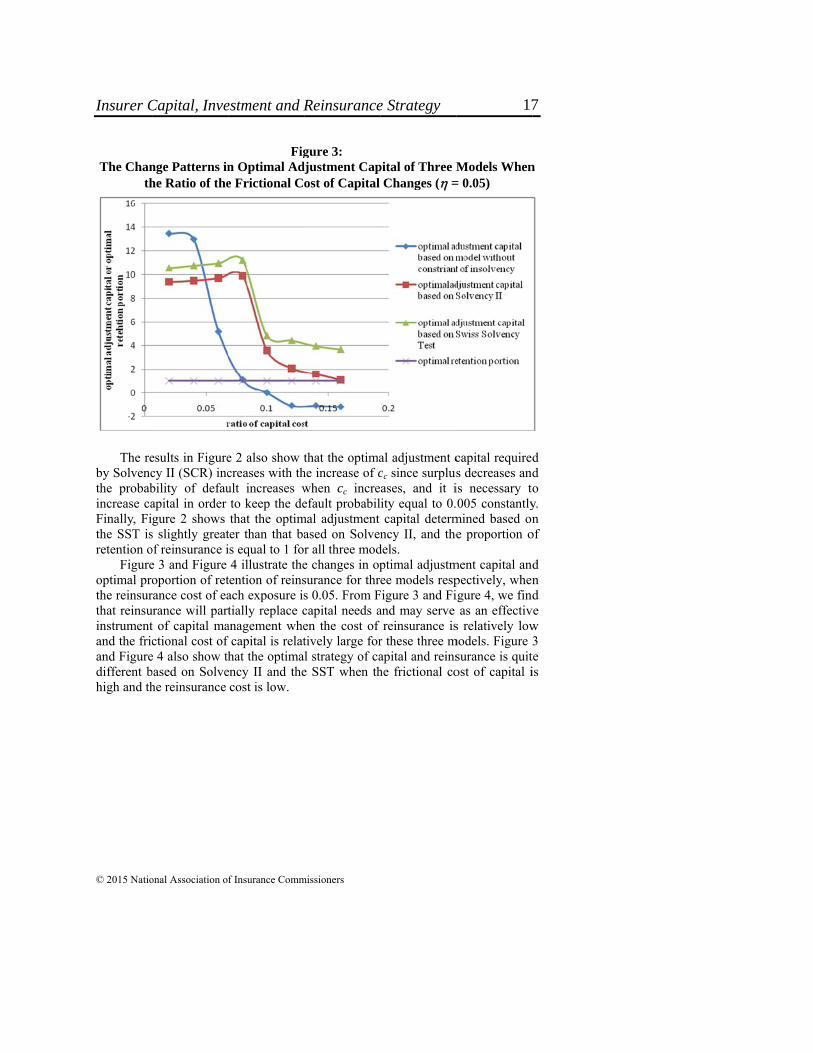
nge Patterns inhe Ratio of the
esults in Figurecy II (SCR) incbility of defauapital in order gure 2 shows
s slightly greatof reinsurance ie 3 and Figure oportion of retrance cost of eaurance will partt of capital mactional cost of
e 4 also show thbased on Solvehe reinsurance
estment and R
f Insurance Comm
Fign Optimal Ade Frictional C
e 2 also show tcreases with thult increases wto keep the dethat the optim
ter than that bais equal to 1 fo4 illustrate the
tention of reinsach exposure istially replace c
anagement whef capital is relathat the optima
ency II and thecost is low.
Reinsurance
missioners
gure 3: djustment Capost of Capital
that the optimahe increase of cwhen cc increefault probabil
mal adjustment ased on Solvenr all three mode changes in opsurance for thrs 0.05. From Fcapital needs aen the cost of tively large forl strategy of cae SST when th
e Strategy
pital of Three MChanges ( =
al adjustment ccc since surplusases, and it iity equal to 0.capital determ
ncy II, and thedels. ptimal adjustmee models resp
Figure 3 and Fiand may serve
reinsurance isr these three mapital and reinshe frictional co
Models When= 0.05)
capital requireds decreases andis necessary to005 constantly
mined based one proportion o
ment capital andpectively, whenigure 4, we findas an effectiv
s relatively lowmodels. Figure 3
surance is quitost of capital i
n
d d o y. n
of
d n d
ve w 3 te is
17

The
The E
Tpropowhenresperequirrisky optiminvestvolatiincreaunchathe fir
ItFC1* claimwhat cost (in the
e Change PattWhen the Rat
Effect of Cha
Table 8, Table ortions of reinsn the parametectively. The dred, K(1)*, remassets, *, is
mal adjustmenttment, all optility of risky asases, but optimanged when thrm value, cf, int is important tincrease, but t
m loss, 2, increvalue of claim
( = 0.15 in oue situations of
terns in Optimtio of the Fric
anges in ,
9 and Table 10surance retentiers of , 1, data in Table
mains constant zero when part capital requtimal solutionsssets, and 1
mal probability he risk-free intncrease. to notice that tthe optimal capeases, and optimm loss, 2, takur cases) will lef greater claim
Jou
© 2015 Nation
Figure 4: mal Proportionctional Cost of
1, r, 2 and
0 list the optimion and the rir, 2 and cf
e 8 show thawhen paramet
rameters changuired is negats remain unch1, change. The of insolvency
terest rate, r, a
the optimal valpital level remmal retention p
kes. These resuead the insurer m risk. The o
urnal of Insu
nal Association of
n of Retentionf Capital Chan
cf
mal adjustment sky assets inv
f change baseat the optimalters change. Thge, and the maative. Becausehanged when optimal total f, Pr* (X(t) 0,
and the ratio o
lues of Pr* (X(mains unchangeportions are allults illustrate th
to retain all proptimal econom
rance Regul
Insurance Commi
n of Three Monges ( = 0.05
t capital requirevested by the id on three ml adjustment che optimal portain reason is the there is no
the return ratfrictional cost, 0 t 1), is af bankruptcy c
(t) 0, 0 t ed as the volati equal to 1 no hat high reinsuremium incommic strategy f
lation
ssioners
odels )
ed, the insurer
models, capital tion of hat the
risky te and FC1*,
almost cost to
1) and ility of matter urance e even
for the
18
Insurer Capital, Investment and Reinsurance Strategy
© 2015 National Association of Insurance Commissioners
insurer is to keep capital unchanged, but this approach will increase the insurer's probability of insolvency when the volatility of claim loss, 2, increases. This is the limitation of model one. Minimizing total frictional cost from the insurer's perspective may conflict with the objective of regulation. The data in Table 8 also show that the optimal investment strategy is that all surplus is invested in risk-free assets. The return of risk-free assets can help to offset part of claim risk and help to reduce total frictional cost.
Table 9 indicates that with the constraint of Solvency II, the optimal capital, K(1)*, slightly decreases with the increase of the drift of return rate of risky assets, , and slightly increases with the increase of volatility of return rate of risky asset, 1, and risk-free interest rate, r. And the optimal adjustment capital is much greater than determined earlier based on the optimization model without constraint of insolvency. From Table 9, we also observe that the optimal solution of K(1)* greatly increases as the volatility of claim loss, 2, increases. The increase of claim risk will lead to increased capital in order to keep the insolvency probability within the criterion of Insolvency II. But the optimal retention portion are all equal to 1 for all values of 2, meaning that it is optimal for the insurer to raise capital instead of purchasing reinsurance in order to reduce underwriting risk due to higher rate of reinsurance cost. Therefore, based on the analysis above, we illustrate based on various assumptions and with regard to varying regulatory standards that capital and reinsurance can be substitutes. On the one hand, when reinsurance cost is rather low but capital cost is rather high, reinsurance can partially or fully substitute for capital, as shown in Table 7. On the other hand, capital can partially or fully substitute for reinsurance when capital cost is rather low but the reinsurance cost is rather high, as in Table 6. Finally, we find from Table 9 that optimal adjustment capital remains fairly constant when the ratio of total bankruptcy cost to firm value, cf, increases, but the total frictional cost, FC1*, increases with the increase of cf.
From Table 10, we find that the change patterns are similar to those in Table 9 when the parameters change. However, the optimal adjustment capital, K(1)*, and the optimal total frictional cost, FC1*, are slightly greater than those in Table 9. That is, the criteria of the SST are slightly more prudent in determining the optimal adjustment capital.
It should be noticed that Table 8, Table 9 and Table 10 indicate that the optimal total frictional cost (and other optimal solutions) are very sensitive to the change of the volatility of claim loss, 2, but the optimal frictional cost (and other optimal solutions) changes very slightly as other paramters change, given the condition that the rate of reinsurance cost = 0.15. So, 2 is the most important parameter affecting total frictional cost. In the following, we will further discuss the sensitivity of the optimal solutions as 2 increases when takes smaller values ( = 0.10) for three models, respectively.
19

OpRisk
an
ptimal Adjustmky Assets Invend cf Based on
ment Capital Rested by the Inn the Optimiza
Jou
© 2015 Nation
Table 8: Required, Rei
nsurer with Vaation Model W
urnal of Insu
nal Association of
insurance Retarying Param
Without Insolv
rance Regul
Insurance Commi
tention Ratio ameters of , 1,vency Constra
lation
ssioners
and , r, 2 aint
20

Insurer C
© 2015 Natio
Note: – therequired; * optimal total optimal insolrate of risky frictional cap
Capital, Inve
onal Association o
e confidence level;– the optimal porfriction cost; E(X
lvency probabilityassets; r – the risital cost; cf – the ra
estment and R
f Insurance Comm
Table 8
; – the rate of rertion of risky asse
X(1))* – the optim; – the drift of rsk-free interest raatio of the total ba
Reinsurance
missioners
(Continued)
einsurance cost; K(ets; a* – the optimal expected surplureturn rate of risky
ate; 2 – the volatankruptcy cost to fi
e Strategy
(1)* – the optimalmal portion of reteus at time 1; Pr*(Xy assets; 1 – the tility of claim lossfirm value.
l adjustment capitatention; FC1* – thX(t)0,0t1) – thvolatility of returs; cc – the ratio o
al he he rn of
21

OpRisk
ptimal Adjustmky Assets Inve
and cf
ment Capital Rested by the Inf Based on the
Jou
© 2015 Nation
Table 9: Required, Rei
nsurer with Vae Optimal Mo
urnal of Insu
nal Association of
insurance Retarying Param
odel with Solve
rance Regul
Insurance Commi
tention Ratio ameters of , 1,
ency II
lation
ssioners
and , r, 2
22

Insurer C
© 2015 Natio
Note: – therequired; * optimal total optimal insolrate of risky frictional cap
Capital, Inve
onal Association o
e confidence level;– the optimal porfriction cost; E(X
lvency probabilityassets; r – the risital cost; cf – the ra
estment and R
f Insurance Comm
Table 9
; – the rate of rertion of risky asse
X(1))* – the optim; – the drift of rsk-free interest raatio of the total ba
Reinsurance
missioners
(Continued)
einsurance cost; K(ets; a* – the optimal expected surplureturn rate of risky
ate; 2 – the volatankruptcy cost to fi
e Strategy
(1)* – the optimalmal portion of reteus at time 1; Pr*(Xy assets; 1 – the tility of claim lossfirm value.
l adjustment capitatention; FC1* – thX(t)0,0t1) – thvolatility of returs; cc – the ratio o
al he he rn of
23

OpRisk
ptimal Adjustmky Assets Inve
and cf Based
ment Capital Rested by the Ind on the Optim
Jou
© 2015 Nation
Table 10: Required, Rei
nsurer with Vamal Model wi
urnal of Insu
nal Association of
insurance Retarying Paramith the Swiss S
rance Regul
Insurance Commi
tention Ratio ameters of , 1,Solvency Test
lation
ssioners
and , r, 2
24

Insurer C
© 2015 Natio
Note: – therequired; * optimal total optimal insolrate of risky frictional cap
Table
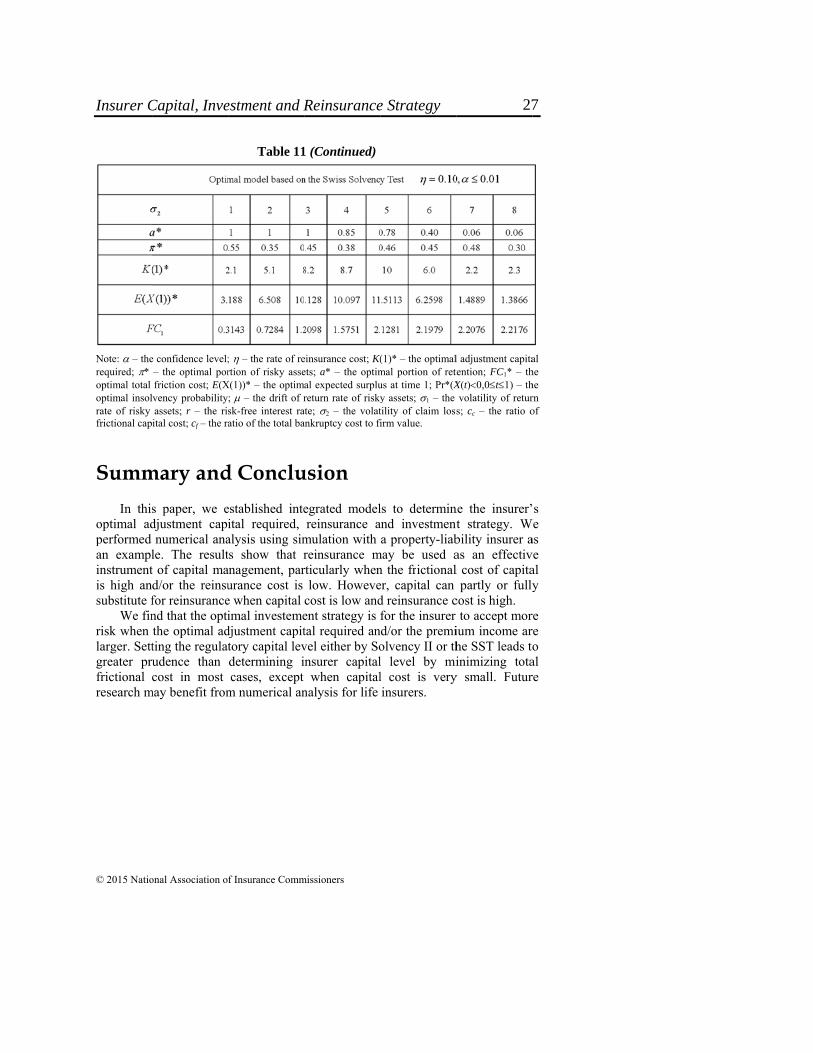
is still equfrom 0.15 reinsurancestill retainincrease inmodel 2 baportion decin that the and Table satisfying t
Capital, Inve
onal Association o
e confidence level;– the optimal porfriction cost; E(X
lvency probabilityassets; r – the risital cost; cf – the ra
11 lists the resual to 1 as 2 i
to 0.1 for mode cannot help
ns all preimumncome and reduased on Insolvcreases with thrate of reinsu10.) The insu
the regulation r
estment and R
f Insurance Comm
Table 10
; – the rate of rertion of risky asse
X(1))* – the optim; – the drift of rsk-free interest raatio of the total ba
sults. Table 11increases, althodel 1 (withoutthe insurer to
m income but uce the risk of
vency II and mhe increase of rance cost is lurer reduces trequirement.
Reinsurance
missioners
0 (Continued)
einsurance cost; K(ets; a* – the optimal expected surplureturn rate of risky
ate; 2 – the volatankruptcy cost to fi
indicates that ough the rate oconstraint of
decrease total invests all su
f claim loss. Tamodel 3 based o2 and optimaarger ( = 0.1the capital cos
e Strategy
(1)* – the optimalmal portion of reteus at time 1; Pr*(Xy assets; 1 – the tility of claim lossfirm value.
the optimal reof reinsuranceinsolvency). Tfrictional costurplus in riskable 11 also inon the SST, opal capital level 5) when 2 4st through rein
l adjustment capitatention; FC1* – thX(t)0,0t1) – thvolatility of returs; cc – the ratio o
etention portione cost decreaseThis means that, so the insurek-free assets tondicates that foptimal retentionl is much lowe4. (See Table 9nsurance whil
al he he rn of
n es at er o
or n
er 9 le
25

OpRisky
ptimal Adjustmy Assets Inves
on Three O
ment Capital Rsted by the InsOptimization
Jou
© 2015 Nation
Table 11: Required, Reisurer with VarModels Respe
urnal of Insu
nal Association of
insurance Retrying Parameectively (Give
rance Regul
Insurance Commi
tention Ratio aeter of 2 and en = 0.10)
lation
ssioners
and Based
26
Insurer C
© 2015 Natio
Note: – therequired; * optimal total optimal insolrate of risky frictional cap
Summ In this
optimal adperformed an examplinstrumentis high ansubstitute f
We finrisk when larger. Settgreater prfrictional research m
Capital, Inve
onal Association o
e confidence level;– the optimal porfriction cost; E(X
lvency probabilityassets; r – the risital cost; cf – the ra
mary and
s paper, we edjustment capinumerical ana
le. The resultt of capital mad/or the reinsufor reinsurancend that the optithe optimal adting the regulatudence than cost in most
may benefit from
estment and R
f Insurance Comm
Table 11
; – the rate of rertion of risky asse
X(1))* – the optim; – the drift of rsk-free interest raatio of the total ba
d Conclu
established inteital required, alysis using simts show that ranagement, parurance cost is e when capital imal investeme
djustment capittory capital levdetermining icases, except
m numerical an
Reinsurance
missioners
1 (Continued)
einsurance cost; K(ets; a* – the optimal expected surplureturn rate of risky
ate; 2 – the volatankruptcy cost to fi
usion
egrated modelreinsurance a
mulation with reinsurance mrticularly when
low. Howevecost is low andent strategy is tal required anvel either by Soinsurer capital
when capitalnalysis for life
e Strategy
(1)* – the optimalmal portion of reteus at time 1; Pr*(Xy assets; 1 – the tility of claim lossfirm value.
ls to determinand investmenta property-liab
may be used an the frictionaler, capital can d reinsurance cfor the insurer
nd/or the premiolvency II or thl level by mil cost is veryinsurers.
l adjustment capitatention; FC1* – thX(t)0,0t1) – thvolatility of returs; cc – the ratio o
ne the insurer’t strategy. Wbility insurer aas an effectivl cost of capita
partly or fullycost is high.
to accept morium income arhe SST leads toinimizing tota
y small. Futur
al he he rn of
s We
as ve al y
re re o al re
27
Journal of Insurance Regulation
© 2015 National Association of Insurance Commissioners
References
Chandra, V., and M. Sherris, 2006. “Capital Management and Frictional Costs in Insurance,” Australian Actuarial Journal, 12(4): 344–399.
Cummins, J.D., and R.D. Phillips, 2009. “Capital Adequacy and Insurance Risk-Based Capital Systems,” Journal of Insurance Regulation, 28(1): 25–72.
Dhaene, J., M.J. Goovaerts, and R. Kaas, 2003. “Economic Capital Allocation Derived from Risk Measures,” North American Actuarial Journal, 7: 44–59.
Eling, M., and I. Holzmüller, 2008. “An Overview and Comparison of Risk-Based Capital Standards,” Journal of Insurance Regulation, 26(4): 31–60.
Eling, M., H. Schmeiser, and J. Schmit, 2007. “The Solvency II Process: Overview and Critical Analysis,” Risk Management and Insurance Review, 10(1): 69–85.
Fier, S., K. McCullough, and J.M. Carson, 2013. “Internal Capital Markets and the Partial Adjustment of Leverage,” Journal of Banking and Finance, 37(3): 1029–1039.
Flannery, M.J., and K.P. Rangan, 2006. “Partial Adjustment Toward Target Capital Structures,” Journal of Financial Economics, 79: 469–506.
Gatzert, N., and H. Wesker, 2012. “A Comparative Assessment of Basel II/III and Solvency II,” The Geneva Papers, 37: 539–570.
Holzmüller, I., 2009. “The United States RBC Standards, Solvency II and the Swiss Solvency Test: A Comparative Assessment,” Geneva Papers on Risk and Insurance: Issues and Practice, 34: 56–77.
Kielholz, W., 2000. “The Cost of Capital for Insurance Companies,” Geneva Papers on Risk and Insurance, 25(1): 4–24.
Leary, M.T., and M.R. Roberts, 2005. “Do Firms Rebalance Their Capital Structures?,” Journal of Finance, 60(6): 2575–2619.
Lewis, C.M., 2009. “Firm-Specific Estimates of the Ex Ante Bankruptcy Discount,” working paper at SSRN: http://papers.ssrn.com/sol3/papers.dfm?abstract_id=1372284.
Luder, T., 2005. “Swiss Solvency Test in Non-Life Insurance,” working paper at: www.finma.ch/archiv/bpv/download/e/SST_Astin_colloquium_Luder_Thomas.pdf.
Mao, H., and K. Ostaszewski, 2010. “Pricing Insurance Contracts and Determining Optimal Capital of Insurers,” The Proceedings of International Conference of Industrial Engineering and Industrial Management, pp. 1–5.
Schmeiser, H., and C. Siegel, 2013. “Regulating Insurance Groups: A Comparison of Risk-Based Solvency Models,” Journal of Financial Perspectives, 1:119–131.
Smith, M. J-H, 2010. “Solvency II: The Ambitious Modernization of the Prudential Regulation of Insurers and Reinsurers Across the European Union (EU),” Connecticut Insurance Law Journal, 16(2): 357–398.
28

Insurer Capital, Investment and Reinsurance Strategy
© 2015 National Association of Insurance Commissioners
Staking, K., and D. Babbel, 1995. “The Relation Between Capital Structure, Interest Rate Sensitivity and Market Value in the Property-Liability Insurance Industry,” Journal of Risk and Insurance, 62: 690–718.
Strebulaev, Illya A., 2007. “Do Tests of Capital Structure Theory Mean What They Say?,” Journal of Finance, 62(4): 1747–1787.
29

Journal of Insurance Regulation
Guidelines for Authors
Submissions should relate to the regulation of insurance. They may include
empirical work, theory, and institutional or policy analysis. We seek papers that advance research or analytical techniques, particularly papers that make new research more understandable to regulators.
Submissions must be original work and not being considered for publication elsewhere; papers from presentations should note the meeting. Discussion, opinions, and controversial matters are welcome, provided the paper clearly documents the sources of information and distinguishes opinions or judgment from empirical or factual information. The paper should recognize contrary views, rebuttals, and opposing positions.
References to published literature should be inserted into the text using the “author, date” format. Examples are: (1) “Manders et al. (1994) have shown. . .” and (2) “Interstate compacts have been researched extensively (Manders et al., 1994).” Cited literature should be shown in a “References” section, containing an alphabetical list of authors as shown below.
Cummins, J. David and Richard A. Derrig, eds., 1989. Financial Models of
Insurance Solvency, Norwell, Mass.: Kluwer Academic Publishers. Manders, John M., Therese M. Vaughan and Robert H. Myers, Jr., 1994.
“Insurance Regulation in the Public Interest: Where Do We Go from Here?” Journal of Insurance Regulation, 12: 285.
National Association of Insurance Commissioners, 1992. An Update of the NAIC
Solvency Agenda, Jan. 7, Kansas City, Mo.: NAIC. “Spreading Disaster Risk,” 1994. Business Insurance, Feb. 28, p. 1.
Footnotes should be used to supply useful background or technical information that might distract or disinterest the general readership of insurance professionals. Footnotes should not simply cite published literature — use instead the “author, date” format above.
Tables and charts should be used only if needed to directly support the thesis of the paper. They should have descriptive titles and helpful explanatory notes included at the foot of the exhibit.
Journal of Insurance Regulation
Papers, including exhibits and appendices, should be limited to 45 double-spaced pages. Manuscripts are sent to reviewers anonymously; author(s) and affiliation(s) should appear only on a separate title page. The first page should include an abstract of no more than 200 words. Manuscripts should be sent by email in a Microsoft Word file to:
Cassandra Cole and Kathleen McCullough [email protected]
The first named author will receive acknowledgement of receipt and the
editor’s decision on whether the document will be accepted for further review. If declined for review, the manuscript will be destroyed. For reviewed manuscripts, the process will generally be completed and the first named author notified in eight to 10 weeks of receipt.
Published papers will become the copyrighted property of the Journal of Insurance Regulation. It is the author’s responsibility to secure permission to reprint copyrighted material contained in the manuscript and make the proper acknowledgement.
NAIC publications are subject to copyright protection. If you would like to reprint an NAIC publication, please submit a request for permission via the NAIC Web site at www.naic.org. (Click on the “Copyright & Reprint Info” link at the bottom of the home page.) The NAIC will review your request.