cashless japan: unlocking influential risk on mobile
TRANSCRIPT

Cashless Japan: Unlocking Influential Risk on Mobile Payment Service
Wei-Lun Chang1& Li-Ming Chen2
& Takako Hashimoto3
Accepted: 15 June 2021# The Author(s), under exclusive licence to Springer Science+Business Media, LLC, part of Springer Nature 2021
AbstractIn Japan, cashless is not yet popular but government and companies are devoted to the development of mobile payment methods.This research collected 241 Japanese users and applied decision trees algorithm. Six types of perceived risks (financial, privacy,performance, psychological, security, and time) were used and the categorized class is intention to use mobile payment (low,medium, and high). We also compared different competitive models to examine the performance, including decision trees, kNN,Naïve Bayes, SVM, and logistic regression and decision trees outperformed among all models. The findings indicated thatprivacy and performance risks are import to Japanese users. Safe, secured, reliable, and fast mobile payment environment aremore important to low intention users (less concerns about financial risk). Financial loss, safe, secured, reliable, and fast mobilepayment environment are more important to medium intention users (less concerns about time and security risk). Monetary loss,safe, reliable, and fast mobile payment environment are more important to high intention users (less concerns about security riskand psychological risk). The results can help Japanese companies unlock the perceived risk on mobile payment and furnishappropriate strategies to improve usage.
Keywords Mobile payment . Perceived risk . Decision trees . Cashless
1 Introduction
The global mobile payment market exceeds $601.3 billion(Dighe, 2018) and is expected to reach $4573.8 billion by2023. Other sources (MarketsandMarkets, 2018) predict thatthe global digital payment market will be worth $ 10.07 tril-lion by 2026, with 5G being the key to the development. TheAsia Pacific, is predicted to generate a revenue of $ 3.62trillion in the year 2026, owing to its extensive market pene-tration towards digital payment coupled with cashless
economy. The more developed markets seeking to becomethe 5G global leaders (e.g. Japan), are expected to see rapid5G growth by 2025, accounting for half of total mobile con-nections. However, 5G opportunities are less attractive be-cause there is still more potential for leveraging the capabili-ties of 4G. The focus across the Asia Pacific markets is to pushinnovation in areas such as mobile commerce and payment(GSM Association, 2019).
An analysis of the popularity of mobile payment acrossAsia, including China (Alipay), India (Visa), and the US(Apple Pay and Android Pay), undertaken by MordorIntelligence (2018), uncovered that threats such as cybercrimeform the major barriers to mobile payment adoption.Particularly, credit cards are still the top payment in Japan,following by cash over the counter. PayPay, a mobile paymentapplication is rapidly gaining popularity since 2018 in Japanaccording to Asia Pacific eCommerce and Payments Guide(2020). Payment method changes have also contributed tothe transition from cash to cashless payment in retail(Arvidsson, 2014). Further, payments via smartphones haveraised concerns about risks amongst consumers (Saridakiset al., 2016). Existing literature showed that favorable attitude(Park et al., 2019) and service quality (Liébana-Cabanillaset al., 2019) positively influenced consumer willingness touse mobile payment. Security (Oliveira et al., 2016; Shaoet al., 2019), trust (Zhou, 2013), and risk (Cocosila &
* Wei-Lun [email protected]
Li-Ming [email protected]
Takako [email protected]
1 Department of Business Management, National Taipei University ofTechnology, 1, Sec. 3, Zhongxiao E. Rd, Taipei 10608, Taiwan
2 Department of Business Administration, National ChengchiUniversity, NO64,Sec.2,ZhiNan Rd.,Wenshan District, TaipeiCity 11605, Taiwan
3 Commerce and Economics, Chiba University of Commerce, 1-3-1Konodai, Chiba 272-8512, Japan
Information Systems Frontiershttps://doi.org/10.1007/s10796-021-10160-6

Trabelsi, 2016) were identified as the most affecting factors onmobile payment adoption. Although the mobile payment in-dustry has arguably reached maturity, concerns regarding pri-vacy and security risks persist (Albashrawi & Motiwalla,2019).
Existing studies have investigated factors that negativelyaffect perceived risks in mobile banking or online shoppingenvironment (e.g. Kim & Lennon, 2013; Mann & Sahni,2013), as these perceived risks slow down mobile paymentindustry development (Choi & Choi, 2017). They also nega-tively influence mobile payment consumer acceptance (Yanget al., 2015) and trust in this payment method (Park et al.,2019). In our study, we categories intention to use mobilepayment from low, medium, to high across the users inJapan. Following Dey (2002), Kabari and Nwachukwu(2013), and Ramezankhani et al. (2016), this research uses adecision tree classification method to investigate the link be-tween perceived risks of mobile payment based on (Yanget al., 2015; Thakur & Srivastava, 2014) and the three catego-ries (intention to use). The study expects to answer the calls byFahey (2019) and findings from the Mobile Economy ReportonGSMA (2019) and aims to provide insights into the barriersto mobile payment adoption in the developed Asia Pacific,particularly as Japan is set to lead the 5G innovation. Hence,the following research questions are put forth:
RQ1: What are the critical risks for different categoriesof mobile payment users?RQ2: What are the differences among the categories ofmobile payment users?
2 Related Literature
2.1 Mobile Payment
The process of payment in which mobile devices are used toexecute transactions for products or services, anytime andanywhere, is known as mobile payment. It is an alternativeto traditional payment methods by cash or credit card and usescommunication devices (Dahlberg et al., 2008) to carry out thepayment authorization and execution of financial transactions(De et al., 2018). Mobile payments have also been shown toincrease sales in physical stores (Liu et al., 2015). The accep-tance of mobile payment depends on the willingness to acceptnew technologies (Liébana-Cabanillas and Lara-Rubio, 2017;Qasim & Abu-Shanab, 2016). New smartphone functions,such as near field communication, support mobile paymentuse (Oliveira et al., 2016), reducing costs and increasing retailoutlet profitability (Chen & Li, 2017). Previous experiences(individual factor) and market competition (external factor)also influence the willingness to adopt mobile payment (Zhu
et al., 2017). Studies in the literature converge on the factorsaffecting mobile payment adoption: acceptance, risk, percep-tion, trust, and willingness (Liébana-Cabanillas et al., 2019;Cocosila & Trabelsi, 2016; Zhou, 2013; Park et al., 2019; Deet al., 2018; Oliveira et al., 2016; Shao et al., 2019); thesefactors are used in this study. Regarding the relation betweenacceptance and mobile payment use, mobile payment en-hances user experience and offers competitive differentiationin the market (Hayashi & Bradford, 2014). Also, smartphonelimitations negatively influence the user experience, whichvaries widely due to the variety of smartphone models andapplication vendors (Zhou, 2014). Additionally, the connec-tion between mobile payment and traditional paymentmethods plays an important role in building trust in mobilepayment (Cao et al., 2018).
Cybersecurity issues tend to dominate the decision to adoptmobile payment. Perceived threats of hackers and malwarethat threatens mobile devices have been shown to be the majorreasons for their low usage rate (Zhou, 2014). Mobile pay-ments may reduce financial losses in retail outlets, as theyhave been proven to be safer than credit card payments(Hayashi & Bradford, 2014). Yet early adoption of mobilepayment has created perceptions of risks and uncertainty(Xin et al., 2015), in particular amongst consumers who havelower trust in technologies and mobile services driven by con-cerns related with privacy, security, and erroneous paymenttransactions (Dinh et al., 2018). With regard to the perceptionfactor, studies show (Xin et al., 2015) that consumers areuncertain and do not trust mobile payment companies.Additionally, self-efficacy is a major factor influencing theresolution to use mobile payment in stores (Nel & Heyns,2017). Thus, when more retailers make mobile payment avail-able to consumers this will lead to the improvement of userperceptions and self-efficacy (Dinh et al., 2018). Researchshows that once consumers form trust towards mobile pay-ment they continue to use this method according to their un-derstanding of the level of security (Zhu et al., 2017). Trust inmobile payment providers is a significant factor affecting will-ingness to use (Xin et al., 2015). Conversely, the availabilityof additional mobile services has little effect on use (Nel &Heyns, 2017), as consumers may stop using mobile paymenteven if providers offered additional services (Zhou, 2014).
2.2 Perceived Risks in Mobile Payment
Perceived risk strongly influences the consumer decision pro-cess in any purchasing environment (Gillett, 1976). Perceivedrisk is defined as a likelihood of loss due to uncertainty relatedto unexpected outcomes when making purchase decisions(Featherman & Pavlou, 2003). The ability to accept perceivedrisk affects financial transaction decisions (Forsythe & Shi,2003), as perceived risk has been linked to consumers’ sub-jective expectations, thereby extending its influence on the
Inf Syst Front

mobile payment decision-making process. The literature onperceived risks has focused on the key risk categories: finan-cial, privacy, performance, psychological, time, and security.Financial risk indicates a possible monetary loss due to the useof mobile payment methods (Featherman & Pavlou, 2003). Itis advantageous to use mobile payment when other paymentmethods incur higher costs (Luarn & Lin, 2005) or when thecost of continuous usage leads to a possible financial loss.Additionally, financial risk is associated with monetary ex-penses and maintenance costs. The uncertainty regarding mo-bile payment authorization might increase mobile users’ con-cerns (Yang et al., 2015), as system malfunction during finan-cial transactions could lead to potential losses (Baganzi &Lau, 2017).
Privacy risk indicates the risk of personal informationexposure (Featherman & Pavlou, 2003), as consumers areconcerned about the exposure and misuse of their personaldata involved in mobile payments. Disclosure and misuseof personal information cause consumers to lose controlover their personal data (Khalilzadeh et al., 2017) allowingproviders to harvest, process, transfer, and sell their per-sonal information (Yang et al., 2015), thus helping theseproviders to gain insight on users’ non-public data andshopping behavior (Thakur & Srivastava, 2014).Sensitive information such as personal identification, cred-it card information, and other financial data makes manycustomers uncertain and concerned about their privacy(Baganzi & Lau, 2017). Performance risk relates to systemmalfunctions that affect mobile payment services providedto users (Featherman & Pavlou, 2003). Performance can bevolatile due to the limitations in smartphone capabilities;this volatility in turn raises users’ concerns (Yang et al.,2015). Consumers expect mobile payment to improve theefficiency of daily tasks (Khalilzadeh et al., 2017); howev-er, the instability of wireless connections and the limitedprocessing capabilities of mobile devices increase perfor-mance risk (Choi & Choi, 2017).
Psychological risk refers to frustration, perceived anxi-ety, and psychological pressure (Lim, 2003). Compared toonline payment or credit card payment, mobile payment isa novel and complex service. For example, consumersmight feel anxious because of a failed transaction (Yanget al., 2015). Psychological risk of mobile payment is alsoassociated with unfamiliarity, unreliability, and fear(Trachuk and Linder, 2017). Time risk indicates the delaysexperienced by using mobile payment because of user un-certainty, the learning curve of mobile applications, or therisk of an incomplete payment process (Featherman &Pavlou, 2003). Moreover, consumers occasionally experi-ence longer transaction time, causing inconvenience. Theneed for additional time to become experienced with themobile payment system and to troubleshoot its problems isalso a time risk factor affecting users (Choi & Choi, 2017).
Finally, security risk refers to the risk of uncontrolledtransactions and loss of financial information. It is alsoassociated with the perceived payment method security,security of information at rest and in transit, and cyberse-curity overall (Kolsaker & Payne, 2002). Cybersecurity isthe link between the perceived risk and the consumer atti-tude (Khalilzadeh et al., 2017); it assures information con-fidentiality, integrity, and service availability (Flaviánet al., 2006). Consequently, sales increase only when theperceived security of the payment transaction data and oth-er sensitive information is high (Thakur & Srivastava,2014).
2.3 Mobile Payment in Japan
The Ministry of Economy, Trade and Industry (METI) ofJapan published the “Cashless Vision” in 2018 to promotecashless payments and declared the goal of achieving a40% cashless payment ratio. The Cashless PromotionCouncil was established as an industry-academia-government collaboration to promote the CashlessPayments (Payments Japan, 2020). The Payments Japanconducted a quantitative and qualitative analysis of usersto consider measures for the spread of cashless payment(Payments Japan Consumer and Business Insight Survey,2020). The analysis addressed the reason that Japanesedon’t use mobile payments by a web-based survey with5000 people in September 24 to 29 of 2019. The resultsreported that only 19% of people carry a mobile paymentmethod on a daily basis, and only 13% of people (about700 people) use mobile payment at least once a month.Despite the fact that more than 80% of people are awareof mobile payments (e.g., Apple Pay, and Google Pay),24% have contactless IC payment apps (e.g. Apple Pay,and Google Pay) installed on their mobile devices and only14% usage. For code-based payment apps (e.g. Line Pay),42% have them installed but only about 30% usage. As of2019, mobile payment methods had not been shown to besufficiently widespread in Japan. Through a qualitativesurvey conducted by interviews with 15 more people, peo-ple do not use cashless payment because of lack of interestand need, concerns about overspending, lack of acceptancefrom the consumer’s point of view, avoidance of complex-ity in household management, and convenience compari-sons. These factors are considered to be largely related tothe perceived risks classified in the existing literatures(Yang et al., 2015; Thakur & Srivastava, 2014). The lowpopularity of cashless utilization is also illustrated in asurvey report by the Ministry of Economy, Trade andIndustry (METI) of Japan, which reported that Japan’scashless ratio was only about 20% in 2016, which is sig-nificantly lower than that of other major countries (40–60%) (METI report, 2020).
Inf Syst Front
3 Research Method
3.1 The Proposed Framework
Figure 1 shows the conceptual model that enfolds a C4.5decision tree learning algorithm (Quinlan, 1993). This studyutilizes perceived risks as the attributes and degree of intentionto use as the categories (i.e., low, medium, and high) in thedecision trees algorithm. Existing literature classified per-ceived risks into distinct categories such as financial, privacy,performance, psychological, monetary, time, and security(Yang et al., 2015; Thakur & Srivastava, 2014). We finallymerged monetary risk with financial risk to adopt the six fun-damental risks in mobile payment.
3.2 C4.5 Decision Trees
Decision trees as flowchart-like structures have been used forprocessing classification problems ever since the seminalwork from Breiman et al. (1984). The basis for the classifica-tion process must be known prior to establishing the classifi-cation model. Additionally, tree-structured models areestablished based on class labels and using actual data entriesto build up a concise model (Agrawal et al., 1998). Accordingto these models, common characteristics and rules can besummarized and used to predict other unclassified or newdata. Moreover, processes of decision trees include data train-ing and testing processes. Each data entry in the training data
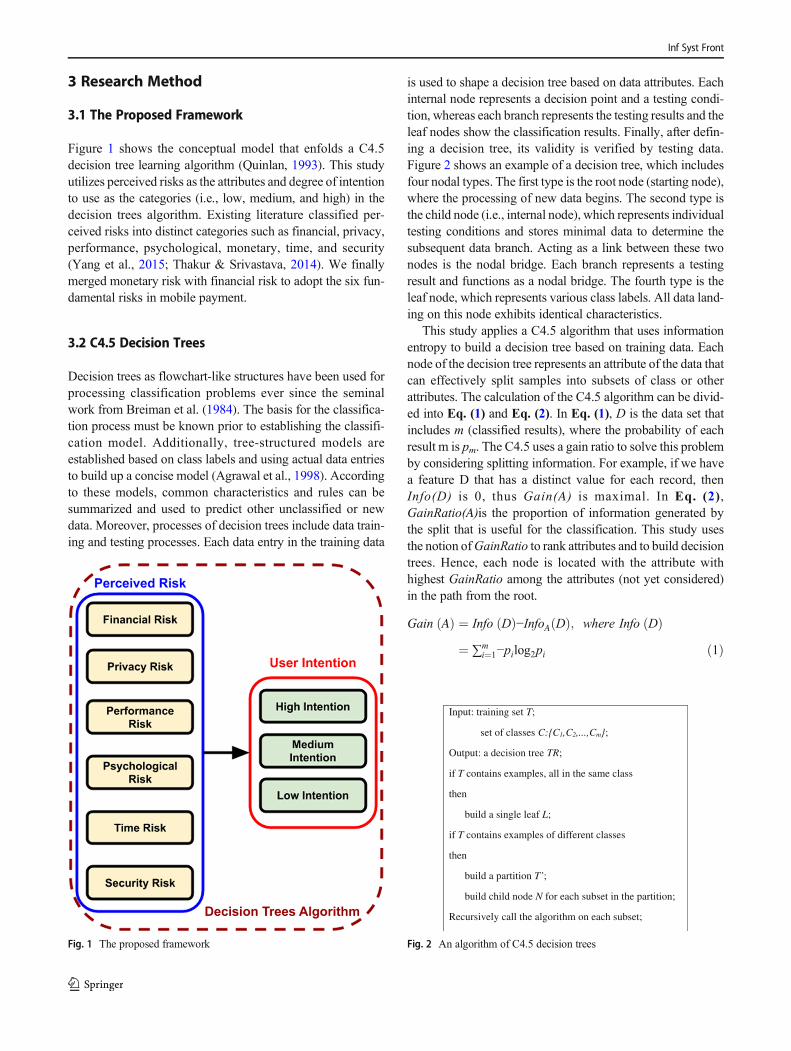
is used to shape a decision tree based on data attributes. Eachinternal node represents a decision point and a testing condi-tion, whereas each branch represents the testing results and theleaf nodes show the classification results. Finally, after defin-ing a decision tree, its validity is verified by testing data.Figure 2 shows an example of a decision tree, which includesfour nodal types. The first type is the root node (starting node),where the processing of new data begins. The second type isthe child node (i.e., internal node), which represents individualtesting conditions and stores minimal data to determine thesubsequent data branch. Acting as a link between these twonodes is the nodal bridge. Each branch represents a testingresult and functions as a nodal bridge. The fourth type is theleaf node, which represents various class labels. All data land-ing on this node exhibits identical characteristics.
This study applies a C4.5 algorithm that uses informationentropy to build a decision tree based on training data. Eachnode of the decision tree represents an attribute of the data thatcan effectively split samples into subsets of class or otherattributes. The calculation of the C4.5 algorithm can be divid-ed into Eq. (1) and Eq. (2). In Eq. (1), D is the data set thatincludes m (classified results), where the probability of eachresult m is pm. The C4.5 uses a gain ratio to solve this problemby considering splitting information. For example, if we havea feature D that has a distinct value for each record, thenInfo(D) is 0, thus Gain(A) is maximal. In Eq. (2),GainRatio(A)is the proportion of information generated bythe split that is useful for the classification. This study usesthe notion ofGainRatio to rank attributes and to build decisiontrees. Hence, each node is located with the attribute withhighest GainRatio among the attributes (not yet considered)in the path from the root.
Gain Að Þ ¼ Info Dð Þ−InfoA Dð Þ; where Info Dð Þ¼ ∑m
i¼1−pilog2pi ð1Þ
Fig. 1 The proposed framework
Input: training set T;
set of classes C:{C1,C2,...,Cm};
Output: a decision tree TR;
if T contains examples, all in the same class
then
build a single leaf L;
if T contains examples of different classes
then
build a partition T’;
build child node N for each subset in the partition;
Recursively call the algorithm on each subset;
Fig. 2 An algorithm of C4.5 decision trees
Inf Syst Front

SplitInfoA Dð Þ ¼ −∑vj¼1
Dj��
��
Dj j
� log2Dj��
��
Dj j and GainRatio Að Þ
¼ Gain Að ÞSplitInfoA Dð Þ ð2Þ
3.3 Naïve Bayes Classifier
Naïve Bayes Classifier is a simple method through statisticstheory. Furthermore, it has been widely used in classificationproblems because it is a fundamental technique in machinelearning. According to Han et al. (2012), definition of NaïveBayes is a probabilistic classifier based on Bayes’ theorem(Eq. (3)).
P H jXð Þ ¼ P X jHð Þ � P Hð ÞP Xð Þ ð3Þ
Bayesian classifiers have also exhibited high accuracy andspeed when applied to large database. Suppose that there arem classes, C1, C2, ..., Cm. Given a tuple, X, the classifier willpredict that X belongs to the class having the highest posteriorprobability, conditioned on X. That is, the Naïve Bayesianclassifier predicts that X belongs to the class Ci if and only if
P CijXð Þ > P C jjX� �
for 1≤ j≤m; j≠i
Thus, we maximize P(Ci| X). The class Ci for which P(Ci|X) is maximized is called the maximum posteriori hypothesis.By Bayes’ theorem (Eq. 3.1),
P CijXð Þ ¼ P X jCið Þ � P Cið ÞP Xð Þ ð4Þ
In other words, we predict that class label is the class Ci
when we calculate P(X|Ci) × P(Ci) is the maximum.(Eq. (4))By calculating the maximum of P(X|Ci) × P(Ci),we obtain thehighest probability of X belongs to class Ci,and we classify Xin Ci.
3.4 Support Vector Machine
Support Vector Machine is a method for the classification ofboth linear and nonlinear data. It uses a nonlinear mapping totransform the original training data into a higher dimension.Within this new dimension, it searches for the linear optimalseparating hyperplane. According to Han et al. (2012), al-though the training time of even the fastest SVMs can beextremely slow, they are highly accurate, owing to their ability
to model complex nonlinear decision boundaries. They aremuch less prone to overfitting than other methods.
The SVM searches for the hyperplane with the largest mar-gin; that is, the maximum marginal hyperplane(MMH). Theassociated margin gives the largest separation between clas-ses. First, we take a simpler case for example. Let the datasetD be given as (x1, y1), (x2, y2), ..., (x∣D∣, (y∣D∣), where xi is theset of training tuples with associated class labels, yi. Each yican take one of two values, either +1 or − 1 (i.e., yi∈{+1,−1}),corresponding to the classes buys_computer = yes andbuys_computer = no, respectively. Therefore, two possibleseparating hyperplanes and their associated margins. Wesearch for the largest margin hyperplane to approach the prob-lem. A separating hyperplane can be written as W ∙ X + b = 0,where W is a weight vector, namely, W = {w1, w2,..., wn}; n isthe number of attributes; and b is a scalar, often referred to as abias. If X = (x1, x2), where x1and x2 are the values ofattributes A1and A2.And we regard b as an additionalweight, w0, We obtain w0 +w1 ∙ x1 +w2 ∙ x2 = 0. The weightscan be adjusted so that the hyperplanes defining the “sides” ofthe margin can be written as:
H1 : w0 þ w1 � x1 þ w2 � x2≥1;∀yi ¼ þ1 ð5ÞH2 : w0 þ w1 � x1 þ w2 � x2≤−1;∀yi ¼ −1 ð6Þ
Combining the two inequalities, we get yi(w0 +w1 ∙ x1 +w2
∙ x2) ≥ 1 ∀ i. It becomes what is known as a constrained(convex) quadratic optimization problem. Then, after the pro-cess, we know the maximal margin is 2
‖W‖, where ||W|| is the
Euclidean norm of W, that is,ffiffiffiffiffiffiffiffiffiffiffiffiffiffiffiffi
W �Wð Þp
.
3.5 Logistic Regression
Logistic regression is a generalized linear regression analysismodel. The basic concept of logistic regression is to separatedifferent class in the hyperplane. First, the concept of sigmoidfunction which is also called logistic function and shown inEq. (7).
f zð Þ ¼ 11þe−z, where z is an independent variable and e is
the natural logarithm base (7).According to the definition from Kleinbaum et al. (2010),
we write z as a linear sum:
z ¼ αþ β1X 1 þ β2X 2 þ…þ βkX k ð8Þwhere the Xi are independent variables and α and the βi areconstant terms representing unknown parameters (∀i = 1, 2,…, k). Based on Eq. (8), we obtain the logistic model inEq. (9).
f zð Þ ¼ 1
1þ e −αþ∑βiX ið Þ ð9Þ
Inf Syst Front

Thus, we use maximum likelihood (ML) method to obtainthese estimates α, β1, β2, …, βk, and then can solve classifi-cation problems. MurtiRawat et al. (2020) detected breastcancer using Logistic Regression, K-Nearest Neighbors andEnsemble Learning. Through finding the estimator of βi, wecan get a formula to categorize the X in the specific class.
4 Results
4.1 Data Collection
The questionnaire design consisted of three parts: demograph-ic data, perceived risks, and intention to use mobile payment(Yang et al., 2015; Thakur & Srivastava, 2014). It included 22questions regarding perceived risks (Table 1): four questionsof financial risk, four of privacy risk, four of performance risk,three of psychological risk, four of time risk, and three ofsecurity risk. Also, one question for intention to use. We useda five-point Likert scale for all items, as follows: (1) stronglydisagree, (2) disagree, (3) neutral, (4) agree, and (5) stronglyagree. The question regarding “intention to use mobile pay-ment” will be converted from ordinal to nominal as type ofclass for classification. Strongly disagree and disagree will becategorized as “low”, neutral will be categorized as “medi-um”, and strongly agree and agree will be categorized as“high”. The online questionnaire was administered throughGoogle form and two certified translators were used to trans-late fromEnglish to Japanese. Pilot tests (20 participants) wereconducted leading to some adjustments in questionnaireitems. This research used judgmental sampling method to col-lect Japanese participants via friends, colleagues as well asfamilies between February and June in 2019 and finally 241valid participants were collected.
The collected data shows 44% is male and 56% is female,while 25.7% is married and 74.3% is unmarried. The majorityof participants were in the age group of 21 to 30, which char-acterized 44.4% in Japan. The age group of 20 or below is10.4%, 31–40 is 21.6%, and 41 or above is 23.7%. In educa-tion, 66.0% of Japanese participants had an educational levelof bachelor’s degree and above and 20.3% had degree of highschool or below. Regarding occupation, students comprised asignificant percentage among Japanese respondents (31.5%),15.8% in service industry, 9.5% in education industry, 7.5%in sales industry, and 6.2% in IT industry. 55.5% of respon-dents had mobile payment using experience and Apple pay(30.7%) and LINE pay (22%) are the popular used methods.The popular intensives to use mobile payment include conve-nience (58.5%) and cash back (22.8%). Although cashlessincluding credit cards was popular in Japan, there was resis-tance to mobile payments such as PayPay. This tendency hasemerged from a survey conducted by Payments Japan, anorganization established by the Ministry of Economy, Trade
and Industry (, 2020). The survey showed the willingness touse cashless method increases by age: 52.8% male and 50.4%female of 20s, 58.2% male and 56.2% female of 30s, 56.4%male and female of 40s, 54.5% male and 57% female of 50s,and 62.2% male and 68.4% female of 60s. That is, Japaneseusers showed younger generation may resistant more thanolder generations toward caseless.
This research conducted one-way-ANOVA analysis foreach perceived risk. In Table 1, security risk (F = 3.806, p =0.000) and privacy risk (F = 3.566, p = 0.000) indicates signif-icant difference among all risks. This may reflect the conser-vative culture of Japan to slow mobile payment usage down.Time risk (F = 2.688, p = 0.001) and financial risk (F = 2.124,p = 0.008) also show significant difference because Japaneseparticipants’ fear of wasting their time trying to use mobilepayment and fixing their problems compared to pre-paid cards(e.g., Suica and PASMO). Performance risk (F = 1.33, p =0.191) and psychological risk (F = 1.788, p = 0.051) presentinsignificant difference among all risks. We infer that infor-mation and communication technology industry has becomemature in Japan and people trust the used technologies includ-ing mobile payment method.
4.2 Metrics
We conducted 10-fold cross-validation for decision treeslearning algorithm. Decision trees are built using trainingand testing data with the outcomes generating the confusionmatrix. This confusion matrix is used to measure the perfor-mance of the built model regarding predicted case and trueclass. Different evaluation measures are used such asaccuracy, precision, recall, and F1-score. Accuracy is theratio of number of correct predictions to the total number ofinput samples (Eq.(10)). Precision is the number of true pos-itives divided by the total number of respondents labelled asbelonging in the positive class (Eq.(11)). Recall is the numberof true positives divided by the total number of respondentswho actually belong in the positive class (Eq.(12)). Finally,F1-score is a harmonic measure calculated by weighted preci-sion and recall (Eq.(13)). In particular, TP (true positive) in-dicates the number of respondents correctly labelled as be-longing in the positive class. FN (false negative) wronglydenotes that a predicted class does not exist, when it does,while FP (false positive) wrongly indicates that a predictedclass exists, when it does not.
Accuracy ¼ TP þ TNTP þ TN þ FP þ FN
ð10Þ
Precision ¼ TPTP þ FP
ð11Þ
Recall ¼ TPTP þ FN
ð12Þ
Inf Syst Front

F1−Score ¼ 2*Precision*RecallPrecisionþ Recall
ð13Þ
4.2.1 Analysis of Decision Trees
The generated binary tree contains 91 nodes and 46 leaves(Fig. 3). The setting for tree pruning includes at least twoinstances in leaves, at least five instances in internal nodes,and maximum depth is 100. The tree stops splitting whenmajority reaches 95%. This research selected the coverage rateof data that is higher than 60% for the generated rules of threeclasses. The results of low intention indicated the rule: Q23
(are you satisfied with existing mobile payment method) islower and equal than 2 and Q2 (malicious or unreasonablecharging could occur) is lower and equal than 3. Users fromcategory of low intention had low satisfaction of mobile pay-ment and less concerned about malicious charging of mobilepayment, which refers to financial risk. That is, less concernabout unexpected monetary loss of mobile payment is thefeature of category of low intention.
The results of medium intention can be classified into tworules. First, Q23 (are you satisfied with existing mobile pay-ment method) is higher than 2 and lower and equal than 3, andQ16 (time loss could be caused by instability and low speed)is lower and equal than 3. First type of users from category of
Table 1 Summary of differences in perceived risks
*Number of Respondents: TW: 242; CN: 243; JP: 241 Source Mean F/p
Financial Risk Yang et al. (2015) 2.51 F=2.124 /p=0.008
1. The use of mobile payment (m-payment) would cause the exposure of personal bank accountsand passwords.
2.56
2. Malicious or unreasonable charging could occur. 2.20
3. A careless operation could lead to a surprising loss. 2.73
4. The use of m-payment could cause financial risk. 2.55
Privacy Risk 2.84 F=3.566 /p=0.000
5. Private information could be misused, inappropriately shared, or sold. 2.676. Personal information could be intercepted or accessed. 2.80
7. Payment information could be collected, tracked, and analysed. 3.11
8. Privacy could be exposed when using m-payment. 2.77
Performance Risk 2.56 F=1.33 /p=0.191
9. The payment system might be unstable or blocked. 2.9910. The payment system does not work as expected. 2.31
11. The performance level might be lower than designed. 2.41
12. The service performance might not match its advertised level. 2.55
Psychological Risk 2.82 F=1.788 /p=0.051
13. Mobile payment would cause unnecessary tension (e.g., concerns about errors). 2.6114. A system malfunction in m-payment could cause unwanted anxiety and confusion. 3.13
15. The usage of m-payment could cause discomfort. 2.71
Time Risk 2.76 F=2.688 /p=0.001
16. Time loss could be caused by instability and low speed. 2.9817. It might take too much time to learn how to use mobile payment. 2.76
18. More time is required to fix payment errors offline. 3.07
19. Using m-payment may waste time. 2.20
Security Risk Thakur and Srivastava(2014)
2.92 F=3.806 /p=0.000
20. There might be mistakes, since the accuracy of the inputted information is difficult to checkfrom the screen.
2.70
21. The battery of the mobile phone might run out or the connection could be interrupted whilepaying.
3.34
22. The bill information might be typed wrongly. 2.74
Inf Syst Front

medium intention had medium-low satisfaction of mobilepayment and less concern about time risk. Second, Q23 (areyou satisfied with existing mobile payment method) is higherthan 3 and Q21 (the battery of the mobile phone might run outor the connection could be interrupted while paying) is lowerand equal to 1. Second type of users from category of mediumintention had higher satisfaction and less concern about thedisconnection of mobile phone when paying, which refers tosecurity risk. Hence, user from medium intention had twofeatures: (1) medium-low satisfaction and less concernedabout time risk and (2) medium-high satisfaction and lessconcern about security risk. The outcomes of high intentiongenerated the rule: Q23 (are you satisfied with existing mobilepayment method) is higher than 3, Q21 (the battery of themobile phone might run out or the connection could beinterrupted while paying) is higher than 1, and Q14 is lowerand equal to 3 (a system malfunction in m-payment couldcause unwanted anxiety and confusion). Users from the cate-gory of high intention had higher satisfaction, less concernabout security risk, and less concern about psychological risk.
4.3 Model Comparison
This research applied methods of decision tree, kNN, NaïveBayes, SVM, and Logistic Regression to validate the modelsin terms of accuracy, prediction, recall, F1-score (Fig. 4).Decision trees shows highest accuracy (0.668), precision(0.665), recall (0.668), and F1-score (0.666) among fivemodels. SVM has the second highest accuracy (0.66), preci-sion (0.663), recall (0.66), and F1-score (0.644) among kNN,Naïve Bayes, Logistic Regression, and SVM. The area underROCwas also estimated which reveals all models have similardiscrimination. The value of area under ROC (AUC) for
decision trees is 0.738, kNN is 0.749, Naïve Bayes is 0.758,SVM is 0.844, and logistic regression is 0.776 as shown inFig. 5, Fig. 6, and Fig. 7. Compared with all indicators, thisstudy showed decision trees shows the optimal outcomes ofclassification among all models.
4.4 Discussion
This research summarizes the results for each age group asshow in Table 2. The age between 21 and 40 showed moremobile payment using experience who belong to young andmajor shoppers of samples. Using experience showed top rea-son to use mobile payment for all age groups was convenienceand second reason was the incentive of cash back from banks.The results of ANOVA analysis indicate security risk presentssignificant difference for the age group 20 or below (F = 9.02,p = 0.000) and 41 or above (F = 2.021, p = 0.045). This meansyoung and old age groups may concern about data securityproblem on mobile payment. Time risk is significant for theage group between 31 and 40 (F = 2.667, p = 0.012) and 41 orabove (F = 2.22, p = 0.023). We infer that losing or wastingtime via mobile payment may cause anxiety when Japanesepeople have time pressure on job and family. Privacy risk issignificant for the age group 21–30 (F = 1.998, p = 0.021) and41 or above (F = 2.459, p = 0.011). This may because majorshoppers used mobile payment more often and privacy is thecrucial concern for using mobile payment.
Despite the mobile transaction is popular, cash is still themost preferred payment in Japan, accounting for 80% of alltransactions during 2018 (Fawthrop, 2019). It is believed thatthe habit to pay in Japan is still cash dominant even credit cardis popular and mobile payment is raising. Changing the habitis more difficult than understanding it. The theory of risk and
Fig. 3 A generated decision tree
Inf Syst Front

attractiveness (Weber et al., 1992) can help us understand theimportance of risk, which indicated that risk judgements aremore sensitive to losses and zero outcomes, while attractive-ness judgements are more sensitive to gains. The theory ex-plains people are conservative when facing the risk of lossesrather than attractiveness of gains. According to Hakuhodo’sconsumer research in 2017, 51% of Japanese people againstcashless society. 20% of Japanese people are concerned withspending too much via credit card that researchers also con-firmed may increase willingness-to-pay (Prelec & Simester,2001). Most importantly, Japanese people are worried aboutsecurity and data breach of cashless payment methods.
Our findings showed effects of perceived risks on intentionto use mobile payment of Japanese users (Table 3). We alsoassume degree of intention to use mobile payment is consis-tent with satisfaction of usage. Financial risk shows effects onlow intention to use mobile payment. The average score offinancial risk were the lowest to all age groups. We infer thatinfrastructure of information and communication technologyis mature in Japan that may cause low chance of unreasonablecharging. Privacy and performance risks also influence lowintention to use mobile payment. The average score of tworisks were important to two age groups between 21 and 40.That is, safe, secured, reliable, and fast mobile payment
0.668 0.666 0.665 0.668
0.5850.579
0.615
0.585
0.606 0.6070.619
0.606
0.66
0.644
0.663 0.66
0.6350.626 0.626
0.635
Accuracy F1 Precision Recall
Decision Trees kNN Naive Bayes SVM Lgis�c Regression
Fig. 4 Model comparison ofclassification outcomes
Fig. 5 ROC of target class of high
Inf Syst Front

environment are more important the category of low intention.In addition to privacy and performance risks, psychologicaland security risks show effect on high intention to use mobilepayment. The reliability of mobile device (e.g., battery and
function), financial loss, safe, secured, reliable, and fast mo-bile payment environment are key drivers to users. The aver-age scores of security risk were the highest for all age groupsand psychological risk shows second highest average scores
Fig. 6 ROC of target class ofmedium
Fig. 7 ROC of target class of low
Inf Syst Front

for the age group of 20 or below and 41 or above. Particularly,the reliable mobile payment platform may derive acceptableperformance risk for the category of high intention.
Moreover, medium intention to use mobile payment can becategorized into medium-low satisfaction and medium-highsatisfaction. Specifically, time risk shows effect on medium-low satisfaction because users expect quick mobile paymentprocess. The average scores of time risk were also fairy high toall age groups. Security risk shows effect on medium-highsatisfaction because users may trust the reliability of mobiledevice and expect the mobile payment process is trustworthy.Monetary loss, safe, reliable, and fast mobile payment envi-ronment are also important to the category of medium-highsatisfaction. Most importantly, our analysis indicated privacyand performance risks show effects on all categories. Japaneseusers concerned about safe and reliability of mobile paymentmethods as the top priority. By showing the effects of allperceived risks on intention to use mobile payment, firmscan emphasize on specific risk to handle and promote theusage for different age groups. Our results are also in accor-dance with existing reports, which specified 70% of popula-tion in Japan still preferred cash, worried about security issue,expected secured and easy process, and were afraid of trackingnon-cash cashless methods.
5 Implications
This research attempts to discover the perceived risk of mobilepayment from Japanese users. We classified users into low,medium, and high intention to use mobile payment methods.The findings also showed that monetary loss is not importantto low intention users, time and security risks are not influen-tial to medium intention users, and security and psychologicalrisks are not crucial to high intention users. That is, privacyand performance are the joint important perceived risk to allusers, which can match to the cultural background in Japan(e.g., Japanese people are more conservative toward mobilepayment). Companies should emphasize on data protectionand functions of mobile payment for further improvement.For low intention users, companies may improve secured,safe, and fast mobile payment process. For medium intentionusers, firms should avoid monetary loss and comfortable mo-bile payment environment. For high intention users, monetaryloss, and fast mobile payment process are critical. Improvingease of use and usefulness of mobile payment can relief thetension of perceived risk. In Japanese culture, companies needto step-by-step unlock the tension of perceived risk that mayenhance the use of mobile payment incrementally. When theusers accept the risk and are willing to use mobile paymentmethods, the profits will be increased for enterprisessimultaneously.Ta
ble2
Summaryof
outcom
esforeach
agegroup
Gender
Mob
ilePaymentUsing
Exp
erience
Reasonto
Use
Mob
ilePayment
Age
Male
Female
Yes
No
Convenience
Cashback
20or
below
40%
60%
40%
60%
44%
24%
21–30
40%
60%
58%
42%
39%
21%
31–40
56%
44%
65%
35%
42%
27%
41or
above
42%
58%
47%
53%
33%
16%
Perceived
Risk
Age
Financial
Privacy
Performance
Psychological
Tim
eSecurity
20or
below
2.43
(F=1,p=0.494)
2.78
(F=0.462,p=0.896)
2.51
(F=2.294,p=0.082)
2.81(F=1.954,p=0.121)
2.77
(F=2.135,p=0.094)
2.85
(F=9.02,p
=0.000)
21–30
2.47
(F=1.249,p=0.252)
2.74
(F=1.998,
p=0.021)
2.46
(F=0.737,p=0.701)
2.71
(F=0.911,p=0.539)
2.68
(F=1.26,p
=0.252)
2.81
(F=1.698,p=0.079)
31–40
2.43
(F=1.698,p=0.079)
2.90
(F=0.751p=0.718)
2.56
(F=1.882,p=0.068)
2.75
(F=1.571,p=0.145)
2.79
(F=2.667,p=0.012)
2.98
(F=1.773,p=0.102)
41or
above
2.68
(F=1.260,p=0.272)
3.00
(F=2.459,
p=0.011)
2.79
(F=1.339,p=0.229)
3.08
(F=0.833,p=0.608)
2.87
(F=2.22,p
=0.023)
3.12
(F=2.021,p=0.045)
Inf Syst Front

The wave of 5G leads the development of mobile applica-tions and services. In Japan, mobile payment methods havebeen promoted and applied widely because of Tokyo 2020Olympics. Japan is one of the countries that cash is still themajor payment method nowadays. The 2020 McKinseyGlobal Payment Report also indicated that estimated 54% oftransactions was cash in Japan (top 1 country) in the maturemarket, following by Singapore (39%). The evidence presentswhile the mobile payment usage is not low but people stillprefer cash usage in Japan. The spread of pandemic (Covid-19) may also impact all stakeholders of mobile payment (e.g.,government, companies, and users) and push digital transfor-mation on cashless society. Our findings expect to contributeto the countries with high percentage of cash used in transac-tions in the emerging market (e.g., Indonesia, Brazil, andArgentina) and cash-loyal countries (e.g., Germany andItaly) according to BCG survey in 2020.
6 Conclusion and Limitations
The wave of 5G increases the opportunities of mobile appli-cations including mobile payment. While the infrastructurehas become mature, companies change the focus to mobilepayment behavior. In Japan, cashless is not yet popular butgovernment and companies are devoted to the development ofmobile payment methods. In 2020, the mobile paymentmethods are considered to be widely applied and used becauseof Tokyo 2020Olympics. Hence, understanding the perceivedrisks on mobile payment from Japanese users are critical. Thisresearch collected 241 Japanese users and applied decisiontrees algorithm. Six types of perceived risks (financial, priva-cy, performance, psychological, security, and time) were usedand the categorized class is intention to use mobile payment(low, medium, and high). We also compared different com-petitive models to examine the performance, including deci-sion trees, kNN, SVM, logistic regression, and Naïve Bayes.The outcomes showed decision trees outperformed among allmodels in terms of accuracy, precision, recall, and F1-measure.
By analyzing the generated decision trees, the findings in-dicated that safe, secured, reliable, and fast mobile payment
environment are more important to low intention users, whichmeans less concerns about financial risk. Financial loss, safe,secured, reliable, and fast mobile payment environment aremore important to medium intention users, which means lessconcerns about time and security risk. Monetary loss, reliable,and fast mobile payment environment are more important tohigh intention users, whichmeans less concerns about securityrisk & psychological risk. Furthermore, two limitations areidentified in this study. First, more samples can be extendedto generalize the discovered outcomes. Japanese users areconservative but their perceptions are valuable for the devel-opment of mobile payment. Second, the different viewpointscan be used to supplement our study which merely focus onperceived risks. Although risk is more influential than attrac-tiveness, the perceived gains can help companies balance theinfluence of adoption ofmobile payment The spread of coronainfection has led to the increasing prevalence of mobile pay-ments in Japanese society. How people’s concerns about per-ceived risks are changing in the post-corona era should alsocontinue to be assessed.
References
Asia Pacific eCommerce and Payments Guide 2020 (2020). Available at:https://cdn2.hubspot.net/hubfs/5246303/Asia%20Pacific%20eCommerce%20and%20Payments%20Guide%202020.pdf
GSMA. (2019). The mobile economy Asia Pacific 2019 report. GSMAssociates. https://www.gsmaintelligence.com/research/?file=fe8735424e3058f98c3a83bc57bc2af5&download.
Hakuhodo’s Consumer Research (2017). Available at: https://www.hakuhodo.co.jp/uploads/2017/12/20171215.pdf
The Cashless Promotion Council Payments Japan (2020). https://www.paymentsjapan.or.jp/ (in Japanese).
The Cashless Promotion Council Payments Japan Consumer andBusiness Insight Survey (2020). Available at: https://www.paymentsjapan.or.jp/wordpress/wp-content/uploads/2021/05/insights_fy2020.pdf (in Japanese).
The 2020McKinsey Global Payment Report (2020). Available at: https://www.mckinsey.com/~/media/mckinsey/industries/financial%20services/our%20insights/accelerating%20winds%20of%20change%20in%20global%20payments/2020-mckinseyglobal-payments-report-vf.pdf
Table 3 Effects of perceived risks and categories of Japanese users
Financial Risk Privacy Risk Performance Risk Psychological Risk Time Risk Security Risk
Low intention (Low Satisfaction) + ++ ++
Medium intention (Medium-low Satisfaction) ++ ++ +
(Medium-high Satisfaction) ++ ++ +
High intention (High Satisfaction) ++ ++ + +
+ means less than half of variables influence on intention to use mobile payment
++ means more than half of variables influence on intention to use mobile payment
Inf Syst Front

Payments Japan Consumer Insight Survey 2020, Available at: https://www.paymentsjapan.or.jp/wordpress/wp-content/uploads/2021/05/insights_fy2020.pdf.
Agrawal, R., Ghosh, S., Imielinski, T., Iyer, B., & Swami, A. N. (1992,August). An interval classifier for database mining applications. InVLDB (Vol. 92, pp. 560–573).
Albashrawi, M., & Motiwalla, L. (2019). Privacy and personalization incontinued usage intention of mobile banking: An integrative per-spective. Information Systems Frontiers, 21(5), 1031–1043.
Arvidsson, N. (2014). Consumer attitudes on mobile payment services–results from a proof of concept test. International Journal of BankMarketing, 32(2), 150–170.
Baganzi, R., & Lau, A. K. (2017). Examining trust and risk in mobilemoney acceptance in Uganda. Sustainability, 9(12), 22–33.
Breiman, L., Friedman, J., Stone, C. J., & Olshen, R. A. (1984).Classification and regression trees. CRC Press.
Cao, X., Yu, L., Liu, Z., Gong, M., & Adeel, L. (2018). Understandingmobile payment users’ continuance intention: A trust transfer per-spective. Internet Research, 28(2), 456–476.
Chen, X., & Li, S. (2017). Understanding continuance intention ofmobilepayment services: An empirical study. Journal of ComputerInformation Systems, 57(4), 287–298.
Choi, Y., & Choi, H. (2017). Risk factors affecting trust and satisfactionin mobile payment systems, International Information Institute(Tokyo). Information, 20(8A), 5527–5532.
Cocosila, M., & Trabelsi, H. (2016). An integrated value-risk investiga-tion of contactless Mobile payments adoption. ElectronicCommerce Research and Applications, 20, 159–170.
Dahlberg, T., Mallat, N., Ondrus, J., & Zmijewska, A. (2008). Past,present and future of mobile payments research: A literature review.Electronic Commerce Research and Applications, 7(2), 165–181.
De, L., Liébana-Cabanillas, I. R. F., Sánchez-Fernández, J., & Muñoz-Leiva, F. (2018).Mobile payment is not all the same: The adoptionof mobile payment systems depending on the technology applied.Change (In press).
Dey, P. K. (2002). Project risk management: A combined analytic hier-archy process and decision tree approach. Cost Engineering, 44(3),13–27.
Dighe, S. (2018)Global mobile payments industry is expected to grow ata CAGR of 33.8% fom 2017 to 2023. AMR, Business Indiser.Available at: https://markets.businessinsider.com/news/stocks/global-mobile-payments-industry-is-expected-to-grow-at-a-cagr-of-33-8-from-2017-to-2023-amr-1027500286.
Dinh, V. S., Nguyen, H. V., & Nguyen, T. N. (2018). Cash or cashless?Promoting consumers’ adoption of mobile payments in an emergingeconomy. Strategic Direction, 34(1), 1–4.
Fahey, R. (2019) Cashless payments struggle in cash-loving Japan, 2019,https://www.tokyoreview.net/2019/01/cashless-payments-japan/
Fawthrop, A. (2019) Adoption of Mobile Payments and Digital WalletsGrowing in Japan. Available at: https://www.nsbanking.com/news/mobile-payments-japan/
Featherman, M. S., & Pavlou, P. A. (2003). Predicting e-services adop-tion: A perceived risk facets perspective. International Journal ofHuman-Computer Studies, 59(4), 451–474.
Flavián, C., Guinalíu, M., & Gurrea, R. (2006). The role played by per-ceived usability, satisfaction and consumer trust on website loyalty.Information & Management, 43(1), 1–14.
Forsythe, S. M., & Shi, B. (2003). Consumer patronage and risk percep-tions in internet shopping. Journal of Business Research, 56(11),867–875.
Gillett, P. L. (1976). In-home shoppers: An overview. The Journal ofMarketing, 40(4), 81–88.
Han, J., Pei, J., & Kamber, M. (2012). Data mining: Concepts andtechniques. Elsevier.
Hayashi, F., & Bradford, T. (2014). Mobile payments: merchants’ per-spectives. Economic Review, 99(1), 5–30.
Kabari, L. G., & Nwachukwu, E. O. (2013). Credit risk evaluating systemusing decision tree–neuro based model. International Journal ofEngineering Research &Technology, 2(6), 2738–2745.
Khalilzadeh, J., Ozturk, A. B., & Bilgihan, A. (2017). Security-relatedfactors in extended UTAUT model for NFC based mobile paymentin the restaurant industry. Computers in Human Behavior, 70(4),460–474.
Kim, J., & Lennon, S. J. (2013). Effects of reputation and website qualityon online consumers' emotion, perceived risk and purchase inten-tion: Based on the stimulus-organism-response model. Journal ofResearch in Interactive Marketing, 7(1), 33–56.
Kleinbaum, D. G., & Klein, M. (2010). Introduction to logistic regres-sion. In Logistic regression (pp. 1–39). Springer.
Kolsaker, A., & Payne, C. (2002). Engendering trust in e-commerce: Astudy of gender-based concerns. Marketing Intelligence &Planning, 20(4), 206–214.
Liébana-Cabanillas, F., & Lara-Rubio, J. (2017). Predictive and explan-atory modeling regarding adoption of mobile payment systems.Technological Forecasting and Social Change, 120, 32–40.
Liébana-Cabanillas, F., Molinillo, S., & Ruiz-Montañez, M. (2019). Touse or not to use, that is the question: Analysis of the determiningfactors for using NFC mobile payment systems in public transpor-tation. Technological Forecasting and Social Change, 139, 266–276.
Lim, N. (2003). Consumers’ perceived risk: Sources versus conse-quences. Electronic Commerce Research and Applications, 2(3),216–228.
Luarn, P., & Lin, H. H. (2005). Toward an understanding of the behav-ioral intention to use mobile banking. Computers in HumanBehavior, 21(6), 873–891.
Liu, J., Kauffman, R. J., & Ma, D. (2015). Competition, cooperation, andregulation: Understanding the evolution of the mobile paymentstechnology ecosystem. Electronic Commerce Research andApplications, 14(5), 372–391.
Mann, B. J. S., & Sahni, S. K. (2013). Role of trust and customer loyaltyin reducing perceived security risk in internet banking. InternationalJournal of Electronic Business, 10(4), 331–354.
MarketsandMarkets (2019). Digital payments market by component, de-ployment type, organization size, vertical, and region - global fore-cast to 2025. Available at: https://www.marketsandmarkets.com/Market-Reports/digital-payment-market-209834053.html.
METI, Ministry of Economy, Trade and Industry report “current statusand significance of cashless” (2020), https://www.meti.go.jp/policy/mono_info_service/cashless/image_pdf_movie/about_cashless.pdf(in Japanese).
Mordor Intelligence (2018). Cyber (liability) insurance market - Asia-Pacific trends, industry competitiveness, disruptions & innovations,forecasts to 2022. Available at: https://www.mordorintelligence.com/industry-reports/asia-pacific-cyberliability-insurance-market.
MurtiRawat, R., Panchal, S., Singh, V. K., & Panchal, Y. (2020). BreastCancer detection using K-nearest neighbors, logistic regression andensemble learning. In 2020 international conference on electronicsand sustainable communication systems (ICESC) (pp. 534-540).IEEE.
Nel, J., Heyns, N., (2017) The in-store factors influencing the use inten-tion of proximity mobile-payment applications, ManagementDynamics: Journal of the Southern African Institute forManagement Scientists, 26(2), 2–20.
Oliveira, T., Thomas, M., Baptista, G., & Campos, F. (2016). Mobilepayment: Understanding the determinants of customer adoptionand intention to recommend the technology. Computers in HumanBehavior, 61, 404–414.
Park, J., Amendah, E., Lee, Y., & Hyun, H. (2019). M-payment service:Interplay of perceived risk, benefit, and trust in service adoption.Human Factors and Ergonomics in Manufacturing & ServiceIndustries, 29(1), 31–43.
Inf Syst Front

Prelec, D., & Simester, D. (2001). Always leave home without it: Afurther investigation of the credit-card effect on willingness to pay.Marketing Letters, 12(1), 5–12.
Qasim, H., & Abu-Shanab, E. (2016). Drivers of mobile payment accep-tance: The impact of network externalities. Information SystemsFrontiers, 18(5), 1021–1034.
Quinlan, J.R. (1993) C4.5: Programs for machine learning, MorganKaufmann publishers, New York, 1993.
Ramezankhani, A., Kabir, A., Pournik, O., Azizi, F., & Hadaegh, F.(2016). Classification-based data mining for identification of riskpatterns associated with hypertension in middle eastern population:A 12-year longitudinal study.Medicine, 95(35), 325–335.
Saridakis, G., Benson, V., Ezingeard, J. N., & Tennakoon, H. (2016).Individual information security, user behaviour and cybervictimisation: An empirical study of social networking users.Technology Forecasting and Social Change., 102, 320–330.
Shao, Z., Zhang, L., Li, X., & Guo, Y. (2019). Antecedents of trust andcontinuance intention in mobile payment platforms: The moderatingeffect of gender. Electronic Commerce Research and Applications,33(1), 27–56.
Thakur, R., & Srivastava, M. (2014). Adoption readiness, personal inno-vativeness, perceived risk and usage intention across customergroups for mobile payment services in India. Internet Research,24(3), 369–392.
Trachuk, A., & Linder, N. (2017). The adoption of mobile paymentservices by consumers: an empirical analysis results. Business andEconomic Horizons (BEH), 13(3), 383–408.
Weber, E. U., Anderson, C. J., & Birnbaum, M. H. (1992). A theory ofperceived risk and attractiveness. Organizational Behavior andHuman Decision Processes, 52(3), 492–523.
Xin, H., Techatassanasoontorn, A. A., & Tan, F. B. (2015). Antecedentsof consumer trust in mobile payment adoption. Journal of ComputerInformation Systems, 55(4), 1–10.
Yang, Y., Liu, Y., Li, H., &Yu, B. (2015). Understanding perceived risksin mobile payment acceptance. Industrial Management & DataSystems, 115(2), 253–269.
Zhou, T. (2013). An empirical examination of continuance intention ofmobile payment services. Decision Support Systems, 54, 1085–1091.
Zhou, T. (2014). Understanding the determinants of mobile paymentcontinuance usage. Industrial Management & Data Systems,114(6), 936–948.
Zhu, D. H., Lan, L. Y., & Chang, Y. P. (2017). Understanding the inten-tion to continue use of a mobile payment provider: An examinationof alipay wallet in China. International Journal of Business &Information, 12(4), 369–390.
Publisher’s Note Springer Nature remains neutral with regard to jurisdic-tional claims in published maps and institutional affiliations.
Wei-Lun Chang is the Associate Professor of Department of BusinessManagement in National Taipei University of Technology. He completedhis Ph. D. degree at Department of Management Information Systems atNational Chengchi University. His research areas include social media,sentiment, and technology in education. His work has appeared inCommunications of the ACM, Information Systems Frontiers, InternetResearch, Electronic Commerce Research and Applications, Knowledge-Based Systems, European Journal and Operational Research,Transportation Research Part E: Logistics and Transportation Review,and Journal of Information Science.
Li-Ming Chen is an Associate Professor in the Department of BusinessAdministration at National Chengchi University, Taiwan. He received hisMS in Industrial and Operations Engineering at the University ofMichigan, USA, and his PhD in Industrial and Systems Engineering fromUniversity of Florida, USA. His research interests include supply chainmanagement and the interface between operations and information. Hiswork has appeared in academic journals such as European Journal andOperational Research, Naval Research Logistics, TransportationResearch Part E: Logistics and Transportation Review, and Journal ofthe Operational Research society.
Takako Hashimoto graduated from the Ochanomizu University inJapan, and received a Ph.D. in computer science, specialization in multi-media information processing, from the Graduate School of Systems andInformation Engineering of University of Tsukuba in 2005. She workedat the software R&D center of Ricoh Co. Ltd., in Japan for 24 years, andparticipated in the development of many software products as a technicalleader. From April of 2009, she was involved in Chiba University ofCommerce as Associate Professor. In 2015, she became Professor ofChiba University of Commerce. In 2015, she stayed at University ofCalifornia, Los Angeles as a visiting researcher. In 2016, she has becomethe Vice President of Chiba University of Commerce in 2018. She isserved as a Board Member of the Database Society of Japan and Chairof IEEE Japan Council. Fellow of the Information Processing Society ofJapan. She has focused on the data mining research and the social mediaanalysis, especially topic extraction from millions of tweets related todisasters and topical problems. In 2019, she received the IEEE 2019MGA Larry K. Wilson Transnational Award, and Fellow of theInformation Processing Society of Japan.
Inf Syst Front