cashflow analysisttsmedia.ttstrain.com/cucashflow031815.pdf · class rules •ask questions ... •...
TRANSCRIPT

1
CASHFLOW ANALYSIS
Developed By Vin DiCara
DiCara Training and Consulting Inc.
PO Box 963
Brunswick, Maine 04011
207 607‐4129
CLASS RULES
• Ask Questions
• Participate
• Relax and enjoy yourself
• Share your experiences
2
PROGRAM OBJECTIVES
• Review the fundamentals of Cashflow
• Use Cashflow statements to understand the needs of borrowers
• Understand the value of projections to predict future cashflow challenges
• Structure complex financial deals
CASHFLOW/SIMPLE VIEW
• The P & L contains the major elements of cashflow and repaymentability. The most common view of repaymentability:
Profit After Tax
+ Depreciation
+ Interest and other hidden cashflow (rent savings, officer’s salaries savings and non‐recurring charges)
‐ Distributions
= Cashflow (CF)Available For Debt Service

3
DOES THE BUSINESS HAVE ADDITIONAL CASHFLOW?
• Rent
• Officer’s Salary
• Non‐recurring expenses
DEBT COVERAGE RATIO
• The Debt Coverage Ratio (DCR) is determined by using the following formula:
Available Cashflow = DCR
Annual Debt Service
Most credit unions look for a DCR of 1.25/1 or better. It is important how you calculate cashflow and if you include all debt as debt service or just senior debt.

4
PERMANENT WORKING CAPITAL EXAMPLE
PWC Required:
A/R (Projected A/R – Current A/R)
+ Inv. (Projected Inv.‐ Current Inv.)
‐ A/P (Projected A/P – Current A/P)
‐ Acc. (Projected Acc. –Current Acc.)
= New Investment in PWC
PWC can be calculated on either an historical or projected basis
PERMANENT WORKING CAPITAL
• Increases in PWC can be calculated on an historical basis or on a projected basis. Projected increases in PWC provide an indication of what kind of financing a business will require in the future for its operating needs as defined by its operating cycle. Historical increases in PWC show where some of a business’ cashflow has been used in previous periods of time

5
REPAYMENTABILITY ADJUSTMENTS
• Businesses use cashflow for purposes other than just debt service
• Cashflow is also required to fund the operations of a business (Permanent Working Capital increases) and to pay for investments in fixed assets, when 100% financing is not available
• To account for these other uses of a business’ cashflow, a number of adjustments need to be made
CASHFLOW/ADJUSTED FORMULA
Profit After Tax
+ Depreciation
+ Other cashflow (non‐recurring charges)
‐ Distributions
‐ Increase in Permanent Working Capital
‐ Cash outlays for fixed assets
= Cashflow Available For Debt Service

6
GLOBAL CASHFLOW
• Also referred to as consolidated cashflow
• Takes into account both the business’ cashflow and the personal cashflow of owner/guarantors
• Important for closely held businesses
• Some business expenses flow through to the personal income tax return for those individuals who own S‐Corporations, Partnerships, and LLC’s
GLOBAL CASHFLOW
• Methodology uses information from the following:
1. The business’ tax returns
2. The tax returns of the owner/guarantors
3. The Personal Financial Statement of the guarantor(s)
4. The personal credit report

7
GLOBAL CASHFLOW
• By taking personal cashflow into account, an analyst might find additional means to service business debt
• On the contrary, an excessive lifestyle may reduce the ability to service debt if the owner/guarantor is too highly leveraged personally
THE CASHFLOW STATEMENT
8
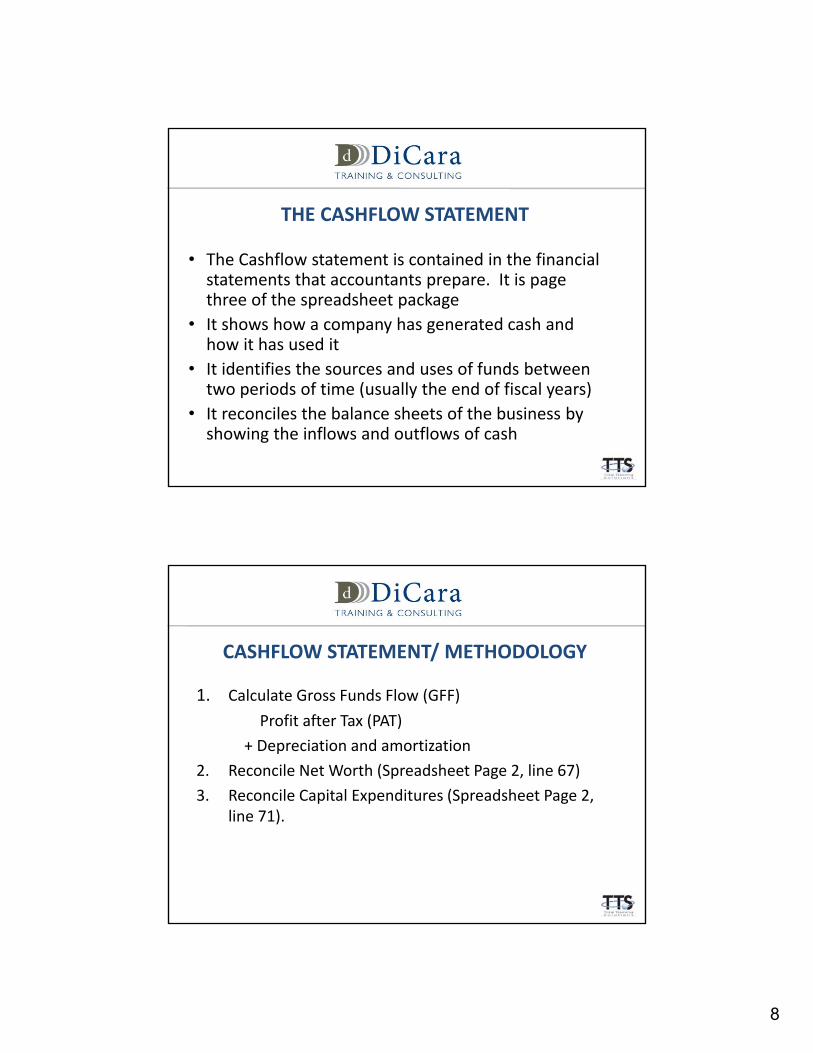
THE CASHFLOW STATEMENT
• The Cashflow statement is contained in the financial statements that accountants prepare. It is page three of the spreadsheet package
• It shows how a company has generated cash and how it has used it
• It identifies the sources and uses of funds between two periods of time (usually the end of fiscal years)
• It reconciles the balance sheets of the business by showing the inflows and outflows of cash
CASHFLOW STATEMENT/ METHODOLOGY
1. Calculate Gross Funds Flow (GFF)
Profit after Tax (PAT)
+ Depreciation and amortization
2. Reconcile Net Worth (Spreadsheet Page 2, line 67)
3. Reconcile Capital Expenditures (Spreadsheet Page 2, line 71).
9
CASHFLOW STATEMENT/ METHODOLOGY
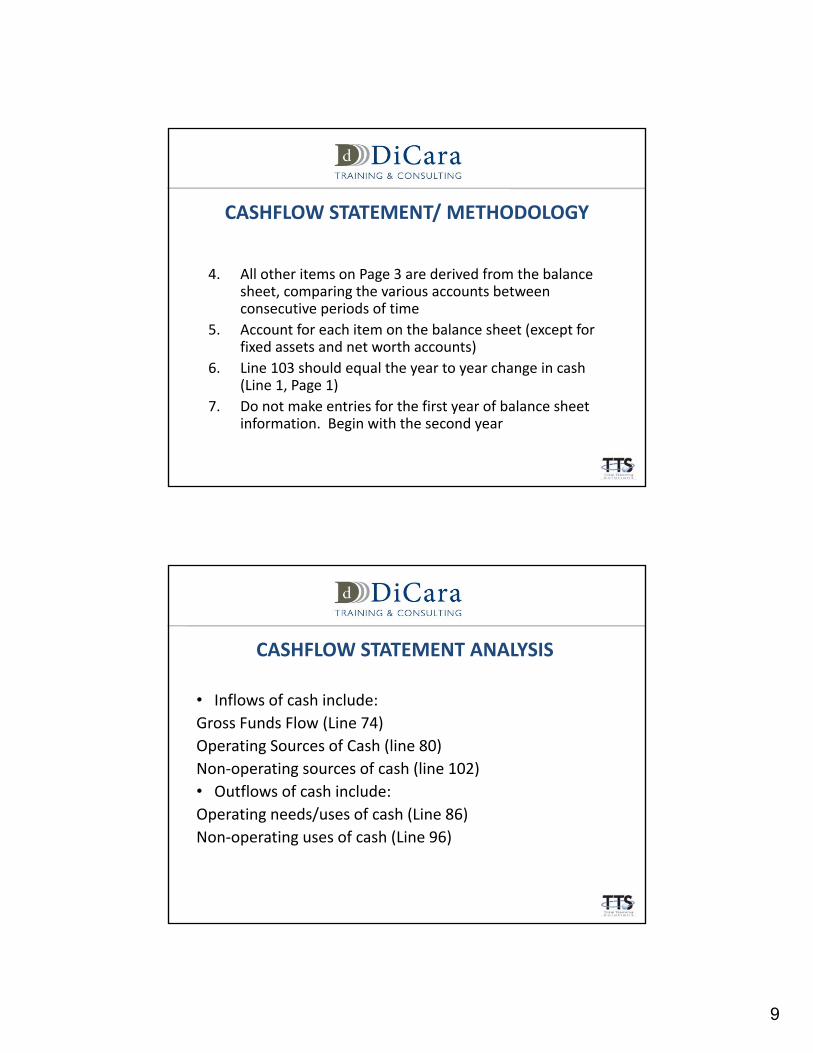
4. All other items on Page 3 are derived from the balance sheet, comparing the various accounts between consecutive periods of time
5. Account for each item on the balance sheet (except for fixed assets and net worth accounts)
6. Line 103 should equal the year to year change in cash (Line 1, Page 1)
7. Do not make entries for the first year of balance sheet information. Begin with the second year
CASHFLOW STATEMENT ANALYSIS
• Inflows of cash include:
Gross Funds Flow (Line 74)
Operating Sources of Cash (line 80)
Non‐operating sources of cash (line 102)
• Outflows of cash include:
Operating needs/uses of cash (Line 86)
Non‐operating uses of cash (Line 96)

10
CASHFLOW STATEMENT KEYPOINTS1. Net Operating Cashflow (Line 87) represents the cash
that a business has after it has generated a profit (or loss) and met its operational needs
2. Growth increases the operational needs for cash for a business in most circumstances, unless that business can make operational changes, such as decreasing its receivables and/or inventory, or increasing its payables
3. Increases in operating uses of funds should be met by increases in operating sources of funds (except when increases in Permanent Working Capital occur)
CASHFLOW STATEMENTKEYPOINTS
4. Increases in non‐operating cash uses should be met by increases in non‐operating sources of funds
5. Net operating Cashflow should be sufficient to pay the current portion of long‐term debt (principal) that is due (line 91)
6. Officer debt (or equity accounts) should not be repaid when net operating Cashflow is negative

11
FINANCIAL PROJECTIONS
FINANCIAL PROJECTIONS
Financial projections are important for a number of reasons
1. They often form the basis for determining a business’ ability to repay loans
2. They demonstrate the financial knowledge and understanding of a loan applicant
3. Projections also can increase credibility
12
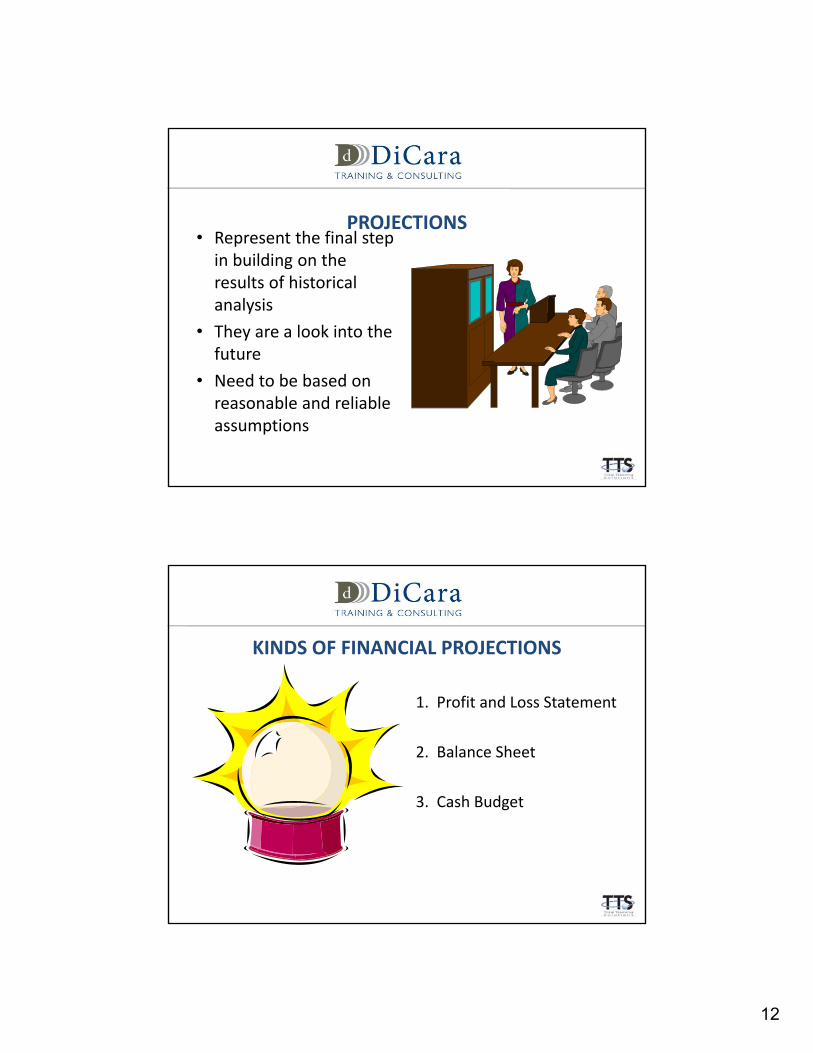
PROJECTIONS• Represent the final step in building on the results of historical analysis
• They are a look into the future
• Need to be based on reasonable and reliable assumptions
KINDS OF FINANCIAL PROJECTIONS
1. Profit and Loss Statement
2. Balance Sheet
3. Cash Budget

13
PROJECTED PROFIT AND LOSS STATEMENT
Projects sales and all expense items that are tax‐deductible
Usually does not include non‐tax deductible items such as principal payments on term‐debt or some meals and entertainment expenses
The projected P&L shows how a company expects to utilize its resources
DEVELOPING A PROJECTED P& L
Step 1. Project Sales based on:
Trends
Orders
Increased capacity
Recent sales history
Management objectives
External competitive environment

14
DEVELOPING A PROJECTED P & L (cont’d)
Step 2
Project COGS based on :
The business’ most recent trends (%)
Any efficiencies
Step 3
Project SGA based on:
The business’ most recent trends (%)
Any efficiencies
DEVELOPING A PROJECTED P & L (cont’d)
Step 3:Project depreciation based on the expected depreciation of existing assets as well as assets that are to be purchased
Example: A business has assets (buildings and M&E) which are being depreciated annually for an amount of $50,000. The business expects to purchase additional M & E for $150,000 to be depreciated over 5 years. Total projected depreciation = $80K
15
DEVELOPING A PROJECTED P & L (cont’d)
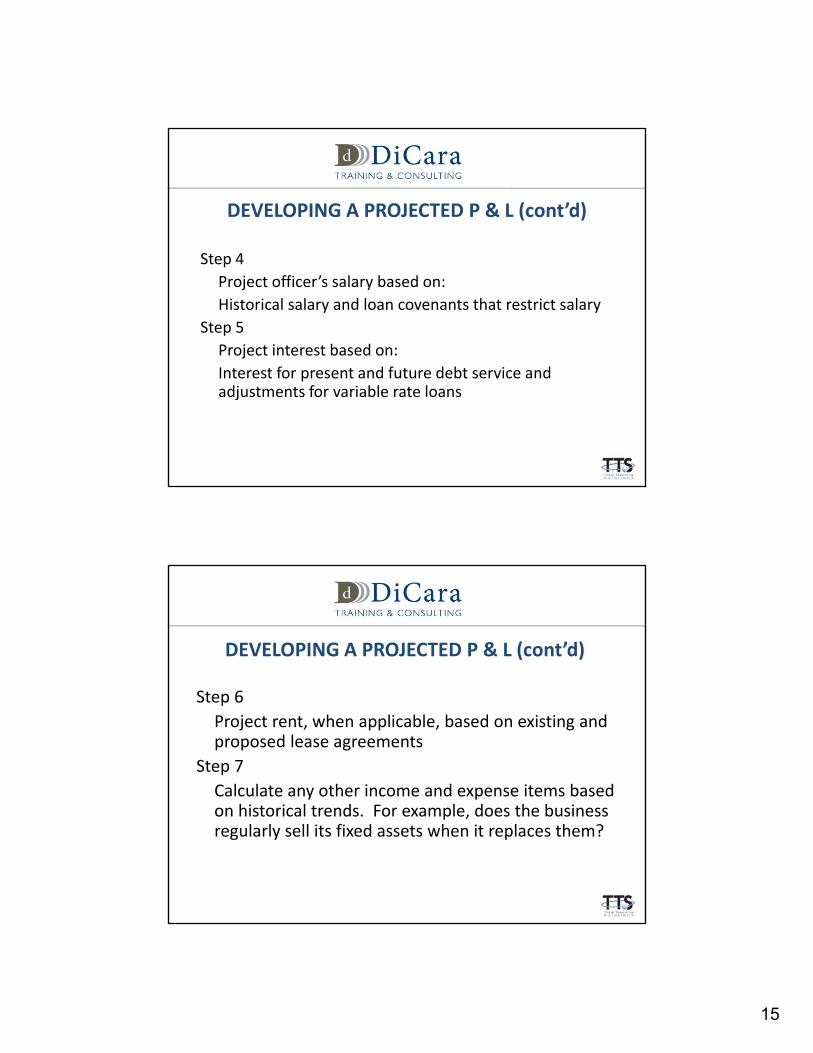
Step 4
Project officer’s salary based on:
Historical salary and loan covenants that restrict salary
Step 5
Project interest based on:
Interest for present and future debt service and adjustments for variable rate loans
DEVELOPING A PROJECTED P & L (cont’d)
Step 6
Project rent, when applicable, based on existing and proposed lease agreements
Step 7
Calculate any other income and expense items based on historical trends. For example, does the business regularly sell its fixed assets when it replaces them?

16
DEVELOPING A PROJECTED P & L (cont’d)
Step 8
Calculate earnings before tax (EBT)
Step 9
Project taxes (for C‐corporations) using the appropriate federal and state tax tables and adjusting for any loss carryover or credits
Step 10
Calculate profit after tax (PAT)
PROJECTING THE BALANCE SHEET
Step 1
Project Net Worth by adjusting net worth accounts for projected PAT and any new equity injections or payment of dividends or other withdrawals of equity. Calculate Total Net Worth
Step 2
Project long term debt (LTD) and current portion of long‐term debt

17
PROJECTING THE BALANCE SHEET (cont’d)
Step 2 (cont’d)
Take into account both existing long term debt and any proposed long term debt. Remember to calculate the current portion of any long term debt and subtract any debt that will be paid off during the time period that the projections cover. Remember to include any long‐term leases, if applicable
PROJECTING THE BALANCE SHEET (cont’d)
Step 3
Project accounts payable based on projected days accounts payable and projected COGS from P & L statement. Use the following formula
Projected A/P=
Projected Days A/P X Projected. COGS
360

18
PROJECTING THE BALANCE SHEET (cont’d)
Step 4
Project accruals based on projected days accruals and projected COGS. Use the following formula:
Projected Accruals=
Projected Days Acc. X Projected. COGS
360
PROJECTING THE BALANCE SHEET (cont’d)
Step 5
Project Short term debt (Note Payable Bank and others). Base on historical debt and owner’s needs
Step 6
Project other liabilities items such as officer debt, income taxes, deposits, etc.

19
PROJECTING THE BALANCE SHEET (cont’d)Step 7
Calculate current liabilities and total liabilities
Step 8
Add total liabilities to Net Worth
Step 9
Insert the result of Step 8 in the Total Assets line
Remember the accounting equation
Assets = Liabilities + Net Worth
PROJECTING THE BALANCE SHEET (cont’d)
Step 10
Calculate projected net fixed assets using the following formula:
Current Net Fixed Assets (NFA)
‐ Projected Depreciation (from P & L)
+ Projected Cap. Expenditures
= Projected Net Fixed Assets

20
PROJECTING THE BALANCE SHEET (cont’d)
Step 11
Calculate any other long term assets; e.g. intangibles based on history and the business’ plan
Step 12
Subtract long term assets from total assets. The result is total current assets
PROJECTING THE BALANCE SHEET (cont’d)
Step 13
Calculate other current assets such as prepaids or deposits
Step 14
Calculate any notes receivable, either as current or long‐term assets
21
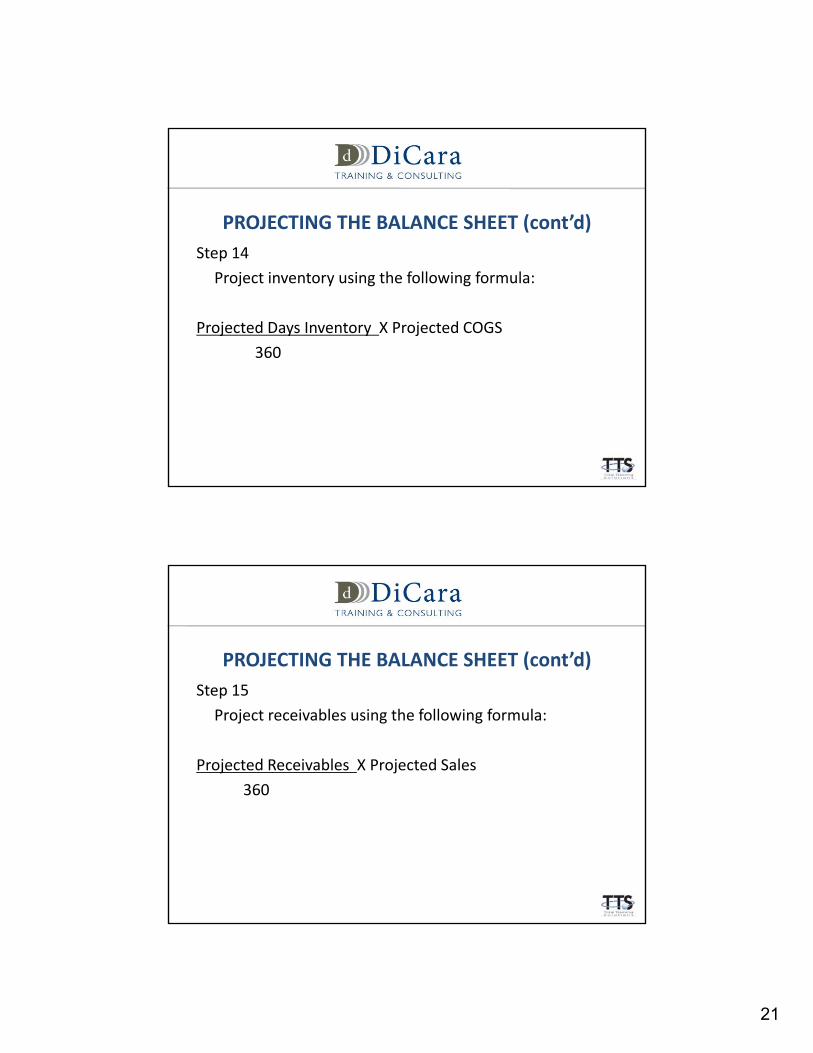
PROJECTING THE BALANCE SHEET (cont’d)
Step 14
Project inventory using the following formula:
Projected Days Inventory X Projected COGS
360
PROJECTING THE BALANCE SHEET (cont’d)
Step 15
Project receivables using the following formula:
Projected Receivables X Projected Sales
360
22
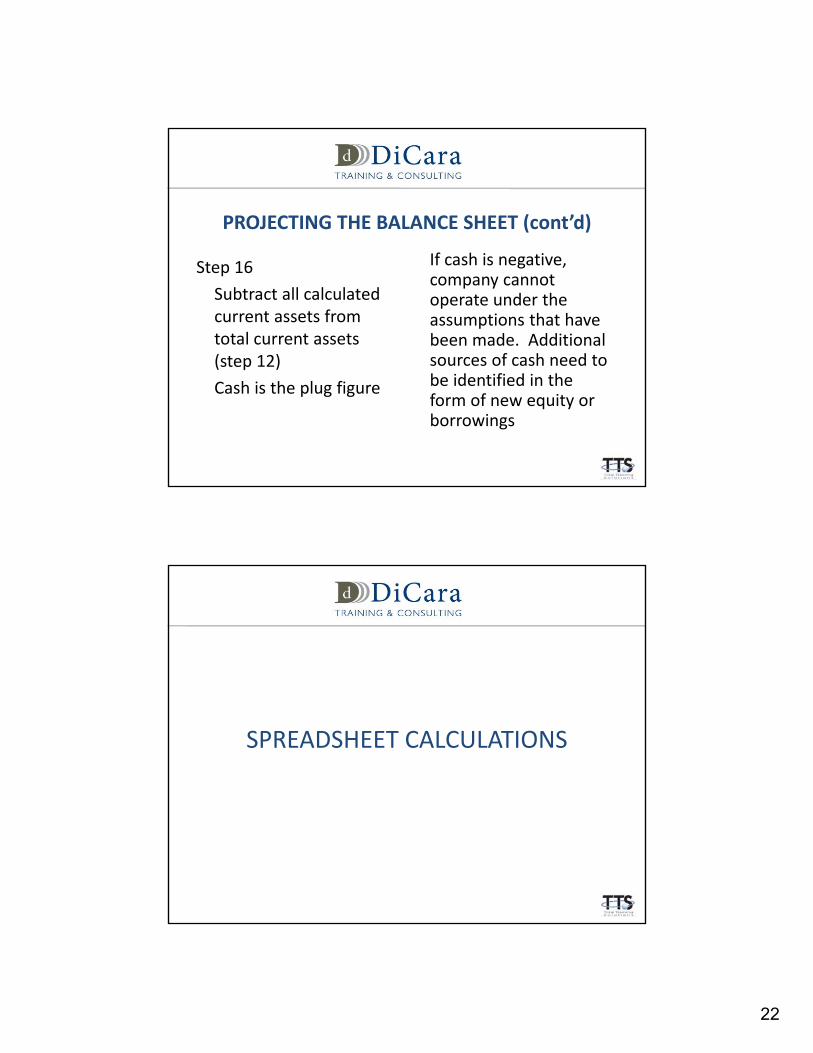
PROJECTING THE BALANCE SHEET (cont’d)
Step 16
Subtract all calculated current assets from total current assets (step 12)
Cash is the plug figure
If cash is negative, company cannot operate under the assumptions that have been made. Additional sources of cash need to be identified in the form of new equity or borrowings
SPREADSHEET CALCULATIONS

23
SPREADSHEET CALCULATIONS
Days Receivable= Receivables/sales X360
Days Inventory= Inventory/COGS X360
Days Payables= Payables/COGS X 360
Days Accruals= Accruals/COGS X360
Working Capital = CA‐CL
Current Ratio= CA/CL
Quick Ratio= Cash + Receivables/CL
Days Cash= Cash/Sales X360
SPREADSHEET CALCULATIONS (cont’d)% Sales Growth=
current year’s sales ‐ previous years sales
previous year’s sales
Debt/equity ratio=
Total Liabilities – Sub. Officer Loans
NW + Sub. Officer loans –Intangibles

24
SPREADSHEET CALCULATIONS (cont’d)Recon. Net Worth= Ending NW
‐ Profit After Tax
‐ Beginning NW
= New Equity (withdrawals)
Cap. Expenditures= Ending Net Fixed Assets
+Depreciation
‐ Beginning Net Fixed Assets
=Net Capital Expenditures
SPREADSHEET CALCULATIONS FOR PROJECTIONS
Projected Receivables= Projected Days Receivables/360 X Projected Sales
Projected Inventory= Projected Days Inventory/360 X projected COGS
Projected Payables= Projected Days Payables/360 X Projected COGS
Projected Accruals= Projected Days Accruals/360 X projected COGS
25
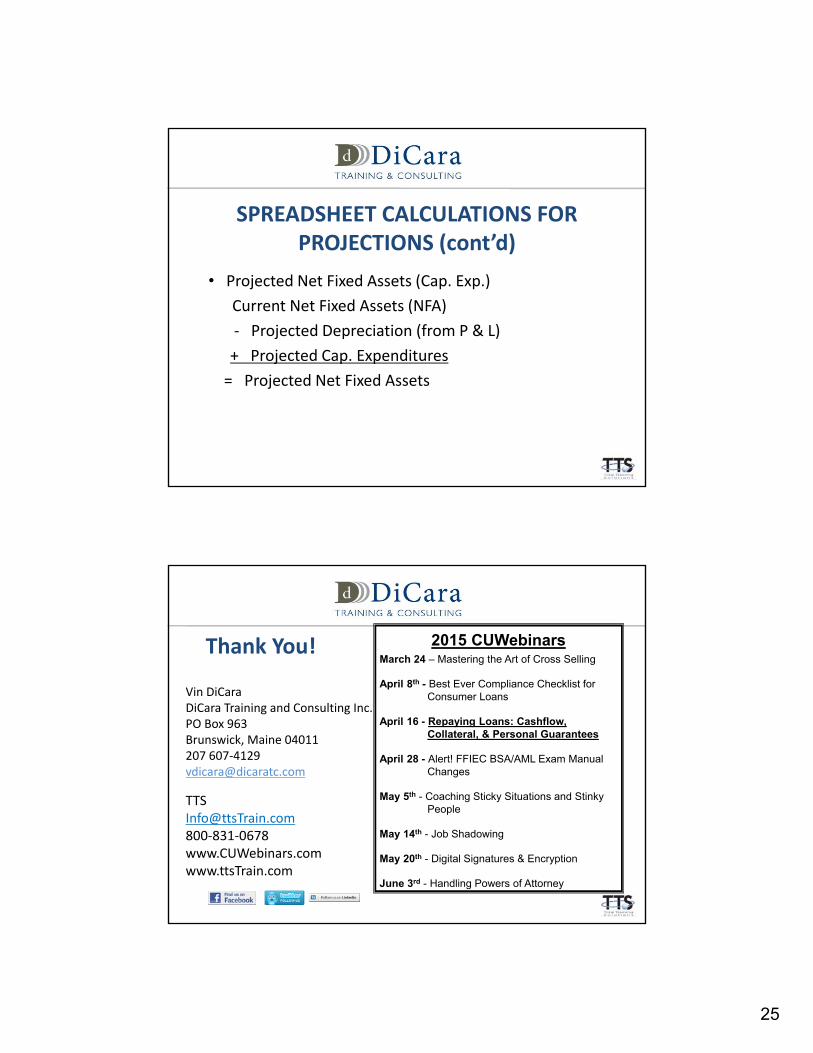
SPREADSHEET CALCULATIONS FOR PROJECTIONS (cont’d)
• Projected Net Fixed Assets (Cap. Exp.)
Current Net Fixed Assets (NFA)
‐ Projected Depreciation (from P & L)
+ Projected Cap. Expenditures
= Projected Net Fixed Assets
Thank You! 2015 CUWebinarsMarch 24 – Mastering the Art of Cross Selling
April 8th - Best Ever Compliance Checklist for Consumer Loans
April 16 - Repaying Loans: Cashflow, Collateral, & Personal Guarantees
April 28 - Alert! FFIEC BSA/AML Exam Manual Changes
May 5th - Coaching Sticky Situations and Stinky People
May 14th - Job Shadowing
May 20th - Digital Signatures & Encryption
June 3rd - Handling Powers of Attorney
[email protected]‐831‐0678www.CUWebinars.comwww.ttsTrain.com
Vin DiCaraDiCara Training and Consulting Inc.PO Box 963Brunswick, Maine 04011 207 607‐[email protected]