cash flow: operating performance of … flow ; operating performance of manufacturing... · ratio...
TRANSCRIPT

CASH FLOW OPERATING PERFORMANCE OF NANUFACTURING INDUSTRY IN MALAYSIA
Ng Hui Chin
HD Bachelor of Finance (Honours) 9736 2015 M3 N576 2015
Pusat Khidmat MakJumat Akademik UNlVERSm MALAYSIA SAItAWAK
P KHIDnAT nAKLUnAT AKADEnIK
UNInAS
~IIIIIIIIIIIIIIIIIIIIIII 1000268864
CASH FLOW OPERATING PERFORMANCE OF MANUFACTURING INDUSTRY IN MALAYSIA
NGHUICHIN
This project is submitted in partial fulfillment of the requirements for the degree of Bachelor of Finance with Honours
Faculty of Economics and Business UNlVERSITI MALAYSIA SARA WAK
2015
Statement of Originality
The work described in this Final Year Project entitled Cash flow Operating Performance of Manufacturing Industry in Malaysia
is the best of the authors knowledge that of the author except where due reference is made
(Date submitted) (Stud~s signature)
Ng Hui Chin 37460
ABSTRACT
CASH FLOW OPERATING PERFOMANCE OF
MANUFACTUING INDUSTRY IN MALAYSIA
By
Ng Hui Chin
The objective of this paper is to examine the operating activities perfonnance
across the manufacturing industries in Malaysia using financial accounting ratios
The variables chosen in the study include Return on Net Operating Assets ratio
(RNOA) Operating Cash Flow ratio (OCF) Earning before Interest Tax
Depreciation and Amortization Margin ratio (EBITDA Margin) Inventory Turnover
ratio (IT) and Operating Cash Flow to Sales ratio (OCFSales) Each variable will be
analyzed using Stata for 5 year-period from 2010-2014 The results of analysis found
that the EBITDA Margin IT and OCFSales did not translate into significant
changes in RNOA The lack of the significance in the ratios above implied that the
study of profitability efficiency and short-tenn liquidity does not well explain the
operating perfonnance of manufacturing industry imiddotn Malaysia In contrast changes
in the OCF were significantly positive related with the changes in RNOA indicating
that the cash position of a company effects the operating perfonnance directly
ABSTRAK
ALlRAN TUNAl PRESTASI OPERASI DALAM
INDUSTRI PEMBUATAN DI MALAYSIA
Oleh
Ng Hui Chin
Objektif kajian ini adalah untuk mengkaji prestasi aktiviti operasi industri
pembuatan di Malaysia dengan menggunakan nisbah perakaunan kewangan Aliran
tunai operasi dicategori sebagai aliran tunai yang paling penting kerana kegagalan
untuk menjana tunai daripada aktiviti operasi memberi isyarat bahawa perniagaan
gagal untuk menjana pendapatan daripada aktiviti terasnya Pembolehubah yang
dipilih dalam kajian ini termasuk RNOA OCF EBITDA Margin and IT dan
OCFSales Setiap pembolehubah akan dianalisis menggunakan Stata untuk tempoh
5 tahun dari 2010-2014 Hasil analisis mendapati bahawa Margin EBITDA IT dan
OCFJualan tidak menghasilkan perubahan ketara dalam RNOA Ini menunjukkan
bahawa keuntungan efisien dan aliran tunai jangka pendek tidak menjelaskan
prestasi operasi industri pembuatan di Malaysia Sebaliknya perubahan dalam OCF
yang positif selaras dengan perubahan dalam RNOA menunjukkan bahawa tahap
tunai syarikat menjejas prestasi operasi secara langsung
Acknowledgement
First and foremost I would like to express my gratitude to my supervisor Mr
Shaharudin Jakpar for the guidance and insightful advices in the process of
producing Final Year Project The comments and advices from my supervisor help
toward the accomplishment of this project
Subsequently I am grateful to my family members and friends for the moral
support encouragement and continuous sharing of knowledge towards the
completion of this project I wish to express my words of appreciation to those that
share their knowledge and opinions with me
Last but not least I would like to extend my indebtedness to all the staffs of
Faculty of Economics and Business UNIMAS and anyone else for his or her
contribution regardless directly or indirectly in the accomplishment of this project
I
Pusat Khidmat MakJumat Akademik UNlVERSm MALAYSIA SARAWAJ(
TABLE OF CONTENTS
LIST OF TABLES x LIST OF FIGURES xi
CHAPTER 1 INTRODUCTION 1
lO Introduction 1 11 Background of Study 2 12 Cash Flow Ratios 7
121 Operating Cash Flow 8 1211 Operating performance RNOA 8 1212 Cash Position OCF 8 1213 Profitability EBITDA Margin 9 1214 Asset Efficiency IT 9 1215 Short-term Liquidity OCF Sa1es 10
13 Theoretical Framework 11 14 Problem Statement i 3 15 Objective of Study 15
151 General Objective 15 152 Specific Objective 15
16 Significant of Study 16 17 Scope of Study 16 18 Concluding Remarks 17
CHAPTER 2 LITERATURE REVEIW 18 20 Introduction 18 21 Importance of Financial Ratio 18 22 Reviews on the Determinants of Operating Performance 19
221 Cash Position 19 222 Profitability 19 223 Efficiency 20 224 Liquidity 20
23 Theoretical Reviews 23 231 Agency Cost of Debt Theory 23 232 Schumpeter Theory of Profitability 23
233 Allocative Efficiency Theory 24 234 Technical Efficiency Theory 25 235 Trade Off Theory of Liquidity 26 236 Pecking Order Theory of Liquidity 27 237 Expense Preference Behavior Theory 28
24 Reviews of Empirical Testing Procedures 29 241 Descriptive Statistics 29
242 Factor Analysis and Principle Component Analysis 29
243 Correlation Coefficients 30
244 Ordinary Least Square (OLS) method 31 245 Generalized Estimating Equations (GEE) 31
246 Normality Test 32 247 Granger Causality Analysis 32
248 Multicollinearity 33
249 Financial Statement Analysis 33
2410 Data Development Analysis (DEA) model 34 2411 Tobins Q Model 35
25 Concluding Remarks 35
CHAPTER 3 METHODOLOGY 44 30 Introduction 44
31 Population and Sample of the Study 45 32 Data Collection Methods 45
33 Conceptual Model of the Study 46 34 Variables 47
341 Dependent Variable 47
3411 RNOA 47
342 Independent Variables 48 3421 OCF 48
3422 EBITDA Margin 48
3423 IT 49 3424 OCFSales 49
35 Hypotheses of the Study 50 36 Methodology 50
361 Descriptive Statistics 50 362 Pearsons Correlation 51
363 Pooled Ordinary Least Square (OLS) Regression 52
364 Random Effect Model 52
365 Breusch-Pagan Lagrangian Multipler (LM) Test 53
366 Fixed Effect Model 53
367 Hausman Test 54
368 Diagnostic Test 55
3681 Modified Wald Test 55 3682 Wooldridge Test 56
369 Fixed Effect with Robust Standard Errors 56
3691 F-test 57 3692 R2 (Goodness of Fit) 57
3610 Multiple Regression Analysis 58
37 Concluding Remarks 58
J
CHAPTER 4 RESULTS AND DISCUSSIONS 60 40 Introduction 60 41 Results 61
411 Descriptive Statistics 61 412 Pearsons Correlation Test 62 413 Hypothesis Testing 63
4131 Pooled OLS model versus Random Effect Model 64 4132 Random Effect Model versus Fixed Effect Model 64
414 Diagnostic Tests 65 4141 Wooldridge Test 65 4142 Modified Wald Test 66
415 Fixed Effect with Robust Standard Errors 67 416 Multiple Regression Analysis 68
42 Discussion 70 421 Prior Study Discussion 70 422 Theoretical Discussion 71
43 Concluding Remarks 73
CHAPTER 5 CONCLUSION 74 50 Introduction 74 51 Summary of Findings 74 52 Policy and Managerial Implementation 76
52l Country specific implementation 76 522 Managerial specific implementation 78
53 Limitations and Recommendations 80
REFERENCES 81
APPENDIX
LIST OF TABLES
Table 21 Summary of Literature Review 37 Table 41 Descriptive Statistics 62 Table 42 Correlation Coefficients of Variables 63 Table 43 Summary Result of Pooled OLS Random Effect and Fixed Effect 67
Table 44 Results of Multiple Regression Analysis 69
Figure 11 Figure 12
Figure 13 Figure 14
Figure 31
Figure 41
LIST OF FIGURES
Components of Malaysias Exports 2014 5 Y ear-on-Year Export Growth Trend of Main Sectors 2014 6 Malaysias Exports by Main Sectors 2014 7 Theoretical Framework for measuring Operating Performance of
Manufacturing Industry in Malaysia 11 The relationship between cash position profitability efficiency and short-term liquidity with the return from operating activities 47 Scatterplot 66
CHAPTER 1
INTRODUCTION
10 Introduction
International Accounting Standard Board (lASB) and the Malaysian
Accounting Standards Board (MASB) have highlighted importance of generating
future cash flows from investment decisions Forecasting future cash flow is an
important aspect for decision-making purposes The elements in predicting future
cash flow is inseparable with the related financial theory like agency theory and
pecking order theory Operating activities is a typical day-to-day routine conducted
by all company in the process of generating profit Thus evaluation of operating
activities performance from financial statements is crucial especially for
manufacturing industry A companys core business activities include manufacturing
distributing marketing and selling a product or service with the cash effect that come
into the determination of income is known as operating activities Cash flow from
operations represents the ability of a firm to generate sustainable cash flows to
maintain daily operating undertakings the repayment of liabilities as well as the
source of financing
The financial crisis on 199711998 had created the hardest hit to Malaysia
economic growth and at same time the importance of appropriate corporate
governance practices start to emerge Statutory reformations were then introduced to
enhance corporate governance accounting and statutory reporting in order to
I
encourage transparency in accounting reporting Bursa Malaysia also makes effort
by requiring the financial analysts to include accounting infonnation analysis
financial perfonnance forecasting and some recommendations for the finn listed in
Bursa Malaysia The usefulness and the applicability of operating cash flow in
assessing the operating perfonnance remain statistically unknown Limited studies
have been done of the on the impact of the operating cash flow towards the operating
perfonnance of different sector and industry in Malaysia Thus this study will
investigate the operating perfonnance of manufacturing industries in Malaysia by
using the appropriate financial ratios Financial ratios are useful measurement tools
used by shareholders managers and investors to gauge the effectiveness of the
management team and overall valuations of company perfonnance This research
will
cons
contribute to the further
equences of the decision in t
understanding of managerial decision and
enn of the operating perfonnance attained
the
11 Background of Study
Malaysian government realized the importance of diversification and
modernization of the economy since the tin market collapsed during the early 1980s
Since thereafter government emphasizes qn promoting higher value industries such
as manufacturing industries service industry and finance industry Since early 1980s
Malaysias manufacturing industry has been registering outstanding evolution where
the country perceived a transition from primarily an agricultural-based economy
towards industrial-based economy Almost 80 of Malaysia exports are contributed
by the manufacturing sector and Malaysia is well-known as the world 17th largest
2
exporting nation Tenth Malaysia Plan (2011-2015) has identified 12 National Key
Economics Areas (NKEA) that have the potential to directly and materially
contribute a quantifiable amount of economic growth to the Malaysian economy Out
of this 12 activities Palm Oil and related products Electrical and Electronics and
Information and Communications technology are related to manufacturing sector
Therefore it is important to identify the strengths and weaknesses of manufacturing
industry in order to facilitate economic growth
Ministry of International Trade and Industry (MITI) proposed a Third
Industrial Master Plan (IMP3) which serves to drive Malaysia towards global
competitiveness IMP3 expects to achieve long-term global competitiveness through
transformation and innovation of the manufacturing and services sectors Following
12 high potential industries in the manufacturing sector have been targeted for
further development and promotion including the resource based and non-resource
based industries Under IMP3 manufacturing sector is targeted to grow at 56
percent annually and contribute 285 percent to gross domestic product (GDP) in
2020 and total investment of RM4122 billion (Third Industrial Master Plan 2011)
According to Ministry of Internatio~al Trade and Industry Report (2013) in
year 2013 Malaysias economy grew 47 percent despite the challenging global
economic conditions and Malaysias manufacturing sector managed to grow by 34
percent on its own Hence the performance of manufacturing industries in Malaysia
for year 2013 was stimulating and gratifying Throughout the year manufacturing
sector kept expanding and successfully contributed to the growth of countrys
3
exportations with a share of 671 percent of total exports or RM4830 billion
(Ministry of International Trade and Industry Report 2013) Besides according to
the Ministry of International Trade and Industry Report (2013) Malaysia
manufacturing sector succeeded in attracting investments that worth RM521 billion
in 787 projects 268 percent more than the RM411 billion achieved in 2012 This
proved that Malaysia is actually capable of attracting international investment and
acting a global business hub Also Malaysia adopted a more comprehensive
approach in order to attract quality foreign investments in knowledge intensive
research and development high technology and high value-added industries to
further reinforce its position as a competitive Foreign Direct Investments region
From the total investments approved in year 2013 foreign investments in
manufacturing projects achieved RM305 billion or 585 percent of the total
(Ministry of International Trade and Industry Report 2013) Besides Ministry of
International Trade and Industry Report (2013) tabulated a total of 4113
manufacturing projects approved for the period of 2009-2013 and the employment
rate from manufacturing industries also increased by 47 percent to 70049 workers
as compared to 2012 All the achievement in previous year 2013 had proved that
manufacturing sector in Malaysia is slowly and increasingly getting a stronger place
in global economy
Although Malaysia has showed some outstanding achievement in
manufacturing industries in overall the underlying potential risk pose by the internal
control of the industries operations are indeed require further investigation Results
of previous study showed that there are statistical evidence proving that strong
4
I
Pusat Khidmat Maklumat Akademiil UNlVERSm MALAYSIA SARAW
relationship exist between companys cash position profitability efficiency and
short-tenn liquidity with its perfonnance (Chong Yap and Mohamad 2013)
However the perfonnance varies across different industry therefore by focusing on
operating activities ofone industry it would more effective and precise to estimate a
favorable approach for the industry Manufacturing industry is chosen as it is
characterized by intensive operating activities requirements and high competition as
one out of five main industries in Malaysia placing the second place after Services
industries
Figure 11 Components of Malaysias Exports 2014
Totel Exports RM44125 billion
Mininl Goods RM6085bil
13816
Alricultural Goods RM4002bil
9 1 Manufactured Goods
RM33717bil 76416
Source Department of Statistics Malaysia (2014)
The malO sector that contributed to Malaysia exportation included
manufacturing sector mining sector and agriculture sector According to the pie
chart above it is clearly shown that manufactured goods account for the highest
5
percentage (764) amounting up to RM33717 billion out of the total export of
Malaysia in year 2014
Figure 12 Year-on-Year Export Growth Trend of Main Sectors 2014
~ O -------------_----------------shy
DO
DO
100
100
middot200 =~~-_--7~-------l1--------1
-laquo10
__ Manufactured Goods ~Mrning Goods -+-AgriCUltural Goods
Source Department of Statistics Malaysia (2014)
According to Figure 12 Malaysias total exports for manufactured goods
fluctuated throughout the year for year 2013 and year 2014 respectively The growth
of manufactured goods achieved peak (roughly 180) in April 2014 after
recovering from the negative outputs in early half of year 2013 According to World
Trade Organization (2014) several factors has been identified including flat import
demand by developed countries (02) and moderate import growth in deVeloping
country economies (44) that contributed to the deterioration of trade of
manufactured goods in 2013 However the percentage of growth of manufactured
goods managed to maintain around 100 in the second half of year 2013 and in the
first six month for the year 2014 which indicated that manufacturing sector did serve
as the main contributor to Malaysia economic growth
6
Figure 13 Malaysias Exports by Main Sectors 2014
500
~O
300 1-11shy___--11----11---11--- 1-shy__shy - ____---1____---1_____---1_-
200 j --t__-IIshy___-tl--tt-shy I- - I-shy___~____- ____shy _ -
2013p
bull M anufactured Goods bull M ining Goods
2014p
bull Agricultural G oods
IIM~
~O ~-------------------------------------------------------
Source Department of Statistics Malaysia (2014)
According to Figure 13 manufactured goods account for a remarkable
contribution to the total export of goods from Malaysia in year 2014 Roughly 800
of the total export is contributed mainly by manufactured goods
12 Cash Flow Ratio
According to GAAP (Generally Accepted Accounting Principles)
requirements the measurement of the registrants historical or future financial
performance for an accounting period is presented in accordance with the statement
of balance sheet income and statement of ca~h flows The alteration of cash flow
between two accounting period can be categorized into three major classes
operating cash flow investing cash flow and financing cash flow with each class
signify a different uses and sources of cash Analysis of operating cash flow is
focused to narrow down the scope of study by using cash ratios as cash flow
information has strong explanatory power
7
121 Operating Cash Flow
The variables that will be covered in the model of this study is discussed as
follow including the dependent variable Return on Net Operating Assets Ratio
(RNOA) independent variables Operating Cash Flow Ratio (OCF) Earning before
Interest Tax Depreciation and Amortization Margin Ratio (EBITDA Margin)
Inventory Turnover Ratio (IT) and Operating Cash Flow to Sales Ratio (OCFSales)
1211 Operating performance Return on Net Operating Assets Ratio (RNOA)
Return on net operating assets ratio (RNOA) is the complements of Return on
Equity ratio (ROE) fiUing the gaps and assisting in the analysis of the
managements ability to run a company (Schmidt 2015) ROE is the measure of the
ability of the board of management in managing the company DuPont1formula has
been widely used to break the single ratio into several components to provide a
clearer explanation of a particular ratio However merely evaluation of DuPont
formula of ROE ratio failed to separate the operating and non-operating performance
of a company Instead RNOA as the operating part derived from ROE IS more
suitable to measure the effectiveness of the operating decision
1212 Cash Position Operating Cash FI~w Ratio (OCF)
For a listed manufacturing company a strortg cash position is a powerful
indicator of the financial strength of that company It provides some useful insights
to the investor regarding the ability of the company to conduct the business as well
as the ability to pay off the obligations Operating cash flow ratio (OCF) relates cash
1 DuPont model is created in 1919 by an executive at EI du Pont de Nemours amp Co Assets are measured at gross book value rather than at net book value using DuPont analysis
8
--- -------- - - ---------------------- ---
flow accrued from company operations to its current debt Operating cash flow
measures the amount of cash generated by a companys nonnal business operations
thus it is best to measure short-tenn liquidity of a company Operating cash flow is
chosen instead of net income because it is a better indication of liquidity as debt is
usually paid off using cash
1213 Profitability Earning before Interest Tax Depreciation and
Amortization Margin Ratio (EBITDA Margin)
EBITDA margin serve to measure a companys profitability By usmg
EBITDA margin a companys primary profitability is obtained as it excludes
depreciation and amortization This ratio measure a companys profitability by
comparing revenue with net incomeearnings Hence this metric provide the
percentage remains after deducting operating expenses EBITDA Margin is the
appropriate ratio for measuring the operating perfonnance as it excludes the
financing and tax considerations Managers and investors are capable of focusing
more on the operating profitability as EBITDA Margin minimizes down the nonshy
operating factors that is differ for each and every company
1214 Asset Efficiency Inventory TurIlover Ratio (IT)
Inventory turnover ratio (IT) show how mariy times a companys inventory is
sold and replaced over an accounting period This ratio measures how fast the
companys product are moving in the marketplace thus indicating the efficiency of
the operating activities of a company High value of inventory turnover ratio is
preferable as it represent a healthy cash flow from the operating transactions
9
However a value that is too high actually indicates inadequate manufacturing
capacity while relatively low value serve as a sign that the company may have
difficulty in selling off their products
1215 Short-term Liquidity Operating Cash Flow to Sales Ratio (OCFSales)
Operating cash flow to sales ratio (OCFSales) measures the ability of a
company to translate sales into cash by comparing the operating cash flow of a
company to its sales revenue Operating cash flow is directly proportional with the
level of sales High value of this ratio indicates a good operating cash flow
Therefore a consistent and increasing trend of this ratio reflects companys efficient
debtor management and hence impose a good investment opportunities
13 Theoretical Framework
A theoretical framework is formed to deduce the applicability of the relevant
theory in the study of the model in this research Figure 14 formulated the used of
Agency Cost of Debt theory Schumpeter theory Technical Efficiency theory and
Pecking Order theory in explaining the Cash Position Profitability Efficiency and
Short-term Liquidity respectively
10
Figure 14 Theoretical Framework for measuring Operating Performance of
Manufacturing Industry in Malaysia
Agency Cost of Debt Cash Position -
-Operating
Performance f--
Schumpeter Theory Profitability
- Technical Efficiency Theory
Efficiency
-Pecking Order Theory Short-term
Liquidity
Source Chechet amp Olay (2014) Cantwell amp Anderson (1996) Oberholzer Westhuizen amp Rooyen (2010) Owolabi amp Obida 2012
Agency cost of debt consisted of two type of conflicts the agency conflict
between managers and shareholders and the agency conflict between shareholders
and bondholders For instance a manager might be risk averse which opt for job
security while the shareholders hope to invest in risky projects to maximize their
profit Hence if the risky project is successful shareholder wealth increased
contrarily if the project fails the manager lost the job Besides the conflict between
shareholders and bondholder is inevitable as the source of investment mainly
contributed by the bondholder Conflict arises as if the risky project invested succeed
all the profit will go to the shareholder but in tum if the project fail the bondholder
have to bare the loses The level of the operating cash flow is therefore determined
by the choice of investing and at the same time fulfilling the desire of each party
involved
11
J
Following the theory proposed by Schumpeter the concept of new
combination is a leading concept in the current economic development Five major
scope of the new concept including the introduction of new good new method of
production opening of new market conquest of the new source of supply or raw
materials and the establishment of the new organization of any industry is developed
Hence this new approach together with the innovations concept will further enhance
the evolving of the economic conditions Although there is arguments regarding
innovations cause monopoly the monopoly does not last forever Innovations only
cause temporary monopoly but the profits and advantages it brought to the total
economic welfare are infinite In short the advantage proposed by this theory could
be measure in term of profitability which is the most significant outcome to be
observed
Technical Efficiency theory implies a general condition of optimal
distribution of the resources to minimize the waste and improve efficiency An
efficient condition is a condition where the production of the goods is achieved with
minimum resources while maximizing the outputs Technical efficiency is a better
measurement of operating activities as in focused on evaluating the capital labour
and the resources that involved in the income generating goods Although this theory
suggested that no one can be better off without deteriorating others the equilibrium
level can still be adjusted to maximise the well beings of the parties involved This
theory is applicable to the production of the inventory beginning from the
transformation of the raw material into the ready goods and also the matching of the
production of the inventory with demand of the goods in the market If the inventory
12
is produce in accordance to the market demand the inventory will be easily
liquidated off and the amounts of obsolete goods can be greatly reduced
Pecking order theory does not consider optimal capital structure as priority
instead it asserts the distinct preference in adopting internal financing rather than
external fund The financing choice using external funds will consider the
alternatives that minimise the additional costs of asymmetric information Hence
pecking order theory opts for the internal generated funds followed by risky debt
and finally resorting to equity Debt financing tends to burden the company with the
periodically payment of interest rate as well as repayment of principle and failure to
do so might induce bankruptcy of the company The choice of financing will affect
the short-term liquidity of a company as ifthe company is financing through external
debts the repayment of debts have to be fulfil first before the sales can be translated
to the profit of the company Therefore pecking order theory served to strengthen
the security of the firm and avoid the problems of repayment ofloan
14 Problem Statement
According to the Economic Report 20132014 released by the Ministry of
Finance Malaysian economy is expected to grow at a stronger pace of between 5
and 55 in 201 4 on firm domestic demand and recovery in exports High labor
demands as well as high yield investment opportunities placed manufacturing
industry an important sector in Malaysia Malaysia is among the top choice for
foreigners to invest in manufacturing industry as Malaysias economic development
13

I
encourage transparency in accounting reporting Bursa Malaysia also makes effort
by requiring the financial analysts to include accounting infonnation analysis
financial perfonnance forecasting and some recommendations for the finn listed in
Bursa Malaysia The usefulness and the applicability of operating cash flow in
assessing the operating perfonnance remain statistically unknown Limited studies
have been done of the on the impact of the operating cash flow towards the operating
perfonnance of different sector and industry in Malaysia Thus this study will
investigate the operating perfonnance of manufacturing industries in Malaysia by
using the appropriate financial ratios Financial ratios are useful measurement tools
used by shareholders managers and investors to gauge the effectiveness of the
management team and overall valuations of company perfonnance This research
will
cons
contribute to the further
equences of the decision in t
understanding of managerial decision and
enn of the operating perfonnance attained
the
11 Background of Study
Malaysian government realized the importance of diversification and
modernization of the economy since the tin market collapsed during the early 1980s
Since thereafter government emphasizes qn promoting higher value industries such
as manufacturing industries service industry and finance industry Since early 1980s
Malaysias manufacturing industry has been registering outstanding evolution where
the country perceived a transition from primarily an agricultural-based economy
towards industrial-based economy Almost 80 of Malaysia exports are contributed
by the manufacturing sector and Malaysia is well-known as the world 17th largest
2
exporting nation Tenth Malaysia Plan (2011-2015) has identified 12 National Key
Economics Areas (NKEA) that have the potential to directly and materially
contribute a quantifiable amount of economic growth to the Malaysian economy Out
of this 12 activities Palm Oil and related products Electrical and Electronics and
Information and Communications technology are related to manufacturing sector
Therefore it is important to identify the strengths and weaknesses of manufacturing
industry in order to facilitate economic growth
Ministry of International Trade and Industry (MITI) proposed a Third
Industrial Master Plan (IMP3) which serves to drive Malaysia towards global
competitiveness IMP3 expects to achieve long-term global competitiveness through
transformation and innovation of the manufacturing and services sectors Following
12 high potential industries in the manufacturing sector have been targeted for
further development and promotion including the resource based and non-resource
based industries Under IMP3 manufacturing sector is targeted to grow at 56
percent annually and contribute 285 percent to gross domestic product (GDP) in
2020 and total investment of RM4122 billion (Third Industrial Master Plan 2011)
According to Ministry of Internatio~al Trade and Industry Report (2013) in
year 2013 Malaysias economy grew 47 percent despite the challenging global
economic conditions and Malaysias manufacturing sector managed to grow by 34
percent on its own Hence the performance of manufacturing industries in Malaysia
for year 2013 was stimulating and gratifying Throughout the year manufacturing
sector kept expanding and successfully contributed to the growth of countrys
3
exportations with a share of 671 percent of total exports or RM4830 billion
(Ministry of International Trade and Industry Report 2013) Besides according to
the Ministry of International Trade and Industry Report (2013) Malaysia
manufacturing sector succeeded in attracting investments that worth RM521 billion
in 787 projects 268 percent more than the RM411 billion achieved in 2012 This
proved that Malaysia is actually capable of attracting international investment and
acting a global business hub Also Malaysia adopted a more comprehensive
approach in order to attract quality foreign investments in knowledge intensive
research and development high technology and high value-added industries to
further reinforce its position as a competitive Foreign Direct Investments region
From the total investments approved in year 2013 foreign investments in
manufacturing projects achieved RM305 billion or 585 percent of the total
(Ministry of International Trade and Industry Report 2013) Besides Ministry of
International Trade and Industry Report (2013) tabulated a total of 4113
manufacturing projects approved for the period of 2009-2013 and the employment
rate from manufacturing industries also increased by 47 percent to 70049 workers
as compared to 2012 All the achievement in previous year 2013 had proved that
manufacturing sector in Malaysia is slowly and increasingly getting a stronger place
in global economy
Although Malaysia has showed some outstanding achievement in
manufacturing industries in overall the underlying potential risk pose by the internal
control of the industries operations are indeed require further investigation Results
of previous study showed that there are statistical evidence proving that strong
4
I
Pusat Khidmat Maklumat Akademiil UNlVERSm MALAYSIA SARAW
relationship exist between companys cash position profitability efficiency and
short-tenn liquidity with its perfonnance (Chong Yap and Mohamad 2013)
However the perfonnance varies across different industry therefore by focusing on
operating activities ofone industry it would more effective and precise to estimate a
favorable approach for the industry Manufacturing industry is chosen as it is
characterized by intensive operating activities requirements and high competition as
one out of five main industries in Malaysia placing the second place after Services
industries
Figure 11 Components of Malaysias Exports 2014
Totel Exports RM44125 billion
Mininl Goods RM6085bil
13816
Alricultural Goods RM4002bil
9 1 Manufactured Goods
RM33717bil 76416
Source Department of Statistics Malaysia (2014)
The malO sector that contributed to Malaysia exportation included
manufacturing sector mining sector and agriculture sector According to the pie
chart above it is clearly shown that manufactured goods account for the highest
5
percentage (764) amounting up to RM33717 billion out of the total export of
Malaysia in year 2014
Figure 12 Year-on-Year Export Growth Trend of Main Sectors 2014
~ O -------------_----------------shy
DO
DO
100
100
middot200 =~~-_--7~-------l1--------1
-laquo10
__ Manufactured Goods ~Mrning Goods -+-AgriCUltural Goods
Source Department of Statistics Malaysia (2014)
According to Figure 12 Malaysias total exports for manufactured goods
fluctuated throughout the year for year 2013 and year 2014 respectively The growth
of manufactured goods achieved peak (roughly 180) in April 2014 after
recovering from the negative outputs in early half of year 2013 According to World
Trade Organization (2014) several factors has been identified including flat import
demand by developed countries (02) and moderate import growth in deVeloping
country economies (44) that contributed to the deterioration of trade of
manufactured goods in 2013 However the percentage of growth of manufactured
goods managed to maintain around 100 in the second half of year 2013 and in the
first six month for the year 2014 which indicated that manufacturing sector did serve
as the main contributor to Malaysia economic growth
6
Figure 13 Malaysias Exports by Main Sectors 2014
500
~O
300 1-11shy___--11----11---11--- 1-shy__shy - ____---1____---1_____---1_-
200 j --t__-IIshy___-tl--tt-shy I- - I-shy___~____- ____shy _ -
2013p
bull M anufactured Goods bull M ining Goods
2014p
bull Agricultural G oods
IIM~
~O ~-------------------------------------------------------
Source Department of Statistics Malaysia (2014)
According to Figure 13 manufactured goods account for a remarkable
contribution to the total export of goods from Malaysia in year 2014 Roughly 800
of the total export is contributed mainly by manufactured goods
12 Cash Flow Ratio
According to GAAP (Generally Accepted Accounting Principles)
requirements the measurement of the registrants historical or future financial
performance for an accounting period is presented in accordance with the statement
of balance sheet income and statement of ca~h flows The alteration of cash flow
between two accounting period can be categorized into three major classes
operating cash flow investing cash flow and financing cash flow with each class
signify a different uses and sources of cash Analysis of operating cash flow is
focused to narrow down the scope of study by using cash ratios as cash flow
information has strong explanatory power
7
121 Operating Cash Flow
The variables that will be covered in the model of this study is discussed as
follow including the dependent variable Return on Net Operating Assets Ratio
(RNOA) independent variables Operating Cash Flow Ratio (OCF) Earning before
Interest Tax Depreciation and Amortization Margin Ratio (EBITDA Margin)
Inventory Turnover Ratio (IT) and Operating Cash Flow to Sales Ratio (OCFSales)
1211 Operating performance Return on Net Operating Assets Ratio (RNOA)
Return on net operating assets ratio (RNOA) is the complements of Return on
Equity ratio (ROE) fiUing the gaps and assisting in the analysis of the
managements ability to run a company (Schmidt 2015) ROE is the measure of the
ability of the board of management in managing the company DuPont1formula has
been widely used to break the single ratio into several components to provide a
clearer explanation of a particular ratio However merely evaluation of DuPont
formula of ROE ratio failed to separate the operating and non-operating performance
of a company Instead RNOA as the operating part derived from ROE IS more
suitable to measure the effectiveness of the operating decision
1212 Cash Position Operating Cash FI~w Ratio (OCF)
For a listed manufacturing company a strortg cash position is a powerful
indicator of the financial strength of that company It provides some useful insights
to the investor regarding the ability of the company to conduct the business as well
as the ability to pay off the obligations Operating cash flow ratio (OCF) relates cash
1 DuPont model is created in 1919 by an executive at EI du Pont de Nemours amp Co Assets are measured at gross book value rather than at net book value using DuPont analysis
8
--- -------- - - ---------------------- ---
flow accrued from company operations to its current debt Operating cash flow
measures the amount of cash generated by a companys nonnal business operations
thus it is best to measure short-tenn liquidity of a company Operating cash flow is
chosen instead of net income because it is a better indication of liquidity as debt is
usually paid off using cash
1213 Profitability Earning before Interest Tax Depreciation and
Amortization Margin Ratio (EBITDA Margin)
EBITDA margin serve to measure a companys profitability By usmg
EBITDA margin a companys primary profitability is obtained as it excludes
depreciation and amortization This ratio measure a companys profitability by
comparing revenue with net incomeearnings Hence this metric provide the
percentage remains after deducting operating expenses EBITDA Margin is the
appropriate ratio for measuring the operating perfonnance as it excludes the
financing and tax considerations Managers and investors are capable of focusing
more on the operating profitability as EBITDA Margin minimizes down the nonshy
operating factors that is differ for each and every company
1214 Asset Efficiency Inventory TurIlover Ratio (IT)
Inventory turnover ratio (IT) show how mariy times a companys inventory is
sold and replaced over an accounting period This ratio measures how fast the
companys product are moving in the marketplace thus indicating the efficiency of
the operating activities of a company High value of inventory turnover ratio is
preferable as it represent a healthy cash flow from the operating transactions
9
However a value that is too high actually indicates inadequate manufacturing
capacity while relatively low value serve as a sign that the company may have
difficulty in selling off their products
1215 Short-term Liquidity Operating Cash Flow to Sales Ratio (OCFSales)
Operating cash flow to sales ratio (OCFSales) measures the ability of a
company to translate sales into cash by comparing the operating cash flow of a
company to its sales revenue Operating cash flow is directly proportional with the
level of sales High value of this ratio indicates a good operating cash flow
Therefore a consistent and increasing trend of this ratio reflects companys efficient
debtor management and hence impose a good investment opportunities
13 Theoretical Framework
A theoretical framework is formed to deduce the applicability of the relevant
theory in the study of the model in this research Figure 14 formulated the used of
Agency Cost of Debt theory Schumpeter theory Technical Efficiency theory and
Pecking Order theory in explaining the Cash Position Profitability Efficiency and
Short-term Liquidity respectively
10
Figure 14 Theoretical Framework for measuring Operating Performance of
Manufacturing Industry in Malaysia
Agency Cost of Debt Cash Position -
-Operating
Performance f--
Schumpeter Theory Profitability
- Technical Efficiency Theory
Efficiency
-Pecking Order Theory Short-term
Liquidity
Source Chechet amp Olay (2014) Cantwell amp Anderson (1996) Oberholzer Westhuizen amp Rooyen (2010) Owolabi amp Obida 2012
Agency cost of debt consisted of two type of conflicts the agency conflict
between managers and shareholders and the agency conflict between shareholders
and bondholders For instance a manager might be risk averse which opt for job
security while the shareholders hope to invest in risky projects to maximize their
profit Hence if the risky project is successful shareholder wealth increased
contrarily if the project fails the manager lost the job Besides the conflict between
shareholders and bondholder is inevitable as the source of investment mainly
contributed by the bondholder Conflict arises as if the risky project invested succeed
all the profit will go to the shareholder but in tum if the project fail the bondholder
have to bare the loses The level of the operating cash flow is therefore determined
by the choice of investing and at the same time fulfilling the desire of each party
involved
11
J
Following the theory proposed by Schumpeter the concept of new
combination is a leading concept in the current economic development Five major
scope of the new concept including the introduction of new good new method of
production opening of new market conquest of the new source of supply or raw
materials and the establishment of the new organization of any industry is developed
Hence this new approach together with the innovations concept will further enhance
the evolving of the economic conditions Although there is arguments regarding
innovations cause monopoly the monopoly does not last forever Innovations only
cause temporary monopoly but the profits and advantages it brought to the total
economic welfare are infinite In short the advantage proposed by this theory could
be measure in term of profitability which is the most significant outcome to be
observed
Technical Efficiency theory implies a general condition of optimal
distribution of the resources to minimize the waste and improve efficiency An
efficient condition is a condition where the production of the goods is achieved with
minimum resources while maximizing the outputs Technical efficiency is a better
measurement of operating activities as in focused on evaluating the capital labour
and the resources that involved in the income generating goods Although this theory
suggested that no one can be better off without deteriorating others the equilibrium
level can still be adjusted to maximise the well beings of the parties involved This
theory is applicable to the production of the inventory beginning from the
transformation of the raw material into the ready goods and also the matching of the
production of the inventory with demand of the goods in the market If the inventory
12
is produce in accordance to the market demand the inventory will be easily
liquidated off and the amounts of obsolete goods can be greatly reduced
Pecking order theory does not consider optimal capital structure as priority
instead it asserts the distinct preference in adopting internal financing rather than
external fund The financing choice using external funds will consider the
alternatives that minimise the additional costs of asymmetric information Hence
pecking order theory opts for the internal generated funds followed by risky debt
and finally resorting to equity Debt financing tends to burden the company with the
periodically payment of interest rate as well as repayment of principle and failure to
do so might induce bankruptcy of the company The choice of financing will affect
the short-term liquidity of a company as ifthe company is financing through external
debts the repayment of debts have to be fulfil first before the sales can be translated
to the profit of the company Therefore pecking order theory served to strengthen
the security of the firm and avoid the problems of repayment ofloan
14 Problem Statement
According to the Economic Report 20132014 released by the Ministry of
Finance Malaysian economy is expected to grow at a stronger pace of between 5
and 55 in 201 4 on firm domestic demand and recovery in exports High labor
demands as well as high yield investment opportunities placed manufacturing
industry an important sector in Malaysia Malaysia is among the top choice for
foreigners to invest in manufacturing industry as Malaysias economic development
13
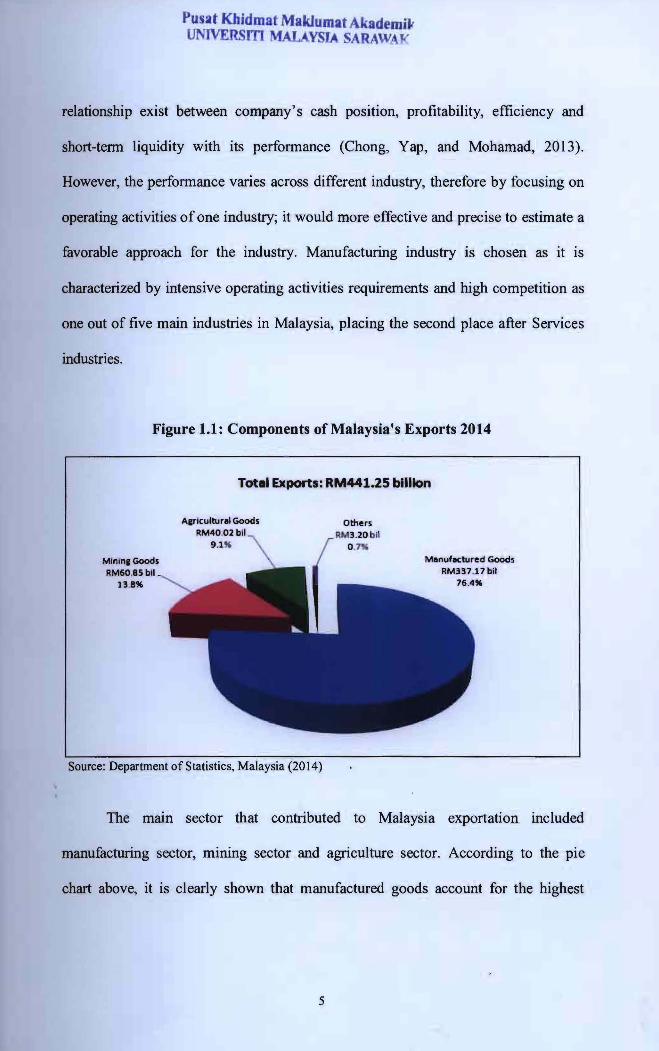