cash assistance and monthly cycles in substance abuse carlos dobkin and steve puller
TRANSCRIPT
Cash Assistance and Monthly Cycles in Substance Abuse
Carlos Dobkin and Steve Puller

Policy Concern About Cash Aid – Substance Abuse Link
• Politicians and health professionals are concerned that government aid results in increased substance abuse
• There is also concern that cash aid results in monthly cycle in drug related hospitalizations straining already overloaded emergency rooms.
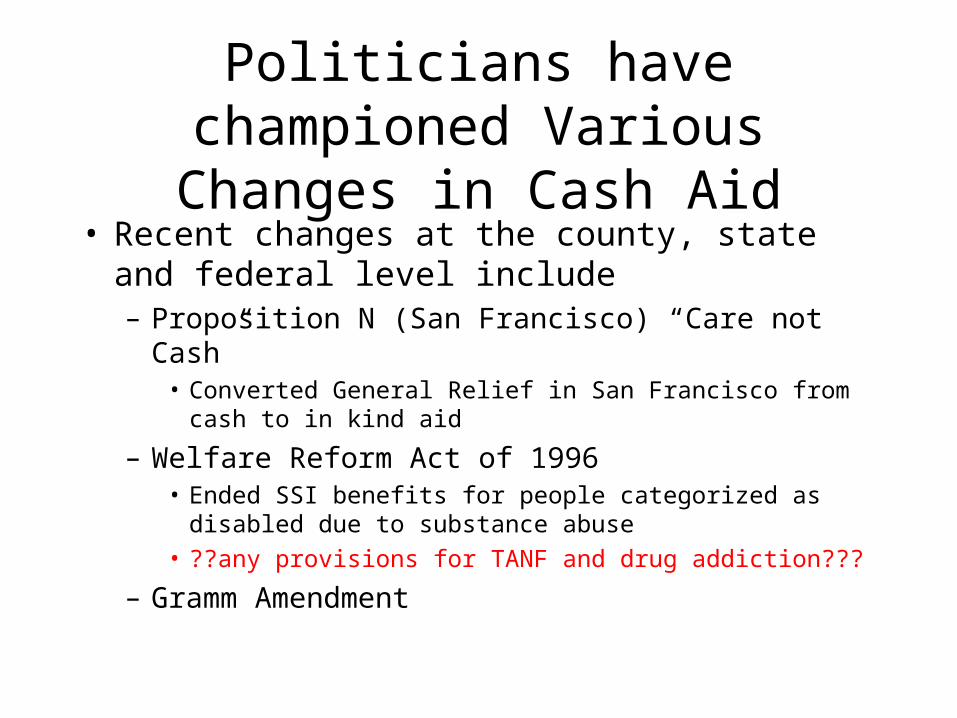
Politicians have championed Various Changes in Cash Aid
• Recent changes at the county, state and federal level include– Proposition N (San Francisco) “Care not Cash”
• Converted General Relief in San Francisco from cash to in kind aid
– Welfare Reform Act of 1996 • Ended SSI benefits for people categorized as disabled due to
substance abuse
• ??any provisions for TANF and drug addiction???
– Gramm Amendment

Literature on Cycles in Drug Consumption
• Monthly pattern in deaths (Phillips, NEJM 1999)– 14% more substance abuse deaths in first vs. last week of month
• Monthly pattern in psychiatric admissions (Halpern & Mechem, Am J Med, 2001)– Psychiatric admissions for substance abuse 14% higher first week
(vs. 6% for non-substance abuse)
• Cocaine use among disabled vets (Shaner, NEJM, 1995)– 105 male vets on disability with history of schizophrenia &
cocaine use– Highest cocaine concentration in body during first 3 days of
month, followed by highest number of hospital admissions 3-5 days later

Causes of Drug Cycles is unknown
• “Fat wallets” early in the month could have a number of causes– Cash infusions at the beginning of the month due to
monthly pay checks– Federal transfers (SSI, SSDI)– State transfers (AFDC/TANF, Food Stamps)– Local transfers (General Relief)

Contributions of this paper
• Document the monthly cycle in hospital admissions and see how it varies by substance
• Determine which government programs are driving the monthly cycle in admissions
• Check if alternate disbursal regimes can smooth the monthly cycle in admissions
• Test if the programs effect the level of admissions or just the timing of admissions

Data
• California Hospital Discharge Data 1994-2000– Census of hospitalizations– Includes patient demographics, cause of hospitalization
and treatment provided
• Medi-Cal Eligibility Data 1994-2000– Linked to hospital data– Includes individuals receiving welfare and
Supplemental Security Income for Aged Blind or Disabled
– Does not include General Relief or Disability Insurance

Figure 1: Drug Related Hospital Admissions (California 1994-2000)
0
5,000
10,000
15,000
20,000
25,000
30,000
1 2 3 4 5 6 7 8 9 10 11 12 13 14 15 16 17 18 19 20 21 22 23 24 25 26 27 28
Day of Month
Adm
issi
ons
with
a m
entio
n of
Alc
ohol
0
2,000
4,000
6,000
8,000
10,000
12,000
14,000
Adm
issi
ons
with
a m
entio
n of
Coc
aine
, Her
oin
or
Am
phet
amin
e
Alcohol
Cocaine, Heroin or Amphetamine

I don’t understand why we exclude 29-31? It’s not a technicalproblem in creating – that’s easy. 30 and 31 (and once 28) must just be interpreted slightly differently. Also, is excludinglast 3 consistent with fact we show leaves for last 3 days.
Figure 2: Monthly Cycle in Drug Related Hospital Admissions by Drug Type (California 1994-2000)
0
1,000
2,000
3,000
4,000
5,000
6,000
7,000
1 2 3 4 5 6 7 8 9 10 11 12 13 14 15 16 17 18 19 20 21 22 23 24 25 26 27 28
Day of Admission
Her
oin
an
d C
oca
ine
0
500
1,000
1,500
2,000
2,500
3,000
3,500
4,000
4,500
Am
pht
am
ine
Cocaine
Heroin
Amphetamine

Is is true that this is roughly flat for non-drug? So we can confidentlysay that this isn’t driven by some perverse incentives created by Medicaid
Figure 3: Percent of Patients Leaving Hospital Where the Original Admission Had a Drug Mention
8.00%
8.50%
9.00%
9.50%
10.00%
10.50%
11.00%
11.50%
12.00%
12.50%
1 2 3 4 5 6 7 8 9 10 11 12 13 14 15 16 17 18 19 20 21 22 23 24 25 26 27 28 29 30 31
Day of Discharge
Pe
rce
nt L
ea
vin
g o
n D
ay
Opioid
Amphetamine
Cocaine

All Admission Alcohol Cocaine Amphetamines HeroinER admission 42.21% 61.66% 50.84% 45.03% 53.35%Length of Stay (first admission) 4.46 6.24 6.75 6.18 6.75Age of Patient 50.69 47.83 37.31 32.50 41.25Insurance Medicare 33.27% 26.76% 16.83% 12.44% 17.42% HMO 22.30% 16.80% 11.03% 14.72% 10.99% Medi-Cal 20.24% 18.51% 29.00% 30.48% 27.37% PPO 10.31% 7.92% 5.04% 6.58% 6.98% Private 4.90% 5.51% 5.43% 6.19% 4.04%Injury due to external causes 10.98% 18.13% 14.01% 15.18% 13.13%Cash Aid Welfare 9.07% 4.08% 7.96% 13.42% 5.78% SSI Disability 9.26% 19.12% 28.13% 19.64% 27.28%Hospital Charges $17,244 $18,123 $13,790 $13,568 $15,924Died first admission 2.26% 2.92% 1.07% 0.86% 1.70%Total admissions 18,484,469 773,279 157,150 117,158 181,106
Table 1: Demographics by Type of Drug Mentioned on Admission Record
Notes: records are included in the tables above if the drug is the primary cause of admission or if it is included as one of the other ICD-9 CM codes.

Alcohol Cocaine Amphetamine HeroinCause of Admission Deliberate Injury 0.041 0.049 0.050 0.025 Accident 0.073 0.026 0.035 0.026 Drug Dependence 0.497 0.362 0.300 0.576 Drug Psychosis 0.194 0.158 0.139 0.222 Other Cause 0.196 0.405 0.475 0.151
Table 2: Causes of Admission by Drug

Cycles in Admissions
• Hospital admissions with a mention of alcohol or illicit drugs are high in the beginning of the month.
• The monthly cycle is particularly pronounced for cocaine and amphetamine
• There is a cycle in people exiting the hospital with a peak at the beginning of the month and a second peak on the third of the month

Possible Causes of the Cycle• Monthly Paychecks• Supplemental Security Income
– For the aged. blind or disabled – 5 month waiting period– Approximately 1 Million recipients state-wide, two-thirds disabled– Benefits average about $600/month for individuals ($1100/month couples)– Checks arrive on the 1st (or last previous business day if on weekend)
• Disability Income– Replacement rate varies with income– Aid arrives 3rd of month
• Welfare – County administered program for Families– Largest of the programs with 2 million recipients statewide– Benefits about $550/month in 1997– Checks typically arrive on the first but there is variation by county
• General Relief– County run program for indigent adults (varies by county typically about $250 per month)
• Unemployment Insurance – Paid bi-weekly
• Workers’ Compensation– Some benefits paid bi-weekly
• Supply side factors?
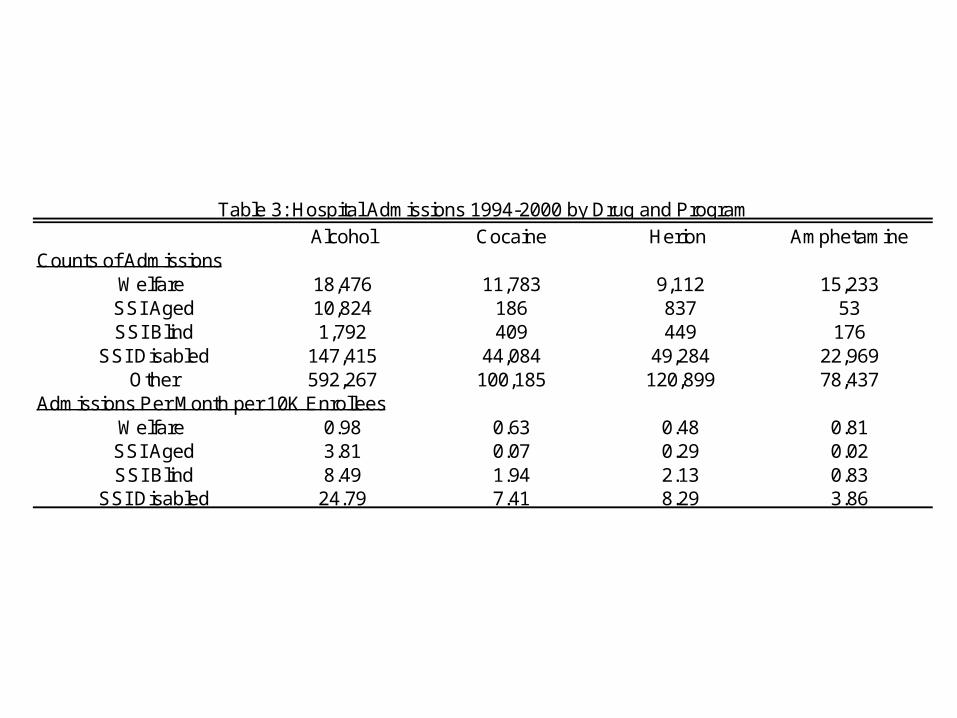
Alcohol Cocaine Herion AmphetamineCounts of Admissions
Welfare 18,476 11,783 9,112 15,233 SSI Aged 10,824 186 837 53 SSI Blind 1,792 409 449 176
SSI Disabled 147,415 44,084 49,284 22,969 Other 592,267 100,185 120,899 78,437
Admissions Per Month per 10K Enrollees Welfare 0.98 0.63 0.48 0.81 SSI Aged 3.81 0.07 0.29 0.02 SSI Blind 8.49 1.94 2.13 0.83
SSI Disabled 24.79 7.41 8.29 3.86
Table 3: Hospital Admissions 1994-2000 by Drug and Program

Employees PercentWeekly 905,562 0.21Biweekly 2,409,063 0.56Semimonthly (Typically 1st and 15th) 720,142 0.17Monthly 252,101 0.06Other 7,704 0.00Total 4,294,572
Note: Based on an American Payroll Association Survey of 872 companies
Table 4: Timing of Pay Checks
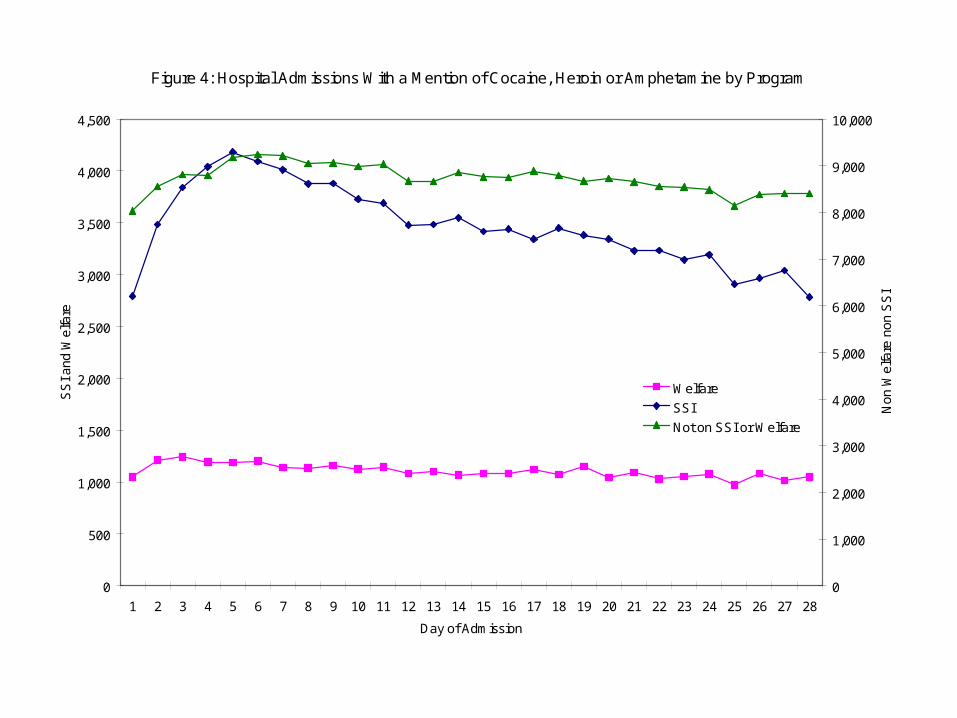
Figure 4: Hospital Admissions With a Mention of Cocaine, Heroin or Amphetamine by Program
0
500
1,000
1,500
2,000
2,500
3,000
3,500
4,000
4,500
1 2 3 4 5 6 7 8 9 10 11 12 13 14 15 16 17 18 19 20 21 22 23 24 25 26 27 28
Day of Admission
SS
I and
Wel
fare
0
1,000
2,000
3,000
4,000
5,000
6,000
7,000
8,000
9,000
10,000
Non
Wel
fare
non
SS
I
Welfare
SSI
Not on SSI or Welfare

Figure 5: Hospital Admissions by Insurance Type for Cocaine, Heroin and Amphetamine for People Receiving Neither Welfare nor SSI
0
500
1,000
1,500
2,000
2,500
3,000
3,500
1 2 3 4 5 6 7 8 9 10 11 12 13 14 15 16 17 18 19 20 21 22 23 24 25 26 27 28
Day of Admission
Pri
vate
Insu
ran
ce
0
200
400
600
800
1,000
1,200
1,400
1,600
1,800
Se
lf P
ay,
Co
un
ty In
dig
en
t, M
ed
i-C
al a
nd
Me
dic
are
Private
Self Pay
County Indigent
Medi-Cal
Medicare

Figure 6: Hospital Admissions With a Mention of Alcohol by Program
0
1,000
2,000
3,000
4,000
5,000
6,000
1 2 3 4 5 6 7 8 9 10 11 12 13 14 15 16 17 18 19 20 21 22 23 24 25 26 27 28
Day of Admission
SS
I and
Wel
fare
0
5,000
10,000
15,000
20,000
25,000
Non
Wel
fare
non
SS
I
Welfare
SSI
Not on SSI or Welfare

Figure 7: Hospital Admissions by Insurance Type With a Mention of Alcohol for People Receiving Neither Welfare nor SSI
0
1,000
2,000
3,000
4,000
5,000
6,000
7,000
8,000
1 2 3 4 5 6 7 8 9 10 11 12 13 14 15 16 17 18 19 20 21 22 23 24 25 26 27 28
Day of Admission
Sef
l Pay
, Med
icar
e, P
rivat
e
0
500
1,000
1,500
2,000
2,500
Med
i-Cal
, Cou
nty
Indi
gent
Private
Self Pay
Medicare
County Indigent
Medi-Cal

Figure 8: Proportion of Patients With Cocaine, Heroin or Amphetamine Admission Leaving the Hospital For Home
0
0.05
0.1
0.15
0.2
0.25
1 2 3 4 5 6 7 8 9 10 11 12 13 14 15 16 17 18 19 20 21 22 23 24 25 26 27 28 29 30 31
Day of Discharge
Pro
port
ion
of P
atie
nts
Exi
ting
Ho
spita
l
0
0.02
0.04
0.06
0.08
0.1
0.12
Pro
port
ion
of W
elfa
re a
nd
Non
Wel
fare
Non
SS
I A
dm
issi
on E
xitin
g H
osp
ital
Welfare
SSI
Not on SSI or Welfare

Figure 9: Proportion of Patients Not Receiving Welfare or SSI With Cocaine, Heroin or Amphetamine Admission Leaving the Hospital For Home
0
0.02
0.04
0.06
0.08
0.1
0.12
0.14
0.16
1 2 3 4 5 6 7 8 9 10 11 12 13 14 15 16 17 18 19 20 21 22 23 24 25 26 27 28 29 30 31
Day of Discharge
Pro
port
ion
of P
atie
nts
Exi
ting
Hos
pita
l
Medicare
Medi-Cal
Self Pay
Private
County Indigent

Figure 10: Proportion of Patients With Cocaine, Heroin or Amphetamine Admission Leaving the Hospital Against Medical Advice
0
0.005
0.01
0.015
0.02
0.025
1 2 3 4 5 6 7 8 9 10 11 12 13 14 15 16 17 18 19 20 21 22 23 24 25 26 27 28 29 30 31
Day of Discharge
Pro
port
ion
of P
atie
nts
Exi
ting
Hos
pita
l Aga
inst
Med
ical
Adv
ice
SSI
Welfare
Not on SSI or Welfare

Figure 11: Proportion of Patients Not Receiving Welfare or SSI With Cocaine, Heroin or Amphetamine Admission Leaving the Hospital For Home Against Medical Advice
0
0.005
0.01
0.015
0.02
0.025
1 2 3 4 5 6 7 8 9 10 11 12 13 14 15 16 17 18 19 20 21 22 23 24 25 26 27 28 29 30 31
Day of Discharge
Pro
port
ion
of P
atie
nts
Exi
ting
Hos
pita
l Aga
inst
Med
ical
Adv
ice
Medicare
Medi-Cal
Self Pay
Private
County Indigent

Programs and the cycles in admissions
• Welfare has only a very weak cycle in admissions• Very strong cycle in admissions for SSI recipients
particularly for illicit drugs• Indirect evidence of a cycle for people receiving DI
– Can identify likely DI recipients because they are Medicare recipients under 65.
– Cycle in admissions– Peak in exits on the third
• The overall cycle appears to be due largely to SSI and DI• Peoples exit patterns particularly AMA patterns are
consistent with them heading home to pick up their checks.

WILL ALTERNATE DISBURSAL SCHEMES REDUCE CYCLE?
• Hospital Emergency Rooms in California are crowded
• Many of the ER resources are fixed
• Cyclical crowding is bad
• Will smoothing the check disbursal smooth the cycle

(LA Pre vs. Post Analysis -- Notes to ourselves)
• Keep in mind that this analysis is for a population (welfare) that doesn’t show much of a cycle anyway
• We do 3 ways: raw means, regression adjusted, and testing it statistically
• Basic conclusion: – Cycle: see pretty convincing shift of cycle for drugs, but
only slightly for alcohol or other non-drug conditions– Levels: highly confounded w/ other changes from welfare
reform so we cannot isolate the effect• Not surprising: Policy does not change “fat wallet” at the
individual level

Empirical Evidence on Alternative Disbursement
Regimes • Los Angeles county disbursement of AFDC/TANF
– Pre June 1997: Day 1– Post June 1997: Staggered Days 1-10 based on case number
(recipients could pick up at issuance outlet after designated day)
– Effect: • Individuals still have “fat wallets”, but everybody doesn’t have them at
the same time
• DI changed in May 1997– Post may 1997 new recipients instead of getting on the third
of the month get second third or fourth weds depending on day of birth
• Questions– Does aggregate cycle change?– (Recall: welfare recipients show relatively small cycle)

Pre vs Post June 1997Drug Mentions - Means
Admissions with Drug MentionWelfare Recipients in Los Angeles County
Pre vs Post Shift from Day 1 to Days 1-10 Disbursement
1.23
1.73
2.23
2.73
3.23
3.73
4.23
4.73
5.23
1 2 3 4 5 6 7 8 9 10 11 12 13 14 15 16 17 18 19 20 21 22 23 24 25 26 27 28 29 30 31
Day of Month
Mea
n A
dm
issi
on
s D
ay 1
0
0.5
1
1.5
2
2.5
3
3.5
4
Mea
n A
dm
issi
on
s D
ays
1-10
Day 1
Days 1-10
Poly. (Day 1)
Poly. (Days 1-10)
Note: Vertical axes are shifted by difference in mean
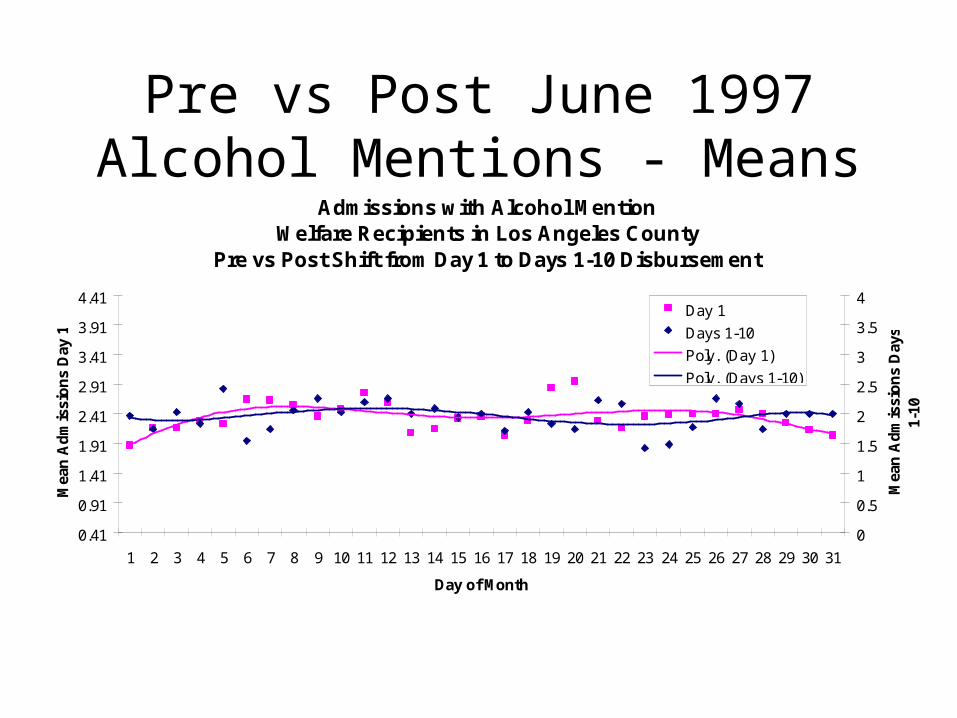
Pre vs Post June 1997Alcohol Mentions - Means
Admissions with Alcohol MentionWelfare Recipients in Los Angeles County
Pre vs Post Shift from Day 1 to Days 1-10 Disbursement
0.41
0.91
1.41
1.91
2.41
2.91
3.41
3.91
4.41
1 2 3 4 5 6 7 8 9 10 11 12 13 14 15 16 17 18 19 20 21 22 23 24 25 26 27 28 29 30 31
Day of Month
Mea
n A
dm
issi
on
s D
ay 1
0
0.5
1
1.5
2
2.5
3
3.5
4
Mea
n A
dm
issi
on
s D
ays
1-10
Day 1
Days 1-10
Poly. (Day 1)
Poly. (Days 1-10)
Note: Vertical axes are shifted by difference in mean
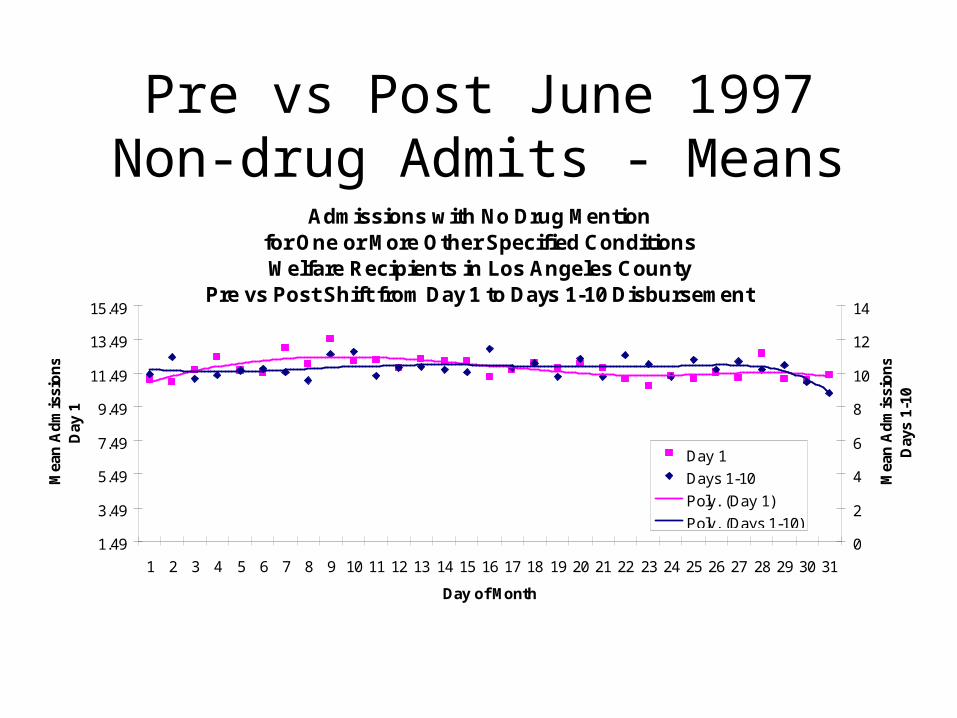
Pre vs Post June 1997Non-drug Admits - Means
Admissions with No Drug Mentionfor One or More Other Specified ConditionsWelfare Recipients in Los Angeles County
Pre vs Post Shift from Day 1 to Days 1-10 Disbursement
1.49
3.49
5.49
7.49
9.49
11.49
13.49
15.49
1 2 3 4 5 6 7 8 9 10 11 12 13 14 15 16 17 18 19 20 21 22 23 24 25 26 27 28 29 30 31
Day of Month
Mea
n A
dm
issi
on
s D
ay 1
0
2
4
6
8
10
12
14
Mea
n A
dm
issi
on
s D
ays
1-10
Day 1
Days 1-10
Poly. (Day 1)
Poly. (Days 1-10)
Other conditions are pneumonia, bronchitis, diabetes, asthma and stroke. Note: Vertical axes are shifted by difference in mean

Statistical Test

Notes to Us– “treatment effect of SSI”• there is a 5 month waiting period from time of disability to eligibility to receive benefits
(although this can be waived and we don’t know if an individual get’s it waived – do we know % that get waived??)
• we can see individuals about to go on SSI who were previously on another medical program (2 largest are non-cash disability for the medically needs and TANF cash assistance) and those who just went on SSI – arguably these people are similar in the window of time around the transition (although those just on may be a little worse off)
• 2 definitions of “Just Went On” and “About To Go On”1 month window• Just went on = SSI this month, non-SSI (but medical) last month• About to go on == no SSI this month (but some medical), SSI next month• ??any worry about the length of stay or timing of exactly when become eligible??2 month window» just went on == recipients who are eligible in the current month and the previous month, but
not 2 months ago» about to go on == patients who are not currently on SSI (but are on some other Medical
program in our dataset), will not be on next month, but are eligible for SSI in the 2nd following month (we do this due to length of stay issues crossing over into next month)
• we test for the effect on both the cycle and level of treating these people with SSI cash aide• Caveat: this is a small sample (estimating level effect off of 2738 admits for the 1 week
window and 2259 admits for the 2 week window)
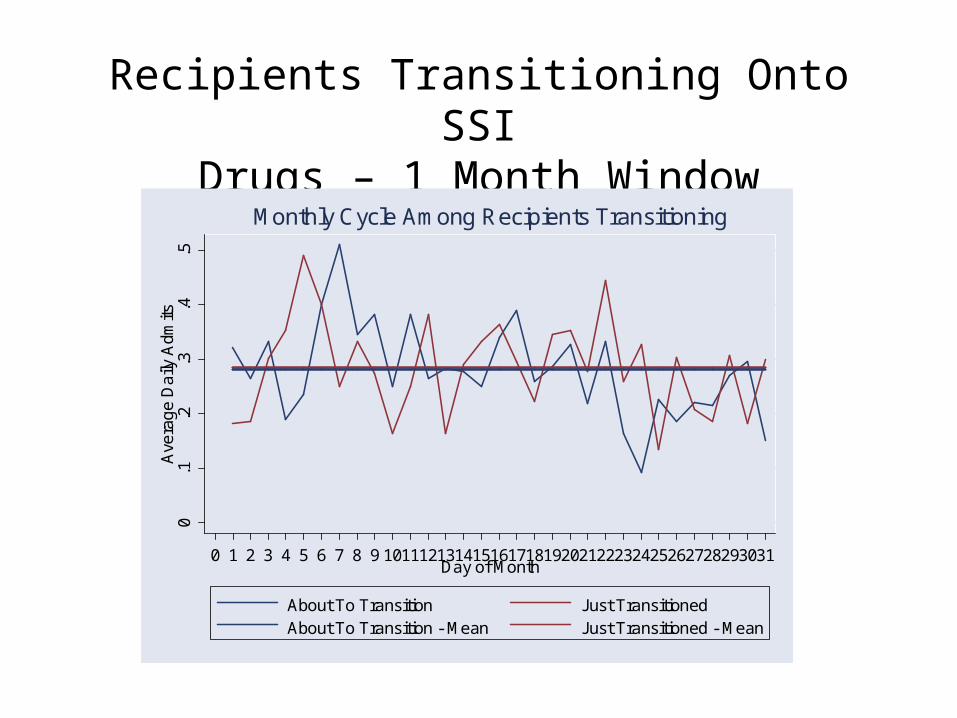
Recipients Transitioning Onto SSIDrugs – 1 Month Window
0.1
.2.3
.4.5
Ave
rag
e D
aily
Adm
its
0 1 2 3 4 5 6 7 8 9 10111213141516171819202122232425262728293031Day of Month
About To Transition Just TransitionedAbout To Transition - Mean Just Transitioned - Mean
Monthly Cycle Among Recipients Transitioning

Recipients Transitioning Onto SSIDrugs – 2 Month Window
0.1
.2.3
.4.5
Ave
rag
e D
aily
Adm
its
0 1 2 3 4 5 6 7 8 9 10111213141516171819202122232425262728293031Day of Month
About To Transition Just TransitionedAbout To Transition - Mean Just Transitioned - Mean
Monthly Cycle Among Recipients Transitioning

Simulated Effect on Aggregate Drug Cycle of Disbursing SSI, SSDI and Welfare
with a Day1-10 Scheme
• Assume– Cycles for certain subpopulations entirely driven by timing of aide
disbursement– Consumption pattern independent across groups (no “agglomeration
economies” to consumption)
• Simulate Aggregate cycle– Take observed cycle (from single day disbursement) & simulate the
cycle if• 1/10th of recipients = day 1, 1/10th=day 2, …, 1/10th = day 10
– SSI: from Day 1 to Days 1-10– SSDI (proxied by Medicare): from Day 3 to Days 1-10– Welfare outside LA post 97: Day 1 to Days 1-10– Welfare in LA post 97: keep the same observed cycle– All others (employed, UI, others) keep the same

Simulated Monthly Drug Cycle When SSI, SSDI, and Welfare Are Disbursed Days 1-10
0
50
100
150
200
250
1 2 3 4 5 6 7 8 9 10 11 12 13 14 15 16 17 18 19 20 21 22 23 24 25 26 27 28 29 30 31
Day of Month
Dru
g A
dm
issi
on
s
Actual
Day 1-10 For SSI, SSDI, Welfare

INCLUDE RESULTS FROM LOOKING AT DI

SUM UP THE GAINS FROM SWITCHING REGIMES
• Smoother welfare admissions despite the fact that welfare is pretty flat
• If similar change in disbursement in all programs occurred for all programs you would expect a big effect

ALSO

Effect of Disbursement Change on Levels?• We have seen compelling evidence that Welfare, SSI
and DI cause a cycle in admissions• People take this as proof that government transfers
also significantly change the number of admissions• Two approaches
– County level changes in loads• Abrupt Change in SSI due to Federal Law
• Long term reduction in welfare loads• Of Unknown origin ie panel approach
– Micro Analysis (note less compelling)• Look at people going onto welfare
• Look at people going onto SSI

REGRESSSION RESULTS CROSS-SECTION AND PANEL

REGRESSION RESULTS ON SPIKE

CASE STUDY OF SSI CHANGE CHANGE IN SPIKE

Counts of Recipients of SSI and Welfare
0
100,000
200,000
300,000
400,000
500,000
600,000
700,000
800,000
1994
-01
1994
-04
1994
-07
1994
-10
1995
-01
1995
-04
1995
-07
1995
-10
1996
-01
1996
-04
1996
-07
1996
-10
1997
-01
1997
-04
1997
-07
1997
-10
1998
-01
1998
-04
1998
-07
1998
-10
1999
-01
1999
-04
1999
-07
1999
-10
2000
-01
2000
-04
2000
-07
2000
-10
Month
SS
I Age
d, B
lind
and
Dis
able
d
0
500,000
1,000,000
1,500,000
2,000,000
2,500,000
3,000,000
Wel
fare
SSI Aged
SSI Blind
SSI Disability
Welfare

POINT OUT HUDE DECLINE IN WELFARE NO PERCEVABLE
DECLINE IN DRUG ADMISSIONS RATES
TS Counts of admissions overall and by SSI, Welfare and NON SSI NON
WELFARE

CHANGE IN LEVELS

MICRO ANALYSIS LOOK AT PEOPLE TRANSITIONING ONTO
PROGRAM
SUM UP RESULTS DOES IT CHANCE CYCLES DOES IT
CHANGE LEVELS

CONCLUSIONS
• Which program drive spike
• Can smooth spike
• Levels harder to reduce


OLD STUFF

What we
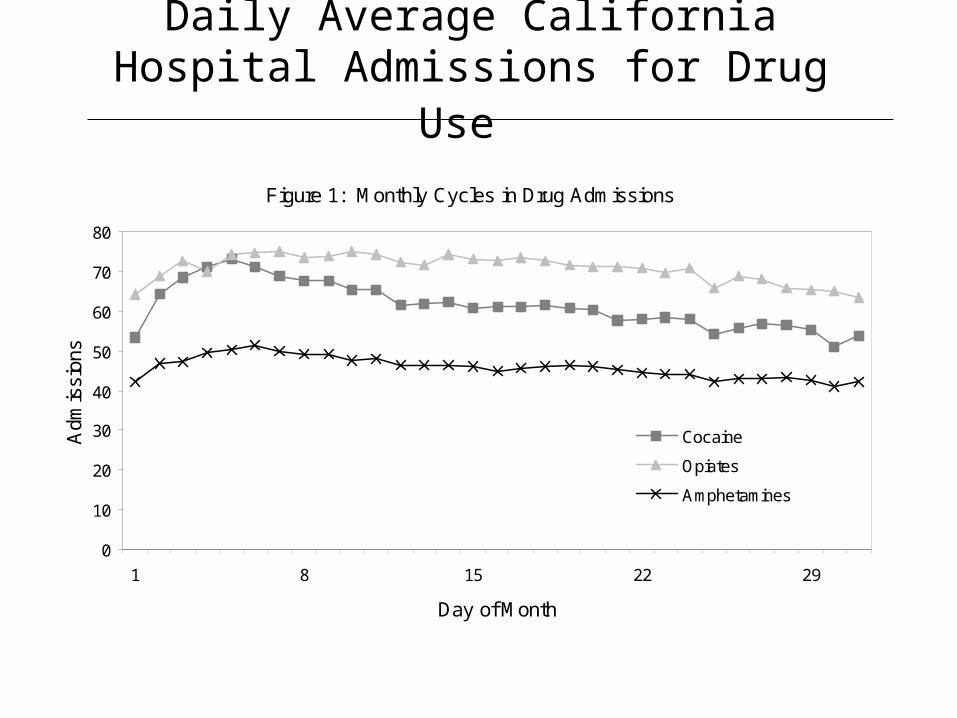
Daily Average California Hospital Admissions for Drug Use
Figure 1: Monthly Cycles in Drug Admissions
0
10
20
30
40
50
60
70
80
1 8 15 22 29
Day of Month
Adm
issi
ons
Cocaine
Opiates
Amphetamines

Cycles in Injuries & Violence?

Cycles in Other Admissions?

Cycles in Leaves Against Medical Advice

Research Design

Data

Drug Admission by Cash Aide TypeRegression Context
A d m its D ay o fM o n th D u m , D ay o fW eek D u m M o n th D u m , Y earD u m
H o lid ay D u mt t t t t
t
f
t
( , ,
, )First cut = linear. Later = count data model

Exploiting County-Level Variation in Disbursement
– 1997: LA switched AFDC/CalWORKs disbursement from Day 1 to staggered over first 10 days

Individual Level Analysis • Ideal experiment:
– Randomly assign aide receipt day 1, day2, …and compare patterns of admission
• Pseudo-experiment: – Some counties disburse based on last digit of
case #Estimate
Pr(admission) = f(days since receipt, days since first of month,…)
• Data available?

Policy Implications • 15-20% of welfare recipients self-report to
drug use, with one-fifth of those dependent (Pollack et al., 2002)
• Average charge per admit: $xx,xxx• Possibly smooth cycle or reduce levels of
substance use with:– Smoothing disbursal (debit cards)– Substitute in-kind for cash aide
• Even if consumption/admits don’t decrease:– Smooth hospital caseloads or policing activities

Extra Slides
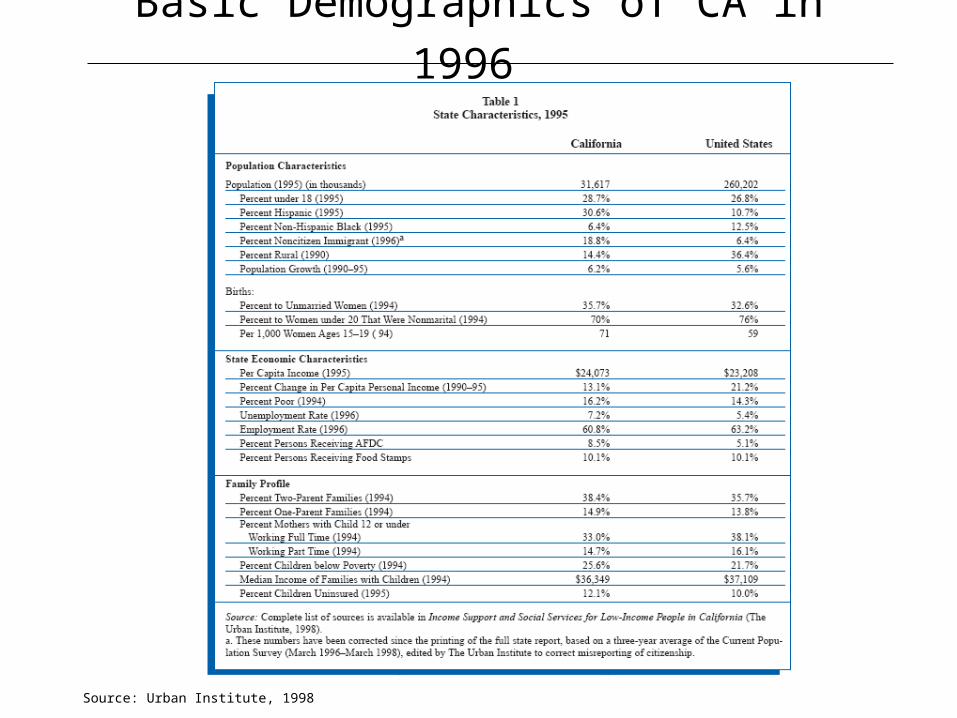
Basic Demographics of CA in 1996
Source: Urban Institute, 1998

Pattern By Day of Week