case study-tom tsee_eh
TRANSCRIPT

Tom Tsee
October, 2014
PROJECT DUTY LBO Investment Analysis
An independent LBO investment assessment by industry, firm’s operation, and uncertain risks.
Table of Contents
Portable Toilet Rental & Septic Tank Cleaning Industry ............................................................... 2
Market Position ............................................................................................................................... 6
Revenue, Expense, EBITDA, CAPEX and Return Rate ................................................................ 6
Uncertain Risks – Oil Production and Customer Concentration .................................................... 9
Appendix: LBO Model
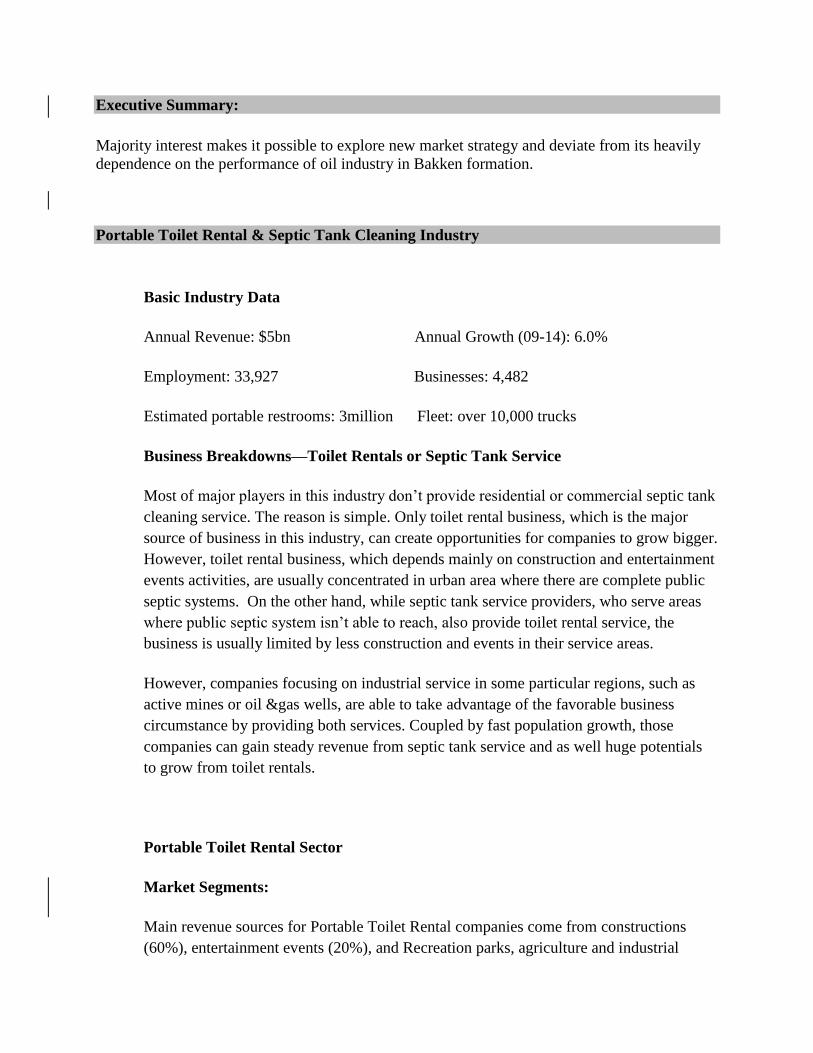
Executive Summary:
Majority interest makes it possible to explore new market strategy and deviate from its heavily
dependence on the performance of oil industry in Bakken formation.
Portable Toilet Rental & Septic Tank Cleaning Industry
Basic Industry Data
Annual Revenue: $5bn Annual Growth (09-14): 6.0%
Employment: 33,927 Businesses: 4,482
Estimated portable restrooms: 3million Fleet: over 10,000 trucks
Business Breakdowns—Toilet Rentals or Septic Tank Service
Most of major players in this industry don’t provide residential or commercial septic tank
cleaning service. The reason is simple. Only toilet rental business, which is the major
source of business in this industry, can create opportunities for companies to grow bigger.
However, toilet rental business, which depends mainly on construction and entertainment
events activities, are usually concentrated in urban area where there are complete public
septic systems. On the other hand, while septic tank service providers, who serve areas
where public septic system isn’t able to reach, also provide toilet rental service, the
business is usually limited by less construction and events in their service areas.
However, companies focusing on industrial service in some particular regions, such as
active mines or oil &gas wells, are able to take advantage of the favorable business
circumstance by providing both services. Coupled by fast population growth, those
companies can gain steady revenue from septic tank service and as well huge potentials
to grow from toilet rentals.
Portable Toilet Rental Sector
Market Segments:
Main revenue sources for Portable Toilet Rental companies come from constructions
(60%), entertainment events (20%), and Recreation parks, agriculture and industrial
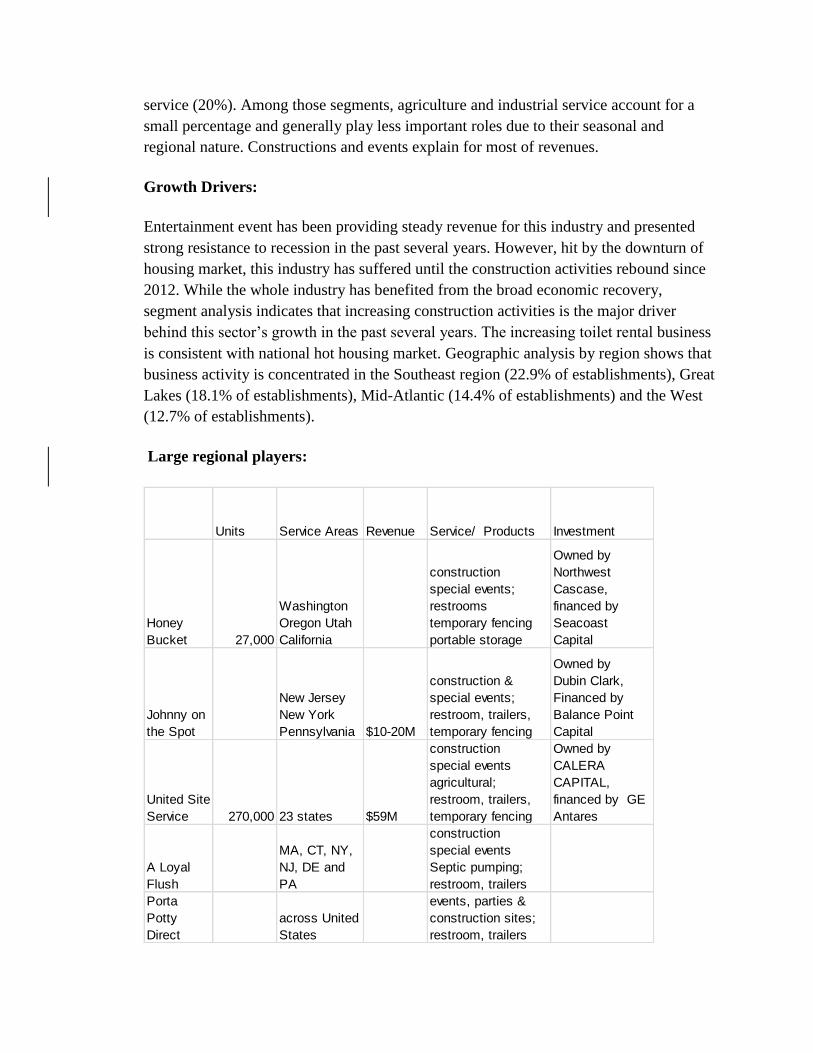
service (20%). Among those segments, agriculture and industrial service account for a
small percentage and generally play less important roles due to their seasonal and
regional nature. Constructions and events explain for most of revenues.
Growth Drivers:
Entertainment event has been providing steady revenue for this industry and presented
strong resistance to recession in the past several years. However, hit by the downturn of
housing market, this industry has suffered until the construction activities rebound since
2012. While the whole industry has benefited from the broad economic recovery,
segment analysis indicates that increasing construction activities is the major driver
behind this sector’s growth in the past several years. The increasing toilet rental business
is consistent with national hot housing market. Geographic analysis by region shows that
business activity is concentrated in the Southeast region (22.9% of establishments), Great
Lakes (18.1% of establishments), Mid-Atlantic (14.4% of establishments) and the West
(12.7% of establishments).
Large regional players:
Units Service Areas Revenue Service/ Products Investment
Honey
Bucket 27,000
Washington
Oregon Utah
California
construction
special events;
restrooms
temporary fencing
portable storage
Owned by
Northwest
Cascase,
financed by
Seacoast
Capital
Johnny on
the Spot
New Jersey
New York
Pennsylvania $10-20M
construction &
special events;
restroom, trailers,
temporary fencing
Owned by
Dubin Clark,
Financed by
Balance Point
Capital
United Site
Service 270,000 23 states $59M
construction
special events
agricultural;
restroom, trailers,
temporary fencing
Owned by
CALERA
CAPITAL,
financed by GE
Antares
A Loyal
Flush
MA, CT, NY,
NJ, DE and
PA
construction
special events
Septic pumping;
restroom, trailers
Porta
Potty
Direct
across United
States
events, parties &
construction sites;
restroom, trailers
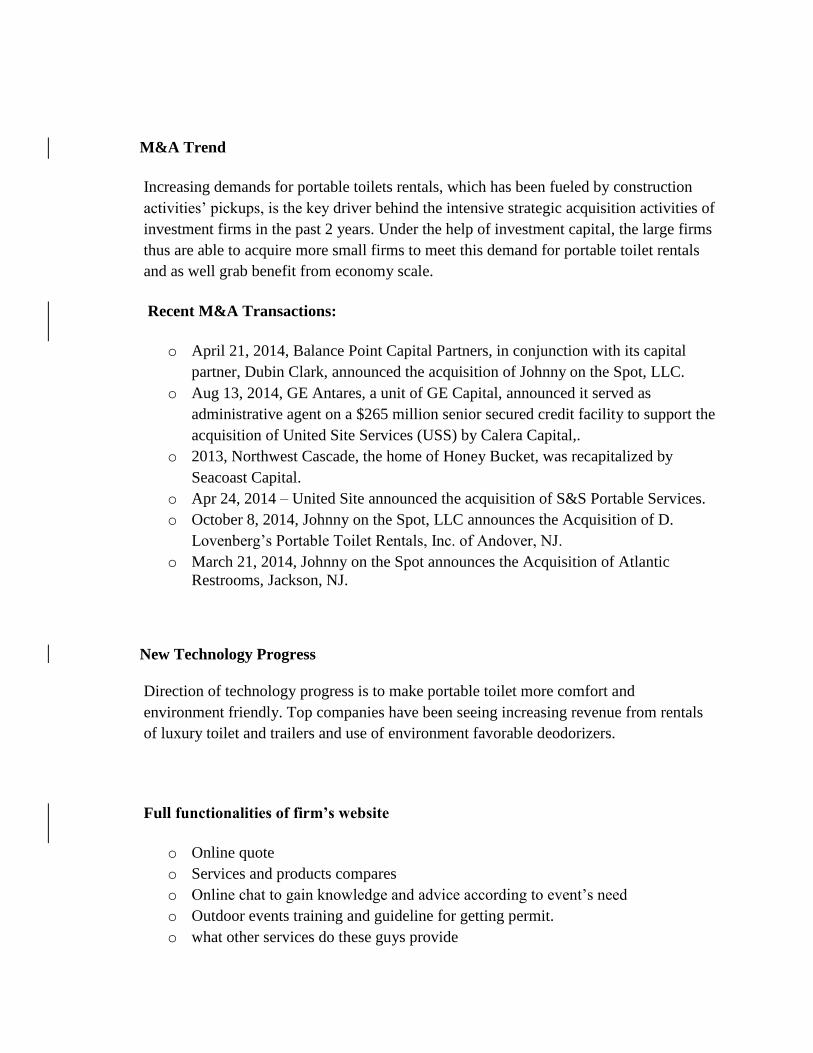
M&A Trend
Increasing demands for portable toilets rentals, which has been fueled by construction
activities’ pickups, is the key driver behind the intensive strategic acquisition activities of
investment firms in the past 2 years. Under the help of investment capital, the large firms
thus are able to acquire more small firms to meet this demand for portable toilet rentals
and as well grab benefit from economy scale.
Recent M&A Transactions:
o April 21, 2014, Balance Point Capital Partners, in conjunction with its capital
partner, Dubin Clark, announced the acquisition of Johnny on the Spot, LLC.
o Aug 13, 2014, GE Antares, a unit of GE Capital, announced it served as
administrative agent on a $265 million senior secured credit facility to support the
acquisition of United Site Services (USS) by Calera Capital,.
o 2013, Northwest Cascade, the home of Honey Bucket, was recapitalized by
Seacoast Capital.
o Apr 24, 2014 – United Site announced the acquisition of S&S Portable Services.
o October 8, 2014, Johnny on the Spot, LLC announces the Acquisition of D.
Lovenberg’s Portable Toilet Rentals, Inc. of Andover, NJ.
o March 21, 2014, Johnny on the Spot announces the Acquisition of Atlantic
Restrooms, Jackson, NJ.
New Technology Progress
Direction of technology progress is to make portable toilet more comfort and
environment friendly. Top companies have been seeing increasing revenue from rentals
of luxury toilet and trailers and use of environment favorable deodorizers.
Full functionalities of firm’s website
o Online quote
o Services and products compares
o Online chat to gain knowledge and advice according to event’s need
o Outdoor events training and guideline for getting permit.
o what other services do these guys provide
o other interesting things
Operating and Pricing
Pricing varies depending on locations:
o Events ( take an example of United Site Service, New York)
$196+tax/unit per week (one week minimum) ($10 more in San Francisco)
Service every 4-5 hours/100 persons
At least one week notice in advance
o Events ( take an example of Honey Bucket)
$103+tax/unit per week (one week minimum) (Berkeley, California)
o Construction site ( take an example of Johnny On the Spot, New York)
$296+tax for first 8 weeks and daily charge at same rate after 8 weeks
Service once a week
One day notice delivery
Portable Sanitation Association International
http://psai.uberflip.com/i/125265/96.
List of the member companies/Advertisement from companies who want to market
products to portable toilet rental companies
Septic Tank Cleaning Sector
Industry growth has been supported by steady demand from government for waste-
holding and drain-cleaning services.
Businesses tend to locate near regions with a high proportion of households that were
built with septic tank systems.
Due to the limit of economy scale, there is no company dominating in this sector.
Market Position ---benefiting from both segments of toilet rental and septic tank cleaning
businesses
This specific sector of market in this industry is located traditionally in the segment of
industrial service (as mentioned above). The companies in this segment provide portable
toilet rentals service to meet demand from work sites of wells. However, due to unusually
fast growth of population fueled by oil development activities in some of those areas,
highly concentred population created tremendous business opportunities for septic tank
service. In addition, growth of population also stimulated housing activities in small cities
around wells and thus provided opportunities for those local companies to gain extra
business from portable toilet rentals.
Revenue, Expense, EBITDA, CAPEX and Return Rate
Revenue
Continuing oil boom in North Dakota
It is true that North Dakota oil boom starting from 2008 has been accompanied with a
period when the oil price stays at high level. However, the lowered oil exploration cost
resulted from new technology has played significant role. While we are not able to know
where the oil price goes, there is a significant buffer for the price to go down before it
freezes new drilling activities in this area. At the same time, while hot money behind high
oil price may leave as economy recovery is getting faster, the stronger economy will still
become a support for price of oil.
Analysis of Source of Revenue (see chart)
All “other clients” actually contributed almost all growth in revenue between 2011 and
2014 (except for 2013, an outlier). This fact reflects that a strong demand in PROJECT
DUTY serving area has been existing, which will be supported by strong population
growth resulting from new drilling activities. None of “other clients” constantly occupies
the list of top 10. This highly diversified distribution avoids firm-specific risk.

While Customer 1, PROJECT DUTY’s biggest client, will also benefit from strong
workforce growth in that area, there is firm-specific risk for this company.
2011 2012 2013 2014 1stH
Total revenue $2.9MM $4,6MM $6.2MM $2.7MM
Customer 1 $2.1MM (72%) $2.1MM (45.5%) >$3.1MM (50%) $1.2MM (44%)
Others $0.8MM $2.5MM $3.1MM $1.5MM
Customer 1’ potential issue and the worst case.
Customer 1 provided constant revenue of $2.1MM or more annually. This may be a result
that most of Customer 1 sales come from its facility in Tioga, Williams County, North
Dakota. However, this company is facing uncertain changes in government policy, the so
called “Man Camp” controversial issue. According to Wikipedia, “the Williams County
Planning and Zoning Commission recommended that the county refrain from both
issuing permits for new workforce housing and allowing existing facilities to expand”.
This may mean that Customer 1 will probably lose business as workers move into other
alternative housing.
Conservative estimate
In this case, the controversy involved with “Man Camps" doesn’t go against Customer 1.
And Demands from PROJECT DUTY’s other small clients are still strong, thanks to its
reputation and local economy. However, limited by market size in Minot area, revenue
will be only able to keep its current level or a moderate growth.
Optimistic estimate
Benefited from Buyer’s input in marketing and sales, or from the strengthened pricing
strategy and optimised routing, PROJECT DUTY successfully increases its revenue from
long distance clients of oil area. PROJECT DUTY should be able to aim at annual 10%
increase in revenue from new clients.
Expense
Model (excel file attached) built summarized breakdown of variable expense and fixed
expense, based on data of 2012 and 2013 1st H, which I think, after tests, best
demonstrate the expense distribution at current revenue construction.
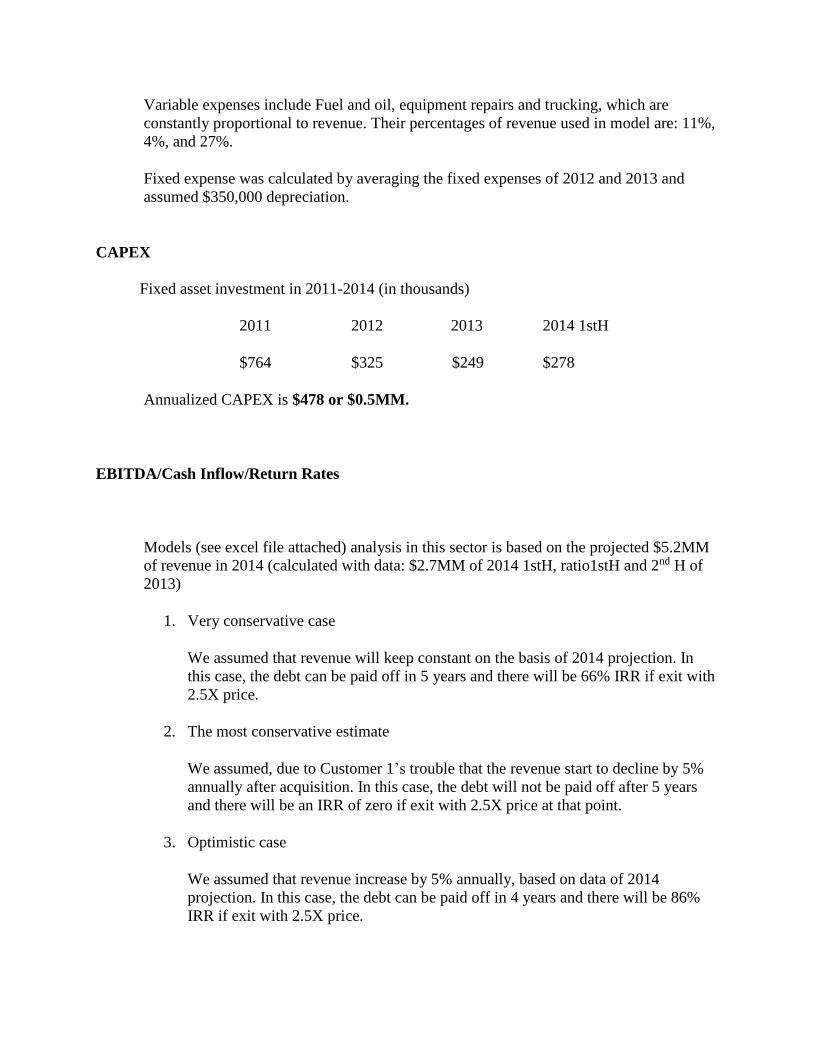
Variable expenses include Fuel and oil, equipment repairs and trucking, which are
constantly proportional to revenue. Their percentages of revenue used in model are: 11%,
4%, and 27%.
Fixed expense was calculated by averaging the fixed expenses of 2012 and 2013 and
assumed $350,000 depreciation.
CAPEX
Fixed asset investment in 2011-2014 (in thousands)
2011 2012 2013 2014 1stH
$764 $325 $249 $278
Annualized CAPEX is $478 or $0.5MM.
EBITDA/Cash Inflow/Return Rates
Models (see excel file attached) analysis in this sector is based on the projected $5.2MM
of revenue in 2014 (calculated with data: $2.7MM of 2014 1stH, ratio1stH and 2nd H of
2013)
1. Very conservative case
We assumed that revenue will keep constant on the basis of 2014 projection. In
this case, the debt can be paid off in 5 years and there will be 66% IRR if exit with
2.5X price.
2. The most conservative estimate
We assumed, due to Customer 1’s trouble that the revenue start to decline by 5%
annually after acquisition. In this case, the debt will not be paid off after 5 years
and there will be an IRR of zero if exit with 2.5X price at that point.
3. Optimistic case
We assumed that revenue increase by 5% annually, based on data of 2014
projection. In this case, the debt can be paid off in 4 years and there will be 86%
IRR if exit with 2.5X price.
Uncertain Risks – Oil Production and Customer Concentration
Analysis of oil production activities in Bakken formation
How long oil boom will last depends on two factors: 1. Recoverable amount of oil in oil
resource 2. Price of oil and exploration cost. Data provided by the following research
reports indicate that estimated amount of technically recoverable oil in Bakken formation
of North Dakota increase from 3.0to 4.3 billion barrels of 2008 to 7.4 billion barrels of
2013. An analysis by comparing historical price of oil and chart of production of oil in
Bakken of North Dakota indicate that oil production has increased strongly in period of
2008 to 2013 when the oil price fluctuated in the range of $60-$100 per barrel. It means
the breakeven point for oil production should be below $60 per barrel, which leave a
large buffering space considering that the current price is around $90/barrel.
Source: Wikipedia

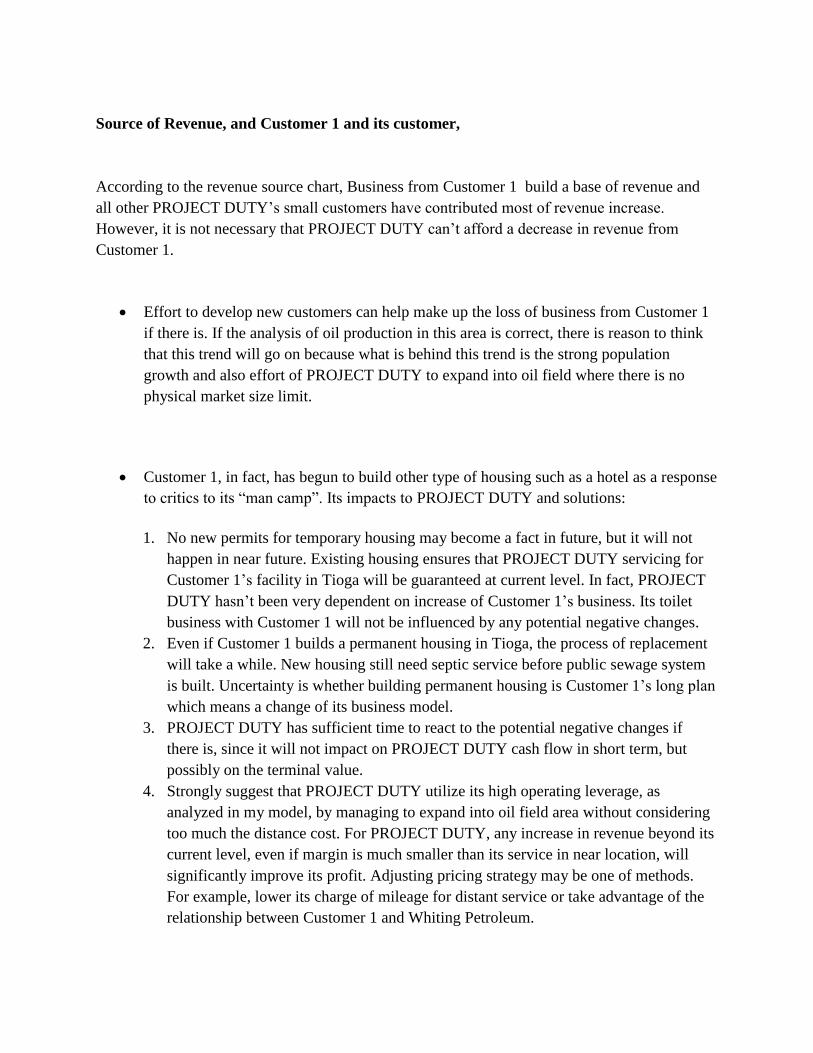
Source of Revenue, and Customer 1 and its customer,
According to the revenue source chart, Business from Customer 1 build a base of revenue and
all other PROJECT DUTY’s small customers have contributed most of revenue increase.
However, it is not necessary that PROJECT DUTY can’t afford a decrease in revenue from
Customer 1.
Effort to develop new customers can help make up the loss of business from Customer 1
if there is. If the analysis of oil production in this area is correct, there is reason to think
that this trend will go on because what is behind this trend is the strong population
growth and also effort of PROJECT DUTY to expand into oil field where there is no
physical market size limit.
Customer 1, in fact, has begun to build other type of housing such as a hotel as a response
to critics to its “man camp”. Its impacts to PROJECT DUTY and solutions:
1. No new permits for temporary housing may become a fact in future, but it will not
happen in near future. Existing housing ensures that PROJECT DUTY servicing for
Customer 1’s facility in Tioga will be guaranteed at current level. In fact, PROJECT
DUTY hasn’t been very dependent on increase of Customer 1’s business. Its toilet
business with Customer 1 will not be influenced by any potential negative changes.
2. Even if Customer 1 builds a permanent housing in Tioga, the process of replacement
will take a while. New housing still need septic service before public sewage system
is built. Uncertainty is whether building permanent housing is Customer 1’s long plan
which means a change of its business model.
3. PROJECT DUTY has sufficient time to react to the potential negative changes if
there is, since it will not impact on PROJECT DUTY cash flow in short term, but
possibly on the terminal value.
4. Strongly suggest that PROJECT DUTY utilize its high operating leverage, as
analyzed in my model, by managing to expand into oil field area without considering
too much the distance cost. For PROJECT DUTY, any increase in revenue beyond its
current level, even if margin is much smaller than its service in near location, will
significantly improve its profit. Adjusting pricing strategy may be one of methods.
For example, lower its charge of mileage for distant service or take advantage of the
relationship between Customer 1 and Whiting Petroleum.
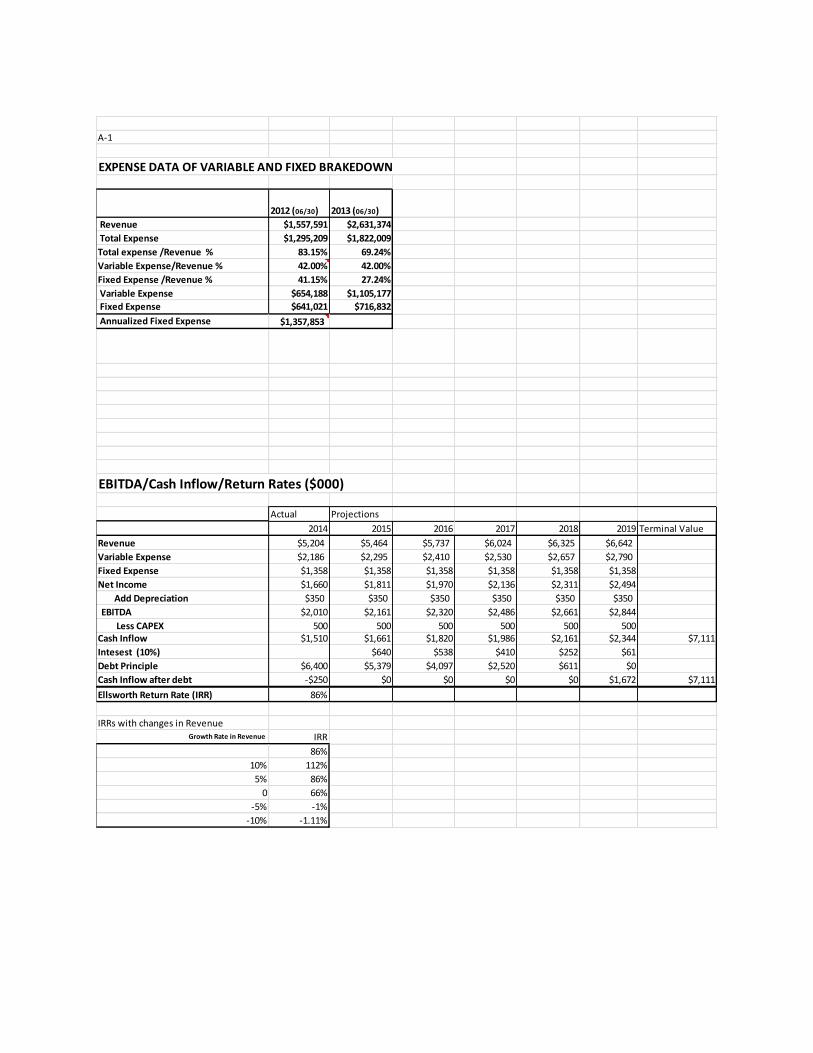
A-1
EXPENSE DATA OF VARIABLE AND FIXED BRAKEDOWN
2012 (06/30) 2013 (06/30)
Revenue $1,557,591 $2,631,374
Total Expense $1,295,209 $1,822,009
Total expense /Revenue % 83.15% 69.24%
Variable Expense/Revenue % 42.00% 42.00%
Fixed Expense /Revenue % 41.15% 27.24%
Variable Expense $654,188 $1,105,177
Fixed Expense $641,021 $716,832
Annualized Fixed Expense $1,357,853
EBITDA/Cash Inflow/Return Rates ($000)
Actual Projections
2014 2015 2016 2017 2018 2019 Terminal Value
Revenue $5,204 $5,464 $5,737 $6,024 $6,325 $6,642
Variable Expense $2,186 $2,295 $2,410 $2,530 $2,657 $2,790
Fixed Expense $1,358 $1,358 $1,358 $1,358 $1,358 $1,358
Net Income $1,660 $1,811 $1,970 $2,136 $2,311 $2,494
Add Depreciation $350 $350 $350 $350 $350 $350
EBITDA $2,010 $2,161 $2,320 $2,486 $2,661 $2,844
Less CAPEX 500 500 500 500 500 500Cash Inflow $1,510 $1,661 $1,820 $1,986 $2,161 $2,344 $7,111
Intesest (10%) $640 $538 $410 $252 $61
Debt Principle $6,400 $5,379 $4,097 $2,520 $611 $0
Cash Inflow after debt -$250 $0 $0 $0 $0 $1,672 $7,111
Ellsworth Return Rate (IRR) 86%
IRRs with changes in Revenue Growth Rate in Revenue IRR
86%
10% 112%
5% 86%
0 66%
-5% -1%
-10% -1.11%