case study pierce county wa lidar acquisition...
TRANSCRIPT

Case Study
Pierce County WA LIDAR Acquisition and Quality Control Procedures using LP360 LP360, versions 2014.1 and above
l
LP360 Basic Edition ArcGIS
Page 1 of 15
QCoherent Software LLC
LP360 Standard Edition Windows www.LP360.com
LP360 sUAS Edition GeoCue 256-461-8289 (phone)
LP360 Advanced Edition 256-461-8249 (fax)
Ross Heasty, Pierce County WA
August 12, 2012
Revision 1.0
Introduction
Pierce County, Washington has used LIDAR data since 2004 as a mission critical component of the County’s Geographic Information System (GIS). The data, collected from 2000 to 2004, has been used for a variety of purposes, including economic development, environmental planning, construction and transportation projects, and emergency management. However, this data was collected with older technology under outdated standards. Much of the original data was not accepted by the U.S. Geological Survey (USGS) for the National Elevation Dataset due to its poor quality. As such, the 2011-2012 project acquired new airborne LIDAR data to provide a high quality dataset for use by regional partners and the general public.
The County has been conducting and managing orthophotography surveys since 1989 and has managed LIDAR updates since 2004.
Project Area
Located in the west central portion of Washington State, Pierce County has a unique topographic profile that ranges from sea level at Puget Sound to 14,411 feet at the peak of Mt. Rainier. The county has over 225 miles of coastal shoreline and includes Anderson Island, McNeil Island, Fox Island, and portions of the Kitsap Peninsula. Four major rivers (Puyallup, Nisqually, White, and Carbon), several smaller tributaries, and over 361 lakes provide a wealth of recreational activities for residents and tourists.
The county's total land area is 1,794 square miles, with over 38% of it controlled by State and Federal governments. There are 22 cities and towns within county boundaries. As of 2010, the total population was 795,225, making Pierce County the second most populous county in Washington State.
The LIDAR collection area covered 1,693 sq. mi. and encompassed all of Pierce County except Mt. Rainier National Park, Fort Lewis Army Base, and McChord Air Force Base. These Federal lands were excluded due to recent LIDAR collection in their respective areas. The collection area also included Puyallup tribal lands and portions of the Muckleshoot and Nisqually reservations.
Economic Benefits
Emergency Management - LIDAR is used to update hazard mitigation plans for both natural and manmade disasters. 2D and 3D models are used to assess hazards and develop evacuation plans and first responder emergency routes. These plans will greatly reduce the loss of life and property.
Floodplain Mapping – LIDAR is used to update the Pierce County Flood Hazard Management Plan to address public safety issues, reduce property losses, protect fish and wildlife habitat, and increase cost efficiencies. County floodplain information is also provided to the Federal Emergency Management Agency for updating Flood Insurance Rate Maps.

Case Study
Pierce County WA LIDAR Acquisition and Quality Control Procedures using LP360
Ross Heasty, Pierce County WA Page 2 of 15 QCoherent Software LLC August 12, 2012 www.LP360.com
Natural Resource Management – Forestry agencies and timber industries use LIDAR to calculate biomass, timber volumes, and tree-stand heights to promote more cost- efficient forest management practices while still protecting the County's natural resources.
Urban Planning & Economic Development – Cities, community planning partners, and economic development departments will develop and use 3D models from bare-earth and reflective-surface LIDAR data for urban planning, construction projects, growth management analysis, and permit regulation.
Transportation and Utility Planning - LIDAR will supplement orthophotography and ground surveys to support several transportation and utility improvement projects throughout the county.
Base Mapping – Along with providing digital elevation models and the elevation point cloud for inclusion in the National Elevation Dataset, Pierce County is producing 2-foot elevation contours and update land use/land cover classifications and plan metric features using the LIDAR data. These datasets are included in their GIS enterprise systems, which are used by both internal and external agencies to perform their business activities more cost-efficiently.
Project Requirements
Based on "lessons learned" from prior LIDAR data collects, Pierce County developed stringent
parameters for the 2011-2012 collection. The overall LIDAR acquisition parameters are delineated below.
LIDAR Specifications
Instrument Leica ALS50 or ALS60
Field of View (Scan Angle) ≤ 30°(± 15° from Nadir)
Returns Collected Per Laser Pulse ≥ 3 returns per pulse
Multi-Swath Pulse Density ≥ 8 pulses/m2(≤1,500 feet)
Laser Footprint Diameter on Ground 20-25 cm
Intensity Range 1-255
Swath Overlap 50% side-lap (100% overlap)
Flight Line Direction Opposing
Data Completeness No voids
Maximum GPS Baseline ≤ 13 nautical miles
GPS PDOP During Acquisition ≤ 3.5
GPS Satellite Constellation ≥ 6
Vertical Accuracyz (1.96σ) for bare- earth slope < 20°
≤ 30 cm
Vertical RMSE (1σ) ≤ 15 cm
Horizontal Accuracy (1σ) ≤ 30 cm
Between-swath Reproducibility ≤ 10 cm
Range Reproducibility (within swath) ≤ 5 cm
Data Voids [areas => (4*NPS1 ) 2, measured using 1st-returns only] within a single swath are not acceptable, except:

Case Study
Pierce County WA LIDAR Acquisition and Quality Control Procedures using LP360
Ross Heasty, Pierce County WA Page 3 of 15 QCoherent Software LLC August 12, 2012 www.LP360.com
where caused by water bodies
where caused by areas of low near infra-red (NIR) reflectivity such as asphalt or composition roofing
where appropriately filled-in by another swath
Spatial Distribution: The spatial distribution of geometrically usable points is expected to be uniform and free from clustering. In order to ensure uniform densities throughout the data set:
A uniform, regular grid of 1-meter (3-feet) cell size will be laid over the data.
At least 90% of the cells in the grid shall contain at least 1 LIDAR point.
Assessment to be made against single swath, first return data located with the geometrically usable center portion (~90%) of each swath.
Acceptable data voids identified previously in this specification are excluded.
The QC Process workflow
The Quality Check (QC) process is divided in 3 major flows:
Assessing Coverage
Analyzing Data Voids
Interactive QC with LP360 for ArcGIS (a product of QCoherent Software, LLC2)
Assessing LIDAR Coverage: The following layers are created from a custom script to help QA/QC LIDAR data. They are used to determine where data voids are based on a 1-meter grid per contract specifications.
Point File Information - This tool reports basic statistics for the LAS files.
LAS to Multipoint - The LAS files are converted to a multipoint feature to be able to assess the LIDAR coverage using ArcGIS tools.
Point to Raster - The Point to Raster tool is a generic tool with many options and uses. We use the results to help visualize point density.
Is Null -This tool is used to assign a value to No Data areas in the Raster we just created so we can retrieve statistics.
Con - This tool adds the “Is Null” raster data void areas back into the raster created by the Point to Raster tool and assigns them a value. After the data voids are added back we can then attain many different statistics if needed.
Interactive QC in LP360
After determining first return void contract compliance, we use the LP360 extension in AcrGIS 10 (or 10.1) to review the delivered classified LAS files. Every LAS tile is viewed at a 1:800 scale with delivered vector files such as lake, island and river breaklines, as well as other ancillary data such as orthophotos and county streams and lake layers, to determine classification accuracy, alignment and completeness of data received. The elevation of the bare-earth hydro-flattened raster files are checked for accuracy compared to the LAS files and vector files. We also verify that hydro-flattening processes, as opposed to

Case Study
Pierce County WA LIDAR Acquisition and Quality Control Procedures using LP360
Ross Heasty, Pierce County WA Page 4 of 15 QCoherent Software LLC August 12, 2012 www.LP360.com
hydro-enforcement, are completed for the project area using visual QC methods as well as automated checks.
Verify Hydro-flattening
Once data layers are loaded make sure breaklines are displayed and verified. Breaklines make up about 11% of the total errors.
Hydro-flattening verification includes ensuring breaklines are split at road crossings, are continuous under bridges and are correctly attributed. See the figure below.
Typical Single Stream Breakline used for hydro-flattening
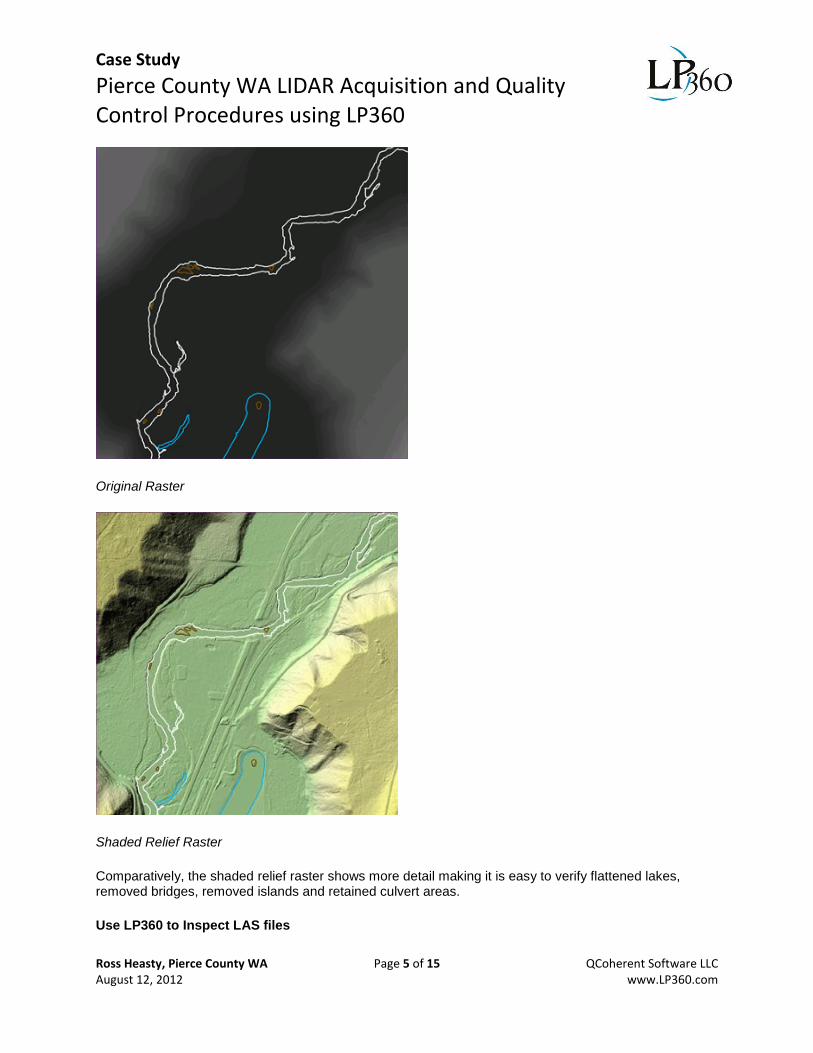
The hydro-flattened DEM rasters, while a delivery requirement, are difficult to visually QC. In order to verify that lakes have been hydro-flattened, bridges have been removed, culvert locations are included in the ground model, and elevations are correct, an image analysis process is run to create a shaded relief raster.
Case Study
Pierce County WA LIDAR Acquisition and Quality Control Procedures using LP360
Ross Heasty, Pierce County WA Page 5 of 15 QCoherent Software LLC August 12, 2012 www.LP360.com
Original Raster
Shaded Relief Raster
Comparatively, the shaded relief raster shows more detail making it is easy to verify flattened lakes, removed bridges, removed islands and retained culvert areas.
Use LP360 to Inspect LAS files

Case Study
Pierce County WA LIDAR Acquisition and Quality Control Procedures using LP360
Ross Heasty, Pierce County WA Page 6 of 15 QCoherent Software LLC August 12, 2012 www.LP360.com
There are two tools that are very useful for visually inspecting the LAS files on the LP360 Viewer Integration toolbar. The first is the Profile View, a tool that enables visualization of profiles of LIDAR tiles.
Profile View

Case Study
Pierce County WA LIDAR Acquisition and Quality Control Procedures using LP360
Ross Heasty, Pierce County WA Page 7 of 15 QCoherent Software LLC August 12, 2012 www.LP360.com
The second is a hill shade visualization display.
Hill Shade Display
Some of the common errors found in the visual QC process are depicted in the following paragraphs.

Case Study
Pierce County WA LIDAR Acquisition and Quality Control Procedures using LP360
Ross Heasty, Pierce County WA Page 8 of 15 QCoherent Software LLC August 12, 2012 www.LP360.com
Ridge Scalping: Notice the missing ground points in both the profile and 3D window along the top of the ridge (Ground in the profile view is indicated in orange).
Missing Cliff Details: Points not classified correctly along the ridge and down the cliff face.

Case Study
Pierce County WA LIDAR Acquisition and Quality Control Procedures using LP360
Ross Heasty, Pierce County WA Page 9 of 15 QCoherent Software LLC August 12, 2012 www.LP360.com
Classification Errors: Misclassified points in the trees and buildings (note the tree hits classified as ground).
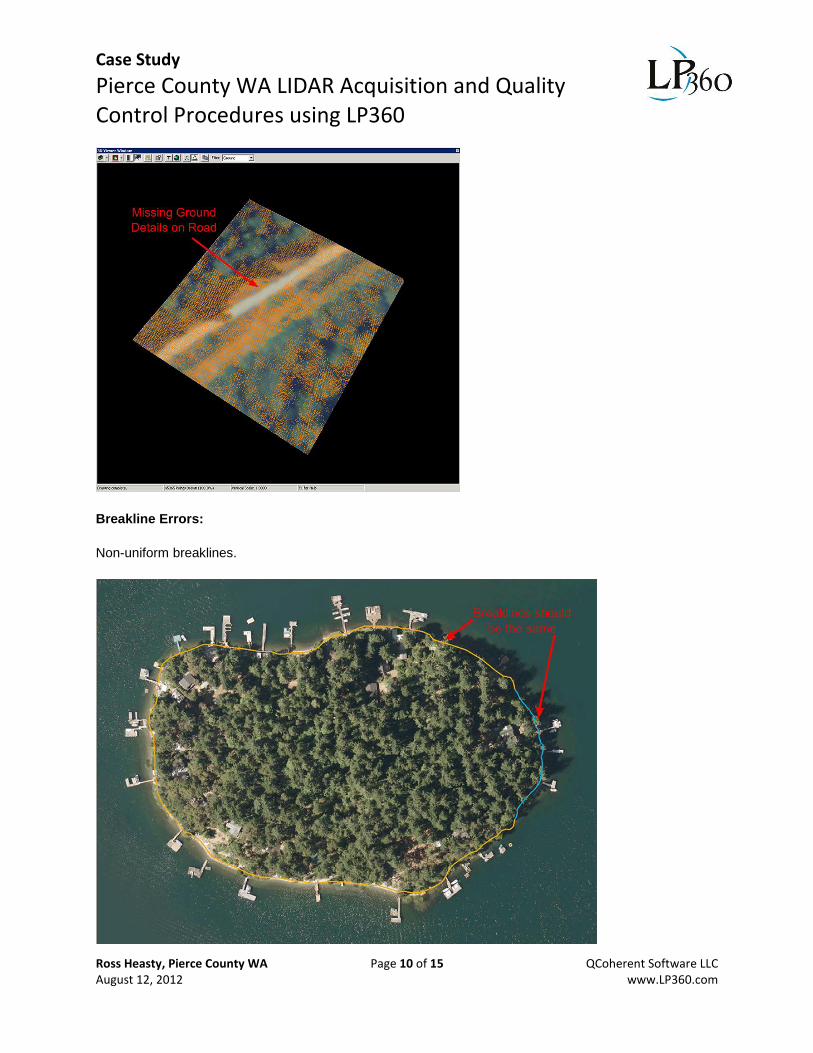
Missing Ground Details: Ground points not classified along road.
Case Study
Pierce County WA LIDAR Acquisition and Quality Control Procedures using LP360
Ross Heasty, Pierce County WA Page 10 of 15 QCoherent Software LLC August 12, 2012 www.LP360.com
Breakline Errors:
Non-uniform breaklines.

Case Study
Pierce County WA LIDAR Acquisition and Quality Control Procedures using LP360
Ross Heasty, Pierce County WA Page 11 of 15 QCoherent Software LLC August 12, 2012 www.LP360.com
Incomplete breaklines
Breakline not split at culvert (hydro-flattening).

Case Study
Pierce County WA LIDAR Acquisition and Quality Control Procedures using LP360
Ross Heasty, Pierce County WA Page 12 of 15 QCoherent Software LLC August 12, 2012 www.LP360.com
LP360 for ArcGIS® contains a dedicated set of tools for performing and annotating QC problems in LIDAR data sets. The figure below provides an example of an annotated breakline error.

Case Study
Pierce County WA LIDAR Acquisition and Quality Control Procedures using LP360
Ross Heasty, Pierce County WA Page 13 of 15 QCoherent Software LLC August 12, 2012 www.LP360.com
Tile can be denoted as having QC complete
Results
LP360 was an essential part of the QC process for determining the quality of data delivered.
LP360 was responsible for finding more than 85% of all the errors in the project.
USGS accepted the LIDAR LAS files without any corrections.
With the use of LP360 we found errors in about 21% of the 4528 delivered LAS tiles.

Case Study
Pierce County WA LIDAR Acquisition and Quality Control Procedures using LP360
Ross Heasty, Pierce County WA Page 14 of 15 QCoherent Software LLC August 12, 2012 www.LP360.com
1Nominal Post Spacing 2A GeoCue Company

Case Study
Pierce County WA LIDAR Acquisition and Quality Control Procedures using LP360
Ross Heasty, Pierce County WA Page 15 of 15 QCoherent Software LLC August 12, 2012 www.LP360.com