case study on the use of an integrated approach to …
TRANSCRIPT

Organisation for Economic Co-operation and Development
ENV/JM/MONO(2019)28
Unclassified English - Or. English
6 September 2019
ENVIRONMENT DIRECTORATE
JOINT MEETING OF THE CHEMICALS COMMITTEE AND THE WORKING PARTY
ON CHEMICALS, PESTICIDES AND BIOTECHNOLOGY
Cancels & replaces the same document of 29 August 2019
CASE STUDY ON THE USE OF AN INTEGRATED APPROACH TO TESTING
AND ASSESSMENT FOR ESTROGEN RECEPTOR ACTIVE CHEMICALS
Series on Testing and Assessment
No. 309
The corresponding annexes are available under the following cotes:
ENV/JM/MONO(2019)28/ANN1
JT03450660
This document, as well as any data and map included herein, are without prejudice to the status of or sovereignty over any territory, to the
delimitation of international frontiers and boundaries and to the name of any territory, city or area.

2 ENV/JM/MONO(2019)28
Unclassified

ENV/JM/MONO(2019)28 3
Unclassified
OECD Environment, Health and Safety Publications
Series on Testing and Assessment
No. 309
CASE STUDY ON THE USE OF AN INTEGRATED APPROACH TO TESTING
AND ASSESSMENT FOR ESTROGEN RECEPTOR ACTIVE CHEMICALS
Environment Directorate
ORGANISATION FOR ECONOMIC CO-OPERATION AND DEVELOPMENT
Paris 2019

4 ENV/JM/MONO(2019)28
Unclassified
About the OECD
The Organisation for Economic Co-operation and Development (OECD) is an
intergovernmental organisation in which representatives of 36 industrialised countries in
North and South America, Europe and the Asia and Pacific region, as well as the European
Commission, meet to co-ordinate and harmonise policies, discuss issues of mutual concern,
and work together to respond to international problems. Most of the OECD’s work is
carried out by more than 200 specialised committees and working groups composed of
member country delegates. Observers from several countries with special status at the
OECD, and from interested international organisations, attend many of the OECD’s
workshops and other meetings. Committees and working groups are served by the OECD
Secretariat, located in Paris, France, which is organised into directorates and divisions.
The Environment, Health and Safety Division publishes free-of-charge documents in
twelve different series: Testing and Assessment; Good Laboratory Practice and
Compliance Monitoring; Pesticides; Biocides; Risk Management; Harmonisation of
Regulatory Oversight in Biotechnology; Safety of Novel Foods and Feeds; Chemical
Accidents; Pollutant Release and Transfer Registers; Emission Scenario Documents;
Safety of Manufactured Nanomaterials; and Adverse Outcome Pathways. More
information about the Environment, Health and Safety Programme and EHS publications
is available on the OECD’s World Wide Web site (www.oecd.org/chemicalsafety/).
This publication was developed in the IOMC context. The contents do not necessarily reflect
the views or stated policies of individual IOMC Participating Organisations.
The Inter-Organisation Programme for the Sound Management of Chemicals (IOMC) was
established in 1995 following recommendations made by the 1992 UN Conference on
Environment and Development to strengthen co-operation and increase international co-
ordination in the field of chemical safety. The Participating Organisations are FAO, ILO,
UNDP, UNEP, UNIDO, UNITAR, WHO, World Bank and OECD. The purpose of the
IOMC is to promote co-ordination of the policies and activities pursued by the Participating
Organisations, jointly or separately, to achieve the sound management of chemicals in
relation to human health and the environment.

ENV/JM/MONO(2019)28 5
Unclassified
© OECD 2019
Applications for permission to reproduce or translate all or part of this material should be
made to: Head of Publications Service, [email protected], OECD, 2 rue André-Pascal,
75775 Paris Cedex 16, France
This publication is available electronically, at no charge.
Also published in the Series on testing and Assessment link
For this and many other Environment,
Health and Safety publications, consult the OECD’s
World Wide Web site www.oecd.org/chemicalsafety/
or contact:
OECD Environment Directorate,
Environment, Health and Safety Division
2, rue André-Pascal
75775 Paris cedex 16
France
Fax : (33-1) 44 30 61 80
E-mail : [email protected]

6 ENV/JM/MONO(2019)28
Unclassified
Forward
OECD member countries have been making efforts to expand the use of alternative
methods in assessing chemicals. The OECD has been developing guidance documents and
tools for the use of alternative methods such as (Q)SAR, chemical categories and Adverse
Outcome Pathways (AOPs) as a part of Integrated Approaches for Testing and Assessment
(IATA). There is a need for the investigation of the practical applicability of these
methods/tools for different aspects of regulatory decision-making, and to build upon case
studies and assessment experience across jurisdictions.
The objective of the IATA Case Studies Project is to increase experience with the use of
IATA by developing case studies, which constitute examples of predictions that are fit for
regulatory use. The aim is to create common understanding of using novel methodologies
and the generation of considerations/guidance stemming from these case studies.
This case study was developed by the United States for illustrating practical use of IATA
and submitted to the 2018 review cycle of the IATA Case Studies Project. This case study
was reviewed by the project team. The document was endorsed at the 3rd meeting of the
Working Party on Hazard Assessment in June 2019.
The following case study was also reviewed in the project in 2018:
1. CASE STUDY ON THE USE OF INTEGRATED APPROACHES TO TESTING
AND ASSESSMENT FOR TESTICULAR TOXICITY OF ETHYLENE
GLYCOL METHYL ETHER (EGME)-RELATED CHEMICALS,
ENV/JM/MONO(2019)27, Series on Testing & Assessment No. 308
These case studies are illustrative examples, and their publication as OECD monographs
does not translate into direct acceptance of the methodologies for regulatory purposes
across OECD countries. In addition, these cases studies should not be interpreted as official
regulatory decisions made by the authoring member countries.
In addition, a considerations document summarising the learnings and lessons of the review
experience of the case studies is published with the case studies:
REPORT ON CONSIDERATIONS FROM CASE STUDIES ON INTEGRATED
APPROACHES FOR TESTING AND ASSESSMENT (IATA) -Fourth Review Cycle
(2018) -, ENV/JM/MONO(2019)26, Series on Testing & Assessment No. 307.
This document is published under the responsibility of the Joint Meeting of the Chemicals
Committee and Working Party on Chemicals, Pesticides and Biotechnology.

ENV/JM/MONO(2019)28 7
Unclassified
Executive Summary
Endocrine disrupting chemicals are a diverse set of substances that have the potential to
interfere with normal endocrine function and lead to an adverse outcome. Due to the
potential impact of these adverse effects, regulatory agencies in many countries evaluate
endocrine activity of environmental chemicals for specific regulatory endpoints. As part of
the Integrated Approach to Testing and Assessment (IATA) project, this document presents
a case study to evaluate potential estrogenic activity from environmental chemicals. The
IATA presented in this document has characteristics that are consistent with a defined
approach (DA) and describes an integrated testing strategy (ITS) for the identification of
endocrine disruption by a substance primarily for the purposes of screening and
prioritisation without the use of animal testing. The data interpretation procedure (DIP) is
designed to provide information on whether the substance tested may act as an agonist of
estrogen receptor activation. The combination of test methods used covers multiple key
events (KEs) of the pathway leading to ER agonist activity. The prediction model combines
at least four results obtained from in vitro assays addressing different KEs of the pathway
to determine the final classification. Computational model classifications were derived for
1812 substances, and model performance was compared to high quality in vitro and in vivo
data for specific reference chemicals. Depending on the combination of tests used, this
prediction model generally achieved accuracies of 84 to 93%, as compared to reference
chemical data from US EPA’s Endocrine Disruptor Screening Program (EDSP) Tier 1
guideline in vitro tests and uterotrophic assay. These results compellingly verify the
applicability of this testing strategy as an IATA for identification of estrogenic chemicals.

8 ENV/JM/MONO(2019)28
Unclassified
Table of contents
Forward .................................................................................................................................................. 6
Executive Summary .............................................................................................................................. 7
Acronym List ....................................................................................................................................... 10
Introduction ......................................................................................................................................... 11
1. Purpose ............................................................................................................................................. 13
1.1. Purpose of Use ............................................................................................................................ 13 1.2. Target Chemical(s) ..................................................................................................................... 13 1.3. Endpoint(s) .................................................................................................................................. 13
2. Hypothesis for Performing the IATA ............................................................................................ 14
3. Approaches Used ............................................................................................................................. 15
4. Data/Information Gathering .......................................................................................................... 17
5. Application of IATA ........................................................................................................................ 25
5.1. Summary of Data ........................................................................................................................ 25 5.2. Application of IATA ................................................................................................................... 32 5.3. Strengths and Limitations of this IATA ...................................................................................... 33 5.4. Uncertainty .................................................................................................................................. 34 5.5. Strategy and Integrated Conclusion ............................................................................................ 36
6. Acknowledgements .......................................................................................................................... 38
7. References ........................................................................................................................................ 39
Annex I. Detailed assay descriptions in OECD GD211 Format.................................................. 42
Annex II. Curated reference chemical lists. ............................................................................... 43
Annex III. The Possible Combinations of 7 or Fewer Assays that Can Be Used in this
IATA 45
Annex IV. Main Scientific Papers ................................................................................................ 46
Tables
Table 1. ER pathway Model Proposed as Alternative to Specific OECD Test Guidelines ................... 13 Table 2. Summary of the in vitro assays used with their ID mapping to the model in Figure 3. .......... 19 Table 3. Minimum criteria for guideline-like (GL) uterotrophic studies (Kleinstreuer et al., 2016). ... 24 Table 4. Performance Based Validation of the ER pathway Model Based on 16 High-Throughput in
vitro Assays Measuring Potential Estrogen Receptor (ER) Agonist Activities and in vitro
Reference Chemicals a ................................................................................................................... 28 Table 5. Uncertainty of Defined Approach ........................................................................................... 34 Table AII-1. In vitro Estrogen Receptor (ER) Agonist Reference Chemicals ...................................... 43 Table AII-2. In vivo Estrogen Receptor (ER) Agonist Reference Chemicals with at Least two
Independent Active or Inactive Guideline-like Uterotrophic Studies (Browne et al., 2015) ........ 44

ENV/JM/MONO(2019)28 9
Unclassified
Figures
Figure 1. Representation of the ER pathway and computational model in the context of the
molecular initiating event (MIE) and associated key events (adapted from Browne et al. 2017). 16 Figure 2. Conceptual diagram of the overall process for development, validation, and application of
the IATA........................................................................................................................................ 17 Figure 3. Schematic diagram of the integrated model of chemical perturbations in the estrogen
receptor agonist pathway (Judson et al., 2015). ............................................................................ 22 Figure 4A. Activity of the in vitro reference chemicals (Judson et al., 2015). ...................................... 26 Figure 4B. Activity of in vivo reference chemicals (Browne et al., 2015). ........................................... 27 Figure 5. Performance of the best computational model utilizing different numbers of in vitro HTS
assays from 1 to 16 (Judson et al., 2017). ..................................................................................... 31 Figure 6. Flow chart for analysis using this IATA. ............................................................................... 33 Figure 7. ER pathway model results for chemicals with an AUC (Agonist) value > 0.1 (Watt and
Judson, 2018). ................................................................................................................................ 36

10 ENV/JM/MONO(2019)28
Unclassified
Acronym List
AIC Akaike Information Criteria
AUC Area Under the Curve
AOP Adverse Outcome Pathway
ATG Attagene
BA Balanced Accuracy
CEPA Canadian Environmental Protection Act, 1999
DA Defined Approach
DIP Data Integration Process
DMSO Dimethyl Sulfoxide
EDSP Endocrine Disruptor Screening Program
EPA Environmental Protection Agency
ER Estrogen Receptor
ERTA Estrogen Receptor Transactivation
EU European Union
FFDCA Federal Food, Drug and Cosmetic Act (US)
FIFRA Federal Insecticide, Fungicide and Rodenticide Act (US)
GL Guideline-Like
HTS High-throughput Screening
IATA Integrated Approach to Testing and Assessment
ICCVAM Interagency Coordinating Committee on the Validation of Alternative Test
Methods
ITS Integrated Test Strategy
KE Key Event
MAD Mutual Acceptance of Data
MIE Molecular Initiating Event
NCATS National Center for Advancing Translational Sciences
NVS Novascreen
OECD Organisation for Economic Cooperation and Development
OT Odyssey Thera
OVX Ovariectomised
PBTG Performance-Based Test Guideline
PND Postnatal Day
REACH Registration, Evaluation, Authorisation and Restriction of Chemicals (EU)
TG Test Guideline
US United States

ENV/JM/MONO(2019)28 11
Unclassified
Introduction
Endocrine disrupting chemicals are a diverse set of substances that have the potential to
interfere with normal endocrine function, which may lead to adverse outcomes (e.g.,
impaired reproduction). The endocrine system is highly integrative and complex, with
variability in activity following exposure, depending on the organ or timepoint studied.
Due to the potential impact of these adverse outcomes, health effects following exposure
to endocrine-active substances have been the subject of intensive study and have been
described in numerous research papers and reviews (e.g., Colborn and Clement 1992;
Kavlock et al., 1996; WHO 2002; WHO/UNEP 2012; Hotchkiss et al., 2008; Soto and
Sonnenschein 2010; Gore et al., 2015a). Beyond these and other research publications,
there are also numerous guidance documents and standardised test guidelines published on
the evaluation of endocrine disrupting chemicals.
The Organisation for Economic Co-operation and Development (OECD) has investigated
test methods in the scientific literature that could be standardised and used in chemical
regulations to detect and characterise hazards posed by endocrine disrupting chemicals. A
Conceptual Framework for Testing and Assessment of Endocrine Disrupters (as revised in
2012) lists the OECD Test Guidelines (OECD 2012a) and standardised test methods
available, under development or proposed to be used to evaluate chemicals for endocrine
disruption. These tests include both in vitro and in vivo assays that examine the
mechanisms, pathways and adverse effects on endocrine relevant endpoints. The majority
of these tests focus on a limited number of endocrine pathways at this time, including
estrogen, androgen, thyroid and steroidogenesis. Included in these guidance documents are
OECD technical guideline documents for assays that measure the effect of the tested
substance on upstream and downstream steps associated with estrogen receptor activation,
including receptor binding and transactivation, and organ effects (e.g., uterine weight
changes).
The ability to quickly assess chemicals for endocrine disruption is a global need. Under the
European Union’s (EU) Registration, Evaluation, Authorisation and Restriction of
Chemicals (REACH) regulation, endocrine disruptors are considered to be substances of
high concern. Similar importance is given to endocrine disruptors by Canada, the United
States (US) and many other countries. For example, the European Commission has recently
finalised a communication on science-based criteria for endocrine disruptors based on
recent regulations (EC 2018), and the EU has recently introduced specific legislative
obligations aimed at phasing out endocrine disruptors in water, industrial chemicals, plant
protection products and biocides. In Canada, the Canadian Environmental Protection Act,
1999 (CEPA) places mandatory obligations on the Minister of Health and the Minister of
the Environment concerning research on hormone disrupting substances, and, when
available, information on endocrine disrupting effects has been considered in the risk
assessments of substances (CEPA 1999). Similarly, in the US, endocrine disrupting effects
are an important area of research and considered in risk assessments of many substances.
For example, US EPA developed the Endocrine Disruptor Screening Program (EDSP) in
response to the statutory mandate in the Federal Food, Drug, and Cosmetic Act (FFDCA)
to evaluate activity against endocrine toxicity pathways through a series of tiered in vitro
and in vivo tests for specific regulatory endpoints (US EPA 2002). For these and other
regulatory agencies, determination of endocrine disrupting effects from a specific chemical
may lead to the restriction of its use.

12 ENV/JM/MONO(2019)28
Unclassified
Given the number of potential endocrine-disrupting substances in the environment that
need to be analysed, there is a need to validate and incorporate more rapid and cost-
effective methods to help accelerate the analysis of these substances. In order for new
approach methodologies to be used in regulatory decision making, it is necessary to
demonstrate that these methods are scientifically sound and can effectively detect
endocrine activity, e.g., via nuclear hormone receptor-mediated interactions.
As part of the Integrated Approach to Testing and Assessment (IATA) project, this
document presents a case study to evaluate potential estrogenic activity of environmental
chemicals. The IATA presented in this document has characteristics that are consistent with
a defined approach (DA) which do not rely on expert judgement, so yield reproducible
results. This IATA describes an integrated testing strategy (ITS) for the identification of
endocrine disruption by a substance primarily for the purposes of screening and
prioritisation without the use of animal testing. The data interpretation procedure (DIP) is
designed to provide information on whether the substance tested may act as an agonist of
estrogen receptor activation. The combination of up to 16 in vitro high-throughput
screening (HTS) assays covers multiple key events (KEs) of the pathway leading to
estrogen receptor (ER) activation. The prediction model integrates results from at least four
in vitro HTS assays addressing different KEs of the pathway to determine the final
classification. The integration of at least four assays increases the accuracy of the prediction
model and minimises the technical limitations of any one method. This case study describes
the design, performance-based evaluation, and application of this IATA.

ENV/JM/MONO(2019)28 13
Unclassified
1. Purpose
1.1. Purpose of Use
The case study uses a combination of in vitro HTS assays and a computational model for
ER activity, which could serve as an alternative to low and medium throughput in vitro and
in vivo tests. The original model consisted of 16 in vitro HTS assays that encompassed
multiple points on the ER pathway. Results from this model were analysed, and the
performance validated against sets of in vitro and in vivo reference chemicals to determine
if they provide an accurate quantitative measure of ER agonist activity for the chemicals
assayed. The goal is for the model to serve as an alternative to the current guideline ER
binding (TG493; OECD, 2015b), ER transactivation (ERTA; TG455; OECD, 2015a) and
uterotrophic assays (TG440; OECD, 2007) (Table 1). Further evaluation of the model
performance demonstrated that this could be achieved with subsets of in vitro HTS assays
as long as the HTS assays used in the subset fit specific criteria (discussed in more detail
below). The intended application of this IATA is screening and priority setting of
environmental chemicals based on their ER agonist activity and for further evaluation of
endocrine-related activity in higher tier in vivo tests (e.g., female pubertal assay, two
generation reproductive toxicity study).
Table 1. ER pathway Model Proposed as Alternative to Specific OECD Test Guidelines
PBTG493 ER Binding Performance-Based Test Guideline for Human Recombinant Estrogen Receptor (hrER) In vitro Assays to Detect Chemicals with ER Binding Affinity
OECD, 2015b
PBTG455 ER Transactivation Performance-Based Test Guideline for Stably Transfected Transactivation In vitro Assays to Detect Estrogen Receptor Agonists and Antagonists
OECD, 2015a
TG440 Uterotrophic assay Uterotrophic Bioassay in Rodents: A Short-Term Screening Test for Oestrogenic Properties
OECD, 2007
1.2. Target Chemical(s)
The target chemicals are environmental and commercial chemicals.
1.3. Endpoint(s)
The endpoint being assessed is ER agonist activity following exposure to a specific
chemical as measured in a subset of in vitro HTS assays run in US EPA’s ToxCast program.
The original model used a suite of 16 HTS assays that measure the molecular initiating
event (i.e., receptor binding), in addition to several key events (e.g., receptor dimerisation,
DNA binding, transactivation, gene expression, and cell proliferation) in the ER pathway
(Figure 1). Further analysis determined that the use of models integrating multiple
combinations of 4 to 16 HTS assays can accurately predict the estrogenic activation
potential of a chemical. The criteria for selection of the HTS assays used is that they probe
diverse points in the ER pathway, and use diverse assay measurement technologies and cell
types.

14 ENV/JM/MONO(2019)28
Unclassified
2. Hypothesis for Performing the IATA
Adverse toxicological outcomes are driven by interactions between chemicals and
biomolecular targets, which can be better understood through the use of AOPs. Using an
AOP as a framework, chemical perturbations of key events may be estimated or measured
by in silico models, biochemical assays, cell-based in vitro assays, and in vivo animal
models. In the case of the ER pathway model contained in this case study, in vitro HTS
assays are designed to characterise the impact of environmental chemicals on the molecular
initiating events or early key events in the ER pathway (Figure 1). In order to reduce the
potential of false positives, the assays probe multiple steps along the pathway, often with
replicate coverage of each key event. This case study is based on a series of HTS assays
integrated into a computational model of cellular KE in the upstream events of the ER
pathway. Therefore, the hypothesis for performing this IATA was to use a pathway-based,
computational model (based on in vitro HTS assays) to be able to screen and prioritise
chemicals for further assessment, based on whether or not they demonstrated ER agonist
activity. This methodology allows for a more rapid analysis of a larger number of chemicals
than was possible with traditional, low-throughput in vitro or in vivo assays. Consequently,
more resources can be focused on further analysis of those chemicals that show evidence
of potential endocrine disruption.

ENV/JM/MONO(2019)28 15
Unclassified
3. Approaches Used
ER Pathway
The use of a pathway approach for designing high throughput in vitro assays and new
computational tools is a valuable way to determine potential endocrine disruption effects
following exposure to environmental chemicals. Multiple adverse outcome pathways
(AOPs) are under development related to ER bioactivity (http://aopwiki.org). This IATA
was developed based on the known biology of the estrogen receptor signalling pathway
including reproductive, developmental and other health effects. The health effects
following exposure to endocrine-active substances have been well-studied and are
described in numerous research papers and reviews (e.g., Colborn and Clement 1992;
Kavlock et al., 1996; WHO 2002; WHO/UNEP 2012; Hotchkiss et al., 2008; Soto and
Sonnenschein 2010; Gore et al., 2015a). For this case study, we evaluated ER agonist
activity using data from a collection of 16 in vitro assays that probe the ER pathway
downstream from ER binding in mammalian systems. The computational model used 16
in vitro assays which are a subset of a larger collection of assays used in the US EPA
ToxCast program ((821 individual assay endpoints; Dix et al., 2007; Judson et al., 2010;
Kavlock et al., 2012). Figure 1 depicts the ER pathway and key events that were the basis
of the computational model, as well as the mapping of the in vitro HTS assays to the
respective key events.

16 ENV/JM/MONO(2019)28
Unclassified
Figure 1. Representation of the ER pathway and computational model in the context of the
molecular initiating event (MIE) and associated key events (adapted from Browne et al.
2017).
ER pathway showing MIE and key events and how they relate to OECD technical guidance (grey squares).
Perturbation of the MIE and downstream key events (KEs) are evaluated using high-throughput screening
(HTS) assays (yellow squares). ER = Estrogen receptor; ERTA = ER transactivation; MIE = molecular
initiating event.
Integrated Approach to Testing and Assessment (IATA)
The IATA presented in this document has characteristics consistent with a DA and
describes an ITS for the identification of potential endocrine disruption through ER
activation by a substance. The use case for the IATA is for the purpose of screening and
prioritisation without the use of animal testing. The DIP is currently designed to provide
information on whether the substance tested may act as an estrogen receptor agonist. The
DIP uses data from the individual in vitro HTS assays (ranging from 4 to 16 assays), which
are then integrated in the computational model (as described in detail in Judson et al., 2015;
2017). The score from the computational model is used to identify and quantify the ER
agonist activity of a chemical. The combination of test methods employed in the IATA
covers the MIE and multiple KEs in the pathway, and can be used as alternatives to 3
existing guideline studies (including 1 in vivo TG). For a positive result, the computational
model requires concordant results for at least 4 assays in separate KEs (or MIE). The
performance of the in vitro / computational model of 1812 substances was evaluated by
comparison to high quality in vitro and in vivo data for specific reference chemicals
(Kleinstreuer et al., 2016, Browne et al., 2015, Judson et al., 2015; 2017). More details of
this IATA are described below.

ENV/JM/MONO(2019)28 17
Unclassified
4. Data/Information Gathering
The IATA described here is an integrated battery of in vitro HTS assays and a
computational model of ER pathway activation. The case study evaluates the development,
validation, and application of the integrated battery of HTS assays and computational
model for determining potential endocrine disruption. The overall approach is shown in
Figure 2, with details on the specific steps included below. The data, model and validation
performance are all peer-reviewed, published, and transparent, with all the underlying data
and code made publicly accessible. The more detailed publications are cited where
appropriate.
Figure 2. Conceptual diagram of the overall process for development, validation, and
application of the IATA.
a. HTS assays were developed to encompass multiple points on the ER pathway and were used to assay the
ToxCast chemical set (1800+). The results of these assays are integrated through the ER pathway model to
yield a prediction value of ER agonist activity of a chemical.
b. In vitro and in vivo reference chemicals were curated for use in a performance-based evaluation of the model.
Full description of the curation of these lists is described in the text.
c. A performance-based evaluation of the model was then conducted using the reference chemicals and EDSP
Tier 1 chemicals in the ToxCast chemical set.
In vitro Assays. Details of the in vitro assays are described on US EPA’s ToxCast Web site
(US EPA, 2015a) and in a variety of publications (Dix et al., 2007; Judson et al., 2010).
Detailed descriptions of these assays, including their biological targets and any proprietary
aspects, can be found in Annex I. Briefly, potential ER activation was measured in 16 high-
throughput in vitro assays run in US EPA’s ToxCast program. The suite of high throughput
assays measures the MIE (i.e., receptor binding), in addition to several KEs (e.g., receptor

18 ENV/JM/MONO(2019)28
Unclassified
dimerisation, DNA binding, transactivation, gene expression, and cell proliferation) in the
ER pathway (Figure 1). The 16 ER assays include three cell-free biochemical radioligand
ER binding assays; three protein complementation assays that measure formation of ER
dimers and test for activity against ERα and ERβ, each measured at two time points; an
assay measuring interaction of the mature transcription factor with DNA at two time points;
two reporter gene assays measuring RNA transcript levels; two assays measuring reporter
protein levels; and an ER-sensitive cell proliferation assay (Table 2; assay IDs correspond
to Figure 3). The assay sources refer to the company or laboratory where the assays were
performed. All in vitro and in vivo reference chemicals were run in the 16 high-throughput
ER assays. In addition to the in vitro and in vivo reference chemicals, a total of 1812
chemicals were also run across the full set of 16 ER assays. All chemicals were run in a
blinded fashion in all the assays.
This set of biochemical and cell-based in vitro assays relies on different technologies and
probes different key events in the ER signalling pathway. Although the assays primarily
use human proteins and/or cell types, the suite of 16 assays include human, murine, and
bovine ER binding assays and ER pathway interactions in a variety of human tissue types
(Table 2). Every assay is potentially subject to technology-specific interference (e.g.,
chemicals that denature the receptor protein, are luminescent, are cytotoxic, etc.) that can
be mistakenly interpreted as ER-specific activation. Conceptually, assay interference (Auld
et al., 2008; Baell and Holloway, 2010; Bruns and Watson, 2012; Thorne et al., 2010) is a
phenomenon whereby assays designed to measure binding to a protein or perturbation of a
given pathway may produce false signals when the target protein itself, or other pathways
in the system, are altered non-specifically. For instance, a chemical could cause protein
denaturation, which could give rise to a false positive signal in cell-free, radioligand
competitive-binding assays. Such a chemical would show activity in all assays of that
technology, but not the cell-based assays. Another example would be fluorescent
compounds, which would show false activity in all fluorescence-based assays. The standard
approach to deal with assay interference issues is to deploy “orthogonal” assays (Miller et
al., 2010; Thorne et al., 2010) that help distinguish activity towards the intended target or
pathway from non-specific activities. In addition to assay interference issues, every assay
has inherent limitations such as dynamic range or levels of background noise. Using a suite
of assays to detect pathway perturbations may minimise potential non-specific effects or
limitations of any single assay (Judson et al., 2015).

ENV/JM/MONO(2019)28 19
Unclassified
Table 2. Summary of the in vitro assays used with their ID mapping to the model in Figure 3.
Further details are provided in Annex I.
Ass
ay ID
Ass
ay N
ame
Sou
rce
Gen
e T
arge
t
Nor
mal
ised
Dat
a T
ype
Ass
ay D
esig
n T
ype
Bio
logi
cal P
roce
ss T
arge
t
Det
ectio
n T
echn
olog
y
Det
ectio
n T
echn
olog
y
Sub
type
Mea
sure
men
t Tim
epoi
nt
(Hou
rs)
Org
anis
m
Tis
sue
Cel
l For
mat
Cel
l Lin
e N
ame
Ass
ay F
ootp
rint
A1 NVS_NR_bER NVS ESR1 percent activity
radioligand binding
receptor binding
Lysate-based radiodetection
Scintillation counting
18 bovine uterus
Tissue
based cell-free
NA microplate: 96-well plate
A2 NVS_NR_hER NVS ESR1 percent activity
radioligand binding
receptor binding
Lysate-based radiodetection
Scintillation counting
18 human NA cell-free
NA microplate: 96-well plate
A3 NVS_NR_mERa NVS Esr1 percent activity
radioligand binding
receptor binding
Filter-based radiodetection
Scintillation counting
18 mouse NA cell-free
NA microplate: 96-well plate
A4 OT_ER_ERaERa_0480 OT ESR1 percent activity
protein fragment complement-ation assay
protein stabilisation
Protein-fragment Complementation
Fluorescence intensity
8 human kidney cell-free
HEK293T microplate: 384-well plate
A5 OT_ER_ERaERa_1440 OT ESR1 percent activity
protein fragment complement-ation assay
protein stabilisation
Protein-fragment Complementation
Fluorescence intensity
24 human kidney cell line
HEK293T microplate: 384-well plate
A6 OT_ER_ERaERb_0480 OT ESR1 percent activity
protein fragment complement-ation assay
protein stabilisation
Protein-fragment Complementation
Fluorescence intensity
8 human kidney cell line
HEK293T microplate: 384-well plate
A7 OT_ER_ERaERb_1440 OT ESR1 ESR2
percent activity
protein fragment complement-ation assay
protein stabilisation
Protein-fragment Complementation
Fluorescence intensity
24 human kidney cell line
HEK293T microplate: 384-well plate
A8 OT_ER_ERbERb_0480 OT ESR2 percent activity
protein fragment complement-ation assay
protein stabilisation
Protein-fragment Complementation
Fluorescence intensity
8 human kidney cell line
HEK293T microplate: 384-well plate

20 ENV/JM/MONO(2019)28
Unclassified
NVS=Novascreen; OT=Odyssey Thera; ATG=Attagene; Tox21=assays run by the National Institutes of Health’s National Center for Advancing Translational
Sciences (NCATS) as part of the Federal Tox21 program.
A9 OT_ER_ERbERb_1440 OT ESR2 percent activity
protein fragment complement-ation assay
protein stabilisation
Protein-fragment Complementation
Fluorescence intensity
24 human kidney cell line
HEK293T microplate: 384-well plate
A10 OT_ERa_EREGFP_0120 OT ESR1 percent activity
fluorescent protein induction
regulation of gene expression
Microscopy
Optical microscopy: Fluorescence microscopy
2 human cervix cell line
HeLa microplate: 384-well plate
A11 OT_ERa_EREGFP_0480 OT ESR1 percent activity
fluorescent protein induction
regulation of gene expression
Microscopy
Optical microscopy: Fluorescence microscopy
8 human cervix cell line
HeLa microplate: 384-well plate
A12 ATG_ERa_TRANS_up ATG ESR1 log2 fold induction
mRNA induction
regulation of transcription factor activity
RT-PCR and Capillary electrophoresis
Fluorescence intensity
24 human liver cell line
HepG2 microplate: 24-well plate
A13 ATG_ERE_CIS_up ATG ESR1 log2 fold induction
mRNA induction
regulation of transcription factor activity
RT-PCR and Capillary electrophoresis
Fluorescence intensity
24 human liver cell line
HepG2 microplate: 24-well plate
A14 Tox21_ERa_BLA_Agonist_ratio Tox21 ESR1 percent activity
beta lactamase induction
regulation of gene expression
GAL4 b-lactamase reporter gene
Fluorescence intensity
18 human kidney cell line
HEK293T microplate: 1536-well plate
A15 Tox21_ERa_LUC_BG1_Agonist Tox21 ESR1 percent activity
luciferase induction
regulation of gene expression
Luciferase-coupled ATP quantitation
Bioluminescence 22-24 human ovary cell line
BG1 microplate: 1536-well plate
A16 ACEA_T47D_80hr_Positive ACEA ESR1 percent activity
real-time cell-growth kinetics
cell proliferation
RT-CES Electrical Sensor: Impedance
80 human breast cell line
T47D microplate: 96-well plate

ENV/JM/MONO(2019)28 21
Unclassified
Chemicals were run in concentration−response format in all assays except the cell-free
binding assays. Cell-free competitive binding assays were initially run at a single screening
concentration (25 μM), and if the test chemical was active in the assay (i.e., radioligand
was displaced), the assay was run in concentration−response format. All in vitro assays
except the assays measuring RNA transcript levels were normalised to 17β-estradiol. RNA
transcript data were normalised as a fold-change from the solvent (DMSO) control.
Concentration−response data from in vitro assays were fit to three statistical models that
included a four parameter Hill model, a modified Hill model with gain-loss at high
concentrations, or a constant (no concentration−response) model. The best model was
statistically selected using the Akaike Information Criteria (AIC) value. All
concentration−response data were analysed using the ToxCast data analysis pipeline (tcpl;
Filer 2017), which automates the processes of baseline correction, normalisation, curve-
fitting, hit-calling, and detection of a variety of potential confounders. The data analysis
pipeline is available for download (https://doi.org/10.23645/epacomptox.6062788). To
integrate results of the different in vitro assays, synthetic concentration−response curves
were generated for each assay across 14 standardised concentrations from 0.01 to 100 μM.
Computational Modelling. The concentration−response curves for all 16 assays were
included in a computational model, referred to here as the ER pathway model. The model
code is available for download (https://doi.org/10.23645/epacomptox.6062542). The
model itself is conceptually simple, and its workings can be described with the aid of Figure
3 (Judson et al., 2015). We assume that a chemical can act in several ways: it can be a true
ER agonist, a true ER antagonist (not described here), it can cause false activity in one or
more assays through some assay interference mechanism, or it can be totally inactive. There
are three kinds of nodes in Figure 3. The blue nodes are the series of known biological
processes in the ER agonist pathway, from Figure 1. The grey nodes (assay interference
activity in Figure 3) are technology specific assay interference processes that a chemical
could trigger (technology being a combination of cell type and assay readout). The white,
star-shaped nodes are the assays. Lines connecting ER or interference nodes with assay
nodes indicate which assays will be activated if one of the biological nodes (agonist or
interference) is activated. For instance, if a chemical is a true agonist, all assays (A1-A16)
should be active, because arrows connect the ER receptor binding / agonist node with all
of the assay nodes. However, if a chemical is not an agonist, but instead interferes with the
technology of assays A1-A3 (all cell-free radioligand binding assays) through interference
process R3, then assays A1-A3 will be activated, but none of the other assays will be. The
mathematical model that combines all of the assay data takes the pattern of activity seen
across the assays and determines the most likely cause (agonist, antagonist, interference
through one of the other nodes). This process is carried out is using a straightforward
mathematical optimisation function, and is done for each concentration separately. This
step then yields a concentration-response curve for each of the agonist, antagonist and
interference nodes for each chemical. The area under the curve (AUC) for a chemical-node
pairs is then just the integral of the corresponding concentration-response curve. This
mathematical process does not require that all assays connected to a node be active, but the
weight assigned to the node will increase with the fraction of corresponding assays that are
turned on. An important detail of the model is that it picks the smallest set of modes that
explain the data. The AUC values are normalised so that the ER agonist AUC “model
scores” range from 0 (no activity) to 1 (activity of 17β-estradiol). Model scores were
truncated at values <0.001, considered to have no ER activation and given a score of 0. A
model score of <0.001 implies a concentration required to elicit 50% of the maximal
response (AC50) greater than 10 mM which is several orders of magnitude greater than the
highest concentrations tested in the ER assays. ER pathway agonist AUC scores ≥0.1 were

22 ENV/JM/MONO(2019)28
Unclassified
considered positive. A model score of 0.1 equates to an AC50 of ~100 μM, which is the
upper limit of testing in the assays. Model scores of 0.1 > AUC > 0.001 were considered
inconclusive because these chemicals were active in only one or two ER assays and activity
was limited to the highest concentrations tested. Activity in only a few of the 16 assays
may be due to differential sensitivities in the various in vitro assays, although all chemicals
were tested up to at least 100 μM. The model was applied to the ToxCast library of 1812
chemicals, including reference chemicals described below, and correctly identified the
agonists except for weak agonists whose activity was outside the concentration range tested
(Judson et al., 2015).
Figure 3. Schematic diagram of the integrated model of chemical perturbations in the
estrogen receptor agonist pathway (Judson et al., 2015).
The input data for the model includes concentration-response data for 16 ER-related in vitro assays. The model
produces scores for agonist activity (blue) and for assay interference activity (grey). These scores can then be
compared with reference chemicals, structure classes, and other properties.
Curation of lists of reference chemicals for in vitro and in vivo ER agonist activity
(Judson et al., 2015; Browne et al., 2015; Kleinstreuer et al., 2016): ER pathway model
performance was evaluated for both in vitro and in vivo reference chemicals, as well as
results of EDSP Tier 1 screening assays in current practice, in order to evaluate the ability
of the ER pathway model to accurately identify active and inactive chemicals based on
previous in vitro, in vivo and EDSP Tier 1 screening. The set of 40 in vitro reference

ENV/JM/MONO(2019)28 23
Unclassified
chemicals were previously identified using multiple validated low throughput in vitro ER
assays, and were identified by the Interagency Coordinating Committee on the Validation
of Alternative Test Methods (ICCVAM) and OECD for the express purpose of validating
novel in vitro assays. Forty chemicals (28 agonists of differing potencies indicated by a
range in AC50 values (activity concentration required to elicit 50% maximal response) and
12 inactive chemicals) were selected for reproducible results in in vitro ER binding and
transactivation assays, and to include a diverse set of chemical structures. The set of in vitro
reference chemicals includes the list used in the OECD TG457 BG1 guidance document
(OECD 2012b). The complete set of in vitro reference chemicals used in this study are
given in Annex II (Browne et al. 2015).
The set of 43 in vivo reference chemicals (30 positive, 13 inactive) were identified from
current (up to Dec 2014) scientific literature search for studies that measured uterine weight
changes in immature or ovariectomised (OVX) rats, or OVX mice (See list in Annex II;
Browne et al., 2015). Literature searches were performed on over 1800 chemicals (using
the ToxCast Phase I/Phase II/E1K chemical library as starting point). This resulted in over
700 papers, which were further evaluated for specifically defined quality control metrics
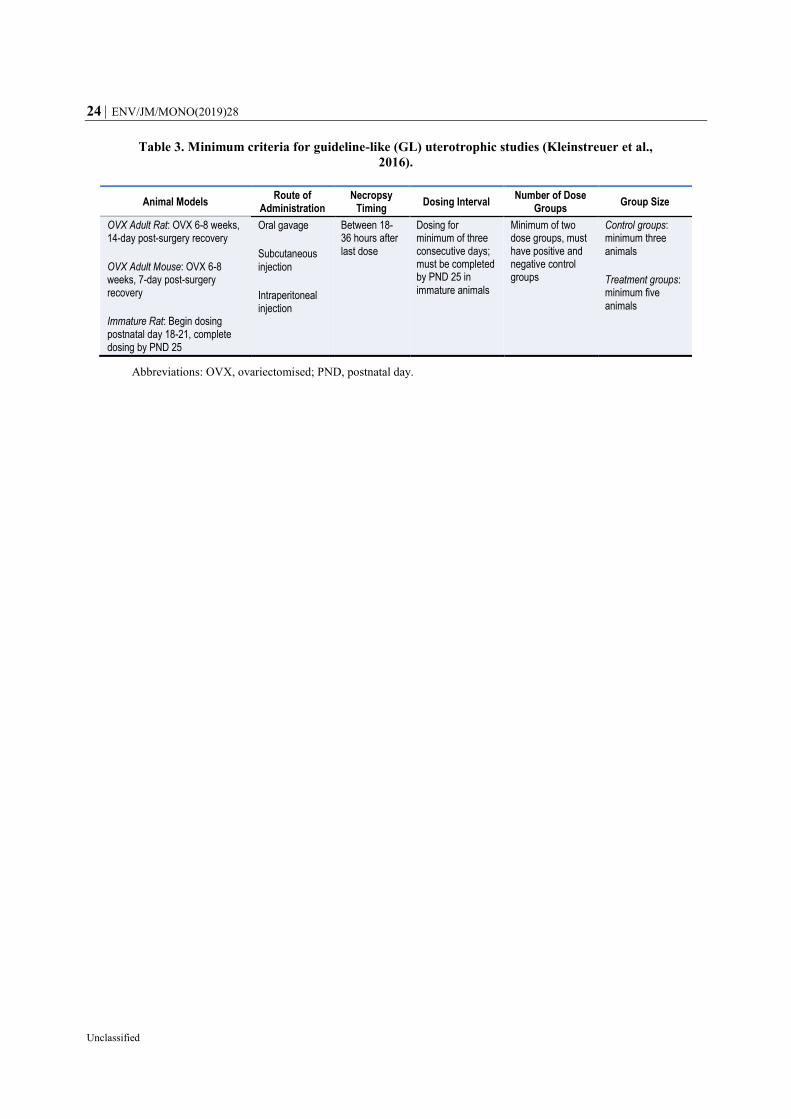
for inclusion in a final database of “guideline-like” (GL) studies. GL studies were those
that were compliant with the uterotrophic study design from the OECD TG 440 (OECD
2007), and adhered to six pre-defined minimum criteria (i.e., animal model used, route of
administration, necropsy timing, dosing interval, number of dose groups, and group size;
Table 3). These are further defined in Kleinstreuer et al. (2016). Studies that met all 6
minimum criteria were considered and compiled into single database (Kleinstreuer et al.,
2016). Study quality evaluation was based on information extracted from each publication,
and independently scored by two scientists. It should be noted that compliance with the
minimum criteria identified is not necessarily equivalent to a thorough assessment of
overall study quality, as it did not consider internal validity of each study, risk of bias or
difference in biotransformation due to route of administration.
As part of this analysis, both the qualitative and quantitative reproducibility of a
uterotrophic assay across many chemicals tested at many different laboratories was
assessed. Of the 70 chemicals in the database with at least two reported GL uterotrophic
studies, 18 (26%) had at least one study with a discordant outcome, resulting in a chemical
being classified as both “active” and “inactive” for uterotrophic bioactivity. Discordant
outcomes could result from differences in overall study protocol design and/or from the
range of doses tested in each study. This analysis provides a good example of the high
degree of variability that can be seen in the uterotrophic bioassay (Kleinstreuer et al., 2016),
and provides a basis for comparison when evaluating alternative approaches as a
replacement for the animal test.
24 ENV/JM/MONO(2019)28
Unclassified
Table 3. Minimum criteria for guideline-like (GL) uterotrophic studies (Kleinstreuer et al.,
2016).
Animal Models Route of
Administration Necropsy
Timing Dosing Interval
Number of Dose Groups
Group Size
OVX Adult Rat: OVX 6-8 weeks, 14-day post-surgery recovery
OVX Adult Mouse: OVX 6-8 weeks, 7-day post-surgery recovery
Immature Rat: Begin dosing postnatal day 18-21, complete dosing by PND 25
Oral gavage
Subcutaneous injection
Intraperitoneal injection
Between 18-36 hours after last dose
Dosing for minimum of three consecutive days; must be completed by PND 25 in immature animals
Minimum of two dose groups, must have positive and negative control groups
Control groups: minimum three animals
Treatment groups: minimum five animals
Abbreviations: OVX, ovariectomised; PND, postnatal day.

ENV/JM/MONO(2019)28 25
Unclassified
5. Application of IATA
5.1. Summary of Data
Performance-based evaluation and application of the ER pathway model. The ER
pathway model is not developed by fitting to data from a set of training chemicals. Instead,
the ER pathway model considers the expected patterns of assay activity for different modes
(agonist, antagonist, several types of assay interference), based on an understanding of the
underlying biology, as described above. The model then evaluates the pattern for each
chemical and assigns the chemical to the mode with the highest score. Reference chemicals
are used to validate this scoring approach and not to train the model. This IATA case study
provides evidence to validate this IATA, with most of the validation work performed using
all 16 assays. After validation of the 16-assay ER pathway model, research was conducted
to determine the minimal number of assays for acceptable predictivity. This work
demonstrated that as few as 4 assays are sufficient by comparing the results from various
combinations of 1 to 15 assays to results from the 16-assay ER pathway model and US Tier
1 screening assays (Judson et al., 2017).
The performance of this ER pathway model was evaluated using a validation approach
consistent with the OECD conceptual framework for assessing potential endocrine
disrupting chemicals (OECD 2012a). The ER pathway model results were compared to
three sets of reference chemicals: (1) a set of reference chemicals with consistent ER
agonist activity from multiple reports in vitro ER assays in the literature (in vitro reference
chemicals) (Annex II; Browne et al., 2015; Judson et al., 2015; 2017); (2) a set of reference
chemicals with in vivo guideline uterotrophic data from multiple labs from the literature (in
vivo reference chemicals) (Annex II; Browne et al., 2015; Kleinstreuer et al., 2016; Judson
et al., 2017), and (3) a set of chemicals with results of data from US EDSP Tier 1 guideline
ER assays (i.e., ER binding assay, ER transcriptional activation assay, ER uterotrophic
assay; Browne et al., 2015). Reliability of the model results were measured for each
evaluation. This analysis focused on the ER agonist activity from the model, and included
analysis of true positives, true negatives, false positives, false negatives, balanced accuracy
(average of sensitivity and specificity), sensitivity and specificity. This analysis focused on
those chemicals with an indication of ER agonist activity (AUC > 0.1) or no activity (AUC
= 0) but excluded inconclusive results (0.001 < AUC < 0.1). ER pathway model agonist
scores were examined for 1812 chemicals evaluated in the 16 ER assays. The 1812
chemicals also include pesticide active ingredients (387) and pesticide inerts (367). The
results of this evaluation are described below.
In vitro reference chemicals from the literature (Judson et al., 2015). As part of the
performance evaluation of the ER pathway model, the model results for ER agonists were
compared to a set of 40 positive and negative reference chemicals that were assayed for ER
agonist activity (i.e., ER binding assay, ER transcriptional activation assay). The AUC
values for these reference chemicals are plotted in Figure 4A. For the 40 in vitro reference
chemicals, the ER pathway model performed with an overall balanced accuracy of 93%.
Of the 28 active reference chemicals, 26 of 28 showed ER agonist activity with agonist
AUC>0.1. As above, the ER agonist scores were positive (≥0.1) for all strong, moderate
and weak agonist reference chemicals. Two very weak reference chemicals (diethylhexyl
phthalate, dicofol) were false negatives, and one very weak active chemical (di-butyl
phthalate) was inconclusive (0.001 < AUC < 0.1). Of the 12 inactive reference chemicals,

26 ENV/JM/MONO(2019)28
Unclassified
11 chemicals had ER agonist scores of zero. One inactive chemical (haloperidol) had an
inconclusive pathway model score (0.001 < AUC < 0.1). If the two chemicals with
inconclusive ER agonist model scores are excluded from performance metrics, then the
overall balanced accuracy is 95%.
Figure 4A. Activity of the in vitro reference chemicals (Judson et al., 2015).
Positive reference chemicals are indicated by green circles, while negative reference chemicals are indicated
by red circles. For the agonists, the expected potency range is also indicated (middle column). For chemicals
with one or more assay interference AUC values greater than zero, the value is indicated by an X, and the assay
interference node is indicated.

ENV/JM/MONO(2019)28 27
Unclassified
Figure 4B. Activity of in vivo reference chemicals (Browne et al., 2015).
Chemicals are plotted according to their ER model score (ER agonist AUC) and color-coded based on their
uterotrophic response (active = pink, inactive = blue).
Guideline uterotrophic assay reference chemicals (Browne et al., 2015; Kleinstreuer et al.,
2016). To further evaluate the ER pathway model, the model agonist scores were compared
with 103 chemicals run in at least one guideline-like uterotrophic study (Figure 4B). This
larger set of chemicals included 43 in vivo reference chemicals with independently verified
results in two or more guideline-like uterotrophic studies. The overall accuracy of the ER
pathway model agonist scores evaluated for these 43 chemicals was 86%. Of 30 active
reference chemicals, 29 had positive ER pathway model scores (AUC ≥ 0.1). The potential
false negative chemical, octamethylcyclotetrasiloxane (D4), was positive for uterine weight
gain in multiple uterotrophic studies run in independent laboratories but negative in the ER
pathway model. It is possible that the volatility of this chemical reduced the concentration
of this compound actually tested in the high throughput assay. One possibly false positive,
kaempferol, was negative for uterine weight gain in uterotrophic studies but had a modest
ER pathway model agonist score (AUC = 0.25). This positive result was consistent with
other lower throughput in vitro ER assays of this chemical, and may be indicative of a false
negative response in the animal data due to the tissue-specific nature of kaempferol activity
(i.e., it does not act on uterine tissue but does have an effect on others ER-responsive
tissues). Four inactive in vivo reference chemicals (dibutyl phthalate, dicyclohexyl
phthalate, dihexyl phthalate, and fenvalerate) had very low ER pathway model scores
associated with inconclusive calls (0.001 < AUC < 0.1). This result supports the hypothesis
that ER pathway model in this range has limited in vivo relevance. If the four inconclusive
chemicals were excluded from calculations of performance metrics, then the resulting

28 ENV/JM/MONO(2019)28
Unclassified
overall accuracy for model performance for in vivo reference chemicals was 95% (37/39).
To further examine the accuracy of the ER pathway model agonist scores against in vivo
assays, the model results were also compared with a further 60 chemicals run in only one
guideline-like uterotrophic study. With this analysis, the overall accuracy of the ER
pathway model was 84% (86/103).
US EDSP Tier 1 reference chemicals (Browne et al., 2015). Within the ToxCast chemicals
analysed by the ER pathway model, there were 52 from the EDSP Tier 1 list that have data
from the EDSP Tier ER binding, ERTA, and uterotrophic assays. Comparing ER pathway
model scores and EDSP Tier 1 results, three List 1 chemicals did not have ToxCast assay
data and none of the remaining 49 chemicals had ER pathway model scores ≥0.1. Similarly,
none of the chemicals had clear positive agonist activity in the Tier 1 ER in vitro assays
(ER binding and ERTA) or in vivo (uterotrophic) assays (Table 4). ER pathway model
scores were inconclusive for eight List 1 Tier 1 chemicals, all of which had limited signal
in the EDSP Tier 1 assays, but none of which would be considered positive based on the
Tier 1 response. All ER assay responses for these chemicals were detected at concentrations
similar to those that resulted in cytotoxicity and may be explained by cell-stress or
cytotoxicity-related false positive activity. Although there were both positive and negative
Tier 1 ERTA assays reported for two chemicals, there were not clear indications of a
positive Tier 1 ER binding, ERTA, or uterotrophic study (or any study submitted to US
EPA to satisfy a Tier 1 test order) for any chemical. Similarly, ER pathway model scores
were negative for the remaining 41 chemicals. Comparison between computational
methods and Tier 1 assays is biased by the lack of positive results, but for this analysis the
model accuracy against List 1 chemicals with Tier 1 data is 84% (41/49) and 100% if
inconclusive results are not included.
Table 4. Performance Based Validation of the ER pathway Model Based on 16 High-
Throughput in vitro Assays Measuring Potential Estrogen Receptor (ER) Agonist Activities
and in vitro Reference Chemicals a
performance in vitro reference chemicals
in vivo reference chemicals
GL uterotrophic studies
Tier 1 studies
# true pos 26 (25) 29 (29) 49 (38) 0 (0)
# true neg 11 (11) 8 (8) 37 (37) 41 (41)
# false pos 1 (0) 5 (1) 11 (4) 8 (0)
# false neg 2 (2) 1 (1) 6 (6) 0 (0)
accuracy 0.93 (0.95) 0.86 (0.95) 0.84 (0.88) 0.84 (1.0)
sensitivity 0.93 (0.93) 0.97 (0.97) 0.89 (0.86) 0 (0)
specificity 0.92 (1.0) 0.67 (0.89) 0.77 (0.90) 0.84 (1.0)
a: ER pathway model scores ≥0.1 were considered positive, negative scores = 0 (and values <0.001 were
truncated as 0), and model scores (0 > AUC < 0.1) were inconclusive. Performance metrics were calculated
with all chemicals and excluding chemicals with inconclusive model scores (values shown in parentheses).
In sum, the full ER pathway model accuracy was 84% to 93% concordant when compared
to reference chemicals and predicted results of EDSP Tier 1 guideline and other
uterotrophic studies with a minimum of 84% up to 100% accuracy if inconclusive
chemicals are excluded (Table 4). The performance of high-throughput assays and ER
pathway model predictions demonstrates that these methods correctly identify active and
inactive reference chemicals, provide a measure of relative ER agonist activity, and rapidly
identify chemicals with potential endocrine bioactivities for additional screening and
testing. When applied to a larger set of environmental/commercial chemicals, ~7% have

ENV/JM/MONO(2019)28 29
Unclassified
ER pathway model score indicative of agonist activity (Data not shown; Browne et al.,
2015 Supplemental).
Reduced subset of HTS assays. The ER pathway model was also examined to determine
whether a subset of assays could achieve equivalent performance to the full 16 in vitro HTS
assays used in the agonist-mode. A simple additive model of ER agonist activity using
variable numbers of assays was developed and calibrated against the full ER pathway
model. The subset model produces a chemical-specific ER agonist AUC value using the
formula:
𝐴𝑈𝐶(𝑐ℎ𝑒𝑚𝑖𝑐𝑎𝑙) =∑𝑎𝑖 × 𝑙𝑜𝑔10(𝐴𝐶50𝑖 (𝑐ℎ𝑒𝑚𝑖𝑐𝑎𝑙)) × 𝑇𝑖(𝑐ℎ𝑒𝑚𝑖𝑐𝑎𝑙)
𝑛
𝑖=0
where 𝐴𝐶50𝑖 is the potency of the chemical and 𝑇𝑖is the corresponding “top” parameter or efficacy in assay i.
The weight parameters 𝑎𝑖 are constants for the specific subset model, and n is the number of assays in that
subset model, and are provided in the supplemental material of Judson et al. (2017).
Separate “subset models” for all combinations of 1, 2, … 16 assays (65,535 in total) were
then evaluated against the full model, using balanced accuracy as the performance metric
(active vs. inactive). The results of this analysis demonstrated that there were many subsets
of assays that performed at levels comparable to the full 16-assay model. The simplest,
high-performing subsets used just 4 assays. As long as the subset of assays probe diverse
points in the ER pathway and use diverse assay reporting technologies and cell types, there
is flexibility in constructing this integrated battery of in vitro assays that can still yield
equivalent accuracy in predicting estrogen agonist activity. Performance was evaluated for
sensitivity, specificity and balanced accuracy of the subset model relative to the specific
classifications of the full model, the in vitro reference chemicals and the in vivo reference
chemicals described above. This is described in more detail in Judson et al. (2017).
In general, analysis of all models showed that it was possible to achieve 96% balanced
accuracy (all chemicals vs full model) for certain combinations of 7 or more in vitro assays.
Performance with some models with 4, 5 and 6 assays was almost as high. Analysis of just
the in vitro reference chemicals vs the full model is better on average, and demonstrated
that there are sets of as few as 4 assays that correctly classify all of the in vitro reference
chemicals. Further analysis of the subset models showed that those that are optimised for
one metric (e.g., classification of the reference chemicals vs full model), may have
suboptimal performance on other metrics, such as classification of non-reference
chemicals.
Figure 5 depicts the performance metrics for the best model for each number of assays from
1 to 16. The ‘best’ model shown is the subset model with the highest minimum balanced
accuracy (i.e., minimum value for the BA for in vitro literature-based reference chemicals,
in vivo literature-based reference chemicals, and all reference chemicals versus the full
model). The results of this analysis demonstrated that there were many subsets of assays
that performed at levels comparable to the full 16-assay model, including some that
included as few as 4 assays. Annex III contains a table with all subset models with 7 or
fewer assays that achieve BA ≥94% for the full chemical set and for the in vitro and in vivo
subsets. Almost all of these models use the cell-free human and bovine radioligand binding
assays, the ATG TRANS transactivation assay and the ACEA cell proliferation assay. None
of the subset models use the Tox21 transactivation assays. The main difference between
these models is which of the Odyssey Thera dimerisation assays were used. It is important
to note that none of the models gives exactly the same classification as the full model.
While almost all of the false negative reference chemicals in both the full model and the

30 ENV/JM/MONO(2019)28
Unclassified
subset models are due to the limited upper testing concentration (~100µm), potential causes
of a subset false positive call may vary. A subset false positive chemical is one where the
subset model indicates the chemical is positive for estrogenicity, while the full model
indicates that it is negative. The fewer assays used in a model, the more weight one false
positive assay may carry overall as it will not be compensated for by a large number of
presumably negative assays. False positives may be those that are selective estrogen
receptor modulators but functionally classified as estrogen antagonists (e.g., tamoxifen
citrate), or chemicals that are active in assays sensitive to these chemical classes in the
absence of estrogen receptor activity (e.g., progesterone or glucocorticoid-activating
chemicals). Selective estrogen receptor modulators have high full-model antagonist AUC
scores (Judson et al., 2015), and are expected to have significant activity in the upstream
assays in the pathway (binding, protein dimerisation, chromatin binding), but limited to no
activity in the downstream agonist assays (transactivation, proliferation) (Judson et al.,
2015). However, progesterone or glucocorticoid-activating chemicals are active mostly in
the ACEA cell proliferation assay (Judson et al., 2017). This assay, run in T47D cells, is
known to be sensitive to these classes of chemicals independent of the estrogen receptor.
Other chemicals that are detergents or solvents may be activating the in vitro assays through
a cell stress or technology interference pathways. Most of these “false positive” chemicals
are principally active in the ATG assays, as observed previously (Judson et al., 2015). One
hypothesis about these chemicals is that they are actually estrogenic, but only after
bioactivation. The ATG assays are run in a sub-strain of HepG2 cells that was selected for
increased CYP activity. More details on this analysis can be found in Judson et al. (2017).
The results of this analysis show that there are a variety of in vitro HTS assay subsets that
can be used to accurately classify chemicals for ER agonist activity. It is acceptable for this
IATA to use as few as 4 assays and concurrent cytotoxicity/ cellular proliferation assay.
Several nodes of the AOP are being evaluated alongside a phenotypic response (cellular
proliferation). Different signal detection systems and different platforms (cell types/cell
free systems) are used in the analysis (see Annex III for acceptable combinations). As long
as the subset of assays interrogate different points on the ER pathway and incorporate
different technologies, there is flexibility in constructing this integrated battery of in vitro
HTS assays that can still yield equivalent accuracy in predicting ER agonist activity. This
flexibility of the model would allow users to incorporate assays that they currently use or
easily have access to as long as the criteria described above is met. A further aspect of the
model flexibility allows for a decrease in potential barriers from required use of in vitro
HTS assays with proprietary information.

ENV/JM/MONO(2019)28 31
Unclassified
Figure 5. Performance of the best computational model utilizing different numbers of in vitro
HTS assays from 1 to 16 (Judson et al., 2017).
The black symbols indicate data for the best all-chemical model. The red symbols are shifted to the right slightly
for ease of visualisation. Figure shows the balanced accuracy for the best model using fewer than the 16 in vitro
assays as compared to the full model for all ToxCast chemicals, and in vitro and in vivo reference chemicals.
BA=balanced accuracy.
Applicability domain. In this context applicability domain describes the chemical space in
which an assay correctly reflects the underlying molecular interactions of a chemical.
Chemical classes that give false positive results in an assay technology would then be out
of the applicability domain for that assay. An example would be fluorescent chemicals
which can give false positive signals in fluorescence-based assays. The ER pathway model
integrates several assays for the MIE and multiple KEs across an adverse outcome pathway
to predict chemical toxicity for that pathway. Therefore, this model is less likely to result
in false negatives or positives, as this integration takes into account the potential that an
“inactive” chemical in one assay may have been “active” in another assay targeting a
different point in the pathway. Conversely, a chemical that is positive in one assay through
assay interference will be negative in the remaining assays that use different technologies.
Therefore, while the applicability domain of a single high throughput assay may be limited,
the computational model integrates multiple assays that encompass the broader toxicity
pathway, and therefore can extend the applicability domain. However, the majority of the
in vitro HTS assays used in the case study lack metabolic competence. Further, the assays
used here are currently DMSO-based. Therefore, chemicals that require bioactivation for
ER agonist activity may not be detected, and ER agonists that are not soluble in DMSO
have not been tested.
Application of the IATA allows the rapid screening of many chemicals for estrogen
bioactivity. Based on the performance-based validation of this model, multiple chemicals
can be tested using the HT in vitro assays that encompass the ER pathway as described
above, and the data integrated through the ER pathway model. The result of this IATA is a
prediction of whether the chemical analysed has estrogen receptor agonistic bioactivity

32 ENV/JM/MONO(2019)28
Unclassified
along with a proposed potency. If yes, the recommendation to the regulator would be to
prioritise for further analysis. If no, this would be screened as a lower priority for further
testing. This information may be of use to many regulatory agencies to assist in identifying
the specific endocrine mode of action when required by the regulatory decision context and
to protect public health and the environment.
The regulatory relevance and application of this IATA is to serve as a tool for screening
for priority setting in view of further evaluation, as well as to serve as an alternative test to
the current guideline estrogen receptor (ER) binding (TG493; OECD, 2015b), ER
transactivation (ERTA; TG455 OECD, 2015a) and uterotrophic assays (TG440; OECD,
2007). This is Tier 1 through 3 in OECD (for estrogen receptor agonistic bioactivity). In
June 2015, the US EPA accepted the ER pathway model for screening of bioactivity, where
it can substitute for the following Tier 1 assays: uterotrophic (OCSPP 890.1600), endocrine
receptor binding (OCSPP 890.1250), and endocrine receptor transactivation assays
(OCSPP 890.1300accepted that the ER pathway model gives similar predictive results for
these tests (US EPA, 2015b). Recent research is ongoing to investigate the potential for
using the full ER pathway model to predict ecological effects from ER agonist activity
(Dreier et al., 2017). Research in this area may broaden applicability of the case study for
predicting the impact of endocrine disruption of ecological endpoints like the reproductive
outcomes in fish.
Suitability for use in regulatory decisions. The ER pathway model has already undergone
extensive expert review. There have been several peer-reviewed scientific publications
relating to the ER pathway model, as listed in the References. In January 2013 in the US,
the initial work on this ER pathway model was presented to the FIFRA SAP. Many
concerns of the SAP were addressed, and the ER pathway model was again presented to
the FIFRA SAP in December 2014. In June 2015, the US EPA accepted the ER pathway
model for screening of bioactivity, where it can substitute for the following Tier 1 assays:
uterotrophic (OCSPP 890.1600), endocrine receptor binding (OCSPP 890.1250), and
endocrine receptor transactivation assays (OCSPP 890.1300). The FR notice announcing
the acceptance can be found here, and the 890-series guidelines can be found here. Further
refinement of the ER pathway model has occurred since June 2015, and more research is
being performed (such as adding metabolic competency to the assays).
In this case study, the performance of the ER pathway model has been evaluated against
current low and medium throughput guideline assays and demonstrated to have similar
accuracy for determining ER agonist activity of the tested substances. The use of this ER
pathway model has already been implemented by the US EPA as alternatives to some EDSP
Tier 1 testing (binding, ERTA, uterotrophic), and was included as a preferred data source
in recent ECHA/EFSA guidance for estrogen-related endocrine activity (ECHA and EFSA
2018). The in vitro high throughput and computational model alternatives provide a
focused evaluation of the mechanistic aspects of the ER pathway, thereby providing
specific and quantitative measures of ER agonist activity. As other regulatory agencies are
exploring the use of HTS assays and computational models in regulatory decisions, this ER
pathway model may be used as an alternative for prioritisation in order to inform these
decisions, and may also be used to provide information on the specific endocrine mode of
action (i.e. estrogen receptor agonism) when required by the regulatory decision context.
5.2. Application of IATA
Application of the IATA allows the rapid screening of many chemicals for ER agonist
activity (Figure 6). Based on the performance-based validation of this model, multiple

ENV/JM/MONO(2019)28 33
Unclassified
chemicals can be tested using as few as 4 HTS in vitro assays that encompass multiple KE
in the ER pathway as described above, and the data integrated through the ER pathway
model. The result of this IATA is a prediction of whether the chemical analysed shows ER
agonist activity along with an estimated potency. This IATA may also be used as an
alternative to existing OECD technical guidelines (e.g., TG 440). This information may be
of use to multiple regulatory agencies in order to screen and prioritise substances for
potential endocrine disruption.
Figure 6. Flow chart for analysis using this IATA.
The general steps necessary for using this IATA to determine ER agonist activity of selected chemicals.
Following selection of in vitro HTS assays to be used, run these assays along with the cytotoxicity assays and
then evaluate this data in the ER pathway model and generate a report consistent with those requested by
regulatory agencies.
5.3. Strengths and Limitations of this IATA
The strengths and weaknesses of this IATA are described in more detail in the publications
referenced above. The following are the main strengths and limitations:
Strengths:
‒ Non-animal integrated testing strategy.
Run Assays
(Assays 1 - n, cytotoxicity)
•Choose at least 4 in vitro HTS assays that fit the criteria as described. Briefly, the assays chosen must probe diverse points in the ER pathway and use diverse assay reporting technologies and cell types.
•The possible combinations of 4 assays that can be used together are listed in Annex III. More than 4 assays can be chosen, in which case the results of all chosen assays must be modelled and the results reported. Concurrently evaluate a phenotypic response, cellular proliferation.
Import Data and Run Model
•The next step is to collect data from the assays into a format that the computational model’s R-code can import and analyse. Ideally, this process will be performed automatically (electronically) to reduce the chance of user-input error.
•Although useful, advanced computational expertise is not necessary to run the model. For example, the formula used for the subset model analysis could be implemented in a spreadsheet so limited computational expertise required.
Generate Report
•The report should conform to the usual report format of executive summary, methods, results, and discussion. The report should include the raw data to allow the regulatory agencies to analyse the data themselves. It should also include summary tables with the AUC and AC50 values. Figures can be included when needed. The report should also include the results from the cytotoxicity assay.
•Any departure from the methodology of the ER pathway model as presented in this document must be thoroughly described along with the reason for the departure and the proposed impact on the screening results.

34 ENV/JM/MONO(2019)28
Unclassified
‒ ER pathway model validated against a large number of reference chemicals.
‒ Lower quantities of test material needed for testing compared to animal tests.
‒ Pathway-based, more informative on mechanism of action.
‒ Predictivity of the ER pathway model ranges from 84 – 93% when compared to
reference chemicals described above.
Limitations:
‒ Technical aspects of the assays (e.g., chemical compatibility with vehicle).
‒ Lack of metabolic competence in the assays.
‒ Focused on one endocrine disruption pathway (i.e., ER agonist activity).
‒ Simplified assays for inferring integrated physiological responses.
‒ Evaluation for non-receptor binding and events upstream of ER binding not
incorporated.
5.4. Uncertainty
There are uncertainties associated with various aspects of this IATA, including the ER
pathway, in vitro HTS assays, computational model and data analysis. The uncertainties,
assumptions, and confidence in each of these aspects are described in Table 5.
Table 5. Uncertainty of Defined Approach
Factor Uncertainty (low, medium, high)
Comment
Hypothesis used for the
Defined Approach case
study
Low The hypothesis for performing this IATA was to use a pathway-based,
computational model (based on in vitro HTS assays) to be able to screen
and prioritise chemicals for further assessment, based on whether or not
they demonstrated ER agonist activity. This methodology allows for a
more rapid analysis of a larger number of chemicals than was possible
with traditional, low-throughput in vitro or in vivo assays. Assumptions related to
key events of ER
pathway
Low Pathway frameworks are built upon assumptions of a relationship
between the MIE, subsequent KEs and the proposed apical effect or
adverse outcome. The use of these pathways may not consider that there
are unknown pathways that may impact the decisions made about a
specific substance. While it is important to consider the assumptions
related to specific pathways during any analysis, pathways are useful as
a framework for organizing the data to aid in highlighting where existing
assays can be used to inform decisions, and where gaps may exist that
require the development of new assays. Reference chemicals for
performance evaluation
of the ER model
Low Number of reference chemicals used for the performance evaluation of
the ER model is sufficient. Well documented curation of reference
chemicals based on their ER activity is included in the references cited
in this case study. Study quality was evaluated but should be noted that
this evaluation is not necessarily equivalent to a thorough assessment of
overall study quality. In vitro HTS assays and
computational model Low-medium All testing methods have some element of uncertainty. In the analysis of
the HTS assays, statistical methods are being developed to establish
uncertainty bounds around potency and efficacy values. These statistical
methods involve resampling the data and refitting the concentration
response curves thousands of times to quantitatively estimate the
uncertainty. Concentration-response parameters such as potency and
efficacy are extracted from HTS data using nonlinear regression, and

ENV/JM/MONO(2019)28 35
Unclassified
models and analyses built from these parameters are used to predict in
vivo and in vitro toxicity of thousands of chemicals. This is described in
more detail in the text. HTS uncertainty is discussed in Watt and Judson
(2018) Technical Limitations of
in vitro HTS assays Low-medium A common criticism of the in vitro HTS assays relates to technical
limitations of the in vitro HTS assay format, including limitations on
testing all chemicals due to solubility in test media, and the lack
metabolic competence, which may lead to over- or underestimation of
chemical hazard. There is ongoing research to address using these assays
with water-soluble compounds. The latter is a common criticism of all
in vitro assays, and one that is addressed in low-throughput assays with
the addition of metabolic enzyme systems to the assays (both
extracellularly and intracellularly). For the HTS assays, multiple
approaches are also being evaluated to endow a range of cell types and
cell lines with the required metabolic activity. Concordance and weight
of evidence of all data
used for justifying the
hypothesis.
Low-medium Performance and classifications derived from this ER pathway model of
1812 substances were compared to high quality in vitro and in vivo data
for specific reference chemicals. Depending on the combination of tests
used, this prediction model generally achieved accuracies of 84 to 100%
as compared to reference chemicals or the US EPA’s Endocrine
Disruptor Screening Program (EDSP) Tier 1 guideline in vitro tests and
uterotrophic assay. These results verify the applicability of the ER
pathway model as an IATA for identification of potential endocrine
disruption for a wide range of chemicals that may act as agonists of
estrogen receptor activation. Overall uncertainty of
the IATA. Low Uncertainty associated with the use of the IATA is judged to be low.
Multiple HT assays are used along the estrogen receptor signalling
pathway. This set of biochemical and cell-based in vitro assays relies on
different technologies and probes different key events in the ER
signalling pathway. Although the assays primarily use human proteins
and/or cell types, the suite of 16 assays (see Annex I) include human,
murine, and bovine ER binding assays and ER pathway interactions in a
variety of human tissue types with some redundancy across species for
some key events. The full ER pathway model accuracy was 84% to 93%
when compared to reference chemicals and predicted results of EDSP
Tier 1 guideline and other uterotrophic studies with 84% to 100%
accuracy if inconclusive chemicals are excluded (Table 3). The
performance of high-throughput assays and ER pathway model
predictions demonstrates that these methods correctly identify active and
inactive reference chemicals, provide a measure of relative ER agonist
activity, and rapidly identify chemicals with potential endocrine
bioactivities for additional screening and testing.
Accounting for uncertainty in in vitro HTS Assays and Pathway Model Analysis: In the
analysis of the HTS assays, statistical methods have been developed to establish uncertainty
bounds around potency and efficacy values. These statistical methods involve resampling
the data and refitting the concentration response curves thousands of times to quantitatively
estimate the uncertainty. Concentration-response parameters such as potency and efficacy
are extracted from HTS data using nonlinear regression, and models and analyses built
from these parameters are used to predict in vivo and in vitro toxicity of thousands of
chemicals. An explicit method for accounting for uncertainty in potency, efficacy and
binary activity (active vs. inactive) has been developed (Watt and Judson, 2018). This study
used nonparametric bootstrap resampling to calculate experimental uncertainties in
concentration-response parameters from each of the in vitro HTS assays. Then these
individual uncertainties are propagated through the integrated computational model to
produce confidence intervals in the ER pathway model scores for agonist activity.
Specifically, for each in vitro assay and concentration response curve used as input in the
model, one thousand bootstrap replicates were generated to obtain a distribution of fit

36 ENV/JM/MONO(2019)28
Unclassified
parameters, i.e. model selection, potency estimates, and activity calls. The uncertainty
associated with the concentration response in each assay was propagated to the ER pathway
model score (i.e., AUC values) by rerunning the full model 1000 times for each chemical
enabling the calculation of confidence intervals for each chemical (Figure 7).
At the individual chemical-assay level, curves with high variability are flagged for manual
inspection or retesting, focusing subject-matter-expert time on results that need further
input. This work improves the confidence of predictions made using HTS data, increasing
the ability to use this data in risk assessment. Also, by limiting the manual inspection to
only those chemicals with large variability and quantifying which curves are contributing
to that variability, subject-matter-expert time is optimised for studying only the most
difficult examples.
Figure 7. ER pathway model results for chemicals with an AUC (Agonist) value > 0.1 (Watt
and Judson, 2018).
Point estimates for agonist (red) and assay interference node (blue) values are marked by circles for all AUC
values with an upper 95% confidence interval > 0.1. Error bars indicate the 95% confidence interval obtained
by bootstrap resampling.
5.5. Strategy and Integrated Conclusion
As described above, this case study presents an IATA which is an ITS for the identification
of potential endocrine disruption through ER agonist activity by a substance. The DIP
described here includes multiple in vitro assays based on a series of molecular events that
typically occur in a nuclear receptor-mediated response. This model has been evaluated for
possible use as an IATA using 4 to 16 in vitro HTS assays. The results of these ER high-
throughput screening assays were integrated into a computational model that can
discriminate ER agonist activity from assay-specific interference and cytotoxicity. Model

ENV/JM/MONO(2019)28 37
Unclassified
scores range from 0 (no activity) to 1 (activity of 17β-estradiol). As long as the combination
of test methods employed in the DIP covers the MIE and multiple KEs in the pathway, the
performance-based evaluation of the ER pathway model demonstrates that there is
flexibility in the number and selection of in vitro HTS assays to be used to determine the
ER agonist activity of a chemical as long as the assays meet the criteria described. For a
positive result, the computational model requires concordant results for multiple assays and
KEs. These results may then contribute to the weight of evidence analysis based on other
scientifically relevant information on a chemical’s potential for endocrine disruption.
In contrast to approaches which involve some degree of expert judgement, the benefit to
using an IATA such as the integrated testing strategy presented here is that it is rule-based
and can provide predictable outcomes that can either be used on their own or considered
together with other sources of information. The IATA described here has been
demonstrated to predict ER agonist activity of both in vitro and in vivo reference chemicals
with concordance ranging from 84 – 93%. The results of this performance-based evaluation
of the ER pathway model demonstrate the accuracy, sensitivity and specificity of this IATA
for screening of chemicals for ER agonist activity. The results of the analysis of this IATA
gives scientific support for the use of these HTS assays as alternatives for existing OECD
TGs, for potential use in regulatory decisions related to estrogenic activity.

38 ENV/JM/MONO(2019)28
Unclassified
6. Acknowledgements
The authors would like to acknowledge Drs. Anna Lowit, Stan Barone and Office of
Science Coordination Policy (OSCP, OCSPP, US EPA) colleagues including Drs. Ronnie
Bever, Seema Schappelle, Sharlene Matten, Andrea Kirk as well as Mr. Kristan Markey
for their careful review of this document. Special thanks to Drs. Stacie Flood and Keith
Houck for their efforts to compile the detailed assay information in Annex I.

ENV/JM/MONO(2019)28 39
Unclassified
7. References
Auld, D. S., Thorne, N., Nguyen, D. T., and Inglese, J. (2008), “A specific mechanism for nonspecific
activation in reporter-gene assays.” ACS Chem. Biol. 3, 463–470.
Baell, J. B., and Holloway, G. A. (2010), “New substructure filters for removal of pan assay interference
compounds (PAINS) from screening libraries and for their exclusion in bioassays.” J. Med. Chem.
53, 2719–2740.
Browne, P., et al. (2017), “Application of Adverse Outcome Pathways to U.S. EPA’s Endocrine
Disruptor Screening Program”, Environmental Health Perspectives, vol 125 (9): 1-11.
https://doi.org/10.1289/EHP1304.
Browne, P., et al. (2015), “Screening Chemicals for Estrogen Receptor Bioactivity Using a
Computational Model”, Environmental Science & Technology, vol 49 (14): 8804-14.
Bruns, R. F., and Watson, I. A. (2012), “Rules for identifying potentially reactive or promiscuous
compounds.” J. Med. Chem., 55: 9763–9772.
Canadian Environmental Protection Act (CEPA) (1999), part 3 Section 44(4): Hormone disrupting
substances. http://laws-lois.justice.gc.ca/eng/acts/c-15.31/FullText.html [accessed 20 March
2019]
Colborn T, Clement C. (1992), “Chemically induced alterations in sexual and functional development:
The wildlife/human connection”. In: Advances in Modern Environmental Toxicology, Vol. 21.
Mehlman MA, ed. Princeton, NJ: Princeton Scientific Publishing Co., Inc.
Dix, D.J., et al., (2007), “The ToxCast program for prioritizing toxicity testing of environmental
chemicals.” Toxicol Sci 95(1): 5- 12.
Dreier, D. et al., (2017), “Computational analysis of the ToxCast estrogen receptor agonist assays to
predict vitellogenin induction by chemicals in male fish.” Environmental Toxicology and
Pharmacology. 53:177-183.
European Chemicals Agency and European Food Safety Agency (2018), “Guidance for the identification
of endocrine disruptors in the context of Regulations (EU) No 528/2012 and (EC) No 1107/2009.
EFSA Journal 2018;16(6):5311. https://doi.org/10.2903/j.efsa.2018.5311. ECHA-18-G-01-EN.
[accessed 21 March 2019].
European Commission (2018), “Towards a comprehensive European Union framework on endocrine
disruptors”, Communication from the Commission to the European Parliament, the Council, the
European Economic and Social Committee and the Committee of the Regions. COM(2018) 734
final. http://ec.europa.eu/transparency/regdoc/rep/1/2018/EN/COM-2018-734-F1-EN-MAIN-
PART-1.PDF [accessed 04 December 2018].
Filer, D.L. (2017), “tcpl: the ToxCast pipeline for high-throughput screening data.” Bioinformatics 33(4):
618-620. doi: 10.1093/bioinformatics/btw680.

40 ENV/JM/MONO(2019)28
Unclassified
Gore, A. C., et al. (2015), EDC-2: “The Endocrine Society's second scientific statement on endocrine-
disrupting chemicals”. Endocr Rev 36(6):E1–E150, PMID: 26544531,
https://doi.org/10.1210/er.2015-1010.
Hotchkiss, A.K., et al. (2008), “Fifteen years after “Wingspread” – Environmental endocrine disrupters
and human and wildlife health: Where we are today and where we need to go”. Toxicol Sci
105(2):235–259, PMID: 18281716, https://doi.org/10.1093/toxsci/kfn030.
Judson et al. (2017), “On selecting a minimal set of in vitro assays to reliably determine estrogen agonist
activity”. Regulatory Toxicology and Pharmacology 91: 39-49.
Judson, R.S., et al. (2015), “Integrated model of chemical perturbations of a biological pathway using 18
in vitro high-throughput screening assays for the estrogen receptor”. Toxicol Sci 148(1):137–154,
PMID: 26272952, https://doi.org/10.1093/toxsci/kfv168.
Judson, R.S., et al. (2010), “In vitro screening of environmental chemicals for targeted testing
prioritization: the ToxCast project.” Environ. Health Perspect. 118, 485–492.
Kavlock, R.J., et al., (2012), “Update on EPA’s ToxCast program: providing high throughput decision
support tools for chemical risk management.” Chem Res. Toxicol. 25, 1287–1302.
Kavlock, R.J., et al. (1996), “Research needs for the risk assessment of health and environmental effects
of endocrine disruptors: A report of the U.S. EPA-sponsored workshop.” Environ Health Perspect
104:715–740, PMID: 8880000, https://doi.org/10.2307/3432708.
Kleinstreuer, N.C., et al. (2016), “A curated database of rodent uterotrophic bioactivity.” Environ Health
Perspect 124(5):556–562, PMID: 26431337, https://doi.org/10.1289/ehp.1510183.
Miller, J. R., Thanabal, V., Melnick, M. M., Lall, M., Donovan, C., Sarver, R. W., Lee, D. Y., Ohren, J.,
and Emerson, D. (2010), “The use of biochemical and biophysical tools for triage of
highthroughput screening hits - A case study with Escherichia coli phosphopantetheine
adenylyltransferase”. Chem. Biol. Drug Des. 75, 444–454.
OECD (2007). OECD Test No. 440. Uterotrophic Bioassay in Rodents: A Short-Term Screening Test for
Oestrogenic Properties. OECD Guidelines for the Testing of Chemicals, Section 4: Health Effects.
Available: https://doi.org/10.1787/9789264067417-en.
OECD (2015a), OECD Test No. 455: Performance-Based Test Guideline for Stably Transfected
Transactivation In vitro Assays to Detect Estrogen Receptor Agonists and Antagonists, OECD
Publishing, Paris. http://dx.doi.org/10.1787/9789264243040-en
OECD (2015b), OECD Test No. 493: Performance-Based Test Guideline for Human Recombinant
Estrogen Receptor (hrER) In vitro Assays to Detect Chemicals with ER Binding Affinity, OECD
Publishing, Paris. http://dx.doi.org/10.1787/9789264242623-en
OECD (2012a), “Conceptual framework for testing and assessment of endocrine disrupters”, in Guidance
document on standardized test guidelines for evaluating chemicals for endocrine disruption
(GD150), OECD Publishing, Paris,
https://www.oecd.org/officialdocuments/publicdisplaydocumentpdf/?cote=env/jm/mono%282012
%2922&doclanguage=en.

ENV/JM/MONO(2019)28 41
Unclassified
OECD (2012b), OECD Test No. 457: Estrogen Receptor Transactivation Test Method for Identifying
Estrogen Receptor Agonists and Antagonists, OECD Publishing, Paris.
http://dx.doi.org/10.1787/9789264185395-en
Soto, A.M. and C. Sonnenschein. (2010), “Environmental causes of cancer: Endocrine disruptors as
carcinogens.” Nat Rev Endocrinol 6(7):364–371, PMID: 20498677,
https://doi.org/10.1038/nrendo.2010.87.
Thorne, N., Auld, D. S., and Inglese, J. (2010), “Apparent activity in high-throughput screening: origins
of compound-dependent assay interference.” Curr. Opin. Chem. Biol. 14, 315–324.
US EPA (Environmental Protection Agency) (2015a), “Toxicity Forecaster (ToxCast) Data”,
https://www.epa.gov/chemical-research/toxicity-forecaster-toxcasttm-data [accessed 22 March
2018].
US EPA (2015b), Use of High Throughput Assays and Computational Tools; Endocrine Disruptor
Screening Program; Notice of Availability and Opportunity for Comment.
https://www.federalregister.gov/documents/2015/06/19/2015-15182/use-of-high-throughput-
assays-and-computational-tools-endocrine-disruptor-screening-program-notice [accessed 13
September 2018].
US EPA (2015c), Transmittal of Meeting Minutes of the FIFRA Scientific Advisory Panel Meeting held
on “Integrated Endocrine Bioactivity and Exposure-Based Prioritization and Screening.”
https://www.epa.gov/sites/production/files/2015-06/documents/120214minutes.pdf [accessed 13
September 2018].
US EPA (2014), Integrated Bioactivity and Exposure Ranking: A Computational Approach for the
Prioritization and Screening of Chemicals in the Endocrine Disruptor Screening Program, Report
Number. EPA-HQ-OPP-2014-0614-0003. https://www.regulations.gov/document?D=EPA-HQ-
OPP-2014-0614-0003 [accessed 23 March 2018].
US EPA (2002), Summary of the Federal Food, Drug, and Cosmetic Act 21 U.S.C. §301 et seq.
https://www.epa.gov/laws-regulations/summary-federal-food-drug-and-cosmetic-act [accessed
20 March 2019].
Watt, E.D. and R.S. Judson (2018), “Uncertainty Quantification in ToxCast High Throughput
Screening,” PLoS One. 2018; 13(7): e0196963. https://doi.org/10.1371/journal.pone.0196963
WHO (World Health Organization) (2002), “Global assessment of the state-of-the science of endocrine
disruptors”. http://www.who.int/ipcs/publications/new_issues/endocrine_disruptors/en/ [accessed
18 March 2018].
WHO/UNEP (United Nations Environmental Programme). (2012). “State of the science of endocrine
disrupting chemicals – 2012”. http://www.who.int/ceh/publications/endocrine/en/ [accessed 18
March 2018].

42 ENV/JM/MONO(2019)28
Unclassified
Annex I. Detailed assay descriptions in OECD GD211 Format
Please refer to the separate publication for full Annex I
ENV/JM/MONO(2019)28/ANN1

ENV/JM/MONO(2019)28 43
Unclassified
Annex II. Curated reference chemical lists.
Table AII-1. In vitro Estrogen Receptor (ER) Agonist Reference Chemicals
CASRN Chemical name Agonist potency a ER pathway model score
57−63−6 17α-Ethinyl estradiol strong 1
84−16−2 meso-Hexestrol strong 0.99
56−53−1 Diethylstilbestrol (DES) strong 0.94
50−28−2 17β-Estradiol strong 0.94
57−91−0 17α-Estradiol moderate 1.06
53−16−7 Estrone moderate 0.81
140−66−9 4-tert-Octylphenol moderate 0.39
446−72−0 Genistein weak 0.54
77−40−7 Bisphenol B weak 0.49
80−05−7 Bisphenol A weak 0.45
486−66−8 Daidzein weak 0.44
521−18−6 5α-Dihydrotestosterone weak 0.40
789−02−6 o,p′-DDT weak 0.39
599−64−4 4-Cumylphenol weak 0.38
143−50−0 Kepone weak 0.17
58−18−4 17α-Methyltestosterone very weak 0.50
520−36−5 Apigenin very weak 0.31
72−43−5 Methoxychlor very weak 0.25
520−18−3 Kaempferol very weak 0.25
85−68−7 Butylbenzyl phthalate very weak 0.18
480−40−0 Chrysin very weak 0.13
60168−88−9 Fenarimol very weak 0.11
104−40−5 p-n-Nonylphenol very weak 0.1
120−47−8 Ethylparaben very weak 0.1
72−55−9 p,p′-DDE very weak 0.1
84−74−2 Di-n-butyl phthalate very weak 0.03
115−32−2 Dicofol very weak 0
117−81−7 Diethylhexyl phthalate very weak 0
52−86−8 Haloperidol inactive 0.01
52−01−7 Spironolactone inactive 0
50−22−6 Corticosterone inactive 0
13311−84−7 Flutamide inactive 0
1912−24−9 Atrazine inactive 0
32809−16−8 Procymidone inactive 0
330−55−2 Linuron inactive 0
50−55−5 Reserpine inactive 0
52806−53−8 Hydroxyflutamide inactive 0
57−30−7 Phenobarbital Sodium inactive 0
65277−42−1 Ketoconazole inactive 0
66−81−9 Cycloheximide inactive 0
a: Reference chemical potency, determined by concentration required to elicit 50% of the maximal response
(AC50), in low throughput in vitro ER assays. More details on each chemical can be found through the
hyperlinked CASRN. Strong = AC50 < 0.0001 μM, moderate = AC50 <0.1 μM, weak = AC50 < 1 μM, very
weak = all other activities, and inactive = no detected activity.

44 ENV/JM/MONO(2019)28
Unclassified
Table AII-2. In vivo Estrogen Receptor (ER) Agonist Reference Chemicals with at Least two
Independent Active or Inactive Guideline-like Uterotrophic Studies (Browne et al., 2015)
CASRN Chemical name Active a Inactive a Bioactivity ER pathway model score
57−91−0 17α-Estradiol 2 0 active 1.06
57−63−6 Ethinyl Estradiol 59 0 active 1
56−53−1 Diethylstilbestrol (DES) 8 1 active 0.94
50−28−2 Estradiol 25 0 active 0.94
474−86−2 Equilin 2 0 active 0.82
53−16−7 Estrone 9 0 active 0.81
50−27−1 Estriol 4 0 active 0.79
72−33−3 Mestranol 3 0 active 0.74
17924−92−4 Zearalenone 4 0 active 0.71
1478−61−1 Bisphenol AF 4 0 active 0.55
446−72−0 Genistein 27 1 active 0.54
68−22−4 Norethindrone 2 0 active 0.52
58−18−4 Methyltestosterone 3 0 active 0.50
77−40−7 Bisphenol B 2 0 active 0.49
80−05−7 Bisphenol A 37 6 active 0.45
104−43−8 4-Dodecylphenol 3 0 active 0.41
521−18−6 Dihydrotestosterone 3 0 active 0.4
131−55−5 Benzophenone-2 6 0 active 0.40
140−66−9 4-(1,1,3,3-Tetramethylbutyl)phenol 3 1 active 0.39
789−02−6 o,p′-DDT 15 1 active 0.39
599−64−4 p-Cumylphenol 2 0 active 0.38
5153−25−3 Benzoic acid, 4-hydroxy-, 2-ethylhexyl ester 2 0 active 0.37
80−46−6 4-(1,1-Dimethylpropyl)phenol 4 0 active 0.28
131−56−6 2,4-Dihydroxybenzophenone 3 0 active 0.27
80−09−1 Bisphenol S 2 0 active 0.26
72−43−5 Methoxychlor 18 1 active 0.25
94−26−8 Butylparaben 8 2 active 0.25
98−54−4 p-tert-Butylphenol 2 0 active 0.16
104−40−5 Nonylphenol 5 4 active 0.10
556−67−2 Octamethylcyclotetrasiloxane 3 0 active 0
520−18−3 Kaempferol 0 3 inactive 0.25
84−74−2 Dibutyl phthalate 0 2 Inactive 0.03
84−61−7 Dicyclohexyl phthalate 0 2 inactive 0.02
84−75−3 Dihexyl phthalate 0 2 inactive 0.01
51630−58−1 Fenvalerate 0 2 inactive 0.01
103−23−1 Bis(2-ethylhexyl)hexanedioate 0 2 inactive 0
117−81−7 Bis(2-ethylhexyl)phthalate 0 2 inactive 0
1461−22−9 Tributylchlorostannane 0 2 inactive 0
1912−24−9 Atrazine 0 2 inactive 0
61−82−5 Amitrole 0 2 inactive 0
84−66−2 Diethyl phthalate 0 2 inactive 0
87−86−5 Pentachlorophenol 0 2 inactive 0
99−96−7 4-Hydroxybenzoic acid 0 2 inactive 0
a: The numbers of guideline-like active and inactive study results are reported for each chemical. More details
on each chemical can be found through the hyperlinked CASRN.

ENV/JM/MONO(2019)28 45
Unclassified
Annex III. The Possible Combinations of 7 or Fewer Assays that Can Be
Used in this IATA
This table shows all subset models with 7 or fewer assays with at least 94% balanced
accuracy (BA) from all chemicals, and the in vitro and in vivo reference chemical sets.
The results of the subset analysis demonstrated that there were many subsets of assays that performed at levels
comparable to the full 16-assay model, including some that included as few as 4 assays. This table shows all
subset models with 7 or fewer assays that achieve BA ≥94% for the full chemical set and for the in vitro and in
vivo subsets. Almost all of these models use the cell-free human and bovine radioligand binding assays, the
ATG TRANS transactivation assay and the ACEA cell proliferation assay. None of the subset models use the
Tox21 transactivation assays. The main difference between these models is which of the Odyssey Thera
dimerisation assays used. Green squares with a Y = those used in the subset; remaining squares are those not
used in the subset.

46 ENV/JM/MONO(2019)28
Unclassified
Annex IV. Main Scientific Papers
Browne, P., et al. (2015), “Screening Chemicals for Estrogen Receptor Bioactivity Using a
Computational Model”, Environmental Science & Technology, vol 49 (14): 8804-14.
This publication provided description of the performance-based evaluation of the ER
pathway model and general description of the reference chemicals used.
Kleinstreuer, N.C., et al. (2016) “A curated database of rodent uterotrophic bioactivity.” Environ Health
Perspect 124(5):556–562, PMID: 26431337, https://doi.org/10.1289/ehp.1510183.
This publication provided detailed information on the curation of the in vivo reference
chemicals used in the performance evaluation of the ER pathway model.
Judson, R.S., et al. (2015), “Integrated model of chemical perturbations of a biological pathway using 18
in vitro high-throughput screening assays for the estrogen receptor”. Toxicol Sci 148(1):137–154,
PMID: 26272952, https://doi.org/10.1093/toxsci/kfv168.
This publication provided the basis of the ER pathway model and provides a general
overview of the model.
Judson et al. (2017), “On selecting a minimal set of in vitro assays to reliably determine estrogen agonist
activity”. Regulatory Toxicology and Pharmacology 91: 39-49.
This publication describes the further work which allowed the 16-assay ER pathway model
to be refined to a subset of as few as 4 assays.
Watt, E.D. and R.S. Judson (2018), Uncertainty Quantification in ToxCast High Throughput Screening,
PLoS One. 2018; 13(7): e0196963. https://doi.org/10.1371/journal.pone.0196963
This publication proposes an analysis of the uncertainty related to the ER pathway model.