case study of san francisco’s auxiliary water supply...
TRANSCRIPT

Eleventh U.S. National Conference on Earthquake Engineering Integrating Science, Engineering & Policy June 25-29, 2018 Los Angeles, California
DETERMINING WATER DISTRIBUTION
SYSTEM PIPE REPLACEMENT GIVEN
RANDOM DEFECTS
– Case Study of San Francisco’s Auxiliary
Water Supply System
Charles Scawthorn1, David Myerson2, Douglas York3, Eugene Ling3
ABSTRACT
A key question for water systems is the ranking, importance or priority of a network’s pipes is
addressed by a new algorithm termed Pipe Importance and Priority Evaluation (PIPE algorithm),
the essence of which is a ranking of each pipe’s Average Deficit Contribution (ADC), defined as
the average contribution of each pipe to each demand point’s deficit (deficit is the difference
between required and furnished flow at a demand point). The PIPE algorithm was validated by
case studies of a gridded network and then applied to San Francisco’s seismic environment and a
scenario earthquake – essentially a repeat of the 1906 event. Permanent ground displacements
(PGD) and shaking hazard were determined with special emphasis placed on capturing the
randomness of shaking effects using recent work on efficient selection of hazard maps for
simulation. Pipe breaks due to shaking and PGD were applied as random defects conditioned on
hazard in Monte Carlo simulations (in some cases, more than 100,000 trials) of the AWSS, in which
each trial included a pressure-driven hydraulic analysis of the damaged system, using EPANET in
a first such analysis. Application of the PIPE algorithm resulted in a ranking of all 6,000 pipes in
the AWSS, based on each pipe’s contribution to average demand point flow deficits.
1. SPA Risk LLC and Visiting Researcher, Univ. California, Berkeley
2. San Francisco Public Utilities Commission
3. San Francisco Public Works
Scawthorn, C., Myerson, D., York, D., Ling, E. Determining Water Distribution System Pipe Replacement Given Random Defects– Case Study of San Francisco’s Auxiliary Water Supply System. Proceedings of the 11th National Conference in Earthquake Engineering, Earthquake Engineering Research Institute, Los Angeles, CA. 2018

Eleventh U.S. National Conference on Earthquake Engineering Integrating Science, Engineering & Policy June 25-29, 2018 Los Angeles, California
Determining Water Distribution System Pipe Replacement
Given Random Defects – Case Study of San Francisco’s
Auxiliary Water Supply System
Charles Scawthorn1, David Myerson2, Douglas York3, Eugene Ling3
ABSTRACT
A key question for water systems is the ranking, importance or priority of a network’s pipes is addressed by a new
algorithm termed Pipe Importance and Priority Evaluation (PIPE algorithm), the essence of which is a ranking of each
pipe’s Average Deficit Contribution (ADC), defined as the average contribution of each pipe to each demand point’s
deficit (deficit is the difference between required and furnished flow at a demand point). The PIPE algorithm was
validated by case studies of a gridded network and then applied to San Francisco’s seismic environment and a scenario
earthquake – essentially a repeat of the 1906 event. Permanent ground displacements (PGD) and shaking hazard were
determined with special emphasis placed on capturing the randomness of shaking effects using recent work on efficient
selection of hazard maps for simulation. Pipe breaks due to shaking and PGD were applied as random defects
conditioned on hazard in Monte Carlo simulations (in some cases, more than 100,000 trials) of the AWSS, in which
each trial included a pressure-driven hydraulic analysis of the damaged system, using EPANET in a first such analysis.
Application of the PIPE algorithm resulted in a ranking of all 6,000 pipes in the AWSS, based on each pipe’s
contribution to average demand point flow deficits.
Introduction
For a water distribution system (WDS) subjected to random leaks or breaks (collectively termed
“defects”), key questions exist as to which pipe in the network should be the first pipe to be
mitigated (the “Most Important Pipe”, MIP), which pipe the second, and so on – in other words,
what is the ranking, importance or priority of the network’s pipes – which are the MIPs? A pipe’s
importance with regard to reliability is a function of several factors including the demands on the
network, a pipe’s ‘hydraulic location’ in the network, and the likelihood of failure or defect of all
pipes in the network.
1. SPA Risk LLC and Visiting Researcher, Univ. California, Berkeley
2. San Francisco Public Utilities Commission
3. San Francisco Public Works
Scawthorn, C., Myerson, D., York, D., Ling, E. Determining Water Distribution System Pipe Replacement Given Random Defects– Case Study of San Francisco’s Auxiliary Water Supply System. Proceedings of the 11th National Conference in Earthquake Engineering, Earthquake Engineering Research Institute, Los Angeles, CA. 2018

Consider a simple gridded network supplied by one pipe which has a very low likelihood of defect.
While the network is not functional if that pipe fails, by definition it is very unlikely to do so. If
the network has one demand point served by redundant pipes in the grid with significantly higher
likelihood of failure, then the failure of one or more of these pipes, which is much more likely to
occur, may reduce likelihood of furnishing the required demand – that is, reduce the network’s
reliability. Given limited resources, which of these pipes should first be mitigated, so as to most
improve the reliability of the network? Solution of the MIP problem – that is identification of pipe
importance is an important problem for WDS operators, and has so far eluded solution although it
has been the subject of much research [1-4]
San Francisco Auxiliary Water Supply System (AWSS)
The issue of determining pipe importance emerged as a key problem for the City of San Francisco
in considering maintenance, replacement and enhancement of its Auxiliary Water Supply System
(AWSS). The San Francisco Auxiliary Water Supply System (AWSS) is a water supply system
intended solely for the purpose of assuring adequate water supply for firefighting purposes. It is
separate and redundant from the domestic water supply system of San Francisco, and until recently
was owned and operated by the San Francisco Fire Department (SFFD). It was built in the decade
following the 1906 San Francisco earthquake and fire, primarily in the north-east quadrant of the
City (the urbanized portion of San Francisco in 1906 and still the Central Business District), and
has been gradually extended into other parts of the City, although the original portion still
constitutes the majority of the system. The AWSS consists of several major components, Figure 1,
including: (1) Static Supplies: The main source of water under ordinary conditions is a 10 million
gallon reservoir centrally located on Twin Peaks, the highest point within San Francisco (see
Figure 1). Water from this source supplies three zones including the Twin Peaks zone, the Upper
Zone (pressure reduced at the 0.5 million gallon Ashbury Tank) and the Lower Zone (pressure
reduced at the 0.75 million gallon Jones St. Tank); (2) Pump Stations: Because the Twin peaks
supply may not be adequate under emergency conditions, two pump stations exist to supply water
from San Francisco Bay. Pump Station No.1 is located at 2nd and Townsend Streets, while Pump
Station No.2 is located at Aquatic Park - each has 10,000 gpm at 300 psi capacity. Both pumps
were originally steam powered but were converted to diesel power in the 1970's; (3) Pipe Network:
The AWSS supplies water to dedicated street hydrants by a special pipe network with a total length
of approximately 120 miles, Figure 2. The pipe is bell and spigot, originally extra heavy cast iron
(e.g., 1" wall thickness for 12" diameter), and extensions are now Schedule 56 ductile iron (e.g.,
.625" wall thickness for 12" diameter). Restraining rods connect pipe lengths across joints at all
turns, tee joints, hills and other points of likely stress. San Francisco had sustained major ground
failures (leading to water main breaks) in zones generally corresponding to filled-in land and thus
fairly well defined. Because it was anticipated these ground failures could occur again, these zones
(termed "infirm areas") were mapped and the pipe network was specially valved where it entered
these infirm areas. Under ordinary conditions, all of the gate valves isolating the infirm areas are
closed, except one, so that should water main breaks occur in these infirm areas, they can be
quickly isolated. On the other hand, should major fire flows be required in these areas, closed gate
valves can be quickly opened, increasing the water supply significantly; (4) Other portions,
including fireboats, underground cisterns and a Portable Water Supply System
(i.e., hose tenders each with a mile of Large Diameter Hose). The AWSS is a system remarkably
well designed to reliably furnish large amounts of water for firefighting purposes under normal

and post-earthquake conditions. However, the AWSS is now more than one hundred years old,
essentially failed in the 1989 Loma Prieta earthquake (Scawthorn et al, 1990) and is in need of
pipe replacement. Additionally, its reliability has never been quantified.
Figure 1 San Francisco AWSS network with Fire Department Infirm Zones, Seismic Isolation
Zones, Seismic Hazard Zones, Pump Stations, Tanks and Reservoir
Pipe Importance And Priority Evaluation (Pipe) Algorithm
In order to assess the reliability of the AWSS, and identify which are the MIPs, a new algorithm
termed Pipe Importance and Priority Evaluation (PIPE) was developed (by the second author)
which solves this problem. The essence of the PIPE algorithm is determining each pipe’s Average
Deficit Contribution (ADC), defined as the average contribution of each pipe to each demand
point’s deficit (deficit is the difference between required and furnished flow at a demand point).
Deficits are determined via Monte Carlo simulation in which for each trial multiple simultaneous
defects are randomly imposed (e.g., if earthquake is considered, based on probability of ground
motions and pipe vulnerability) and the network’s hydraulics solved via pressure driven analysis
(PDA). Given the set of trials, generalized linear modeling is then employed to determine each
pipe’s ADC, which are then ranked in descending order. The ranking is the relative importance of
each pipes’ contribution to the average of deficits for all simulations. The pipe with highest ADC
is the pipe that contributes most to the demand’s deficit, second highest ranked pipe contributes
next most, and so on. If the highest ranked pipe is mitigated, that mitigation contributes most to
overall average deficit reduction, and so on. ADC’s can be individually calculated for multiple
demand points, or for any combination such as the total of all. A key aspect in implementing the
PIPE algorithm is the determination of pipe weights via generalized linear modeling. The PIPE
algorithm was validated by application to a series of case studies of a gridded network with
multiple demand points.

A simple example illustrating the the PIPE algorithm is shown in Figure 2, which is a 10x10 grid
of pipes all 100 feet in length and 12 inch diameter, except:
• P221 which is 24 inch diameter (100 ft. long) and feeds the system from Reservoir R1 at
elevation 100 ft.,
• pipe P1 (E-W pipe at NW corner of grid) which is 100 inch diameter (100 ft. long),
• P222 which is 6 inch diameter and 10 ft. in length, and which is a check valve (CV) allowing
flow towards J1 but not towards J100. This is combined with a 12 inch diameter flow control
valve (FCV) VLV1 set to 900 gpm, which is effectively an emitter with a maximum flow of
900 gpm. The CV-FCV combination is a modification to EPANET which simulates a broken
pipe and avoids negative pressures [5]. This 900 gpm is the only demand on the (unbroken)
system.
Figure 3 shows the EPANET results for the unbroken system. With the exception of flow at the
NW corner, particularly in pipe P1 (which is 48 inch diameter), the flow is relatively symmetric
(if P1 is set 12 inch diameter, the flow pattern is perfectly symmetric about the E-Q J50-J510 line).
For the unbroken system, the MIPs are easily identified as those carrying the most flow – P221
and P222, followed by P1, P101, P120 and so on.
Figure 2 Example grid: (r) pipes; (mid) joints numbering; and (l) detail of CV/FCV assemblage
However, if several pipes have varying probability of defects, the problem becomes much
more difficult. For example, set only three pipes to have the following independent probabilities
of defect: P1 (48 inch diam., probability of defect = p(d) = 0.01 per annum, P91 (12 inch diam.,
p(d) = 0.05), and P110 (12 inch diam., p(d) = 0.20). Thus, P1 is the largest pipe in the system (and
has the greatest flow in the unbroken system) but has a low probability of defect, P91 has an
intermediate vulnerability but is relatively close to the demand point, and P110 has by far the
greatest vulnerability but is “far” from the demand point and has rather low flow (in the unbroken
system). Which of these is the highest priority for mitigation is very unclear – that is, which of
these pipes if mitigated (i.e., set to p(d) = 0, no vulnerability) will reduce demand deficit (i.e., flow
required – flow furnished, at the demand) the most?
To solve this problem, we run EPANET with the above configuration many times. Each run (or
trial) randomly allows any or all of the vulnerable pipes to break or leak, per the probabilities of
defect. We tabulate run results in a Deficit vector D of demand flow deficits for each run, and a

FR (flow rate) matrix which for each run is the flow from each pipe’s defect – if a pipe has no
defect, the FR entry is zero. That is:
|D| = |FR||w| (1)
where D is an Nx1 vector, FR is an n x p matrix and w is a px1 vector of pipe weights, with n
being the number of trials, and p the number of pipes. The pipe weights w are unknown and
found via linear regression.
Figure 3 EPANET pipe flow results, unbroken system -
Using the above, we ran 5,500 trials (25 times the number of pipes) of the example grid, resulting
in P1, P91 and P110 having 70, 301 and 998 defects, respectively (i.e., in the simulation the defect
rates were 0.013, 0.055 and 0.181, respectively – more runs would have had defect rates closer to
the specified rates). Using the Bayesian Regression package in python, the weights w were found
to be 0.00013, 0.1462 and 0.00693 for the three pipes (all others negligibly small or zero). The
ADC for each pipe is the found as:
(2)
where subscript i refers to pipe i and summation is over n simulations – that is, for a given pipe,
the average of the column vector in FR corresponding to that pipe is multiplied by the regressed

weight for that pipe. This closely approximates that pipe’s average contribution to the overall
deficit in demand furnished – its Average Deficit Contribution, ADC (units for example of gpm).
For the example network, the ADC values were found to be 0.034, 1.23 and 1.79 for P1, P91 and
P110, respectively. Thus, in this example, reducing P110’s defect rate to zero will reduce the deficit
more than either of the other two pipes. To test this, we set P110 defect rate to zero, resulting in
an average deficit for 5,500 trials of 1.80 gpm. Similarly, setting P1 and P91 to zero yielded
average deficits of 2.17 and 1.84 gpm, respectively. While the differences are admittedly small in
this example, they’re intended simply to be illustrative.
Application to and Analysis of the AWSS
The application of the PIPE algorithm is shown in Figure 4 and began with a review of San
Francisco’s seismic environment and selection of a suitable scenario earthquake, essentially a
repeat of the 1906 event. Permanent ground displacements and shaking hazard were determined
for this scenario, with special emphasis placed on capturing the randomness of shaking effects
using recent work on efficient selection of hazard maps for simulation [6]. In Figure 4, the
distribution of ground shaking (center top map, PGV) is one of fifteen such maps, which captured
the uncertainty associated with this one earthquake scenario ground shaking.
Ground shaking will also result in the outbreak of numerous simultaneous fires, the distribution of
such ignitions depending on the nature and distribution of buildings and other fuels [7-9] which
was then quantified, taking into account fire department operations and resources, in terms of
firefighting water demands on the AWSS, center left. These demands, discretized at 37 points in
the network (corresponding to one demand point per Fire Response Area, FRA) and totaling in
aggregate about 65,000 gpm, are the demands that the AWSS is required to meet.
Countering these demands are additional pressure-driven demands on the AWSS due to breaks and
leaks, caused by ground shaking (upper right) and ground failure (right side of the figure). Recent
work on pipe breaks due to shaking [10], and due to permanent ground displacement [11] were
employed to model defects randomly conditioned on hazard. This process was repeated in Monte
Carlo simulations (in some cases, more than 100,000 trials) of the AWSS, in which each trial
included a pressure-driven hydraulic analysis of the damaged system, using EPANET. Two
aspects of this analysis warrant discussion: (a) the pressure-driven analysis, and (b) the Monte
Carlo simulation, both employing EPANET [12].
The pressure-driven hydraulic analysis of the damaged system is among the first such analyses of
its kind using EPANET. Prior analyses using EPANET [13] have been demand-driven and have
suffered the flaw of generating ‘negative pressures’ in which imposed demands coupled with leaks
and breaks, the combined effects of which cannot be met from hydraulic sources, result in
analytical solutions yielding negative pressures in selected pipes, thus causing spurious inflows at
selected sources, leaks or breaks. Until recently, the solution to this problem has been to remove
pipes with negative pressures from the network and re-analyze, a clearly unsatisfactory solution.
However, Sayyed et al [5] recently developed “a simple non-iterative method … in which artificial
string of Check Valve, Flow Control Valve, and Emitter are added in series at each demand node
to model pressure deficient water distribution network”, which solves this problem.
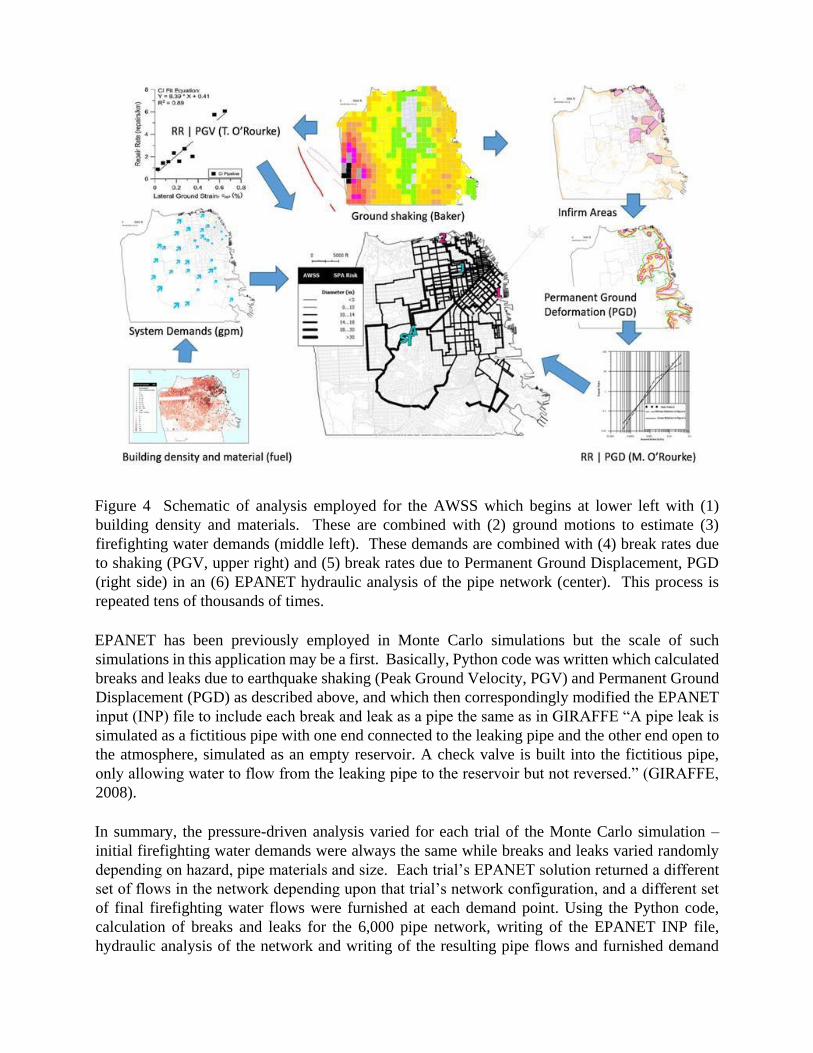
Figure 4 Schematic of analysis employed for the AWSS which begins at lower left with (1)
building density and materials. These are combined with (2) ground motions to estimate (3)
firefighting water demands (middle left). These demands are combined with (4) break rates due
to shaking (PGV, upper right) and (5) break rates due to Permanent Ground Displacement, PGD
(right side) in an (6) EPANET hydraulic analysis of the pipe network (center). This process is
repeated tens of thousands of times.
EPANET has been previously employed in Monte Carlo simulations but the scale of such
simulations in this application may be a first. Basically, Python code was written which calculated
breaks and leaks due to earthquake shaking (Peak Ground Velocity, PGV) and Permanent Ground
Displacement (PGD) as described above, and which then correspondingly modified the EPANET
input (INP) file to include each break and leak as a pipe the same as in GIRAFFE “A pipe leak is
simulated as a fictitious pipe with one end connected to the leaking pipe and the other end open to
the atmosphere, simulated as an empty reservoir. A check valve is built into the fictitious pipe,
only allowing water to flow from the leaking pipe to the reservoir but not reversed.” (GIRAFFE,
2008).
In summary, the pressure-driven analysis varied for each trial of the Monte Carlo simulation –
initial firefighting water demands were always the same while breaks and leaks varied randomly
depending on hazard, pipe materials and size. Each trial’s EPANET solution returned a different
set of flows in the network depending upon that trial’s network configuration, and a different set
of final firefighting water flows were furnished at each demand point. Using the Python code,
calculation of breaks and leaks for the 6,000 pipe network, writing of the EPANET INP file,
hydraulic analysis of the network and writing of the resulting pipe flows and furnished demand

point flows, required about 1 second per trial on a 2016 vintage laptop Windows 10 personal
computer, or about 8 hours for 30,000 trials. We believe this use of EPANET in large
pressuredriven hydraulic Monte Carlo analyses is the first such analysis. Figure 5 shows a
comparison of demand deficits for the AWSS network as determined from nearly 30,000 EPANET
simulations (abscissa) versus demand deficits based on linear regression (ordinate), with an
indicated value of r = 0.989.
Figure 5 Comparison of deficits for AWSS network for 29,786 trials estimated using linear
regression (ordinate) vs. source data from hydraulic analyses (abscissa).
The resulting set of simulations provided the basis for correlation of each pipe’s break or leak rate
against the “deficit” (difference between FRA demand and furnished flow). Application of the
PIPE algorithm resulted in determining which pipes contributed most to FRA deficits. Each pipe’s
contributions when averaged over the entire set of simulations were termed that pipe’s Average
Deficit Contribution or ADC, and are a function of the frequency and severity of pipe defect,
combined with its location in the hydraulic path. The pipe with the highest ADC is the “most
important pipe”, in that it contributes the most to the overall deficit in firefighting water flow.
Ranking of all 6,000 pipes in the AWSS, based on each pipe’s ADC, provides an absolute measure
of pipe importance, for that network. However, once the “most important pipe” is identified and
upgraded in some manner so as to reduce the frequency and severity of pipe defect, another set of
simulations is required to identify the ‘next most important pipe’.
Using the above iterative or cascading series of Monte Carlo simulations, the AWSS was analyzed,
resulting in an identification of tranches of pipes for upgrading, as shown in Figure 6. With initial
pipe improvements, losses in firefighting water supply are greatly reduced, Figure 7, which shows
that fixing only 25 pipes reduces losses by almost 4,900 gpm. Additional pipe improvements
however quickly reaches a point of diminishing returns.

Figure 6 Four tranches of pipe importance – red indicates the 25 pipes contributing most to
overall deficits in firefighting water supply, orange the next 25, blue the next 50 and
so on.
Figure 7 Change in system deficit as pipes are mitigated. Upgrading the first 25 pipes reduced
average deficits in firefighting water furnished by about 4,893 gpm. Fixing the next
25 pipes reduces the deficit by an additional 943 gpm, fixing the next 50 reduces the
deficit by 228 gpm, and fixing the next 100 pipes only reduces the deficit by 197 gpm.
Concluding Remarks
San Francisco suffered a loss of 28,000 buildings in the 1906 earthquake, 80% of which loss was
attributed to the fire that followed the earthquake. The fire, the largest peace-time urban fire in
history to that time and only exceeded since by the fire following the 1923 Tokyo earthquake, grew
to such size largely due to many pipe breaks in the water supply network and resulting lack of
firefighting water supply. Following the 1906 event, San Francisco was built largely as before,

and is today a very dense concentration of highly flammable wood buildings in a high seismicity
region. The city’s AWSS is a piece of infrastructure critical to reducing fire losses in a future
earthquake, and is required to be highly reliable. The analysis of such a system’s reliability, and
the identification of which pipes contributed most to lack of reliability, proved to be daunting task.
Pursuing the solution resulted in the development of a new algorithm that rigorously permits
identification of those pipes contributing most to lack of reliability, and development of a capital
improvement program for upgrading the system and achieving high reliability.
Acknowledgements
The advice and assistance of of Profs. Jack. W. Baker (Stanford University), Thomas D. O’Rourke
(Cornell University) and Michael O’Rourke (Rensselaer Polytechnic Institute) is gratefully
acknowledged.
References
1. Kansal, M.L. and A. Kumar, Reliability analysis of water distribution systems under uncertainty. Reliability
Engineering and System Safety, 1995. 50(51-59). 2. Schneiter, C.R., et al., Capacity reliability of water distribution networks and optimum rehabilitation decision
making. Water Resources Research, 1996. 32(7): p. 2271-2278. 3. Dasic, T. and B. Djordjevic, Method for water distribution systems reliability evaluation. 2004. 4. Wagner, B.J.M., U. Shamir, and H. Marks, Water Distribution Reliability: Simulation Methods. Journal of
Water Resources Planning and Management, 1988. 114(3): p. 276-294. 5. Sayyed, M.A., R. Gupta, and T. Tanyimboh, Modelling pressure deficient water distribution networks in
EPANET. Procedia Engineering, 2014. 89: p. 626-631. 6. Miller, M. and J.W. Baker, Ground-Motion Intensity And Damage Map Selection For Probabilistic
Infrastructure Network Risk Assessment Using Optimization. Earthquake Engineering & Structural
Dynamics, 2015. 44(7): p. 1139-1156. 7. Scawthorn, c., J.M. Eidinger, and a.J. Schiff, eds. Fire Following Earthquake. Technical Council on Lifeline
Earthquake Engineering Monograph No. 26. 2005, American Society of Civil Engineers: Reston. 345pp. 8. Scawthorn, C., Analysis Of Fire Following Earthquake Potential For San Francisco, California. 2010, SPA
Risk LLC, for the Applied Technology Council on behalf of the Department of Building Inspection: City and
County of San Francisco. p. 54. 9. Scawthorn, C., Frank T. Blackburn. Performance Of The San Francisco Auxiliary And Portable Water Supply
Systems In The 17 October 1989 Loma Prieta Earthquake. in 4th U.S. National Conference on Earthquake
Engineering. 1990. Palm Springs, CA. 10. O'Rourke, T.D., et al., Earthquake response of underground pipeline networks in Christchurch, NZ.
Earthquake Spectra, 2014. 30(1): p. 183-204. 11. O'Rourke, M. and T. Vargas-Londono, Analytical Model For Segmented Pipe Response To Tensile Ground
Strain. Earthquake Spectra, 2016. 32(4): p. 2533-2548. 12. Rossman, L.A., Epanet User Manual. 2000, Water Supply and Water Resources Division, National Risk
Management Research, LaboratoryEnvironmental Protection Agency: Cincinnatti. p. 200. 13. Cornell University, GIRAFFE User's Manual, Version 4.2. 2008, Cornell University: Ithaca.