case study of property value transfer attributed to
TRANSCRIPT
Journal of Public Transportation, Vol. 23, No. 1, 2021 15
Case Study of Property Value Transfer Attributed to Transit: Spatial and Temporal Hedonic Price Impact of Light Rail in Minnesota’s Twin Cities
© 2021 Kate Ko https//doi.org/10.5038/2375-0901.23.1.2 ISSN: 1077-291X | Licenced under Creative Commons License Attribution - Noncommercial 4.0
The Journal of Public Transportation is published by the Center for Urban Transportation Research at the University of South Florida
Journal of Public Transportation
Case Study of Property Value Transfer Attributed to Transit: Spatial and Temporal
Hedonic Price Impact of Light Rail in Minnesota’s Twin Cities
Kate KoHDR
AbstractDoes the proximity of transit increase property values, and can one example apply to another? Using a spatial and temporal hedonic price framework, this study of light rail transit’s impact on residential property values compares the station area property impacts of the Green and Blue Lines in Saint Paul and Minneapolis, Minnesota. The study also points to when “value transfer” (used here to describe the comparison and application of property value impacts near transit) is appropriate, and what practitioners should keep in mind to maximize the effectiveness of the exercise. In the case of value transfer for transit, the study finds that intimate local knowledge matters more than special modeling specifications to appropriately capture the impacted properties and transfer the return of investment.
Keywords: Hedonic pricing, value capture, value transfer
Introduction Public infrastructure investment involves a significant amount of tax dollars and thus requires justification of economic impact. Large transit systems that compete for federal funds in particular must demonstrate economic worthiness through rigorous feasibility assessments. In justifying capital investment, transit agencies and planning organizations need to show direct user benefits such as travel time savings, vehicle operating cost savings, as well as benefits of station area development capitalized in property values (Smith and Gihring 2020).
Station area development, together with improvements in transportation network access, can include both user and non-user benefits. User benefits are usually already captured under travel time savings. Non-user benefits include enhanced social interactions and community livelihood because of greater land use mix and thus more diverse activities, which attract residents, workers, and visitors. Moreover, walkable station areas bring about greater togetherness of ideas, enthusiasm, and money (Jacobs 1961) through in-person interactions.
Journal of Public Transportation | scholarcommons.usf.edu/jptVol. 23 No. 1 [2021] pp. 15-30
15

16 Journal of Public Transportation, Vol. 23, No. 1, 2021
Case Study of Property Value Transfer Attributed to Transit: Spatial and Temporal Hedonic Price Impact of Light Rail in Minnesota’s Twin Cities
Empirically, enhanced social interactions and transportation network access are found to increase property values near transit stations. Smith and Gihring (2020) report more than 145 studies that suggest how benefits can be leveraged to fund other transportation infrastructure. Researchers refer to such a financial mechanism as value capture, or the impact of transit on property values. With value capture, the expected incremental tax revenue of increased property values is leveraged for loans or bond issuance to fund general transportation infrastructure and other community services. So studies that provide evidence of property value increase inform how much incremental revenue may be available for future investment.
Three methods are used to assess station area development impacts on property values: hedonic pricing, contingent evaluation, and value benefit transfer. Hedonic pricing and contingent evaluation methods are well documented in transportation economics research (Smith and Gihring 2020). Hedonic pricing models relationships between property values, housing characteristics, and neighborhood amenities, whereas contingent evaluation of property characteristics is survey-based. Value benefit transfer (or simply benefit transfer or value transfer) is used for planning purposes as it requires less research effort, but it is regarded as the least scientifically rigorous.
Value transfer is the planning practice of applying results from one or more existing analyses to another—in this case, the effect of transit on property values. The approach is usually used to inform the potential impact of an action that has not taken place because the outcome has not occurred. In environmental and resource economics, benefit transfer often involves predictions of welfare estimates such as willingness to pay (Baranzini et al. 2008; Johnston et al. 2015). Here, benefit transfer is the transfer of the property price change from one project to another rather than of willingness to pay or marginal willingness to pay. In terms of transit station area development, value transfer involves applying known impacts on property prices from existing transit systems to one that is newly proposed. Assumptions about value transfer are often made in transit planning public processes when communicating with stakeholders to seek buy-in and/or funding. Examples include federal grant applications by the City of Tucson (2009), City of Cincinnati (2011), and Greater Richmond Transit Company (2014).
Applications of value transfer related to station area development can be quantitative or qualitative. Quantitative value transfer involves taking the percentage price increase of properties from one or more analyses and applying the same increase to properties within the station areas of a proposed system. Qualitative benefit transfer also assumes that benefit estimates may be applied across different jurisdictions and are often used as part of public outreach and/or when making the case for new transit during ballot referendums or bond financing processes.
Although studies have been used to help allocate infrastructure spending, no studies have tested whether existing impacts can be transferred to inform planning policy. To investigate the value transfer of transit impact on property prices, a comparative study of the two Minneapolis/Saint Paul Metro Transit Light Rail (LRT) lines was conducted. The Blue Line opened first in 2004 and the Green Line in 2014. Ridership of the Blue Line far exceeded expectations and studies have found that station area development impacts were reflected in increasing property prices in Minneapolis (Goetz et al. 2010; Ko and Cao 2013). During the planning phases for the Green Line (an extension of the Blue Line from Minneapolis to downtown Saint Paul), local planning communities speculated that similar property value impacts from the Blue Line would occur along the Green Line. This assumption helped make the case for the Green Line, as municipalities often look for hypothesized returns on investment when planning for future extensions.
The hypothesis tested in this study is whether value transfer is valid. Is applying previously estimated impacts from the Blue Line in a planning study for the Green Line as accurate as conducting an ex-post hedonic analysis for the Green Line? The results of this study suggest that the two LRT impacts are similar only because they were estimated with low statistical precision. Further testing of practical relevance revealed that precision of value transfer requires data restrictions and intimate local knowledge about the investment, and not necessarily

Journal of Public Transportation, Vol. 23, No. 1, 2021 17
Factors Influencing Fixed-Route Transit Decision-Making: Exploring Differences by Disability and Community Type
different modeling specifications. The results also suggest that value transfer, while useful for transportation grant applications and feasibility studies, is only appropriate under limited circumstances.
Related LiteratureMany empirical studies in transportation planning have examined the impact of highway, transit, and bike trails on commercial and residential properties. However, unlike the studies on consumer demand that estimate willingness to pay, property price impacts are estimated instead to inform funding opportunities or to finance value capture strategies. An exhaustive list of transit impacts on residential property values can be found in Smith and Gihring (2020); Table 1 lists only those pertaining to light rail transit (LRT). The range of LRT impact (from about 10 studies) for single-family homes is between -6.4% and 32.0%. For multifamily homes (from about 12 studies), the range is 2.8% to 45.0%. The wide range of impacts suggests that source studies for value transfer should be chosen carefully for meaningful comparisons.
TABLE 1.Summary of Hedonic Studies of LRT Systems
Case Study of Property Value Transfer Attributed to Transit: Spatial and Temporal Hedonic Price Impact of Light Rail in Minnesota’s Twin Cities
Reference Location State Data Time Period Property Type Estimated
Price ChangeDistance Measure for
Property Premium
Atkinson-Palombo 2010 Phoenix AZ 1995–2007 Residential 0.0%–16.4% Indicators of TOD zoning
Billings 2011 Charlotte NC 1994–2008 Residential 4.0%–11.3% One-mile buffer
Cervero and Duncan 2002a
San Diego County
CA 2000 Residential -4.1%–17.3%Binary variable for within one-half mile
Chen et al. 1998 Portland OR 1992–1994Single-Family
Homes10.5% Continuous, in meters
Cervero and Duncan 2002b
Los Angeles County
CA 2000 Condominiums None Half-mile dummy
Cervero and Duncan 2002c
Santa Clara County
CA 1999Multifamily
Homes45.0%
Binary variable for parcel within quarter mile of station
Dueker and Bianco 1999
Portland OR 1980–1990Multifamily
Homes2.8%–9.6%
200-foot increments up to 1,000 feet
Duncan 2010 San Diego MSA CA 1997–2001 Condominiums -11.2%–15.3%Network distance to nearest transit station, in kilometers
Garrett 2004 St. Louis County MS 1998–2001 Residential 32.0% Within one mile
Goetz et. al. 2010Minneapolis, Hennepin County
MN 1997–2007 Residential 3.8%–9.7% Continuous, in miles
Hess and Almeida 2007 Buffalo NY 1985–2003 Residential 2%–5%Continuous half-mile walking distance, in feet
Lewis-Workman and Brod 1997
Portland OR 1995 Residential -6.4%–4.4%Continuous within one mile to station
Landis et al. 1995Sacramento, San Diego, and San Jose County
CA 1990 (Q2)Single-Family
Homes1.7%
Continuous minimum distance along local roads from each home in the dataset to the nearest rapid transit station, in meters
Mathur and Ferrell 2009
Santa Clara CA 1991–2006Single-Family
Homes19.8%
Continuous 100-foot increments up to one-half mile
Petheram et al. 2013 Salt Lake City UT 2012Multifamily
Homes4.6%–8%
0.25-mile buffers from 0–1.5 miles

18 Journal of Public Transportation, Vol. 23, No. 1, 2021
Case Study of Property Value Transfer Attributed to Transit: Spatial and Temporal Hedonic Price Impact of Light Rail in Minnesota’s Twin Cities
Some of the referenced LRT studies were used in successful grant applications prepared by the City of Tucson (2009) and City of Cincinnati (2011). The applications assumed that different transit systems can generate the same amount of station area development. The average percentage change in property values (between 3% and 8%, depending on property type) were multiplied by property values in proposed study areas to yield the needed value change estimates. For Cincinnati in particular, value impact of the assumed 8% premium on the 3,300-plus commercial properties, each valued at more than $700,000, was larger than the $156 million construction cost of the 2.4-mile streetcar.
Analytically, price impacts are usually estimated using hedonic price functions. Hedonic pricing was developed through a series of studies on consumer demand (Bartik 1987; Epple 1987; Griliches 1961; Rosen 1974) in which a pricing function entered a representative consumer utility maximization problem. More recently, it was developed for housing to assess demand and willingness to pay for housing amenities (Bajari and Kahn 2005; Bajari and Benkard 2005; Bajari and Kahn 2008). Although this study does not estimate willingness to pay, it uses a price function that allows for estimation of individual demand parameters so that demand is specified. While Bajari and authors used local-linear functions, this study specifies time and distance dependency in price by using property comparisons. This is a common practice in the real estate market, where real estate agents assess property values by examining the average values of recently sold and local/nearby properties to understand trends and market demand.
Guidelines of conducting value transfer for transportation projects are loosely defined. For estimating economic benefits as part of a regulatory impact analysis, the US Office of Management and Budget (OMB 2003) requires benefit transfer to be based on similar impacted population demographic, infrastructure type, market size, and availability of alternatives. Based on the guidance from OMB and Boyle et al. (2009), the requirements for benefit transfer of rail impacts on property values should pertain to parcel data definitions, relative locations of other competing or complementary transportation infrastructure, and real estate market trends near station areas. When these parallels are not present, benefit transfer can lead to inaccurate impact estimates and even misallocation of transportation grants.
Unlike in environmental and resource economics, the practice and application of benefit transfer has not been rigorously investigated for transport infrastructure (Boyle et al. 2010; Johnston et al. 2015). Debrezion et al. (2007) and Mohammad et al. (2013) provided meta-analyses of the impact of transit stations on property values from existing hedonic pricing studies. They used results from existing studies as the data sample for a meta-analysis regression and found that property type, transit mode, and regression specifications (of the original studies) were the most influential factors of the magnitudes of station impacts. Debrezion et al. (2007) found that rent increased 2.4% for every 0.16 miles (250 meters) closer to an LRT station and 4.2% if located within a quarter mile of a station. The findings are not necessarily mutually exclusive and can therefore be confusing to use for value transfer. Using a similar approach but with additional studies from overseas, Mohammad et al. (2013) found an LRT station value impact of 9%. The findings from these meta-analyses illustrate issues raised by Boyle et al. (2010), where the authors cited a number of empirical applications of value transfer that tested convergent validity outside of transportation economics. They cautioned readers on validity due to the data and econometric issues used in meta-analysis regressions with different model specifications, units of value, and large coefficient errors being transferred. The study echoes OMB’s guidance to use benefit transfer cautiously when estimating economic benefits.
To date, no studies have tested for value transfer of station area development and none offer insights to circumstances in which value transfer is accurate or precise. This comparative study offers an opportunity to test for value transfer of LRT station area impacts. The study follows the steps laid out by Johnston et al. (2015) in building a case for benefit transfer and forming test statistics.
Journal of Public Transportation, Vol. 23, No. 1, 2021 19
Case Study of Property Value Transfer Attributed to Transit: Spatial and Temporal Hedonic Price Impact of Light Rail in Minnesota’s Twin Cities
The Case for a Comparative StudyAccording to the Minnesota Twin Cities’ planning organization, the Metropolitan Council, nine transit extensions are planned to meet projected demand (Metropolitan Council 2014). Such an extensive plan requires potential funding issues and community impacts to be addressed. To date, no studies have addressed whether existing station area development impacts can be transferred to new alignment corridors to inform planning policy. Furthermore, none have tested the accuracy of value transfer.
The unique opportunity to conduct a comparative study is timely. The newly opened Green Line runs 11 miles between the Twin Cities, 7 miles of which is in Saint Paul. Construction of the extension began in 2010 and operation began in 2014, 10 years after the opening of the Blue Line. It is assumed that household preferences, regional socioeconomic and demographic characteristics, as well as travel patterns have not changed dramatically enough between the two openings to inhibit a comparative assessment of the real estate markets.
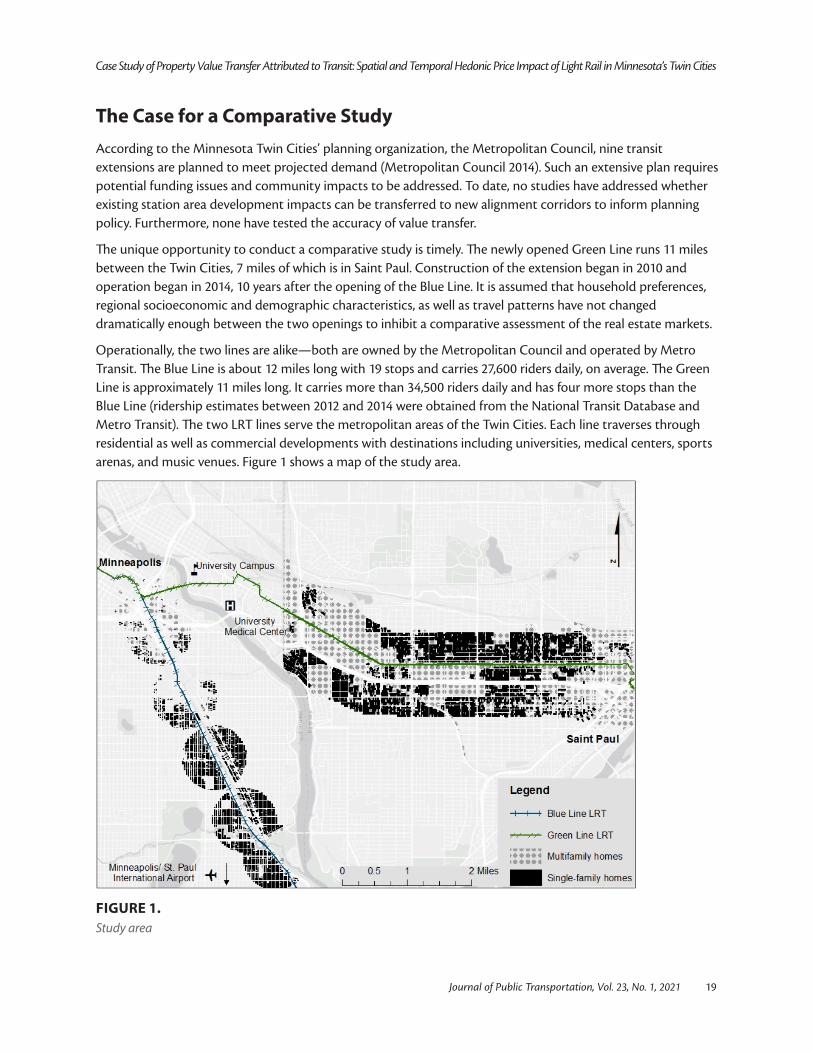
Operationally, the two lines are alike—both are owned by the Metropolitan Council and operated by Metro Transit. The Blue Line is about 12 miles long with 19 stops and carries 27,600 riders daily, on average. The Green Line is approximately 11 miles long. It carries more than 34,500 riders daily and has four more stops than the Blue Line (ridership estimates between 2012 and 2014 were obtained from the National Transit Database and Metro Transit). The two LRT lines serve the metropolitan areas of the Twin Cities. Each line traverses through residential as well as commercial developments with destinations including universities, medical centers, sports arenas, and music venues. Figure 1 shows a map of the study area.
FIGURE 1.Study area
20 Journal of Public Transportation, Vol. 23, No. 1, 2021
Case Study of Property Value Transfer Attributed to Transit: Spatial and Temporal Hedonic Price Impact of Light Rail in Minnesota’s Twin Cities
The differences between the two lines can also influence value transfer. While the Blue Line connects to the Minneapolis–Saint Paul International Airport, the Green Line runs between downtown Minneapolis and Saint Paul. South of the University of Minnesota’s Minneapolis campus, the Blue Line runs adjacent to a state route. On the other hand, the Green Line runs parallel to and north of an interstate highway from the east side of the university campus toward Saint Paul. The Green Line and the highway are about one quarter mile apart. Also, the Green Line runs on a non-separated guideway and is therefore closer to traffic than the Blue Line. Unlike the Blue Line, the Green Line stations are not supported by complementary infrastructure to transit such as park-and-ride lots. Lastly, the Green Line is about half a mile north of two national historic districts. The districts contain a number of historic landmarks and places, as well as many Victorian-style single-family homes/mansions. The Blue Line is not in close proximity to any neighborhood with notable, expensive homes.
DataThe comparative study presented in this paper was based on two separate spatial and temporal hedonic price models of residential property values. Each model included property parcel structural and location characteristics. The parcel data were provided by Hennepin County and Ramsey County. Traditionally, hedonic price analyses of transit systems are conducted within a few years of service launch. Therefore, the 2008 Hennepin County data for parcels sold 2000–2008 and the 2015 Ramsey County data for parcels sold 2009–2015 were used. Another reason for choosing the 2008 dataset was to allow for comparisons with results from Goetz et al. (2010). Many of the variables were consistently named and defined between the two datasets, except that information for the number of bathrooms in Saint Paul was provided by a separate source from the Ramsey County Assessor’s Office. Additionally, the Ramsey County data contain garage size. Each model used as many characteristics as possible, and the specifications were not necessarily confined to the need for assessing value transfer.
ArcGIS mapping software by Esri (ArcMap) was used to obtain the needed geospatial data. Using the light rail transit and roadway alignments, half-mile spatial buffers from the alignments as well as stations were created. Given that the Green Line stations are in close proximity to each other (about 0.5 miles on average), an alignment buffer was used instead of the traditional station buffers. Residential property parcels were included in the study if they fell within the buffers. The study area was also limited to avoid major points of interest such as downtown, the airport, and the university. The exceptions allowed the study’s focus to remain on transit and highway corridors. To assess accessibility impacts (such as mobility, amenity, and livability), direct distance measures (in Euclidean space) were calculated from the property center to the nearest access point (such as LRT station or on/off-ramp). Alternately, nuisance effect (congestion and noise) was assessed by each parcel’s shortest distance to LRT and highway alignment. Nuisance may also capture existing congestion and noise from existing roadways along which transit alignments are located.
ArcMap was also used to obtain the spatial information of comparable sales. Neighboring home sales are considered comparable to a property when they are sold within six months prior to the transaction date of the property in question and are within a three-quarter-mile radius. ArcMap computed the distance between every parcel that was subsequently sold to determine whether the parcels were considered comparable. As discussed in Goetz et al. (2010), comparable sales (weighted by an inverse distance matrix) can capture the effect of recent transactions of nearby properties, or the effect of spatial and temporal correlations.
Two types of residential parcels were used in the analysis: single-family and multifamily. Table 2 shows the summary statistics for Blue Line and Green Line single-family and multifamily homes. On average, single-family homes (SFH) within the station areas in Minneapolis are 6% more expensive (in 2010 values) and 5% larger (in terms of lot size) than those in Saint Paul. However, the properties are more than 20% smaller in terms

Journal of Public Transportation, Vol. 23, No. 1, 2021 21
Case Study of Property Value Transfer Attributed to Transit: Spatial and Temporal Hedonic Price Impact of Light Rail in Minnesota’s Twin Cities
of living area square footage. Also, single-family homes within the station areas in Minneapolis are almost 10% closer to the stations and 25% closer to the LRT track alignment than homes in Saint Paul. Properties within the Green Line station areas are 7% closer to LRT stations than to interstate highway on/off-ramps. Multifamily homes (MFH) in Minneapolis are more than 30% more expensive and are 8% smaller in terms of living space. Also, parcels in Minneapolis are closer to LRT than those in Saint Paul.
TABLE 2.Summary Statistics
VariableBlue Line SFH (Minneapolis) Green Line SFH (Saint Paul)
Mean Std. Dev. Mean Std. Dev.
Transaction Price (US $) $152,449 $37,775 $143,850 $112,517
Year Built 1923 17 1918 27
Lot Size (square feet) 5,549 1,315 5,281 2,522
Gross Building Area (square feet) 1,105 336 1,427 598
Bedroom (number of) 3 1 3 1
Bathroom (number of) 1 1 1 1
Garage Space (square feet) NA 340 208
Distance to CBD (meters) 6,377 1,681 4,404 1,818
Distance to LRT Station (meters) 580 167 641 305
Distance to LRT Track (meters) 425 194 563 328
Distance to Highway (meters) NA 648 323
Distance to Highway On/Off-Ramp (meters) NA 686 298
VariableBlue Line MFH (Minneapolis) Green Line MFH (Saint Paul)
Mean Std. Dev. Mean Std. Dev.
Transaction Price (US $) $181,316 $55,847 $137,728 $101,627
Year Built 1919 24 1904 18
Lot Size (square feet) 6,089 1,860 5,453 1,673
Gross Building Area (square feet) 1,942 570 2,104 615
Bedroom (number of) 4 1 4 1
Bathroom (number of) 2 1 2 1
Garage Space (square feet) NA 302 253
Distance to CBD (meters) 4,861 2,057 3,862 1,746
Distance to LRT Station (meters) 589 155 598 298
Distance to LRT Track (meters) 427 182 520 325
Distance to Highway (meters) NA 677 301
Distance to Highway On/Off-Ramp (meters) NA 712 282
NOTES 1) Prices in 2010 values using Moody’s Analytics Home Price Index for Minneapolis–Saint Paul metropolitan area. 2) The intersection of 7th Street and Hennepin Avenue in Minneapolis is used as the center of CBD for the Blue Line, while the Wells Fargo Place in Saint Paul is used for the Green Line. 3) LRT stations included in the Green Line analysis are from (west to east) Westgate to Robert Street. Stations included in the Blue Line study are from (north to south) Cedar-Riverside to 50th Street.

22 Journal of Public Transportation, Vol. 23, No. 1, 2021
Case Study of Property Value Transfer Attributed to Transit: Spatial and Temporal Hedonic Price Impact of Light Rail in Minnesota’s Twin Cities
In terms of prices, homes in Saint Paul demonstrate significantly greater fluctuations over time. Except in 2007 and 2008, prices for single-family homes in Minneapolis fluctuated within two percentage points annually. Following the economic recession, single-family homes in Saint Paul continued to drop another 19% in 2010–2011 and then increased by 16% in 2011–2012. Prices recovered as construction slowed and low interest rates spurred demand. Overall within the dataset, the average annual percentage change in price for single-family homes is about 2.4% in Minneapolis and -1.5% in Saint Paul.
For multifamily homes in Minneapolis, the annual percentage change in median price fluctuated between -9.4% and 10.3% and the average annual percentage change is about -0.8%. In Saint Paul, prices increased by more than 50% during 2010–2012 and the overall average annual price increased over 8%.
Overall, standard deviations of the Saint Paul data are greater, indicating that properties within the Green Line station areas are more heterogeneous. The transaction price for single-family homes in particular carries a standard deviation that is about 78% of its mean. The spread in the price data, as shown later in this study, plays a key role in assessing value transfer as it directly affects the size of the regression coefficients as well as their standard errors.
Estimation and ResultsHedonic price functions for estimating transit impacts are discussed in length in Smith and Gihring (2020). Similar to these studies, hedonic price functions (P) with comparable sales weighted by distance (ρWP) were used to estimate property price change with respect to proximity to transit while accounting for a number of control variables (β,X). Using the “general to simple” modeling search, Goetz et al. (2010) was followed, in which a quadratic specification with instrumental variables was used, in order to redo the analysis for the Blue Line. Since the household-specific coefficients, their corresponding standard errors, and model diagnostics are all similar to results from Goetz et al., the model for the current study was chosen based on ease of application. The spatial-lag model is P = ρWP + βX + ε
where
P = Transaction price (in 2010 values)
ρ = Spatial correlation coefficient (comparable sales)
W = Spatial weight matrix of inverse distance
β = Regression coefficient
X = Regressors (reported in Table 2)
ε = Regression error
In particular, the error term includes unobserved unit-specific housing characteristics such as view, landscape, and days on market prior to sale.
The comparative study here involves four sets of regressions, one for each type of residential parcel along each line. Median values were subtracted from prices (by year) to account for the recession and the regional trends of the housing market between 2001 and 2015. To test whether the two models generated similar station area impacts, a comparison was made between the regression coefficients on proximity to LRT stations and form test statistics using the standard errors (with covariance being zero since the coefficients were obtained from two separate and independent models). The null hypothesis was that station area impacts were the same.

Journal of Public Transportation, Vol. 23, No. 1, 2021 23
Case Study of Property Value Transfer Attributed to Transit: Spatial and Temporal Hedonic Price Impact of Light Rail in Minnesota’s Twin Cities
To test for price responsiveness to the LRT service openings, dummy variables were added to the price functions to identify parcels that were sold before/after operational starts. The variables represented one-time price responses to LRT opening. The variables were also used to interact with station proximity variables to indicate station existence. The added variables enabled the separation of timing and proximity effects in the regressions. The interaction variables indicating proximity to LRT stations before LRT opened were not included in the final models, as they were not statistically significant. Removal of the variables did not impact other coefficients or the overall fit of the models.
Several years leading up to LRT openings were tested for influencing prices. The year 2004 was used for the Blue Line, while 2012 was used instead of the actual Green Line opening of 2014. Perhaps due to the success of the Blue Line, the expected benefits of the Green Line were capitalized in property prices two years before service opening. However, the indicator variable for the Green Line opening was found to dramatically increase the standard errors of the LRT proximity variables without being statistically significant. The 2012 indicator variable was only used to interact with station area proximity variables to indicate station area plans/existence and was not a variable by itself.
Table 3 reports the regression coefficients for single-family homes, one set for each light rail transit line. Both comparable sales coefficients are statistically significant (at 5%) and they indicate that a one-dollar increase in average transaction price can have a 28-cent impact on the next neighborhood property sale. The coefficients from the two models are the same, which suggests that neighborhood transaction history is equally important in determining prices in the two study areas. Among the structural characteristics, property age is found to be the only variable that negatively impacts price. For station area development, in general, new construction is often associated with better amenities, so new properties command higher prices. However, age has lower negative price impacts in Saint Paul, as the data includes properties that are located within the historic districts and are valued higher with age.

24 Journal of Public Transportation, Vol. 23, No. 1, 2021
Case Study of Property Value Transfer Attributed to Transit: Spatial and Temporal Hedonic Price Impact of Light Rail in Minnesota’s Twin Cities
TABLE 3.Hedonic Price Regression Results
VariableBlue Line SFH (Minneapolis) Green Line SFH (Saint Paul)
Mean Std. Error Mean Std. Dev.
Constant -84,137.09** 7721.00 -238,364.20** 17548.72
Comparable Sales/Spatial Coefficient 0.28** 0.05 0.28** 0.06
Building Age (as of 2015) -296.64** 44.61 -100.26 60.35
Lot Size (square feet) 0.27 0.66 7.60** 3.36
Gross Building Area (square feet) 50.18** 4.64 88.07** 5.91
Bedroom (number of) 2,644.11** 1,143.71 Not Modeled
Bathroom (number of) 11,298.29** 1,489.65 9,186.32** 3,152.85
Garage Space (square feet) Not Modeled 35.78** 9.58
Distance to CBD (meters) 4.33** 0.55 9.12** 1.29
Distance to LRT Station (meters) -8.99** 2.72 -15.25** 6.32
Distance to LRT Track (meters) 15.12** 3.36 82.74** 8.97
LRT Opening Year Dummy 3,521.76** 1,755.77 Not Modeled
Distance to Highway (meters) Not Modeled 45.56** 17.05
Distance to Highway On/Off-Ramp (meters) Not Modeled -54.27** 16.23
ObservationsR-squaredAdjusted R-sq.F-statistic
1,778.000.470.47
155.99
1,816.000.690.69
365.70
VariableBlue Line MFH (Minneapolis) Green Line MFH (Saint Paul)
Mean Std. Error Mean Std. Dev.
Constant -184,850.60** 33059.17 -171,529.90** 41165.76
Comparable Sales/Spatial Coefficient 0.09 0.12 -0.07 0.07
Building Age (as of 2015) 21.16 201.29 -127.17 230.74
Lot Size (square feet) 1.37 2.07 4.24 3.06
Gross Building Area (square feet) 21.43** 7.52 40.45** 10.86
Bedroom (number of) 11,119.02** 2,887.17 8,316.81** 3,740.38
Bathroom (number of) 12,563.90* 7,406.86 4,506.72 7,362.83
Garage Space (square feet) Not Modeled 21.15 18.24
Distance to CBD (meters) 9.03** 2.13 10.42** 2.32
Distance to LRT Station (meters) -8.11 13.49 -28.75** 10.52
Distance to LRT Track (meters) 40.49** 17.09 93.40** 15.28
LRT Opening Year Dummy 5,853.00 7,680.46 Not Modeled
Distance to Highway (meters) Not Modeled -58.66 41.03
Distance to Highway On/Off-Ramp (meters) Not Modeled 17.82 47.22
ObservationsR-squaredAdjusted R-sq.F-statistic
277.000.300.27
11.19
370.000.350.33
15.84
NOTE: The dependent variable is transaction price minus median value of the year during which a parcel is sold. *Statistical significance at 10%; **Statistical significance at 5%.

Journal of Public Transportation, Vol. 23, No. 1, 2021 25
Case Study of Property Value Transfer Attributed to Transit: Spatial and Temporal Hedonic Price Impact of Light Rail in Minnesota’s Twin Cities
In terms of property size, almost all the structurally related regression coefficients carry expected numerical signs, which implies that larger properties can fetch higher prices. Lot size itself is relatively less valuable unless it is associated with specific amenities. For example, for properties near the Green Line, an additional bathroom can drive prices up by more than $9,000, while it takes about 100 square feet of extra living space to produce the same premium. Also, an extra foot of garage space in the Green Line study area is valued about five times more than lot size. Since specific amenities of a parcel can add to the explanatory power of the hedonic price models, additional information, such as kitchen size, can be very useful as it can further differentiate multifamily parcels. The coefficient for the number of bedrooms in properties within the Green Line station areas carries a negative sign. As the exclusion does not affect the overall model fit, it is removed from the regression. The coefficient in the Blue Line model is statistically significant and carries the expected sign, but it commands four times less than an additional bathroom.
With respect to location, single-family homes on average gain in value as the distance from downtown increases. Additionally, the opening of LRT stations has added value to properties within the station areas. In terms of the Blue Line opening, properties were sold at $3,500 higher since 2004. After LRT services commence, properties tend to increase in value as distance toward stations shortens. Using sample average distance to the LRT station and average parcel transaction price, the average LRT impact on single-family properties is 5.7%. The LRT alignments themselves, while located on major roadways with heavy industrial and commercial activities, are found to have a negative impact on property prices regardless of the timing of LRT openings. Therefore, the coefficients of distance to LRT track variables were not estimated with an LRT opening interaction variable.
Similar to the Blue Line model, the Green Line station areas contribute to a proximity value impact on single-family properties. In terms of overall impact, the effect is about 6.8%. The estimate is 18% greater than the Blue Line, which may be due to the success of the Blue Line, or the fact that the Green Line connects the two cities and therefore offers a wider network accessibility impact. As for proximity to the alignment, the effect is found to be nuisance (as it carries a positive sign) and it is over five times that of the Blue Line. Since the study includes data only up to 2015, perhaps the community is still adjusting to the new alignment that brings about additional congestion and noise.
Lastly, access to the highway in Saint Paul is found to have positive impacts on property prices and it is at least four times more influential than the impact of LRT station access. The results point to the relative importance of transportation access. For single-family homes, proximity to the highway is valued significantly higher than proximity to transit. Additionally, the congestion and noise of the highway is estimated to be less costly than that of light rail transit.
Table 3 also reports the regression coefficients for multifamily homes. Overall, the fit of the models is poor (F-statistics and adjusted R-square) with fewer statistically significant variables. The results are consistent with the findings from Goetz et al. (2010), where the lack of model fit may be a consequence of heterogeneity in structural types. It is likely that if the sample size is sufficiently large, separating apartments from other homes may improve the model fit.
In terms of location, properties gain value as distance from downtown as well as LRT alignments increases. As in the case for single-family homes, the LRT opening indicator was removed from the model when there was a lack of explanatory power and potential multicollinearity. Again, the opening of LRT does not add a fixed premium on properties in Saint Paul. However, per meter access to LRT stations is found to increase property values within the Green Line station areas and represents a 12.5% value impact. The results show that incremental access to transit increases property values, while access to the highway does not.

26 Journal of Public Transportation, Vol. 23, No. 1, 2021
Case Study of Property Value Transfer Attributed to Transit: Spatial and Temporal Hedonic Price Impact of Light Rail in Minnesota’s Twin Cities
Precision of Value TransferThe test hypothesis was based on the station proximity and LRT opening from hedonic price models: price impact from the Blue Line model was not different from the Green Line model. The test of value transfer for single-family homes is whether the 5.7% from the Blue Line model can be used for the Green Line. With a t-statistic of 1.77 (p-value of 0.08), the null hypothesis that the impacts are equal cannot be rejected. However, the confidence intervals suggest that the test conclusion of not rejecting value transfer may have happened by chance. The standard error from the station proximity coefficient of the Green Line model is so large that the confidence interval is wide enough to completely overlap the interval from the Blue Line. Figure 2 depicts the 95% confidence intervals of the value impacts.
Since property values for the Green Line model exhibit relatively high standard deviations, observations with a transaction price over $750,000 from the Green Line model (especially those within the historic district) are removed. The alternative model yields an estimate of -$10.71 per meter away from the station, a standard error of 5.13, and a percentage impact of 4.8%. The test statistic suggests that the null hypothesis cannot be rejected (t-statistic is 1.34 and p-value is 0.18). The Green Line confidence interval (not depicted) has narrowed, but it is still wide enough to completely overlap the Blue Line’s. The exercise shows that value transfer can be improved upon when the practitioner understands how price heterogeneity can distort the results of value transfer. Additionally, when applying value transfer, the practitioner should not consider irrelevant data, such as expensive properties that are unlikely to capitalize on transit impact.
Next, the study tested for accuracy of value transfer by changing the specifications of the hedonic price models. While modeling spatial correlation has become the norm, some older studies do not apply spatial regression techniques. Yet in this study, how value transfer works without the comparable sales variable in the Blue Line (relatively older alignment) model was tested. When the variable was removed from the analysis, a station area impact of 6.9% was found. Compared to the original Green Line station area impact, the t-statistic is 1.88, with a p-value of 0.06. Despite the impacts being almost the same, the confidence intervals (depicted in Figure 3) provide weak evidence of a precise value transfer.
FIGURE 2.Confidence interval of property value impacts
FIGURE 3.Confidence interval of property value impacts – data restriction (comparable sales)

Journal of Public Transportation, Vol. 23, No. 1, 2021 27
Case Study of Property Value Transfer Attributed to Transit: Spatial and Temporal Hedonic Price Impact of Light Rail in Minnesota’s Twin Cities
Another variation in model specification is the inclusion of highway access. Sometimes hedonic price studies of transit impacts do not account for access to the highway. Removing the highway proximity variables in the Green Line analysis yields a station area impact estimate of 6.1%. The corresponding t-statistic is 1.55 and the p-value is 0.12. As before, the standard error from the proximity coefficient of the Green Line model is so large that the confidence interval is wide enough to completely overlap the interval from the Blue Line. The confidence intervals (not depicted) do not provide strong evidence for the precision of value transfer.
Lastly, model specifications differ depending on data availability. For example, the Hennepin County data do not have sufficient information on the garage size of each parcel. As this variable is not often used in hedonic pricing studies (due also to data limitation), the variable was not included in the Blue Line models. Removing the garage size variable in the Green Line model yields a station area impact of 6.30% (t-statistic becomes 1.60 and p-value is 0.11), which is weak evidence against value transfer. But the wide range of the confidence interval (not depicted) does not indicate precision.
The coefficient from the Blue Line MFH model is not statistically significant. It is uncertain whether proximity to stations has a positive, negative, or zero impact on property prices. With value transfer, a 5.8% station area impact from the Blue Line would be used, as compared to the 12.5% found from the Green Line model. The results suggest that value transfer from a model with poor fit and/or a coefficient with large standard error should not be conducted, as estimates are imprecise.
Concluding RemarksA comparative study using spatial and temporal hedonic price models was conducted to address whether station area impact on residential property prices could have been expected from the Green Line LRT extension. The findings indicate that the success of the Blue Line LRT may have spurred a quicker and larger price response to the extension line. Also, the greater impact found in the Green Line model suggests a wider network effect of the LRT extension. When more data are available for Saint Paul, another study can test whether the hype or a greater network effect has in fact generated relatively greater price impact.
The hedonic pricing model results suggest a strong spatial dependence in SFH values. The models also confirm that larger properties command higher premiums. In terms of location characteristics along the Green Line, access to LRT stations and the highway brings about a positive price impact. However, the light rail transit alternative to automobiles seems to be less valuable. For multifamily homes, access to stations has a positive impact while access to the highway does not. The results suggest that stronger automobile dependency from households exists only for single-family homes.
In assessing value transfer, the comparative study of single-family homes indicates that station area impacts differ by 18%. However, the lack of precision of the Green Line coefficient prevents any firm conclusion on validity. When price heterogeneity in the Saint Paul data is removed to reduce regression coefficient standard errors, the estimates are numerically less different and less imprecise. The transfer was further tested with different practical modeling scenarios. The tests with different modeling specifications suggest that precision is not necessarily about data availability or choice of model variables. Additionally, the regression results from multifamily homes show that value transfer should not be performed from models with imprecise estimates.
Overall, if the practitioner of value transfer has intimate local knowledge of the investment, then the precision of the exercise can improve. Such knowledge can guide the practitioner of value transfer to appropriately capture the impacted parcels and transfer the benefits, which can lead to better applications for federal transit investment and provide communities a more accurate knowledge of the benefits in advance of new transit.
28 Journal of Public Transportation, Vol. 23, No. 1, 2021
Case Study of Property Value Transfer Attributed to Transit: Spatial and Temporal Hedonic Price Impact of Light Rail in Minnesota’s Twin Cities
ReferencesAtkinson-Palombo, C. 2010. “Comparing the Capitalisation Benefits of Light-rail Transit and Overlay Zoning
for Single-family Houses and Condos by Neighbourhood Type in Metropolitan Phoenix, Arizona.” Urban Studies 47 (11): 2409–26. doi:10.1177/0042098009357963.
Bajari, P., and C. L. Benkard. 2005. “Demand Estimation with Heterogeneous Consumers and Unobserved Product Characteristics: A Hedonic Approach.” Journal of Political Economy 113 (6): 1239–76. doi:10.1086/498586.
Bajari, P., and M. E. Kahn. 2005. “Estimating Housing Demand with an Application to Explaining Racial Segregation in Cities.” Journal of Business and Economic Statistics 23: 20–33. doi:10.1198/073500104000000334.
Bajari, P., and M. E. Kahn. 2008. “Estimating Hedonic Models of Consumer Demand with an Application to Urban Sprawl.” In Hedonic Methods in Housing Markets: Pricing Environmental Amenities and Segregation, edited by A. Baranzini, J. Ramirez, C. Schaerer, and P. Thalmann, 129–155. New York: Springer Science + Business Media, LLC.
Baranzini, A., J. Ramirez, C. Schaerer, and P. Thalmann, eds. 2008. Hedonic Methods in Housing Markets: Pricing Environmental Amenities and Segregation. New York: Springer Science + Business Media, LLC.
Bartik, T. J. 1987. “The Estimation of Demand Parameters in Hedonic Price Models.” Journal of Political Economy 95 (1): 81–88. doi:10.1086/261442.
Billings, S. B. 2011. “Estimating the Value of a New Transit Option.” Regional Science and Urban Economics 41 (6): 525–36. doi:10.1016/j.regsciurbeco.2011.03.013.
Boyle, K. J., N. V. Kuminoff, C. F. Parmeter, and J. C. Pope. 2009. “Necessary Conditions for Valid Benefit Transfers.” American Journal of Agricultural Economics 91 (5): 1328–34. doi:10.1111/j.1467-8276.2009.01343.x.
Boyle, K. J., N. V. Kuminoff, C. F. Parmeter, and J. C. Pope. 2010. “The Benefit-Transfer Challenges.” Annual Review of Resource Economics 2: 161–82. doi:10.1146/annurev.resource.012809.103933.
Cervero, R., and M. Duncan. 2002a. “Benefits of Proximity to Rail on Housing Markets: Experiences in Santa Clara County.” Journal of Public Transportation 5 (1): 1–18. doi:10.5038/2375-0901.5.1.1
Cervero, R., and M. Duncan. 2002b. Land Value Impacts of Rail Transit Services in Los Angeles County. Report prepared for National Association of Realtors Urban Land Institute.
Cervero, R., and M. Duncan. 2002c. Land Value Impacts of Rail Transit Services in San Diego County. Report prepared for National Association of Realtors Urban Land Institute.
Chen, H., A. Rufolo, and K. J. Dueker. 1998. “Measuring the Impact of Light Rail Systems on Single-Family Home Values: A Hedonic Approach with Geographic Information System Application.” Transportation Research Record: Journal of the Transportation Research Board 1617 (1): 38–43. doi:10.3141/1617-05.
City of Cincinnati. 2011. Cincinnati Streetcar Project: Tiger III Discretionary Grant Program Economic Analysis Supplementary Documentation. https://www.cincinnati-oh.gov/streetcar/linkservid/0787DB63-01AB-ADC2-0C8995847669EF2B/showMeta/0/. Accessed April 11, 2016.
City of Tucson. 2009. Tucson Modern Streetcar Project TIGER Application. http://www.sunlinkstreetcar.com/documents/tiger-application_web.pdf. Accessed April 11, 2016.

Journal of Public Transportation, Vol. 23, No. 1, 2021 29
Case Study of Property Value Transfer Attributed to Transit: Spatial and Temporal Hedonic Price Impact of Light Rail in Minnesota’s Twin Cities
Debrezion G., E. Pels, and P. Rietveld. 2007. “The Impact of Railway Stations on Residential and Commercial Property Value: A Meta-Analysis.” The Journal of Real Estate Finance and Economics 35 (2): 161–80. doi:10.1007/s11146-007-9032-z.
Dueker, K. J., and M. J. Bianco. 1999. “Light-Rail-Transit Impacts in Portland: The First Ten Years.” Transportation Research Record: Journal of the Transportation Research Board 1685 (1): 171–80. doi:10.3141/1685-22.
Duncan, M. 2010. “The Impact of Transit-Oriented Development on Housing Prices in San Diego, CA. Urban Studies 48 (1): 101–27. doi:10.1177/0042098009359958.
Epple, D. 1987. “Hedonic Prices and Implicit Markets: Estimating Demand and Supply Functions for Differentiated Products.” Journal of Political Economy 95 (1): 59–80. doi:10.1086/261441.
Garrett, T. A. 2004. “Light Rail Transit in America: Policy Issues and Prospects for Economic Development.” Unpublished Manuscript, Federal Reserve Bank of St. Louis, Research Department.
Goetz, E., K. Ko, A. Hagar, H. Ton, and J. Matson. 2009. The Hiawatha Line: Impacts on Land Use and Residential Housing Value. Center for Transportation Studies, University of Minnesota.
Greater Richmond Transit Company. 2014. FY 2014 TIGER Grant Benefit-Cost Analysis for Broad Street Bus Rapid Transit (BRT). Appendix_B_Broad_Street_BRT_BCA_042414.pdf. Accessed January 9, 2017.
Griliches, Z. 1961. “Hedonic Price Indexes for Automobiles: An Econometric Analysis of Quality Change.” In The Price Statistics of the Federal Government, 173–96. New York: National Bureau of Economic Research, Inc.
Hess, D. B., and T. M. Almeida. 2007. “Impact of Proximity to Light Rail Rapid Transit on Station-area Property Values in Buffalo, New York. Urban Studies 44 (5-6): 1041–68. doi:10.1080/00420980701256005.
Jacobs, J. 1961. The Death and Life of Great American Cities. New York: Random House.
Johnston, R. J., J. Rolfe, R. S. Rosenberger, and R. Brouwer, eds. 2015. Benefit Transfer of Environmental and Resource Values: A Guide for Researchers and Practitioners. New York: Springer. doi:10.1007/978-94-017-9930-0.
Ko, K., and X. Cao. 2013. “The Impact of Hiawatha Light Rail on Commercial and Industrial Property Values in Minneapolis.” Journal of Public Transportation 16 (1): 47–66. doi:10.5038/2375-0901.16.1.3.
Landis, J., S. Guhathakurta, and M. Zhang. 1995. Capitalization of Transit Investments into Single-Family Home Prices: A Comparative Analysis of Five California Rail Transit Systems. University of California Transportation Center, University of California Berkeley.
Lewis-Workman, S., and D. Brod. 1997. “Measuring the Neighborhood Benefits of Rail Transit Accessibility.” Transportation Research Record: Journal of the Transportation Research Board 1576 (1): 147–53. doi:10.3141/1576-19.
Mathur, S., and C. Ferrell. 2009. Effect of Suburban Transit-Oriented Developments on Residential Property Values. MTI Report 08-07. Mineta Transportation Institute, San José State University.
Metropolitan Council. 2014. Draft 2015–2018 Transportation Improvement Program for the Twin Cities Metropolitan Area.
Mohammad, S. I., D. J. Graham, P. C. Melo, and R. J. Anderson. 2013. “A Meta-analysis of the Impact of Rail Projects on Land and Property Values.” Transportation Research Part A: Policy and Practice 50: 158–70.

30 Journal of Public Transportation, Vol. 23, No. 1, 2021
Case Study of Property Value Transfer Attributed to Transit: Spatial and Temporal Hedonic Price Impact of Light Rail in Minnesota’s Twin Cities
OMB (US Office of Management and Budget). 2003. Circular A-4: Regulatory Analysis. https://obamawhitehouse.archives.gov/omb/circulars_a004_a-4/.
Petheram, S. J., A. C. Nelson, M. Miller, and R. Ewing. 2013. “Use of the Real Estate Market to Establish Light Rail Station Catchment Areas: Case Study of Attached Residential Property Values in Salt Lake County, Utah, by Light Rail Station Distance.” Transportation Research Record: Journal of the Transportation Research Board 2357 (1): 95–99. doi:10.3141/2357-11.
Rosen, S. 1974. “Hedonic Prices and Implicit Markets: Product Differentiation in Pure Competition.” Journal of Political Economy 82 (1): 34–55.
Smith, J. J., and T. A. Gihring. 2020. “Financing Transit Systems Through Value Capture: An Annotated Bibliography.” Victoria Transport Policy Institute. Update to 2006 paper published in American Journal of Economics and Sociology 65 (3): 751.
About the AuthorKate Ko, PhD ([email protected]), is a professional associate at HDR. She is experienced in transit asset management planning, risk management, and decision-support analytics. Her primary research interests are in spatial econometrics and value capture. She is a recognized researcher and an advocate for equitable communities as she is an appointed member of the Transportation Research Board Revenue and Finance Committee and a board member of the Washington, DC, chapter of the Conference of Minority Transportation Officials.