case study of balanagar police station - mcrhrdi study of balanagar police station.pdf · about our...
TRANSCRIPT

Case Study
of
Balanagar Police Station

About our Police Station
Balanagar Police Station
at HAL, Narsapur ‘X’ Road
Balanagar
http://balanagarpoicedivision.org

CASE STUDY
PRESENTATION
OF
SURAKSHA
BALANAGAR POLICE STATION
CYBERABAD

Project Name :
REDUCTION OF PROPERTY CRIMES IN
BALANAGAR POLICE STATION JURISDICTION
Circle Name : SURAKSHA

Mr. J.Ramesh Kumar - Leader
Mr. N. Subhan Goud - Member
Mr. M.L.Prasad - Member
Mr. J. Tirupathi - Member
Mr. T. Chandrakanth - Member
Mr. S. Damodar - Facilitator &
Co-ordinator

DURATION OF MEETING: 1 HOUR
(2:00PM - 3:00PM)
MEETING SCHEDULE : Every Wednesday

The Team had a brain storming session and listed out all the
Problems in the Balanagar Police Station jurisdiction
BRAIN STORMING

Crimes in year 2004
Description No. of Cases
% of crime
Property Offence 96 38
Bodily Offence 55 22
Non Cognizable Offence 50 20
Crime against Women 28 11
Other IPC Cases 25 10
Total 254 100
‘A’ category

Pareto Analysis of all the
‘A’ category crimes
2528
5055
96
100
90
5979
38
0102030405060708090
100110120
PROPERTY
OFFENCE
BODILY
OFFENCE
NON
COGNIZABLE
OFFENCE
CRIME
AGAINST
WOMEN
OTHER IPC
OFFENCE
Offences
No
.of
cases
0
10
20
30
40
50
60
70
80
90
100
CU
MU
LA
TIV
E %
AG
E

CURRENT STATUS : 19 Cases registered
TARGET : Reduction by 50%
PROBLEM DEFINITION
Reduction of Property Crimes in Beat No 5
under Balanagar police station limits. PROBLEM :
Beat is group of 4-5 Colonies & there are 7 Beats in
Balanagar Police Station Limits

CAUSE & EFFECT DIAGRAM

Sl. No CAUSES IDENTIFIED
1 Un-Known persons committing offences
2 Unemployment & Poverty in the area
3 Negligence of owners
4 Loop hole in the beat system
5 Lack of involvement by lower cadre officers
6 Surveillance against the Property Offence criminals

DESCRIPTION Jan Feb March Total
Dacoity 0 0 0 0
Robbery 0 0 0 0
House Burglary by Day 0 0 0 0
House Burglary by Night 0 2 1 3
Ordinary Thefts 2 0 0 2
TOTAL 2 2 1 5
Trends in Property Offence in Beat No. 5-IN 2005

1. Community sensitization through community contact
programs
2. Introducing electronic beat system
3. Constabulary empowerment
4. Community involvement, defence squads
5. Developing Criminal intelligence system
Probable solutions

COMMUNITY SENSITIZATION PROGRAMME
Community meetings were conducted with colonies
people and small industries owners
Sensitized them about the property offences, offenders,
mode of offence.
Explained about the precautions to be taken while leaving
outside
Pamphlets were distributed in the beat area
Collected suggestions from the community by giving
suggestion, partnership form.

Community Contact

Suggestions and Feedback from Community

Reorganizing Beat System
BEAT-5

ELECTRONIC BEAT SYSTEM
Introducing Electronic Beat system (EBS)
The Beat Officer points his electronic gadget at PS before
leaving for beat and the same is again done at the Beat area
identified (Total 20 – 25 Points) covering the entire beat zone.
The Electronic beat system is reviewed at PS about the
movements in the beat area by Beat officer.

At Police Station before leaving for Beat

At Check Point in the Beat area

IN HOUSE TRAINING
Conducting In House Training Programme for
up gradation of knowledge & skills about
Property Offences.
Property offenders
Mode of offence
Procedure and legal aspect

Training at classroom

Community motivation to involve in Beat system.

Identified youth in the colony were formed into defence squads
& our beat officers moved along with them in the beat area.
BEAT OFFICERS WITH DEFENCE SQUAD

STEP -10
Trial Implementation & Check Performance

2 2
1
0
1
2
3
4
5
Jan Feb March0 0 0
0
1
2
3
4
5
Apr May June
Before After

LOSS AND RECOVERY OF PROPERTY IN
PROPERTY CRIMES
BALANAGAR POLICE STATION LIMITS
DESCRIPTION
Correspondi
ng period of
previous
year
(Upto Sept)
PROPERTY LOSS Rs.25,76,911 Rs.9,93,833
PROPERTY
RECOVERED Rs. 14,32,832 Rs.6,20,950
RECOVERY % 56% 61.23%

This presentation was done in Chapter convention of Quality Circles CCQC in presence of Hon. Minister,
Smt. Dr. Geeta Reddy


QUALITY CIRCLE
LILLY
FROM
TALUK HEAD QUARTERS HOSPITAL, MANNARKKAD
WELCOMES YOU ALL

OUR CASE STUDY
PERTAINS TO
“HIGH INCIDENCE OF
CROSS INFECTION IN
WARDS”

ABOUT OUR HOSPITAL
IT IS A FIFTY YEARS OLD REFFERAL
HOSPITAL.
It is headed with a
MEDICAL SUPDT. Mrs. ROSE THOMAS,
NURSING SUPDT. Mrs. K.SIVAPRABHA,
4 HEAD NURSES AND
14 STAFF NURSES.

ABOUT OUR ACTIVITIES
The modernizing government programme
(MGP) started in our hospital in June-2005.
The Quality Circle Forum of India,
Secunderabad initiated training and
education about the Work Place
Management (5’S) and KAIZEN.

About our activities
Five-S taught us how with a systematic approach we can
bring improvement in cleanliness and orderliness.
In this aspect ‘Kaizen’ activities are helping us. Through
small continuous improvement we are not only solving
many of the nagging problems but also it helped us to
create more interest in our work and increased our
confidence about our ability.
The approach they adapted was experiential learning i.e.
while we were taught what is Quality Circle, we also solved
one of our problems along with that.

QUALITY CIRCLE PROFILE
QUALITY CIRCLE NAME : LILLY
OUR COORDINATOR :
OUR FACILITATOR :
LEADER : Ms. ELIZABATH (Head Nurse)
Dy.LEADEER : Ms. P.C.ALICE (Head Nurse)
MEMBERS : Ms. A.NIRMALA DEVI (Staff Nurse)
Ms. C.SATYABHAMA (s/n)
Ms. M.P.RAJYA LAKSHMI (s/n)
Ms. C.M.ANANDVALLY (s/n)
Ms. M.VIJAYALAKSHMI (s/n)
CIRCLE FORMATION : AUGUST-2005.
MEETING DAY & TIME : EVERY THURSDAY, 12.30 to 1.00 pm.

QUALITY CIRCLE ACTIVITIES
Quality Circle Forum provided training on simple techniques
such as Brainstorming, Data Collection & Cause & Effect
Diagram.
As a next step we were taught to categorize those problems
in to ‘A’, ‘B’ and ‘C’ categories.
The Problems are categorized as
A. Problem solved by team themselves
B. Taking help from other department
C. Problem solved with the help of management.

QUALITY CIRCLE ACTIVITIES
CATEGORY- A PROBLEMS :
1. No buckets are available for waste collection.
2. No disposal covers for waste collection.
3. No sufficient screens in all wards.
4. Insufficient urinals and insufficient bed pans in all wards.
5. Drinking water is not available for the patients.
6. No net cover for the windows.
7. Water tank is not covered.
8. Medicine wastage due to expiry.
9. Wastage of costly medicines.
10. Relatives staying with admitted patients.

QUALITY CIRCLE ACTIVITIES
CATEGORY- B PROBLEMS :
1. No proper specified place for OP patients to wait.
2. No isolation facility in the hospital.
3. High incidence of cross infection.
4. No proper drainage in the hospital compound.
5. Emergency lights and exhaust fans in labour ward is not
functioning.
6. No sufficient oxygen flow meter.
7. No key board in the hospital.
8. Suction apparatus is not in working condition.
9. No canteen facility.

QUALITY CIRCLE ACTIVITIES ‘C’ Category Problems
1. Inadequate IV stand
2. Insufficient backrest inwards
3. No injection trolley in the wards
4. No intercom phone facility
5. No record library
6. No space for keeping condemned articles.
7. No incinerator for waste disposal.
8. No comfort station.
9. Labour ward is not convenient.
10. No minor theater.
11. No dining hall for patients in the wards.
12. No Boyles apparatus.
13. No sufficient bedside lockers.
14. No public waste bins.

QUALITY CIRCLE ACTIVITIES
‘C’ Category problems (contd.)
15. No computer.
16. No isolation wards.
17. Injection OP is not convenient.
18. No connection between casualty and wards.
19. No slope in front of the ward to enter trolley and wheel chairs.
20. No annual maintenance of electrical equipments. No freezer in mortuary.
22. Old buildings are to be demolished as they are not useful.
23. Compound wall height is not sufficient.
24. No security staff in the day time.
25. Lack of computer training for the staff nurse and attendants.
26. No conference hall.
27. No parking facility for the hospital staff vehicles.
28. Road in between wards are damaged.
29. No sick room for staff.
30. No room for security staff in the night.

QUALITY CIRCLE ACTIVITIES
The Problem of “High incidence of cross infection in wards”
is taken as Case Study for presentation.
Objective:
• To reduce the chance of High Cross Infection :
Definition of the problem
• One patient coming to the hospital for treatment with one
disease is getting one or more diseases during the stay in
the hospital for treatment.

CAUSE & EFFECT DIAGRAM :
High incidence of
cross infection
Method (system)
Material Nurse
Inadequate staff
Congested wards
Toilets
Inadequate cleaning time
Inadequate training for
non nursing staff
Bad habits of patients
No protective appliances
Not enough disinfection
No counselling
on hygiene
Inadequate number
of sheets
Inadequate number of
bedpans and urinals
Inadequate
medicines
Delay in delivery of sheets
Improper sterilization
Improper
waste disposal
Patients close to each other
No isolation wards
Resource limitation
No disinfection
Inadequate bathroom
No proper drainage system

Month Ward
Total No.
of patient
admitted
Fever Add AsthmaEnteric
FeverMLC/RTA HTN OM Others Remarks
August'05Children's
ward 41 29 11 -- -- 1-1 9 23%
September 45 30 15 -- -- -- 8 18%
October 54 32 19 -- -- /3 -- -- -- 5 10%
August
Female
ward 86 30 14 20 -- 8-4 8 2 -- 12 7%
Septermber 90 17 6 27 2 16/3 3 4 12 5 6%
October 107 18 27 15 3 16/4 4 3 17 4 4%
DIAGNOSIS
6 Patients got diarrhea
3 patients got fever from diarrhea 5 Patients got diarrhea
3 patients got fever from diarrhea
DATA COLLECTION

Past Data Collection :
On incidences of cross infection -
Children ward Female ward
August 7 fever patients got 8 fever patients got
diarrhea diarrhea
2 ADD patients fever 4 diarrhea patients got
fever.
September 5 fever patients got ADD 3 fever patients got ADD
3 ADD patients got fever 2 ADD patients got fever
October 3 fever patients got ADD 3 fever patients got ADD
2 ADD patients got fever 1 ADD patients got fever.

Keeping the limitations on Resources and taking practical situation with the
available facilities, following root causes are arrived at :
i) Inadequate cleaning
ii) Improper waste disposal
iii) No isolation of wards
iv) Bad habits of patients
We have developed the following solution for trial implementation
1) Isolation of patients with diarrhea in the corner of the ward nearest to the
bath room
2) Cleaning of the ward thrice as against only once in the morning as
practiced now.
3) Counselling of patients on hygiene.
4) Waste disposal collected in the buckets and properly disposed.

After implementation of some of the actions
taken based on root causes
Data Collection : On incidence of cross infection
Period Children ward
Female ward
Total ward patients Total no. of patients
admitted
admitted
1st Nov. 9th Dec. 47
86
Fever 25
30
ADD 19
10
MLC 2
Asthma 7
others 1
MLC 11
Remarks : 2 Patients fever got ADD RTA
3
High Temp 3
DM 5
others 17
Nil cases of cross infection
Remarks:

Foreseeing possible resistance : There were some
problem with house keeping staff that their work will
be increased and they will not be able to do
counselling by nurses on the important patients on
Hygiene & cross infection for good cleaning is a
must. This will be done only in two wards Female
ward & Children ward. They have accepted.
Suggestions, if any, please?

1S RE-ORGANISING SORT OUT
UNWANTED
WANTED
SEIRI
SEITON NEATNESS PEEP 2S
INSPECTION SEISO CLEANLINESS 3S
4S SEIKETSU STANDARDISATION VISUAL MGT.
5S SHITSUKE DISCIPLINE MAKING HABIT
WORK PLACE MANAGEMENT


Welcome to the 5S Journey at DLS/KZJ
SEIRI (Sorting)
SEITON (Systematic)
SEISO (Cleaning)
SEIKETSU (Standardize)
SHITSUKE (Sustain)

Introduction

Why 5S at DLS/KZJ

• Introductory meeting on 5S by M/s QCFI on 01-12-2016
5S Awareness - Training Programme

• On 15-05-2017 an open meeting was held to sensitize the employees on 5S and pledge was taken.
5S Awareness - Training Programme

5S Implementation - Steering Committee
CEO is the Chairman of the Steering Committee, he nominated Dept. heads as members
5S Implementation - Working Committee
Working committee is also nominated by CEO

5S Implementation - Formation of Zones
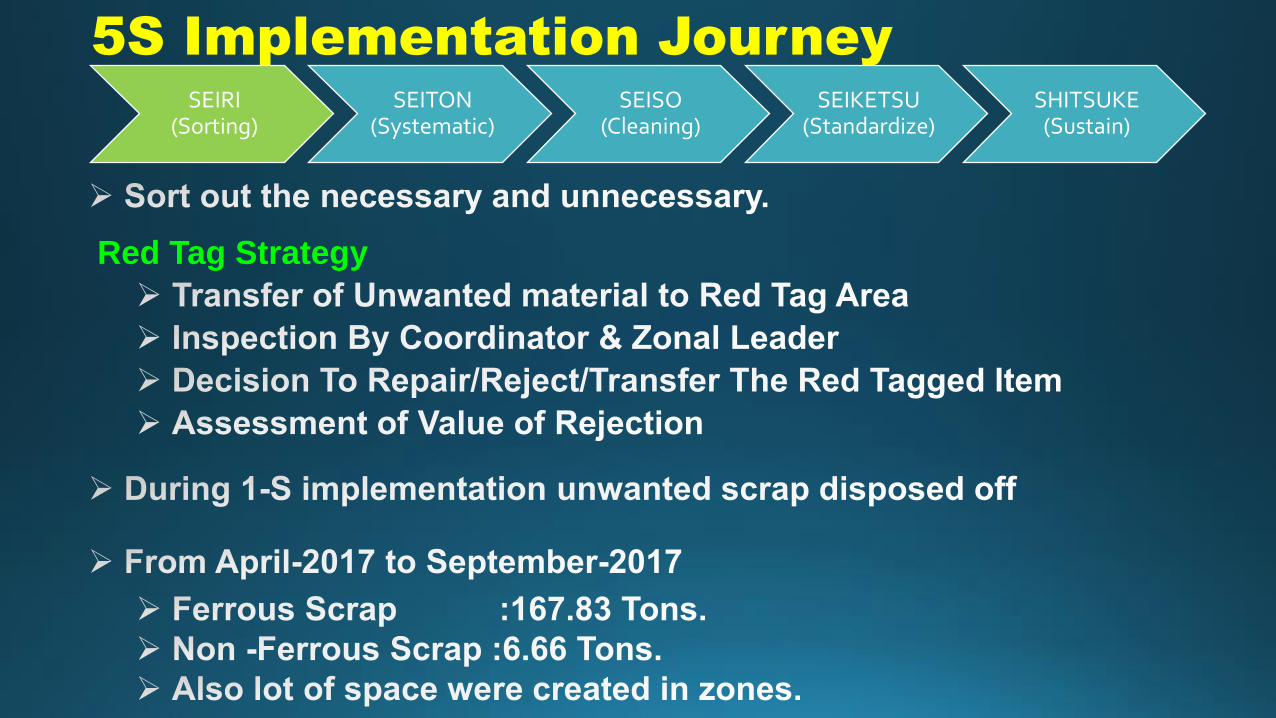
5S Implementation Journey
Red Tag Strategy
SEIRI (Sorting)
SEITON (Systematic)
SEISO (Cleaning)
SEIKETSU (Standardize)
SHITSUKE (Sustain)

SEIRI (Sorting)
SEITON (Systematic)
SEISO (Cleaning)
SEIKETSU (Standardize)
SHITSUKE (Sustain)
• Materials kept in Plastic boxes for easy accessibility
• PEEP methodology (A Place for Everything & Everything in its Place)

• Inspect the work area and equipment, with an emphasis on health and safety.
• Identify areas needing attention such oil leaks, frayed belts, excess grease, peeling paint.
• Itemize required materials such as cleaners, degreasers, paint, etc.
• Itemize work required & develop schedule
SEIRI (Sorting)
SEITON (Systematic)
SEISO (Cleaning)
SEIKETSU (Standardize)
SHITSUKE (Sustain)
Cleaning of areas

Establish SOPs & maintenance work instructions for the workplace.
Standardization of tools & workbenches.
Create schedules and checklists that define required activities and responsibilities.
Establish “visual controls” (sign-boarding).
Establish procedures for maintaining & sustaining 3rd S –Shine/Cleaning.
SEIRI (Sorting)
SEITON (Systematic)
SEISO (Cleaning)
SEIKETSU (Standardize)
SHITSUKE (Sustain)
Standardized tools in each section
Standardized Work benches

Officers, Supervisors, and staff must be committed to establishing &
maintaining the 5 Ss
Adhere to first 4 S categories.
Set practical goals and giving adequate feedback to all.
Implement a discipline for culture change to maintain the 5 S concepts
Establish & promote routine audits to sustain.
Each zone leader prepares a audit check list specific to his/her zone.
A meeting is convened with all the zone members every month to review the
progress of 5-S implementation and the minutes of the meeting are recorded.
SEIRI (Sorting)
SEITON (Systematic)
SEISO (Cleaning)
SEIKETSU (Standardize)
SHITSUKE (Sustain)

STANDARD PRACTICES
• Red Tag Area is identified for placing red tag items and monthly
review of the items in red tag area is done and disposal
procedure is followed.
• Unwanted items are segregated and disposed once in a week by
each zone.
• Parking places are designated and vehicles are parked in the area
designated only.
• Up keep of all visual aids like labels, direction boards, display
boards are maintained.
• Cleaning schedules are prepared and adhered to Status is
marked.

Benefits derived

Welcomes you all….

We are in the Market : Since 1961 Annual Turnover : 3761 Crores
About our Company
About our Unit
Located at : Jayanthipuram, Krishna Dist, AP Commissioned in the Year : 1986 Capacity : 7500 TPD No. Of Employees : 1500 (Direct & Indirect)

Definition: Reduction of plastic packets usage through canteen
Objectives
1. Protecting Environment by avoiding spillage of plastic covers & papers.
2. Supply of quality food by avoiding contamination due to plastic mixing.
3. Improving good housekeeping.
Our Goal
100% elimination of plastic bags usage inside the factory.

S. No Particulars Status
1 No. of workers & contract workers in the factory 1189
2 Total No. of workers using canteen food 147
3 Total No. of departments involved 2
4 No. of shifts in food serving 2
5 No. of food packets serving at work place 147
6 Time taking for serving of food packets 1hr
7 No. of canteen employees involved 5
8 No. of items in meals 7
9 No. of plastic covers using per meal 7
10 Plastic packet cost per meal Rs.1.40
11 Cost per month Rs.6,174/-
DATA COLLECTION

Man
Plastic packets Usage Inside
the Factory
Materials
Method System
Attitude
Instructions
Water Tins, bottles, etc.
Stores
Cement packing
Stationary purpose
Dust Bins
Un packing Spare parts
Canteen Food
For Maintenance / Breakdown
For Wagons
Sign boards
Banners
Lack of Awareness
Unpacked items
For Water Resistant
Out side food
Files and books
Barricades
Weather Conditions
Roofs Easy to throw
Easy to Handle
Mandatory items
Canteen food in Plastic bags
Single Usage
Portability
Poor Housekeeping
For Long time
usage
No proper security check
CAUSE & EFFECT DIAGRAM
(cause enumeration type)

Summary of Validation
From the above analysis, we observed that the following sub-causes
are the main causes for our problem and collected data of plastic
packets entry into factory through our entrance gate.
S No Main Causes
Total quantity of plastic packets
(10.02.2015 to 09.03.2015)
1 Food Material from home and outside 1825
2 Employee belongings 568
3 Existing practice 4116
4 Safety appliances 325
5 First Aid Box Purpose 142
Total 5206

0
10
20
30
40
50
60
70
80
90
100
0
500
1000
1500
2000
2500
3000
3500
4000
4500
5000
Existingpractice
Food Materialfrom home
and out side
EmployeeBelongings
SafetyInstruction
First Aid BoxPurpose
Qu
an
tity
Causes
81% VITAL FEW
USEFUL MANY
Pareto Chart

Summary of Validation
From the above analysis, we found that
Existing practice is the main cause for Plastic
packets usage inside the factory and causing
environment pollution and ill-health.

Summary of validation
The following are the accepted solutions made by our QC Members
Sl No
Solution Remarks
1 Sending of material Unpacking scrap to scrap yard Accepted
2 Creating awareness on pollution due to spillage of Plastic
Accepted
3 Creating awareness on health problems due to Plastic usage
Accepted
4 Supply of food in carriers Accepted
5 Quality of food is preserved Accepted
6 Complete eradication of food supply through plastic packets
Accepted

1. Discussed with Union Office Bearers for purchase of
carriers with the dividend amount of Co-operative Society
2. Checked food quality and identified a suitable place for placing the carriers and necessary steps taken to avoid misplacing.
3. Required racks were arranged for placing the carriers with the help of Civil Dept.
4. We have started supply of food in carriers
TRIAL IMPLEMENTATION AND
CHECKING PERFORMANCE

Photographs of food supply in plastic
covers (before)
Packing of food material in plastic covers
Packed food material in plastic covers
Packed food material in Papers
Packed food material for delivery

Photographs of food supply through
carriers (after)
Carriers placed for filling of food
Filling of food in carriers
Supply of food through carriers
Placing of carriers at Time Office

Standardization
We strictly Implemented and standardized this system
w.e.f. from 09.05.2015

Project Cost :
Carrier cost : Rs.255
Total employees attending in shifts : 147
Total Cost (Rs.255 X 147) : Rs.37,485/-
Monthly food packing charges
Cost of packing material per day: 7 X Rs.0.20 : Rs.1.40
No. of packets per day: 147 X Rs. 1.40 : Rs. 205.8
After introduction of “Supply of food in Carriers”
Monthly savings : Rs.6,174/-
Yearly savings : Rs. 75,117/-
Apart from the above
Less amount can be spent on Housekeeping & monkey menace.
Tangible Benefits

Reduced plastic spillage, thereby environment has protected.
Intangible Benefits
For Workmen
Improved Hygienic conditions. Self satisfaction to become a tool in maintaining
housekeeping. Improved health conditions.
Availability of Hot & Quality Food.
For Environment
For Safety
Reduced monkey menace inside the factory.

DEAR FRIENDS,
BEING A RESPONSIBLE CITIZEN, WE HAVE AVOIDED PLASTIC USAGE IN OUR FACTORY BY SUPPLYING FOOD IN CARRIERS.
FOR PROTECTING THE ENVIRONMENT AND REDUCING THE PLASTIC USAGE, KINDLY EXTEND YOUR CO-OPERATION.

Literacy Training
Quality Circle

On the occasion of World Literacy
Day, 08th September,2014 our Unit
head spoke about the importance of
literacy in the morning prayer. Also
he declared about literacy in 100
days programme.

Steps taken for conducting literacy class:
1. We have conducted a meeting with the contractors on
20.09.2014.
2. Collected data of existing Illiterate Contract workmen
with the help of Security Department.
3. In first phase, we have selected 30% i.e. 85 illiterate
contract workmen for the literacy classes.

4. We have called concerned contractors and informed
about the proposed schedule of starting of the classes.
5. We have taken permission from the school management
for conducting classes, also requested to depute at least
two teachers.
6. We have identified some capable permanent workmen as
faculty (6 Nos).
7. With the permission of the Management, we have started
classes from 01.12.2014 at 05.00 pm at our SSRV Mandir.
8. We have conducted a test to know their ability of reading
and writing in local language.

9. The percentage of attendance for literacy class is
around 87% in the first ten days.
10. We have provided basic study materials (viz. Slate,
Slate pencil, Books, pens.. etc) at free of cost to the
contract workmen from 02.12.2014.
11. After 15 days, they are being given regular home
works.
12. After 30 days of attending classes, simple class tests
are being given to check their learning abilities.

Regular Implementation:
After Trial Implementation, we got very good feedback
from the contract workmen and found they were
satisfied with the classes.
The Self-confidence and morale of Contract Workmen,
who are attending the classes has improved.
Due to overwhelming response, we are continuing the
Literacy classes to achieve the aim of 100% literacy of
contract workmen in 100 days.

Benefits of the programme:
Ability to Read & Write
Improved safety awareness
Individuality and Independent.
Self development and growth.
Self confidence.
Decision making ability.
Improved Clean habits.
Improved knowledge about working environment.